
Abstract
Background:
Diabetes remains a major public health concern in the United States, particularly in Tennessee, where prevalence rates exceed national averages. Traditional statistical approaches may not fully capture the non-linear interactions among predictors. This study applied both traditional approaches and machine learning (ML) techniques to predict and identify key contributing factors associated with self-reported diabetes using the 2023 Behavioral Risk Factor Surveillance System (BRFSS) dataset.
Methods:
A cross-sectional analysis was conducted on 5634 (weighted population 5 614 486) adults from the Tennessee BRFSS dataset. Sociodemographic, behavioral, and health-related variables were analyzed. Data processing, exploratory analysis, and modeling were performed in Python using Pandas, NumPy, Scikit-learn, and SHAP. Seven algorithms were tested: Logistic Regression, Support Vector Machine, K-Nearest Neighbors, Decision Tree, Random Forest, Gradient Boosting, and XGBoost, with stratified 5-fold cross-validation. Models were evaluated using accuracy, precision, recall, balanced accuracy, F1-score, AUROC, and PR-AUC.
Results:
The Gradient Boosting model demonstrated the best overall performance, achieving an accuracy of 82%, precision of 48%, recall of 32%, F1-score of 37%, AUROC of 0.80, and PR-AUC of 0.45. Key predictors included high blood pressure, high cholesterol, body mass index, comorbidity burden, and physical inactivity. SHAP analysis revealed that both clinical factors and social determinants substantially influenced diabetes risk.
Conclusion:
This study highlights the strong potential of machine learning, particularly Gradient Boosting, in predicting self-reported diabetes. Integrating SHAP analysis enhanced interpretability by revealing how the above factors interact to influence diabetes risk, underscoring the value of explainable AI for precision public health and targeted prevention strategies.
Keywords
Background
Diabetes mellitus (DM) is a chronic metabolic disorder characterized by persistent hyperglycemia due to inadequate insulin secretion, impaired insulin action, or both.1-4 Insulin is a crucial hormone responsible for transporting glucose from the bloodstream into cells for energy metabolism. When insulin function is disrupted, excess glucose accumulates in the blood, leading to a range of symptoms such as excessive thirst (polydipsia), frequent urination (polyuria), fatigue, unintended weight loss, and blurred vision.3,5 If left untreated or poorly managed, DM can result in severe complications, including cardiovascular disease, kidney failure, neuropathy, and vision loss, significantly reducing quality of life and life expectancy.3,6 The progression of DM is often gradual, with many individuals remaining asymptomatic during the early stages, which delays diagnosis and timely intervention. 4
According to the International Diabetes Federation (IDF), 537 million adults were living with diabetes globally in 2021, a number projected to rise to 643 million by 2030 and 783 million by 2045. 7 In the United States, over 37 million people have diabetes, with approximately 1 in 5 undiagnosed. 8 The economic impact is substantial, with an estimated annual cost of $327 billion, including $237 billion in direct medical expenses and $90 billion in lost productivity. 9 In Tennessee, the burden is particularly high: recent CDC data indicate that approximately 13.8% of adults have been diagnosed with diabetes, ranking the state among those with the highest prevalence nationwide. 8 Early detection and intervention are critical for preventing or delaying complications; however, many individuals remain undiagnosed for years due to the absence of symptoms in early stages, lack of routine screening, and barriers to care. 10
Public health surveillance systems play a vital role in tracking chronic diseases like diabetes by providing timely, population-level insights that can guide prevention and intervention strategies. Among these systems, the Behavioral Risk Factor Surveillance System (BRFSS) stands out as the world’s largest continuously conducted health survey, collecting high-quality, state-specific data on health behaviors, chronic disease prevalence, and preventive service use from a representative sample of non-institutionalized adults in all U.S. states and territories. 11 Since its inception in 1984, the BRFSS has grown into a cornerstone of chronic disease epidemiology, enabling researchers and policymakers to monitor trends over time, identify emerging health threats, and evaluate the effectiveness of public health programs. The survey’s comprehensive scope includes numerous variables relevant to diabetes prediction and prevention, such as sociodemographic factors, lifestyle behaviors, anthropometric measures, and a wide array of comorbid conditions. 11 In addition, BRFSS incorporates information on healthcare access, health-related quality of life, and preventive health behaviors like glucose and cholesterol screening. This breadth of information, combined with its large sample size and standardized methodology, makes BRFSS a uniquely valuable resource for developing robust, generalizable risk models for diabetes at both the state and national levels.
Traditional epidemiological analyses, such as logistic regression, are effective for identifying risk factors but may be limited in their ability to capture complex, non-linear relationships and high-order interactions between predictors.1,12 Machine learning (ML) approaches offer powerful alternatives by automatically identifying intricate patterns in high-dimensional datasets, potentially improving prediction accuracy and uncovering novel associations.2,13 Recent studies have successfully applied ML algorithms, including Random Forest, Support Vector Machines, Gradient Boosting, and Neural Networks, to predict diabetes using datasets such as the Pima Indians Diabetes Database, BRFSS, and clinical records, often outperforming traditional methods.2,14,15 One major criticism of ML in healthcare is the “black box” nature of many models, which can hinder trust and adoption by clinicians and policymakers. 16 Explainable artificial intelligence (XAI) techniques, such as SHapley Additive exPlanations (SHAP), address this concern by providing transparent, interpretable insights into how each feature contributes to a model’s predictions, both at the individual and population levels.17,18 Despite numerous studies using BRFSS data for diabetes surveillance, no prior research has applied machine learning with SHAP-based explainability to the 2023 Tennessee BRFSS dataset, making this the first study to combine predictive modeling and interpretability for understanding state-specific diabetes patterns.
The primary aim of this study is to develop and evaluate explainable machine learning (ML) models for the classification of self-reported diabetes among adults in Tennessee using data from the 2023 Behavioral Risk Factor Surveillance System (BRFSS). Specifically, the study seeks to (1) compare the performance of multiple ML algorithms against traditional logistic regression, (2) assess and report predictive metrics including accuracy, sensitivity, specificity, and the area under the receiver operating characteristic curve (ROC-AUC), and (3) apply SHapley Additive exPlanations (SHAP) to identify and interpret the most influential covariates associated with diabetes status. By integrating predictive performance with model interpretability, this research aims to generate actionable insights that can inform early detection, targeted prevention, and population-level strategies to reduce the burden of diabetes in Tennessee.
Methods
Study Design and Data Source
This study employed a cross-sectional design, utilizing secondary data from the 2023 Behavioral Risk Factor Surveillance System (BRFSS) specific to the state of Tennessee. The BRFSS is a nationally representative, state-based surveillance system conducted annually by the Centers for Disease Control and Prevention (CDC) 11 in collaboration with U.S. states and territories. It collects information on health-related behaviors, chronic conditions, and preventive health practices among non-institutionalized adults aged 18 years and older via telephone interviews. 11
The 2023 BRFSS dataset was selected for its recency and comprehensive coverage of variables related to diabetes, physical health, sociodemographic characteristics, and health-related behaviors. For this study, we extracted the subset of respondents residing in Tennessee and included only those with complete responses to the outcome variable, self-reported diabetes diagnosis. After applying these inclusion criteria, the final analytical sample comprised 5634 adult individuals (weighted population 5 614 486).
Study Variables
The primary outcome variable in this study was self-reported diabetes diagnosis, based on whether a respondent reported ever being told by a health professional that they had diabetes or high blood sugar. This aligns with the standard BRFSS approach for assessing diabetes prevalence, including both cases diagnosed outside of pregnancy and those diagnosed during pregnancy for female respondents. The outcome variable was recoded into a binary indicator: “Yes” for respondents reporting a diagnosis of diabetes (including pregnancy-related diabetes) and “No” for those reporting no diagnosis or prediabetes/borderline status.
A range of predictor variables was selected based on their theoretical and empirical associations with diabetes, as documented in previous literature.4,19-21 These predictors spanned across 3 broad domains: sociodemographic characteristics, health status, and health behaviors. Sociodemographic variables included sex (male, female), age group (18-24, 25-34, 35-44, 45-54, 55-64, 65+), race/ethnicity (White, Black, Other, Multiracial, Hispanic), marital status (married vs unmarried), education level (less than high school, high school graduate, some college, and college graduate), income group (<$15 000, $15 000-$25 000, $25 000-$35 000, $35 000-$50 000, $50 000-$100 000, $100 000-$200 000, and $200 000+), employment status (employed vs unemployed), and urbanicity (urban vs rural). Health status indicators included body mass index (BMI) category (underweight, normal, overweight, obese), self-reported general health (good/better vs fair/poor), number of poor physical health days (0, 1-13, 14+), number of poor mental health days (0, 1-13, 14+), comorbidity count (0, 1-2, 3+), disability count (0, 1-2, 3+), and specific chronic condition diagnoses including high blood pressure, high cholesterol, cancer, and arthritis. Health behavior variables included smoking status (every day, some days, former, never), alcohol use in the past 30 days (yes vs no), physical activity in the last 30 days (yes vs no), and current health insurance coverage (insured vs not insured). Additional predictors included veteran status (yes vs no). These variables were included to capture demographic, behavioral, and health-related risk factors that may influence the likelihood of a diabetes diagnosis (Supplemental Table S1).
Data Processing and Analysis
Data management and analysis were conducted across multiple platforms to ensure methodological rigor and reproducibility. Multiple imputation was performed in R version 4.3.2 (“Eye Holes”) using the MICE package to address missing data, which ranged from 0.01% for comorbidity count to 19% for income. The relatively low to moderate levels of missingness warranted imputation to preserve statistical power and minimize potential bias in subsequent analyses. 22 The imputed dataset was then imported into Stata/BE 19, where descriptive analyses were conducted using the svyset commands to account for the complex sampling design of the BRFSS. Weighted frequencies and percentages were computed for categorical variables, and chi-square tests were used to assess associations between self-reported diabetes diagnosis and each predictor. Crude odds ratios (CORs) with 95% confidence intervals (CIs) were estimated through bivariate logistic regression. Variables with a P-value ≤ .20 were retained via backward elimination to build the multivariable model, from which adjusted odds ratios (AORs) and 95% CIs were obtained. 23 Statistical significance was defined as P ≤ .05 (highly significant if P ≤ .001). For the machine-learning (ML) component, the final cleaned dataset was exported to Google Colab (Python 3.10), where data transformation, model building, and explainable AI analyses were performed using Pandas, NumPy, Scikit-learn, SHAP, Matplotlib, Seaborn, and SciPy.
Data Pre-processing
The raw BRFSS dataset underwent a multi-stage cleaning and transformation process to ensure analytical integrity before modeling. As all variables were categorical, normalization or standardization was unnecessary. Rare response categories were merged with related groups, and inconsistent codes were corrected to maintain uniformity. Outlier detection was performed for each variable, and infrequent or analytically insignificant categories were consolidated or excluded as appropriate. In addition, composite indicators, including comorbidity count, disability count, and BMI category, were derived to improve interpretability and capture broader health dimensions. In Python, the training data were processed using an automated preprocessing pipeline incorporating one-hot encoding for categorical variables, ensuring consistent variable treatment and compatibility across machine learning algorithms. Collectively, these steps streamlined the dataset, enhanced interpretability, and minimized analytical noise, thereby strengthening the robustness of subsequent model development.
Addressing Class Imbalance Using SMOTE
Exploratory analysis revealed a pronounced class imbalance, with considerably fewer participants reporting diabetes than those without. To prevent model bias toward the majority (non-diabetic) group, the Synthetic Minority Over-sampling Technique (SMOTE) was applied only to the training subset after the train-test split. SMOTE interpolates new synthetic minority-class observations, balancing class representation without duplicating existing cases. The test data remained untouched, ensuring an unbiased evaluation of model generalizability. Post-SMOTE, class proportions in the training set were approximately equal, enhancing model sensitivity to the minority (diabetic) class.
Feature Selection
Predictor selection followed a hybrid statistical and machine-learning approach. The process began with exploratory data analysis (EDA), using descriptive statistics and visualizations to examine variable distributions and explore potential relationships with the outcome. Bivariate analyses were then performed to assess the strength, direction, and statistical significance of associations between each predictor and diabetes status. Thereafter, screening in Stata used backward elimination (P ≤ .20) to retain potentially informative variables. 23 In Python, Cramer’s V statistic was computed to assess pairwise associations among categorical predictors and identify potential multicollinearity. Subsequently, Recursive Feature Elimination (RFE) was applied to the training data to identify the top-ranking features contributing most to model performance (Supplemental Table S3). This combination of statistical screening and algorithmic selection ensured an optimal, interpretable, and parsimonious predictor set.
Feature Importance
The relative contribution of each predictor variable to the classification models was assessed using SHapley Additive exPlanations (SHAP), a model-agnostic interpretability framework. The SHAP values quantify each predictor’s contribution to the model’s output, indicating both the direction and magnitude of its influence on diabetes classification. The analyses were conducted on the best-performing model, and the results were visualized using beeswarm, bar, and box plots. Both encoded and aggregated SHAP analyses were generated, the latter grouping one-hot-encoded categories back into their original variables, to facilitate clearer interpretation. This method provided a consistent and transparent way to interpret complex machine learning algorithms. It also informed potential directions for public health interventions by highlighting the most influential risk and protective factors.
Model Development and Optimization
Given the complex and multifactorial nature of self-reported diabetes, a diverse set of machine learning algorithms was implemented to capture varying patterns in the data. The selected models represented different learning paradigms, including linear (Logistic Regression), kernel-based (Support Vector Machine), tree-based (Decision Tree, Random Forest), distance-based (K-Nearest Neighbors), and ensemble boosting methods (XGBoost and Gradient Boosting). This facilitated a comprehensive comparison of predictive performance across multiple modeling strategies. For model optimization, default hyperparameters were initially applied, and where appropriate, tuning was conducted using grid search with 5-fold cross-validation to refine model performance (Supplemental Table S2). Each model was implemented within a consistent preprocessing framework and trained on the SMOTE-balanced training data. Logistic Regression served as the baseline model, offering a transparent linear approach to classification. Support Vector Machine was included for its ability to handle non-linear decision boundaries through kernel functions. Decision Tree and Random Forest models were used to capture hierarchical decision-making patterns, with Random Forest benefiting from ensemble averaging to improve stability and reduce overfitting. K-Nearest Neighbors classified observations based on their proximity in feature space, while boosting methods (e.g., Gradient Boosting and XGBoost) were incorporated for their iterative approach to minimizing classification errors and improving accuracy.
Model Training and Evaluation
Model performance was evaluated using a structured training and testing framework. The dataset was partitioned into training (80%) and testing (20%) sets using stratified sampling to preserve outcome distribution. The training data underwent SMOTE oversampling, while the test set remained unaltered. Model performance was assessed using accuracy, precision, recall, F1-score, Area Under the Receiver Operating Characteristic Curve (AUROC), balanced accuracy, and precision-recall AUC (PR-AUC). In addition, 5-fold stratified cross-validation was applied to the training data for robust performance estimation. The cross-validation was performed within the training data only to prevent information leakage into the test set. Confusion matrices were generated to visualize true positives (TP), false positives (FP), true negatives (TN), and false negatives (FN). An AUROC curve was plotted to visualize and compare the classification performance across all machine learning models. Performance metrics were averaged across folds to ensure stability and minimize overfitting bias. This approach ensured that the final evaluation captured not only raw accuracy but also the balance between sensitivity and specificity across all models tested.
Model Selection
The final model was selected through a systematic comparison of performance metrics across all evaluated machine learning algorithms. Accuracy was considered a primary indicator, reflecting the overall proportion of correctly classified cases. Precision measured the share of predicted positive cases that were truly positive, while recall (or sensitivity) assessed the model’s ability to correctly identify actual positive cases. The F1-score, representing the harmonic mean of precision and recall, was particularly valuable in addressing class imbalance by balancing the trade-off between these 2 measures. 24 The PR-AUC was also assessed to better evaluate model performance under class imbalance by summarizing the relationship between precision and recall. By evaluating these metrics collectively, the model that achieved the most favorable balance of accuracy, recall, precision, PR-AUC, and F1-score was identified and selected as the optimal algorithm for predicting self-reported diabetes (Figure 1).
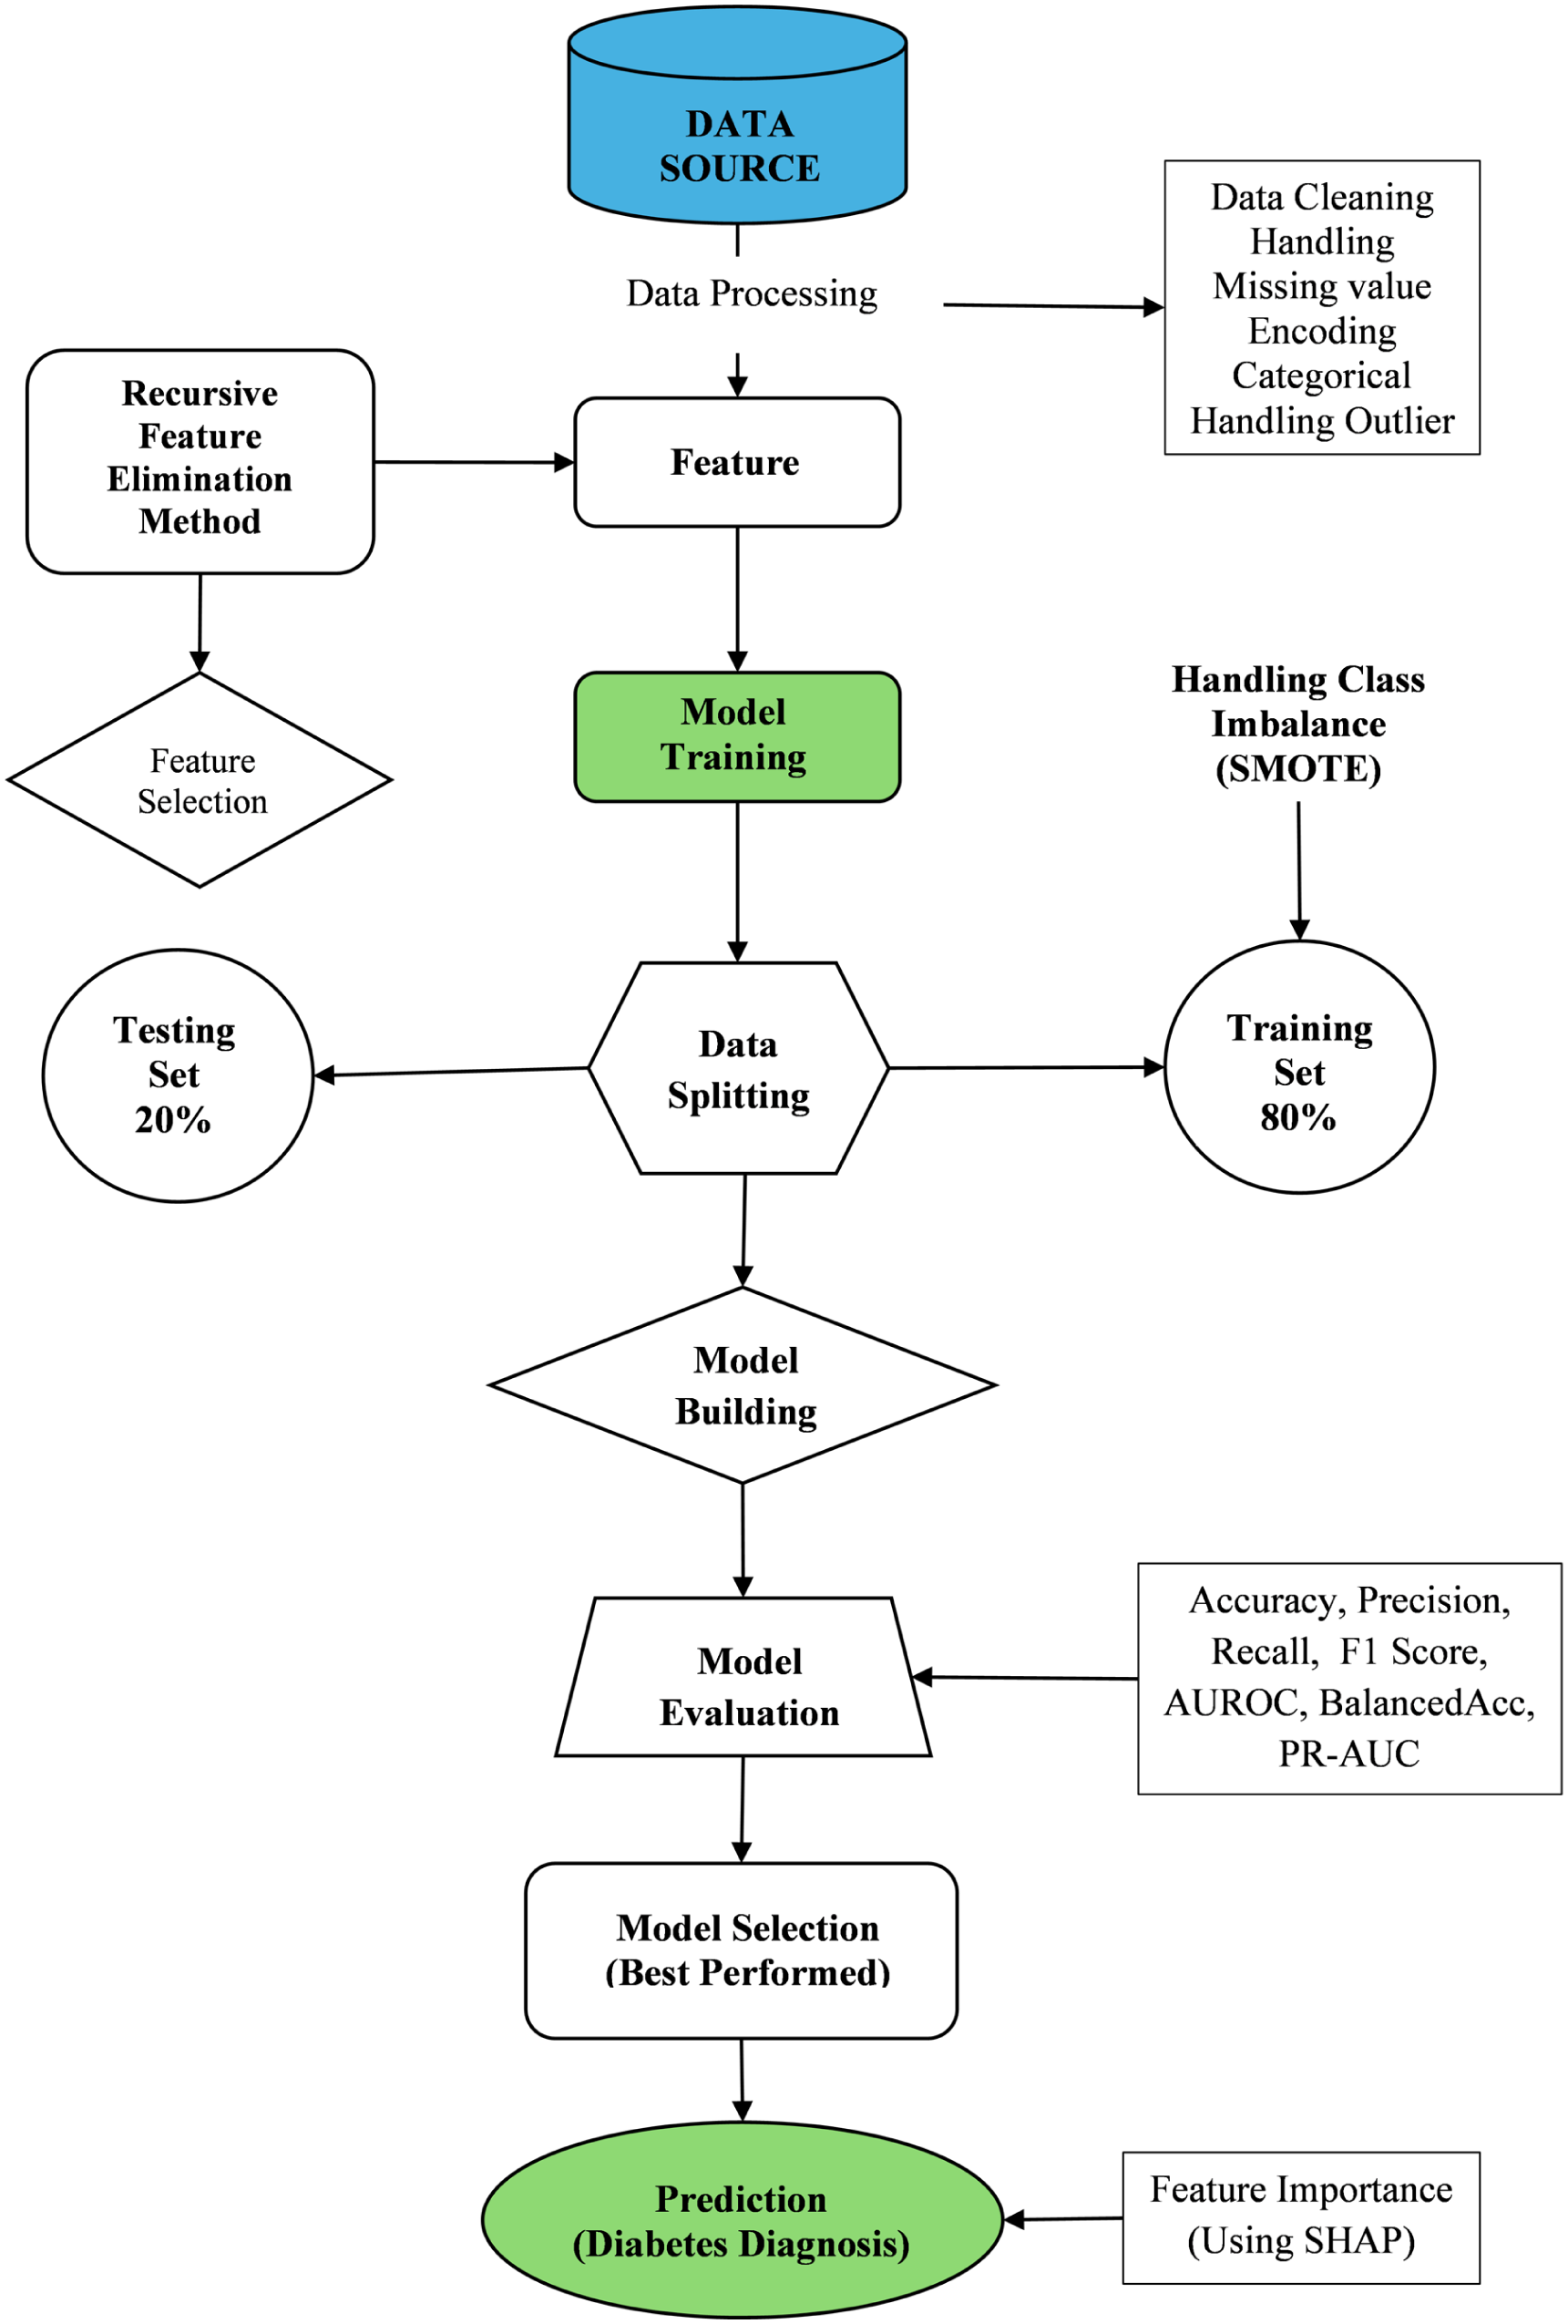
Machine learning workflow for predicting self-reported diabetes diagnosis.
Results
Sociodemographic and Health Characteristics by Self-Reported Diabetes Diagnosis
Table 1 presents the weighted sociodemographic and health-related characteristics of adults in Tennessee based on the 2023 BRFSS survey, stratified by self-reported diabetes diagnosis. Overall, approximately 16.2% of adults reported having been diagnosed with diabetes, while 83.8% reported no diagnosis. Women constituted a slightly higher proportion of the sample (51.9%) compared to men (48.1%), and diabetes prevalence was modestly higher among females (17.1%) than males (15.2%). Diabetes prevalence increased markedly with age, from 3.3% among adults aged 18 to 24 years to 27.8% among those aged 65 years and older, reflecting the strong age gradient typical of diabetes burden.
Weighted Descriptive Statistics of Key Variables and Their Distribution by Self-Reported Diabetes Diagnosis, Tennessee, BRFSS 2023.

By race and ethnicity, Black adults exhibited the highest diabetes prevalence (23.6%), followed by White adults (15.5%), whereas Hispanic respondents had the lowest prevalence (7.6%). Educational attainment and income demonstrated inverse associations with diabetes: adults with less than a high school education had the highest prevalence (24.3%), while college graduates had the lowest (12.4%). Similarly, diabetes prevalence declined steadily with increasing household income, from 21.6% among those earning less than $15 000 to 9.5% among those earning $100 000 or more. Unemployment and lower socioeconomic indicators were also associated with higher diabetes prevalence. Nearly 24.9% of unemployed adults reported diabetes, compared to 10.5% of employed adults. Marital status showed smaller differences, with prevalence of 17.4% among married and 15% among unmarried respondents.
Geographically, diabetes prevalence was comparable between urban (16.1%) and rural (17.3%) residents. Uninsured individuals had a lower reported prevalence (12.0%) compared to insured individuals (16.6%). Body mass index (BMI) showed a clear positive gradient with diabetes risk, rising from 2.6% among underweight adults to 23.0% among those classified as obese. Lifestyle factors also displayed strong associations: individuals who reported no physical activity in the past 30 days had nearly double the diabetes prevalence (25.2%) of those who were physically active (13.0%). Non-drinkers and daily smokers also had high diabetes prevalence of 20.9% and 15.9%, respectively. Adults reporting 3 or more comorbidities had a prevalence of 33.7%, compared to only 3.6% among those with none. Similarly, those with 3 or more disabilities reported a prevalence of 33.9%, versus 11.4% among those with no disabilities. Prevalence was also elevated among those with diagnoses of high blood pressure (28.9%), high cholesterol (29.3%), and arthritis (26.7%), as well as among respondents reporting fair or poor self-rated health (31.8%) (Table 1).
Factors Associated with Self-Reported Diabetes Diagnosis
Table 2 summarizes the results of unadjusted and adjusted logistic regression analyses identifying factors associated with self-reported diabetes among Tennessee adults. Variables were initially screened using backward elimination at a threshold of P ≤ .20, and twelve predictors were retained in the final multivariable model. In the unadjusted analyses, older age-groups, Black race, lower education and income levels, unemployment, obesity, lack of physical activity, hypertension, hypercholesterolemia, multiple comorbidities or disabilities, and fair/poor self-reported health were all significantly associated with increased odds of self-reported diabetes (P ≤ .05). Specifically, diabetes odds rose sharply with age, from the reference group (18-24 years) to those aged 65 years and older (OR = 11.2, 95% CI: 5.4-23.4). Similarly, obesity was strongly associated with diabetes (OR = 11.3, 95% CI: 4.4-29.2), as were high blood pressure (OR = 0.20, inverse coding indicating greater odds among hypertensive individuals) and high cholesterol (OR = 0.22).
Unadjusted and Adjusted Odds Ratios for Factors Associated with Self-Reported Diabetes Diagnosis, Tennessee, BRFSS 2023.
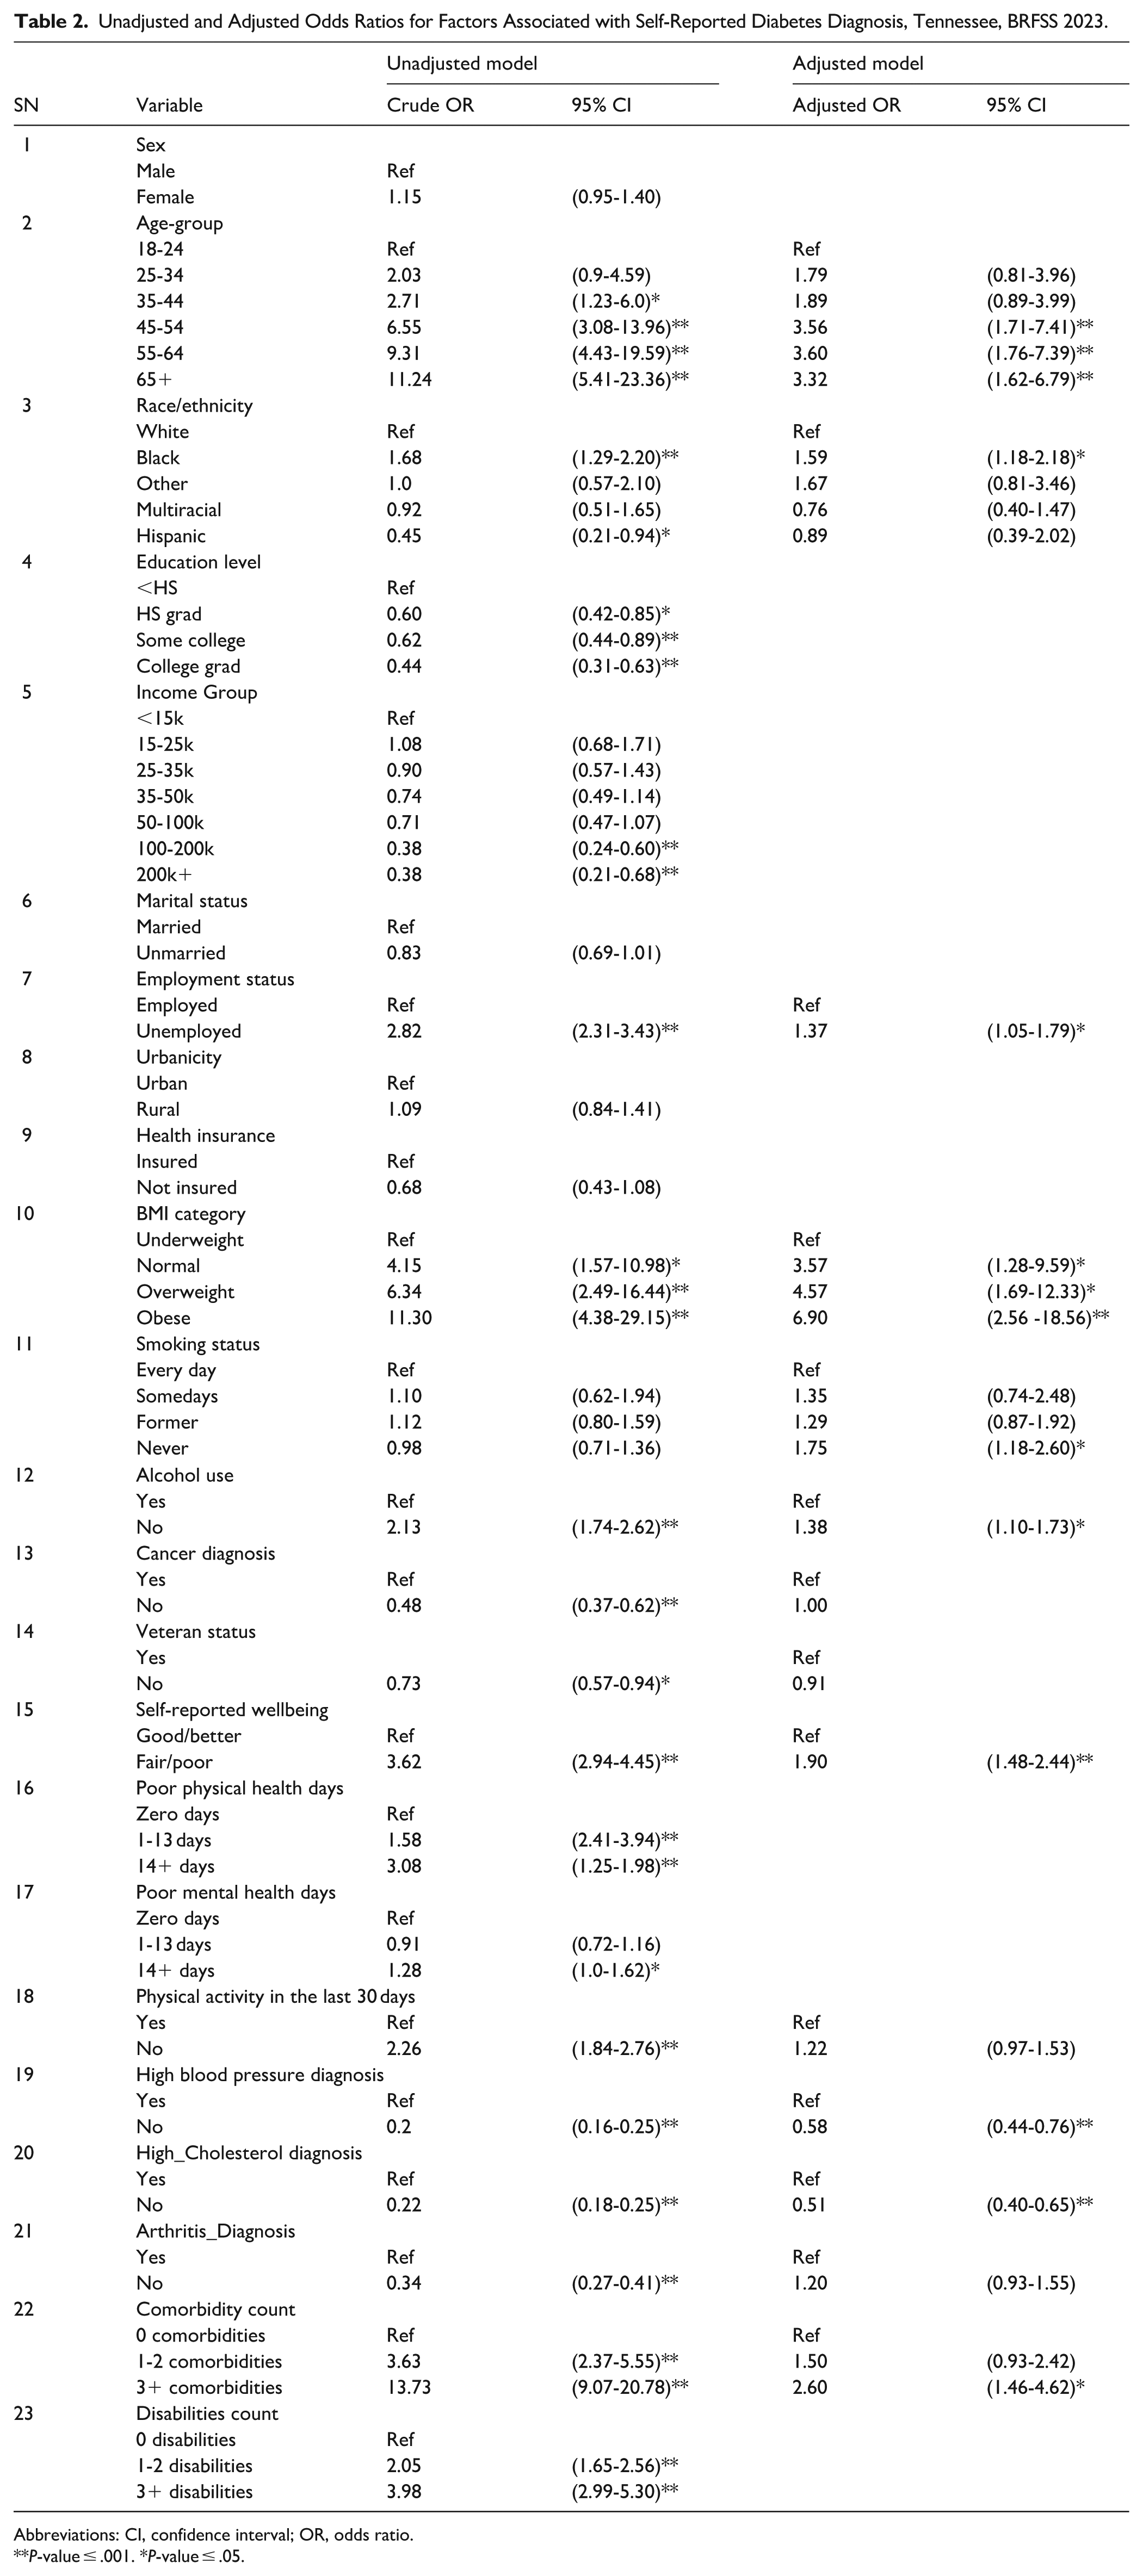
Abbreviations: CI, confidence interval; OR, odds ratio.
P-value ≤ .001. *P-value ≤ .05.
After adjustment for covariates, twelve variables remained significant predictors of diabetes: age group, race/ethnicity, employment status, BMI category, smoking status, alcohol use, self-reported wellbeing, and diagnoses of hypertension and high cholesterol, as well as comorbidity count. The associations for age and BMI remained robust; adults aged 55-64 years (AOR = 3.6, 95% CI: 1.8-7.4) and 65 years or older (AOR = 3.3, 95% CI: 1.6-6.8) were over 3 times as likely to report diabetes compared to those aged 18-24 years. Likewise, obese adults had nearly 7-fold higher adjusted odds (AOR = 6.9, 95% CI: 2.6-18.6) relative to underweight respondents. Black adults had higher adjusted odds of diabetes compared to White adults (AOR = 1.6, 95% CI: 1.2-2.2), while education and income effects were attenuated after adjustment. Unemployed adults had about 40% higher odds of diabetes than employed adults (AOR = 1.4, 95% CI: 1.1-1.8). Participants reporting fair or poor health were nearly twice as likely to have diabetes (AOR = 1.9, 95% CI: 1.5-2.4). Those reporting no diagnosis of hypertension (AOR = 0.6, 95% CI: 0.4-0.8) or hypercholesterolemia (AOR = 0.5, 95% CI: 0.4-0.7) had significantly lower odds, reinforcing the clustering of metabolic risk factors.
Paradoxically, individuals who had never smoked (AOR = 1.75, 95% CI: 1.18-2.60) and those who abstained from alcohol (AOR = 1.38, 95% CI: 1.10-1.73) exhibited higher adjusted odds of diabetes compared to current smokers and drinkers, respectively. Overall, the final multivariable model underscores the combined influence of demographic, behavioral, and metabolic factors on diabetes risk, with obesity, advancing age, poor self-rated health, and comorbidities emerging as the strongest independent predictors (Table 2).
Model Performance Evaluation and Comparison
Model performance was assessed using accuracy, precision, recall, F1-score, balanced accuracy, AUROC, and the Precision-Recall Area Under the Curve (PR-AUC). Confusion matrices were examined to evaluate each model’s classification behavior in terms of true positives (TP), false positives (FP), true negatives (TN), and false negatives (FN). Across all models, accuracy ranged from 0.576 (KNN) to 0.818 (XGBoost). The Gradient Boosting (GB) model achieved consistently strong overall performance, with an accuracy of 0.815, AUROC of 0.796, and the highest PR-AUC of 0.447, indicating good discrimination and balance between precision and recall. XGBoost performed comparably (accuracy = 0.818, AUROC = 0.776), demonstrating robust predictive ability with efficient learning from complex feature interactions. The Random Forest (RF) model followed closely (accuracy = 0.813, AUROC = 0.775), exhibiting reliable generalization with low false-positive (67) and high true-negative (855) counts. The Logistic Regression (LR) model provided the highest recall (0.746), indicating strong sensitivity in detecting diabetes cases, but at the expense of precision (0.378), a trade-off typical of linear models in imbalanced settings. SVM also demonstrated balanced results (accuracy = 0.791, AUROC = 0.761), while KNN showed the highest recall (0.844) but poor precision (0.279) and low overall accuracy (0.576), reflecting its tendency to over-classify positive cases. Decision Tree (DT) performed moderately (accuracy = 0.736, AUROC = 0.626), capturing non-linear patterns but with greater overfitting risk compared to ensemble models.
Overall, ensemble-based methods, XGBoost, Gradient Boosting, and Random Forest, outperformed other classifiers, achieving the highest AUROC and balanced accuracy values, reflecting superior discrimination and stability. Gradient Boosting was selected as the best-performing model due to its optimal combination of accuracy (0.815), AUROC (0.796), and PR-AUC (0.447), signifying reliable predictive performance and robustness in distinguishing between diabetic and non-diabetic respondents (Table 3, Figure 2).
Performance Evaluation Metrics and Confusion Matrix for ML Models in Self-reported Depression Diagnosis.
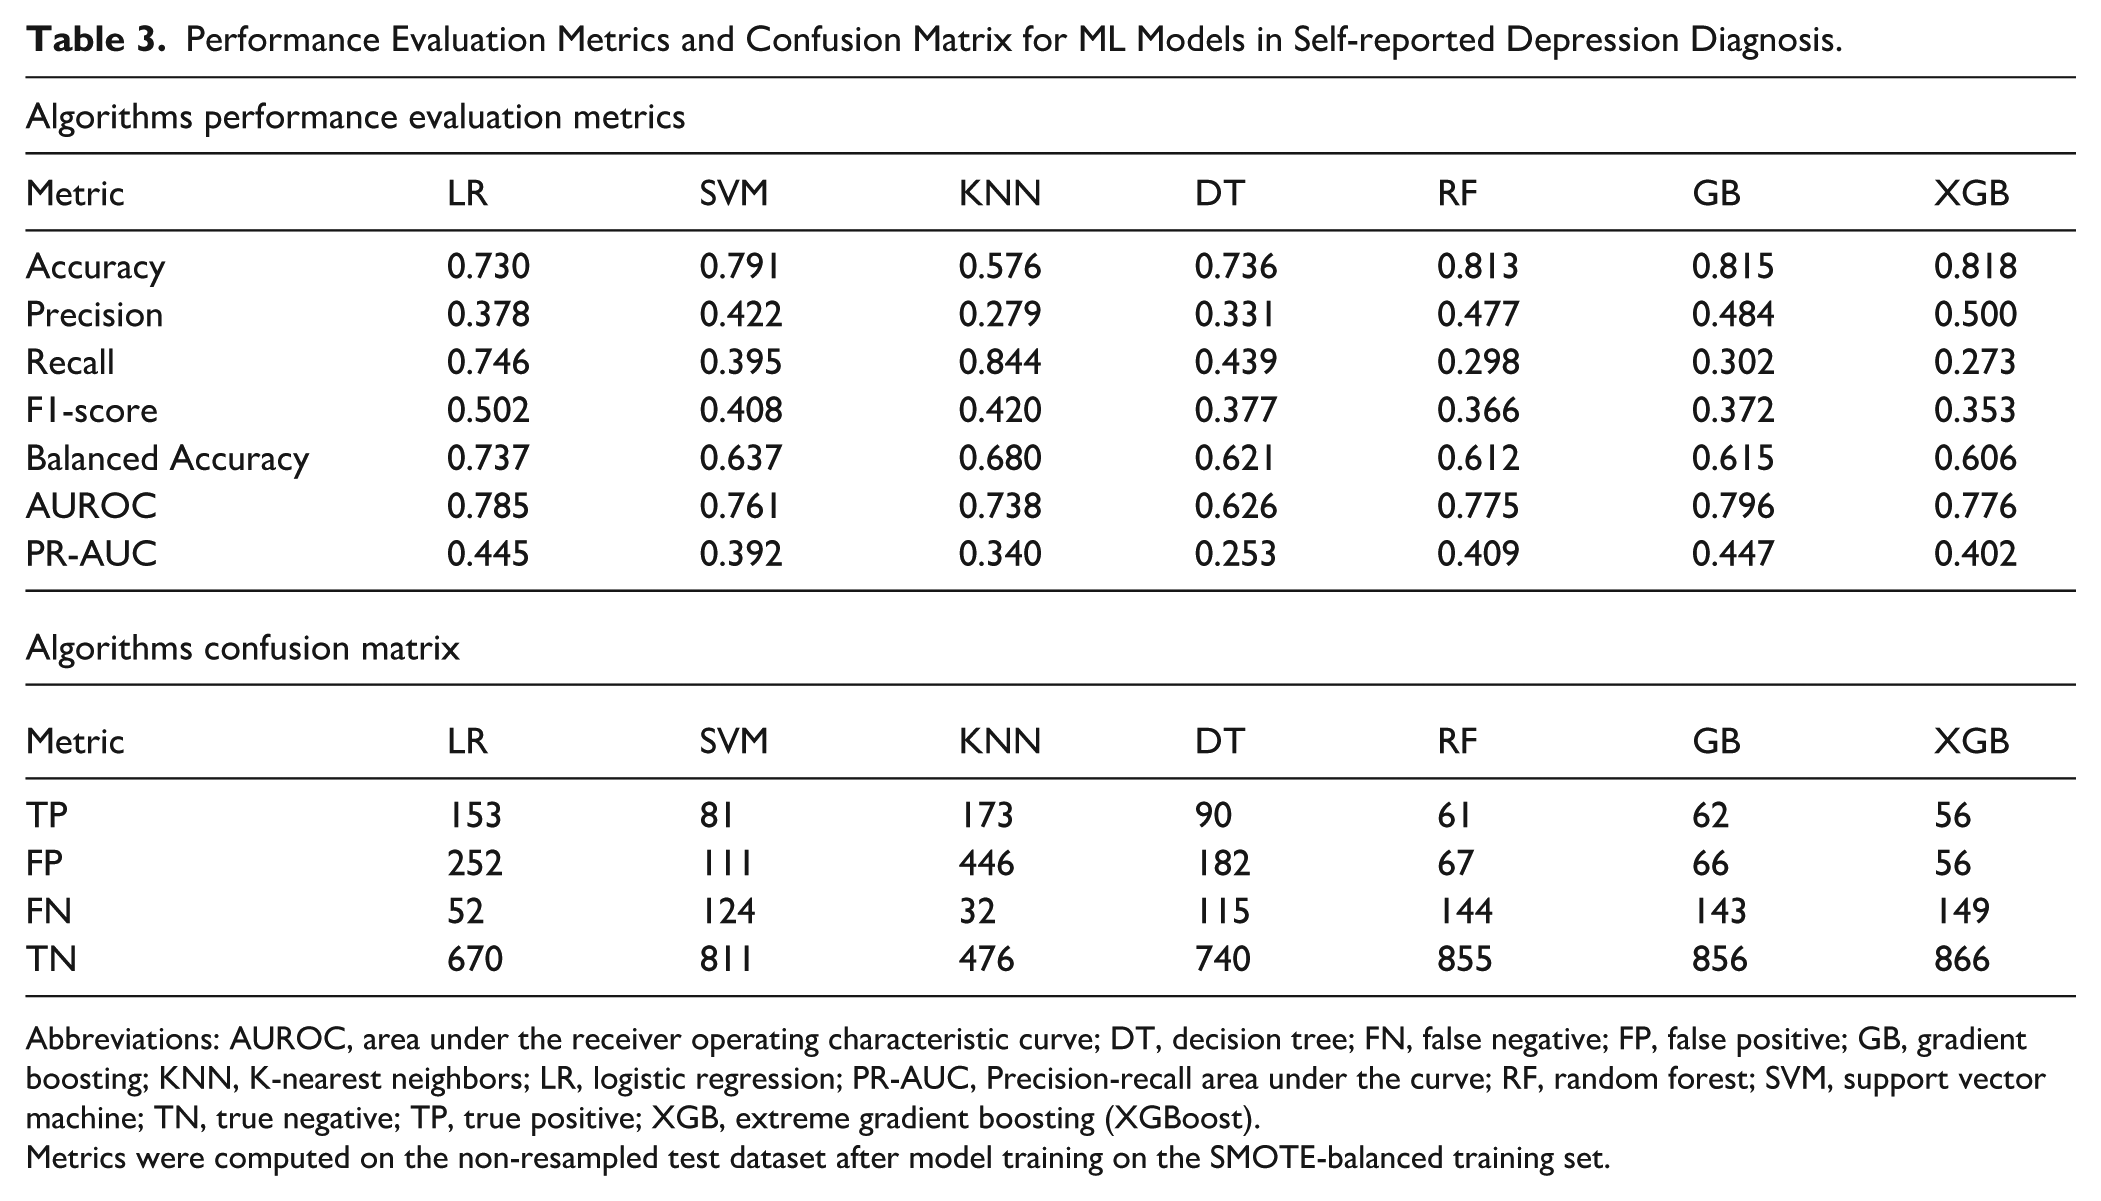
Abbreviations: AUROC, area under the receiver operating characteristic curve; DT, decision tree; FN, false negative; FP, false positive; GB, gradient boosting; KNN, K-nearest neighbors; LR, logistic regression; PR-AUC, Precision-recall area under the curve; RF, random forest; SVM, support vector machine; TN, true negative; TP, true positive; XGB, extreme gradient boosting (XGBoost).
Metrics were computed on the non-resampled test dataset after model training on the SMOTE-balanced training set.
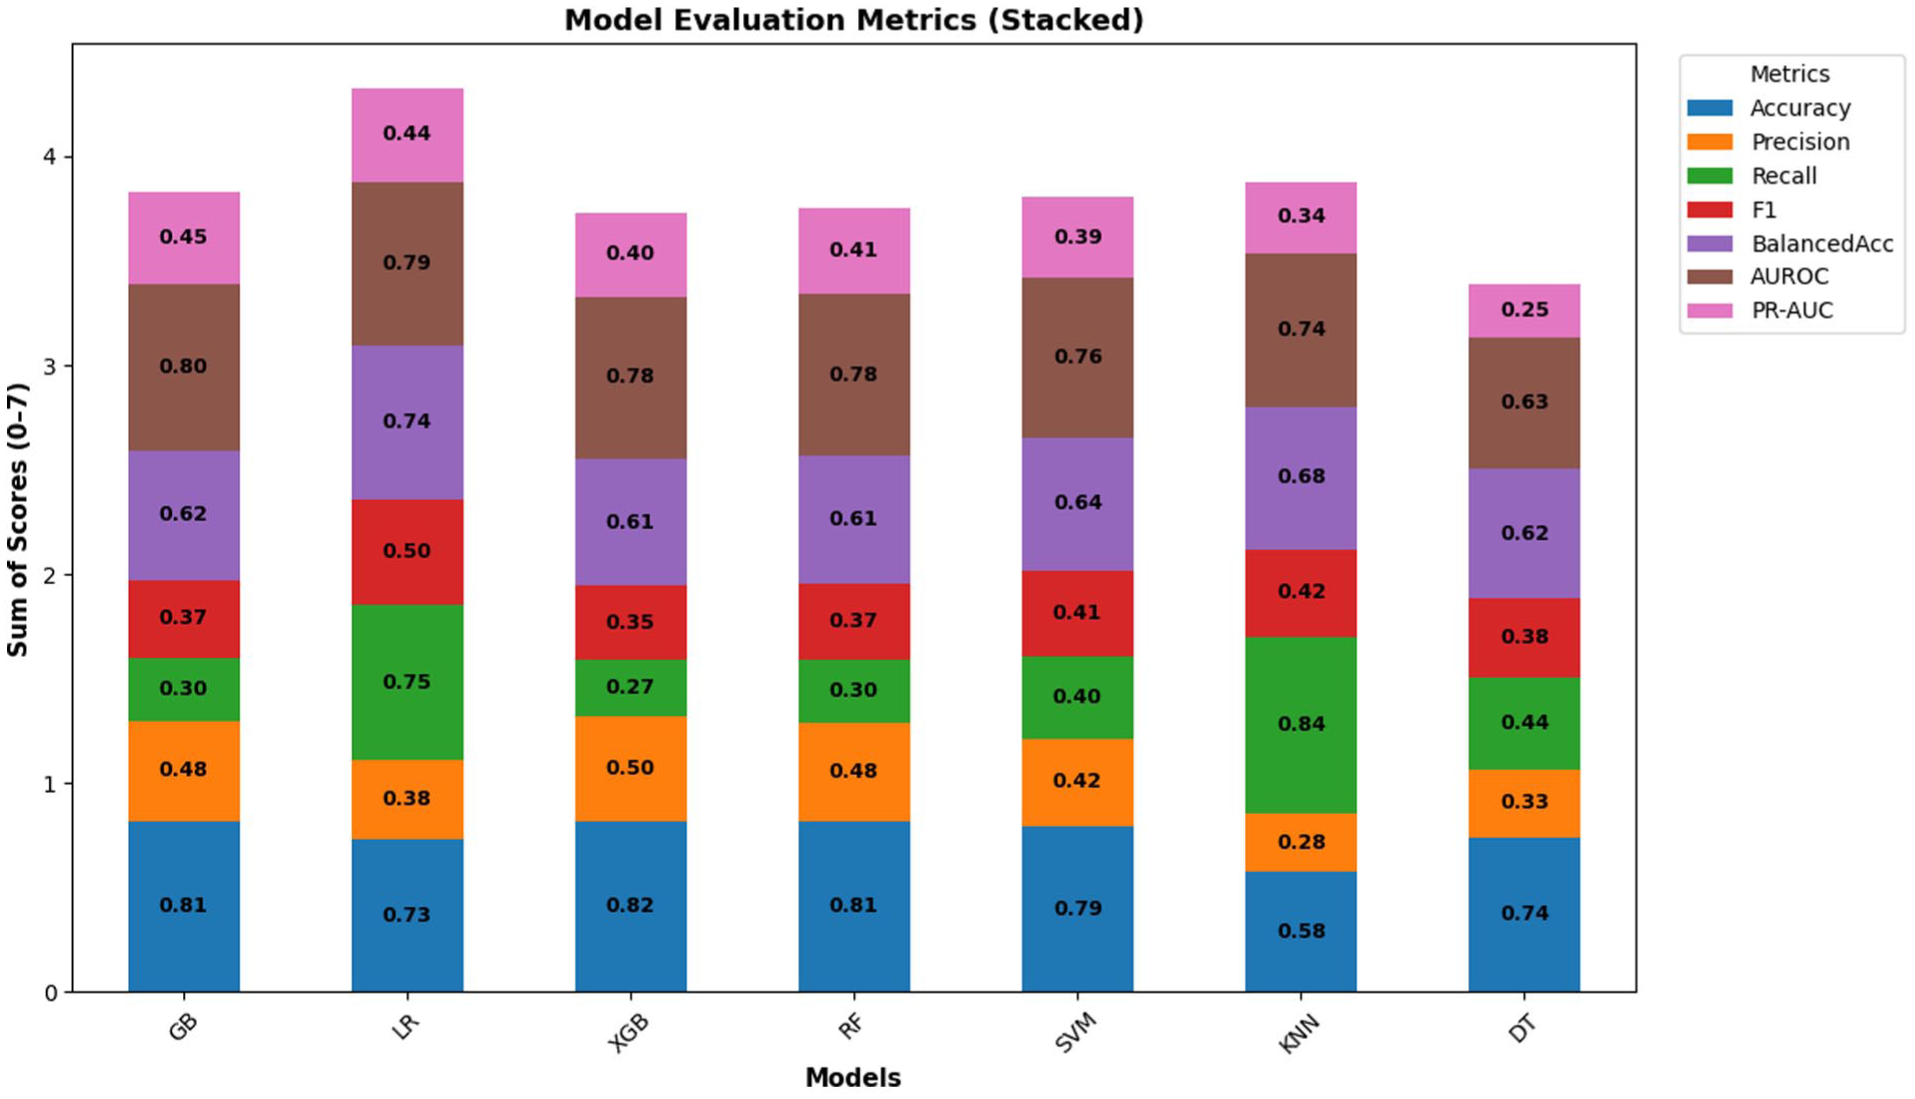
Model evaluation metrics for all models.
AUROC Curve Analysis
The Receiver Operating Characteristic (ROC) curve is a widely used tool to evaluate the diagnostic performance of classification models by plotting the true positive rate (sensitivity) against the false positive rate (1 – specificity) across various decision thresholds. The Area Under the ROC Curve (AUROC) provides a single measure of a model’s ability to discriminate between individuals with and without self-reported diabetes. As shown in Figure 3, the ROC curves for the 7 machine learning algorithms demonstrate varying degrees of discriminatory power. The Gradient Boosting (GB) model achieved the highest AUROC value (0.796), followed closely by Logistic Regression (0.785), XGBoost (0.776), and Random Forest (0.775), all indicating good overall classification performance. Support Vector Machine (SVM) achieved an AUROC of 0.761, while K-Nearest Neighbors (KNN) yielded a moderate value of 0.738. The Decision Tree (DT) model showed the lowest AUROC (0.626), reflecting relatively weaker discrimination between diabetes and non-diabetes cases. Overall, the ensemble-based models (GB, XGB, and RF) outperformed the others, demonstrating smoother ROC curves and higher AUROC values, suggesting superior capability to balance sensitivity and specificity. These results reinforce that ensemble learning approaches provide robust predictive performance for identifying self-reported diabetes cases.

ROC curve for all models.
Feature Importance Analysis Using SHAP
To interpret how individual predictors influenced the likelihood of self-reported diabetes, SHapley Additive exPlanations (SHAP) analysis was applied to the best-performing model. SHAP provides a unified approach for interpreting complex machine learning models by quantifying each feature’s contribution to the prediction outcome. As illustrated in Figure 4, the SHAP beeswarm plot displays both the magnitude and direction of each feature’s impact on model predictions. Each dot represents a single observation, with color indicating the feature value (blue = low, red = high). Among all predictors, high blood pressure, high cholesterol, and BMI category exerted the strongest positive influence on diabetes prediction, higher values of these features corresponded with a greater likelihood of being classified as diabetic. Other influential factors included income group, age group, self-reported general health, and comorbidity count, reflecting the interplay of clinical and sociodemographic determinants in diabetes risk.

SHAP feature importance Beeswarm plot.
Figure 5 presents the SHAP bar plot ranking features by their average absolute SHAP value, summarizing their overall contribution to the model. Consistent with the beeswarm plot, high blood pressure emerged as the dominant predictor, followed by high cholesterol, BMI category, income group, and age group. These results highlight that both biomedical risk factors (e.g., hypertension, hypercholesterolemia, obesity) and social determinants (e.g., income, education, and general health perception) are critical in predicting self-reported diabetes (Figures 4 and 5).
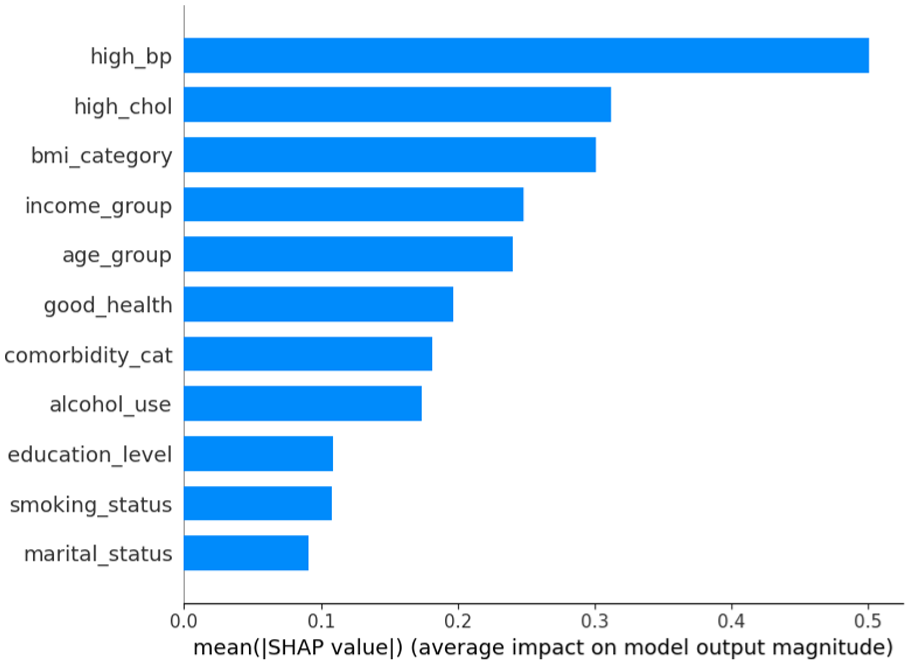
SHAP feature importance bar plot.
Discussion
This study applied both traditional regression and explainable machine learning (ML) techniques to identify key predictors of self-reported diabetes among adults in Tennessee using the 2023 BRFSS dataset. By integrating weighted statistical modeling with ML predictive analytics, the study provides a nuanced understanding of how biomedical, behavioral, and sociodemographic factors interact to influence diabetes risk in the state’s adult population. The multifactorial and non-linear nature of the disease’s risk factors poses significant challenges for conventional epidemiological approaches. 25 By leveraging machine learning algorithms, this work establishes a robust framework for analyzing population health patterns, particularly in contexts involving numerous interrelated variables. The findings emphasize the practicality and effectiveness of machine learning in identifying diabetes risk factors, especially in situations where traditional statistical models may fail to capture complex, non-linear interactions.25-28 This study identified significant, non-linear relationships between demographic attributes, lifestyle habits, and clinical measurements, all of which are critical for understanding and predicting diabetes. The capacity of machine learning to reveal hidden patterns supports growing evidence that integrating artificial intelligence into public health research can enhance both predictive accuracy and analytical depth. 29
An important contribution of this study is the identification of key predictors of self-reported diabetes among adults in Tennessee. The results highlight the continued importance of established clinical and behavioral risk factors for diabetes. Both the weighted logistic regression and ML models identified high blood pressure, high cholesterol, and body mass index (BMI) as the most significant predictors of self-reported diabetes, consistent with findings from prior U.S. and international studies.21,30,31 These results underscore consistent patterns across both traditional and ML frameworks, strengthening confidence in the robustness of identified risk factors. Individuals reporting hypertension or hypercholesterolemia had significantly higher odds of diabetes, reflecting the well-documented metabolic linkages among these conditions.30,32 Additionally, poorer self-rated health, the presence of multiple comorbidities, and limited physical activity were associated with higher diabetes prevalence, underscoring the multifactorial nature of the disease. Interestingly, the study observed inverse associations between smoking or alcohol use and diabetes risk, which contrasts with established scientific evidence. This discrepancy is likely attributable to bias; individuals diagnosed with diabetes may quit smoking or drinking either due to medical advice or personal health concerns, subsequently reporting themselves as non-smokers or abstainers. Similarly, the observed association between high blood pressure and diabetes may partly reflect reverse causality, as the metabolic and cardiovascular consequences of diabetes can contribute to the development of hypertension. From the ML analysis, ensemble-based models, particularly Gradient Boosting (GB), XGBoost (XGB), and Random Forest (RF), achieved the highest predictive performance (AUROC range: 0.775-0.796), outperforming simpler algorithms such as Logistic Regression and K-Nearest Neighbors. This aligns with evidence that ensemble methods excel in capturing nonlinear relationships and complex feature interactions inherent in behavioral health data.13,29,30 The SHAP analysis further confirmed the dominant role of high blood pressure and cholesterol as the most influential predictors, followed by BMI, income, and age group. This approach addresses the common “black-box” critique of machine learning by producing interpretable results that can inform both clinical and public health interventions.17,18 These findings highlight the need for integrated prevention strategies that combine medical risk screening with targeted interventions addressing social determinants of health.
While the weighted logistic regression model provided statistically interpretable associations and population-level inference, the machine learning approach, particularly the Gradient Boosting (GB) model interpreted through SHAP values, offered superior predictive flexibility and deeper insight into nonlinear relationships between risk factors. Traditional regression assumes linearity, additivity, and independence among predictors, which can oversimplify the complex interplay of biological and behavioral determinants of diabetes.26,33,34 In contrast, ensemble tree-based models like GB can capture nonlinear and high-order interactions without prespecified functional forms, making them more effective in heterogeneous population health data.33,35-37 The SHAP framework further enhances interpretability by quantifying feature-level contributions in a manner consistent with game theory, bridging the transparency gap often criticized in ML models.17,38-40 In this study, while both approaches consistently identified hypertension, high cholesterol, and obesity as key predictors, the GB-SHAP model provided a more nuanced understanding of how socioeconomic variables such as income, education, and self-rated health interact with clinical factors to shape diabetes risk. This capability is particularly relevant in public health contexts, where understanding complex risk patterns supports targeted screening, resource allocation, and equity-focused intervention design. 41 Thus, integrating explainable machine learning with traditional epidemiologic modeling represents a promising pathway toward more precise, data-driven public health strategies.
The superior performance of the Gradient Boosting (GB) model in this study reflects its ability to iteratively minimize prediction errors by combining multiple weak learners into a robust ensemble, optimizing both bias and variance in complex datasets. This property is particularly advantageous for chronic disease prediction, where the relationships between variables such as hypertension, BMI, and socioeconomic status are rarely linear or additive. The evaluation metrics in this study employed accuracy, precision, recall, F1-score, balanced accuracy, AUROC, and PR-AUC, collectively providing a comprehensive assessment of model performance. While accuracy gives an overall measure of correctness, it can be misleading in class-imbalanced data, such as diabetes prevalence studies. 24 In this public health context, precision and recall are more informative: precision reflects the model’s ability to avoid false positives, while recall measures how well true diabetes cases are detected.24,42 The F1-score, as the harmonic mean of precision and recall, balances these competing goals, but it assumes equal importance of both metrics. 24 The PR-AUC, however, offers a more discriminating evaluation under imbalance by focusing directly on the trade-off between precision and recall.42,43 Given the lower prevalence of diabetes in the dataset, PR-AUC provides a clearer measure of real-world clinical utility, highlighting the model’s ability to correctly identify high-risk individuals without excessive false alarms. Thus, GB’s strong PR-AUC and AUROC values indicate that it not only achieved high discrimination but also maintained robust performance in identifying positive diabetes cases, qualities critical for effective public health screening and early intervention.
Beyond its empirical findings, this study offers a structured methodological framework for applying artificial intelligence to public health surveillance and chronic disease research, specifically diabetes. The framework includes key stages such as comprehensive data preprocessing, application of weighted logistic regression, careful model selection, comparative performance evaluation, and post-model interpretability through SHAP analysis. This systematic approach provides a practical roadmap for integrating machine learning into large-scale health data analysis, particularly in contexts where comprehensive datasets like the BRFSS are underutilized for predictive modeling. The successful implementation of this pipeline demonstrates the potential of AI to strengthen timely, evidence-driven decision-making in diabetes prevention and management, especially in settings where traditional epidemiological methods may fall short in capturing complex, non-linear risk interactions.
Limitations
While this study provides valuable insights into the application of machine learning for predicting diabetes risk, several limitations should be acknowledged. First, the cross-sectional nature of the BRFSS data prevents the establishment of causal relationships between the identified predictors and diabetes outcomes. The associations observed cannot confirm temporal directionality. Second, the reliance on self-reported information introduces potential reporting biases, including recall error and social desirability bias, particularly for sensitive behaviors such as alcohol consumption and smoking. Third, the analysis was limited to variables included in the BRFSS dataset, which may have excluded other important biological, psychosocial, or environmental determinants of diabetes, such as dietary quality, healthcare access, or neighborhood-level factors. Finally, although the models demonstrated strong performance during internal validation, they were not tested on external datasets, limiting the ability to generalize findings to other populations.
Future Directions
Future research should build upon this work by incorporating longitudinal data, diverse geographic and demographic groups, integrating electronic health records or social determinants, and testing the predictive stability of machine learning models over time. Moreover, exploring more advanced approaches, such as deep neural networks or ensemble meta-modeling, may further enhance predictive accuracy and broaden the applicability of AI in chronic disease surveillance. External validation with independent datasets will be critical to confirm the robustness and generalizability of these predictive models, ensuring their applicability across diverse populations. Additionally, deploying this framework for real-time diabetes risk prediction dashboards could enhance public health decision support, particularly in high-burden regions such as Tennessee.
Conclusion
This study demonstrated the strong potential of machine learning algorithms alongside traditional statistical methods in predicting self-reported diabetes among U.S. adults using the 2023 BRFSS dataset. The integration of SHAP analysis enhanced model interpretability, providing case-level insights into how individual predictors influence diabetes risk and highlighting nuanced interactions between lifestyle, metabolic, and demographic factors. These results illustrate the value of combining advanced approaches to strengthen chronic disease surveillance and inform precision public health interventions like diabetes prevention and management strategies.
Supplemental Material
sj-docx-1-jpc-10.1177_21501319251400546 – Supplemental material for Exploring Explainable Machine Learning for Predicting and Interpreting Self-Reported Diabetes among Tennessee Adults: Insights from the 2023 Behavioral Risk Factor Surveillance System (BRFSS)
Supplemental material, sj-docx-1-jpc-10.1177_21501319251400546 for Exploring Explainable Machine Learning for Predicting and Interpreting Self-Reported Diabetes among Tennessee Adults: Insights from the 2023 Behavioral Risk Factor Surveillance System (BRFSS) by Mustapha Aliyu Muhammad, Jamilu Sani and Mohamed Mustaf Ahmed in Journal of Primary Care & Community Health
Footnotes
Author Contributions
MAM conceptualized the study, developed the methodology, and performed the formal analysis. JS & MMA assisted with data curation, implemented the software, and supported model evaluation. All authors contributed to the manuscript writing, reviewed the final draft, and approved the submitted version.
Consent for Publication
Not applicable.
Funding
The authors received no financial support for the research, authorship, and/or publication of this article.
Declaration of Conflicting Interests
The authors declared no potential conflicts of interest with respect to the research, authorship, and/or publication of this article.
Data Availability Statement
Supplemental Material
Supplemental material for this article is available online.
References
Supplementary Material
Please find the following supplemental material available below.
For Open Access articles published under a Creative Commons License, all supplemental material carries the same license as the article it is associated with.
For non-Open Access articles published, all supplemental material carries a non-exclusive license, and permission requests for re-use of supplemental material or any part of supplemental material shall be sent directly to the copyright owner as specified in the copyright notice associated with the article.