
Abstract
Keywords
Introduction
Poststroke anxiety (PSA) is a prevalent yet frequently disregarded neuropsychiatric concern among stroke survivors, 1 linked to heightened disability, reduced quality of life, and increased rehospitalization rates. 2 Timely identification is crucial for prompt psychological and pharmacological interventions.
State-of-the-art: Predictive approaches for PSA
Conventional PSA prediction tools have primarily relied on clinical characteristics such as age, sex, stroke severity, and comorbid depression. Although these logistic-regression-based models are simple and interpretable, they generally capture only a narrow set of predictors and fail to reflect the multifactorial mechanisms of PSA, resulting in modest predictive accuracy. 3
Other studies have examined biological markers, including serum cortisol, inflammatory cytokines, and structural neuroimaging indicators, to predict PSA risk. While these biomarker-based approaches provide mechanistic insights, their clinical translation is limited by high costs, technical complexity, and lack of routine availability. 4
More recently, machine learning (ML) and deep learning (DL) algorithms have been introduced to integrate a broader range of clinical, psychosocial, and laboratory variables, achieving superior discrimination compared with traditional models.5,6 However, these methods are often developed using small, single-center datasets and lack external validation, which raises concerns about overfitting and generalizability. In addition, many ML/DL models remain “black boxes,” limiting their acceptance among clinicians.
Recent progress in artificial intelligence (AI) and ML now facilitates the creation of predictive models that incorporate a wide range of variables to offer personalized risk assessments. The emergence of explainable AI (XAI) methods, such as SHAP (Shapley Additive Explanations), has further enhanced model transparency and interpretability, addressing the opacity issue in ML and supporting clinical adoption. 7
This investigation aims to construct and validate an interpretable ML-based risk prediction model for PSA in stroke patients utilizing multicenter clinical data.
Study data
General information
This retrospective cross-sectional study involved 10 hospitals, namely, The First Affiliated Hospital of Henan University of Chinese Medicine, Luoyang Central Hospital, Xi’an Hospital of Traditional Chinese Medicine, The Third Affiliated Hospital of Fujian University of Traditional Chinese Medicine, Zhoukou Hospital of Traditional Chinese Medicine, Henan Provincial People's Hospital, Luohe Hospital of Traditional Chinese Medicine, Kaifeng Central Hospital, Jiaxian Traditional Chinese Medicine Hospital and Anyang Hospital of Traditional Chinese Medicine. Stroke patients admitted between 1 January 2022 and 11 June 2025 were divided into PSA and non-PSA groups based on clinical diagnosis. Data on demographics, stroke characteristics, laboratory indices, and psychological assessments were collected for analysis. This multicenter study was approved by the Ethics Committee of The First Affiliated Hospital of Henan University of Chinese Medicine (approval number: 2024HL-457) and waived the requirement for informed consent due to its retrospective nature, in accordance with national regulations.
Diagnostic criteria
PSA was assessed using the Hospital Anxiety and Depression Scale—anxiety subscale (HADS-A), which comprises seven items each scored 0–3 (total 0–21); in this study, PSA was defined as HADS-A ≥ 8. 8 Two or more attending physicians autonomously performed all patient evaluations within 7 days of the stroke hospitalization.
Inclusion and exclusion criteria
Inclusion criteria were as follows: (1) age ≥ 18 years; (2) ischemic or hemorrhagic stroke diagnosis per established guidelines9,10; (3) first-time or recurrent stroke; (4) HADS completion during hospitalization, with full data.
Exclusion criteria were as follows: (1) preexisting anxiety or depression diagnosis before stroke; (2) severe cognitive impairment, aphasia, or altered consciousness hindering assessment; (3) severe comorbid neurological or psychiatric disorders; and (4) incomplete clinical records or significant missing data.
Methods
This study's detailed workflow, encompassing data collection, feature selection, model development, evaluation, and interpretation, is depicted in Figure 1.

The study's workflow detailing data collection, feature selection, machine learning modeling, and evaluation processes for predicting the risk of poststroke anxiety (PSA). The ultimate model choice was informed by both test performance and clinical interpretability. LASSO: least absolute shrinkage and selection operator; CV: cross-validation; XGBoost: extreme gradient boosting; LightGBM: light gradient boosting machine; KNN: K-nearest neighbor; AUC: area under the curve; DCA: decision curve analysis.
Observational indicators
This study was carried out between 1 January 2022 and 11 June 2025, in 10 tertiary hospitals in China. A standardized case report form (CRF) was utilized to facilitate data collection by trained researchers, covering five primary variable categories: (1) demographic and lifestyle factors, comprising age, gender, education, height, weight, body mass index (BMI), comorbidities (hypertension, diabetes, hyperhomocysteinemia, transient ischemic attack (TIA)), and lifestyle factors (smoking, alcohol consumption, working status, overwork, sleep patterns); (2) laboratory parameters, including complete blood count (white blood cell (WBC), red blood cell (RBC), hemoglobin, platelets), biochemical assessments (total cholesterol, triglycerides, low-density lipoprotein (LDL), high-density lipoprotein (HDL), glycated hemoglobin (HbA1c), uric acid, creatinine), and coagulation profiles (fibrinogen (FIB), activated partial thromboplastin time (APTT), prothrombin time (PT), thrombin time (TT)); (3) imaging indicators, specifically carotid atherosclerotic plaques detected through ultrasonography or computed tomography angiography (CTA); (4) clinical assessment tools, encompassing NIHSS (National Institutes of Health Stroke Scale, assessed at admission), Barthel index (BI, evaluated at discharge), modified Rankin scale (mRS, also assessed at discharge), and HADS-A (see Diagnostic Criteria section). Sleep quality was derived from the Pittsburgh Sleep Quality Index (PSQI), with poor sleep defined as PSQI > 5. Overwork was defined as ≥55 self-reported working hours per week during the month prior to stroke onset; (5) data quality assurance procedures, with all information extracted from hospital electronic medical records and laboratory systems to ensure data reliability and consistency.
ML and statistical analysis
Statistical analyses were conducted using SPSS 27, R 4.5, and Python 3.13. The Python libraries included Scikit-learn (v1.3.2), extreme gradient boosting (XGBoost) (v1.7.6), light gradient boosting machine (LightGBM) (v4.1.0), and SHAP (v0.44.0). Continuous variables were expressed as mean ± standard deviation and compared using independent t-tests or Mann–Whitney U tests. Categorical variables were presented as counts (percentages) and analyzed through chi-square or Fisher's exact tests. Observational indicators encompassed demographic, clinical, psychosocial, and laboratory features, which are comprehensively summarized in Table 1. Feature selection followed a two-step process: univariate analysis (p < 0.05) using SPSS, followed by least absolute shrinkage and selection operator (LASSO) regression for dimensionality reduction. Out of 49 initial candidate variables, 18 were retained as core predictors. The dataset (N = 238) was randomly partitioned into training (70%), validation (15%), and test (15%) sets. Seven algorithms were applied: logistic regression, decision tree, random forest, K-nearest neighbors (KNNs), XGBoost, LightGBM, and stacking. Models were trained using 10-fold cross-validation, and performance was evaluated via area under the curve (AUC), accuracy, sensitivity, specificity, F1 score, and average precision. Calibration curves were also used to assess prediction consistency. Hyperparameters for each algorithm were optimized via grid search and are presented in Table 2, using conventional terminology.
Summary of variable categories and measurement scales.

NIHSS: National Institutes of Health Stroke Scale; BI: Barthel index; PSQI: Pittsburgh Sleep Quality Index; JCQ: Job Content Questionnaire; WBC: white blood cell; TC: total cholesterol; LDL: low-density lipoprotein; FIB: fibrinogen; APTT: activated partial thromboplastin time.
This table summarizes all variables included in model construction, grouped by domain (demographic, clinical, psychosocial, and laboratory). Measurement methods and data sources are indicated for each category.
Final hyperparameter settings of each machine learning model.

This table lists the optimized hyperparameters for all algorithms after grid-search tuning with 10-fold cross-validation, ensuring optimal discrimination and generalizability.
To address the moderately imbalanced PSA/non-PSA ratio (∼46%/54%), two complementary strategies were applied. First, class weighting was implemented. For logistic regression and tree-based models (decision tree, random forest), the class_weight parameter in Scikit-learn was set to “balanced,” automatically adjusting weights inversely to class frequencies. For XGBoost and LightGBM, the scale_pos_weight parameter (∼1.18, calculated as non-PSA/PSA) was optimized via GridSearchCV to improve sensitivity without sacrificing specificity.
Second, robustness was validated using the synthetic minority oversampling technique (SMOTE) on the training set. Although SMOTE slightly improved sensitivity, it reduced generalization on the independent test set (logistic regression AUC: 0.965 vs. 0.981 with class weighting) and increased overfitting risk. Therefore, class weighting was retained as the primary strategy, as it achieved a more stable balance between sensitivity (0.867) and specificity (0.952). To further evaluate performance under imbalanced conditions, precision–recall (PR) curves (Figure 3) were analyzed in addition to receiver operating characteristic (ROC) curves. The high average precision of the logistic regression model (0.92 in the test set) confirmed the effectiveness of the chosen approach.
SHAP was employed for enhancing interpretability, and decision curve analysis (DCA) was conducted to evaluate clinical utility. The top 10 variables were selected for inclusion in the final nomogram based on SHAP importance rankings, aiming to balance predictive performance and usability (see Supplementary Table 1).
Results
Sample size justification
A total of 109 patients met PSA criteria (HADS-A ≥ 8), and 18 final predictors were identified, yielding an events-per-variable (EPV) ratio of 6.1, slightly below the conventional EPV threshold of ≥10 for logistic regression. Nonetheless, employing LASSO and cross-validation mitigates the risks of overfitting. Past studies have demonstrated the viability of ML modeling with modest sample sizes (n ≈ 200–300), affirming the suitability of this dataset for predictive modeling. 11 For the final nomogram, 10 predictors were retained, corresponding to an EPV of 10.9, thereby meeting the recommended threshold for model stability and interpretability.
Comparison of clinical characteristics between groups
This investigation comprised 238 stroke patients, with 109 patients meeting the PSA diagnostic criteria and 129 classified into the non-PSA group, yielding a PSA prevalence of 45.80%. Eighteen variables exhibited statistically significant differences between the groups (p < 0.05): recurrent stroke, income level, payment type, occupational stress, overwork, sleep quality, continuous drinking history, history of hypertension, diabetes, hyperlipidemia, hyperhomocysteinemia, WBC, TC, LDL, FIB, APTT, NIHSS score, and BI. A detailed comparative analysis is presented in Table 3.
A comparison of baseline characteristics between stroke patients with poststroke anxiety (PSA) and those without PSA.

Variables demonstrating significant between-group variances (p < 0.05) are highlighted in bold. PSA is an abbreviation for poststroke anxiety.
BMI: body mass index; TIA: transient ischemic attack; RBC: red blood cell; WBC: white blood cell; PLT: platelet count; HGB: hemoglobin concentration; TC: total cholesterol; TG: triglyceride; LDL: low-density lipoprotein; HDL: high-density lipoprotein; PT: prothrombin time; FIB: fibrinogen; APTT: activated partial thromboplastin time; TT: thrombin time; HbA1c: glycated hemoglobin; Cr: creatinine; UA: uric acid; Hcy: homocysteine; mRS: modified Rankin scale; NIHSS: National Institutes of Health Stroke Scale; BI: Barthel index.
Development and evaluation of PSA risk prediction models using seven ML algorithms
Eighteen core predictors, including recurrent stroke, income level, payment type, occupational stress, overwork, sleep quality, continuous drinking history, history of hypertension, diabetes, hyperlipidemia, hyperhomocysteinemia, WBC count, total cholesterol, LDL, FIB, APTT, NIHSS score, and BI, were utilized to construct seven ML classification models. These models encompassed logistic regression, XGBoost, LightGBM, random forest, decision tree, KNN, and stacking ensemble models.
In the training set, the majority of models attained exceptional AUC values of 1.000. Within the validation set, the stacking model demonstrated outstanding performance (AUC = 0.967; accuracy = 0.829; sensitivity = 0.667; specificity = 1.000; F1 score = 0.800), closely trailed by the logistic regression model (AUC = 0.964; with identical metrics).
In the test set, both the logistic regression and random forest models exhibited robust generalizability. The logistic regression model achieved an AUC of 0.981, accuracy of 0.917, sensitivity of 0.867, specificity of 0.952, and F1 score of 0.897. Similarly, the random forest model performed commendably (AUC = 0.968; accuracy = 0.917; sensitivity = 0.933; specificity = 0.905; F1 score = 0.903). For further details, please consult Table 4 and Figure 2.

Receiver operating characteristic (ROC) curves for seven distinct machine learning models utilized in poststroke anxiety (PSA) prediction. Panel A represents the training set, Panel B depicts the validation set, and Panel C showcases the test set. Each curve delineates the balance between sensitivity and specificity, with the area under the curve (AUC) values serving as indicators of discrimination performance. XGBoost: extreme gradient boosting; LightGBM: light gradient boosting machine; KNN: K-nearest neighbor.

Precision–recall (PR) curves that compare PSA prediction models across different datasets. Panel A represents the training set, Panel B the validation set, and Panel C the test set. These curves illustrate the performance of the models in scenarios with imbalanced classification, emphasizing precision at different levels of recall. PSA: poststroke anxiety; XGBoost: extreme gradient boosting; LightGBM: light gradient boosting machine; KNN: K-nearest neighbor; AUC: area under the curve.
Displays the performance metrics of seven machine learning models for predicting PSA levels across training, validation, and test datasets.

The metrics assessed include AUC, accuracy, sensitivity, specificity, and F1-score. PSA: poststroke anxiety; AUC: area under the curve; KNN: K-nearest neighbor; LightGBM: light gradient boosting machine; XGBoost: extreme gradient boosting.
Pairwise comparisons of AUCs using DeLong's test revealed that the logistic regression model did not differ significantly from the stacking (AUC = 0.983, p = 0.42), XGBoost (AUC = 0.975, p = 0.18), LightGBM (AUC = 0.973, p = 0.21), or random forest models (AUC = 0.968, p = 0.27). However, logistic regression significantly outperformed the KNN (AUC = 0.892, p = 0.004) and decision tree (AUC = 0.873, p < 0.001) models (see Supplementary Table 2).
Although the stacking model achieved a slightly higher AUC on the validation set, the logistic regression model exhibited superior generalization on the test set (AUC = 0.981) with more consistent and stable performance across all evaluation metrics. Given its reduced complexity, improved interpretability, and alignment with SHAP-based clinical interpretation, logistic regression was selected as the ultimate model. Subsequently, a nomogram was developed for both visual representation and clinical utilization.
Evaluation of PSA risk prediction models across seven algorithms
ROC curve analysis based on 10-fold cross-validation
Figure 4 depicts the ROC curve analysis results for each model. In the training set (Figure 4A), all models, except logistic regression and KNN with identical AUC values of 0.98, exhibited an AUC of 1.00, indicating a nearly perfect fit. Moving to the validation set (Figure 4B), the stacking model demonstrated the highest AUC of 0.96, closely trailed by logistic regression (AUC = 0.96) and XGBoost (AUC = 0.94). LightGBM and random forest also performed commendably, achieving AUCs of 0.94 and 0.95, respectively, while KNN (AUC = 0.91) and decision tree (AUC = 0.83) displayed a slightly inferior performance. In the test set (Figure 4C), logistic regression, XGBoost, random forest, and stacking each attained an AUC of 0.99, showcasing outstanding generalizability. LightGBM and KNN followed closely, with AUCs of 0.98, whereas the decision tree exhibited the lowest AUC at 0.86.

Tenfold cross-validated ROC curves for seven distinct machine learning models. Panel A represents the training set, Panel B the validation set, and Panel C the test set. The AUC value for each model is provided to evaluate the consistency of discrimination across folds. XGBoost: extreme gradient boosting; LightGBM: light gradient boosting machine; KNN: K-nearest neighbor; AUC: area under the curve; ROC: receiver operating characteristic.
Pairwise comparisons of ROC AUCs were performed using DeLong's test with Bonferroni correction. Logistic regression (AUC = 0.981) did not differ significantly from stacking (AUC = 0.983; p = 0.42), XGBoost (AUC = 0.975; p = 0.18), LightGBM (AUC = 0.973; p = 0.21), or random forest (AUC = 0.971; p = 0.27) but outperformed KNN (AUC = 0.892; p = 0.004) and decision tree (AUC = 0.873; p < 0.001). For the final logistic regression model, the test set AUC was 0.981 (95% CI: 0.962–0.998), and the optimism-corrected AUC via bootstrap (0.632+) was 0.976, confirming the robustness of the findings.
Calibration curve analysis of the seven ML models
Model calibration was evaluated through calibration curves and Brier scores, as depicted in Figure 5. In the training set (Figure 5A), the stacking model displayed superior calibration with a Brier score of 0.030, outperforming LightGBM (Brier score = 0.0222) and XGBoost (Brier score = 0.0371). The logistic regression model also showed satisfactory calibration with a Brier score of 0.0533. Within the validation set (Figure 5B), stacking exhibited strong calibration with a Brier score of 0.0409, while XGBoost (Brier score = 0.0367) and logistic regression (Brier score = 0.0618) maintained consistent performance. Conversely, the decision tree (Brier score = 0.0945) and random forest (Brier score=0.0515) models demonstrated higher Brier scores, indicating less optimal calibration. In the test set (Figure 5C), logistic regression achieved the lowest Brier score (0.0301), suggesting the highest agreement between predicted and observed outcomes. Stacking (Brier score = 0.0430), random forest (Brier score = 0.0600), and XGBoost (Brier score = 0.0361) also displayed acceptable calibration. Overall, both logistic regression and stacking showed the most consistent and reliable calibration performance across all three data partitions.
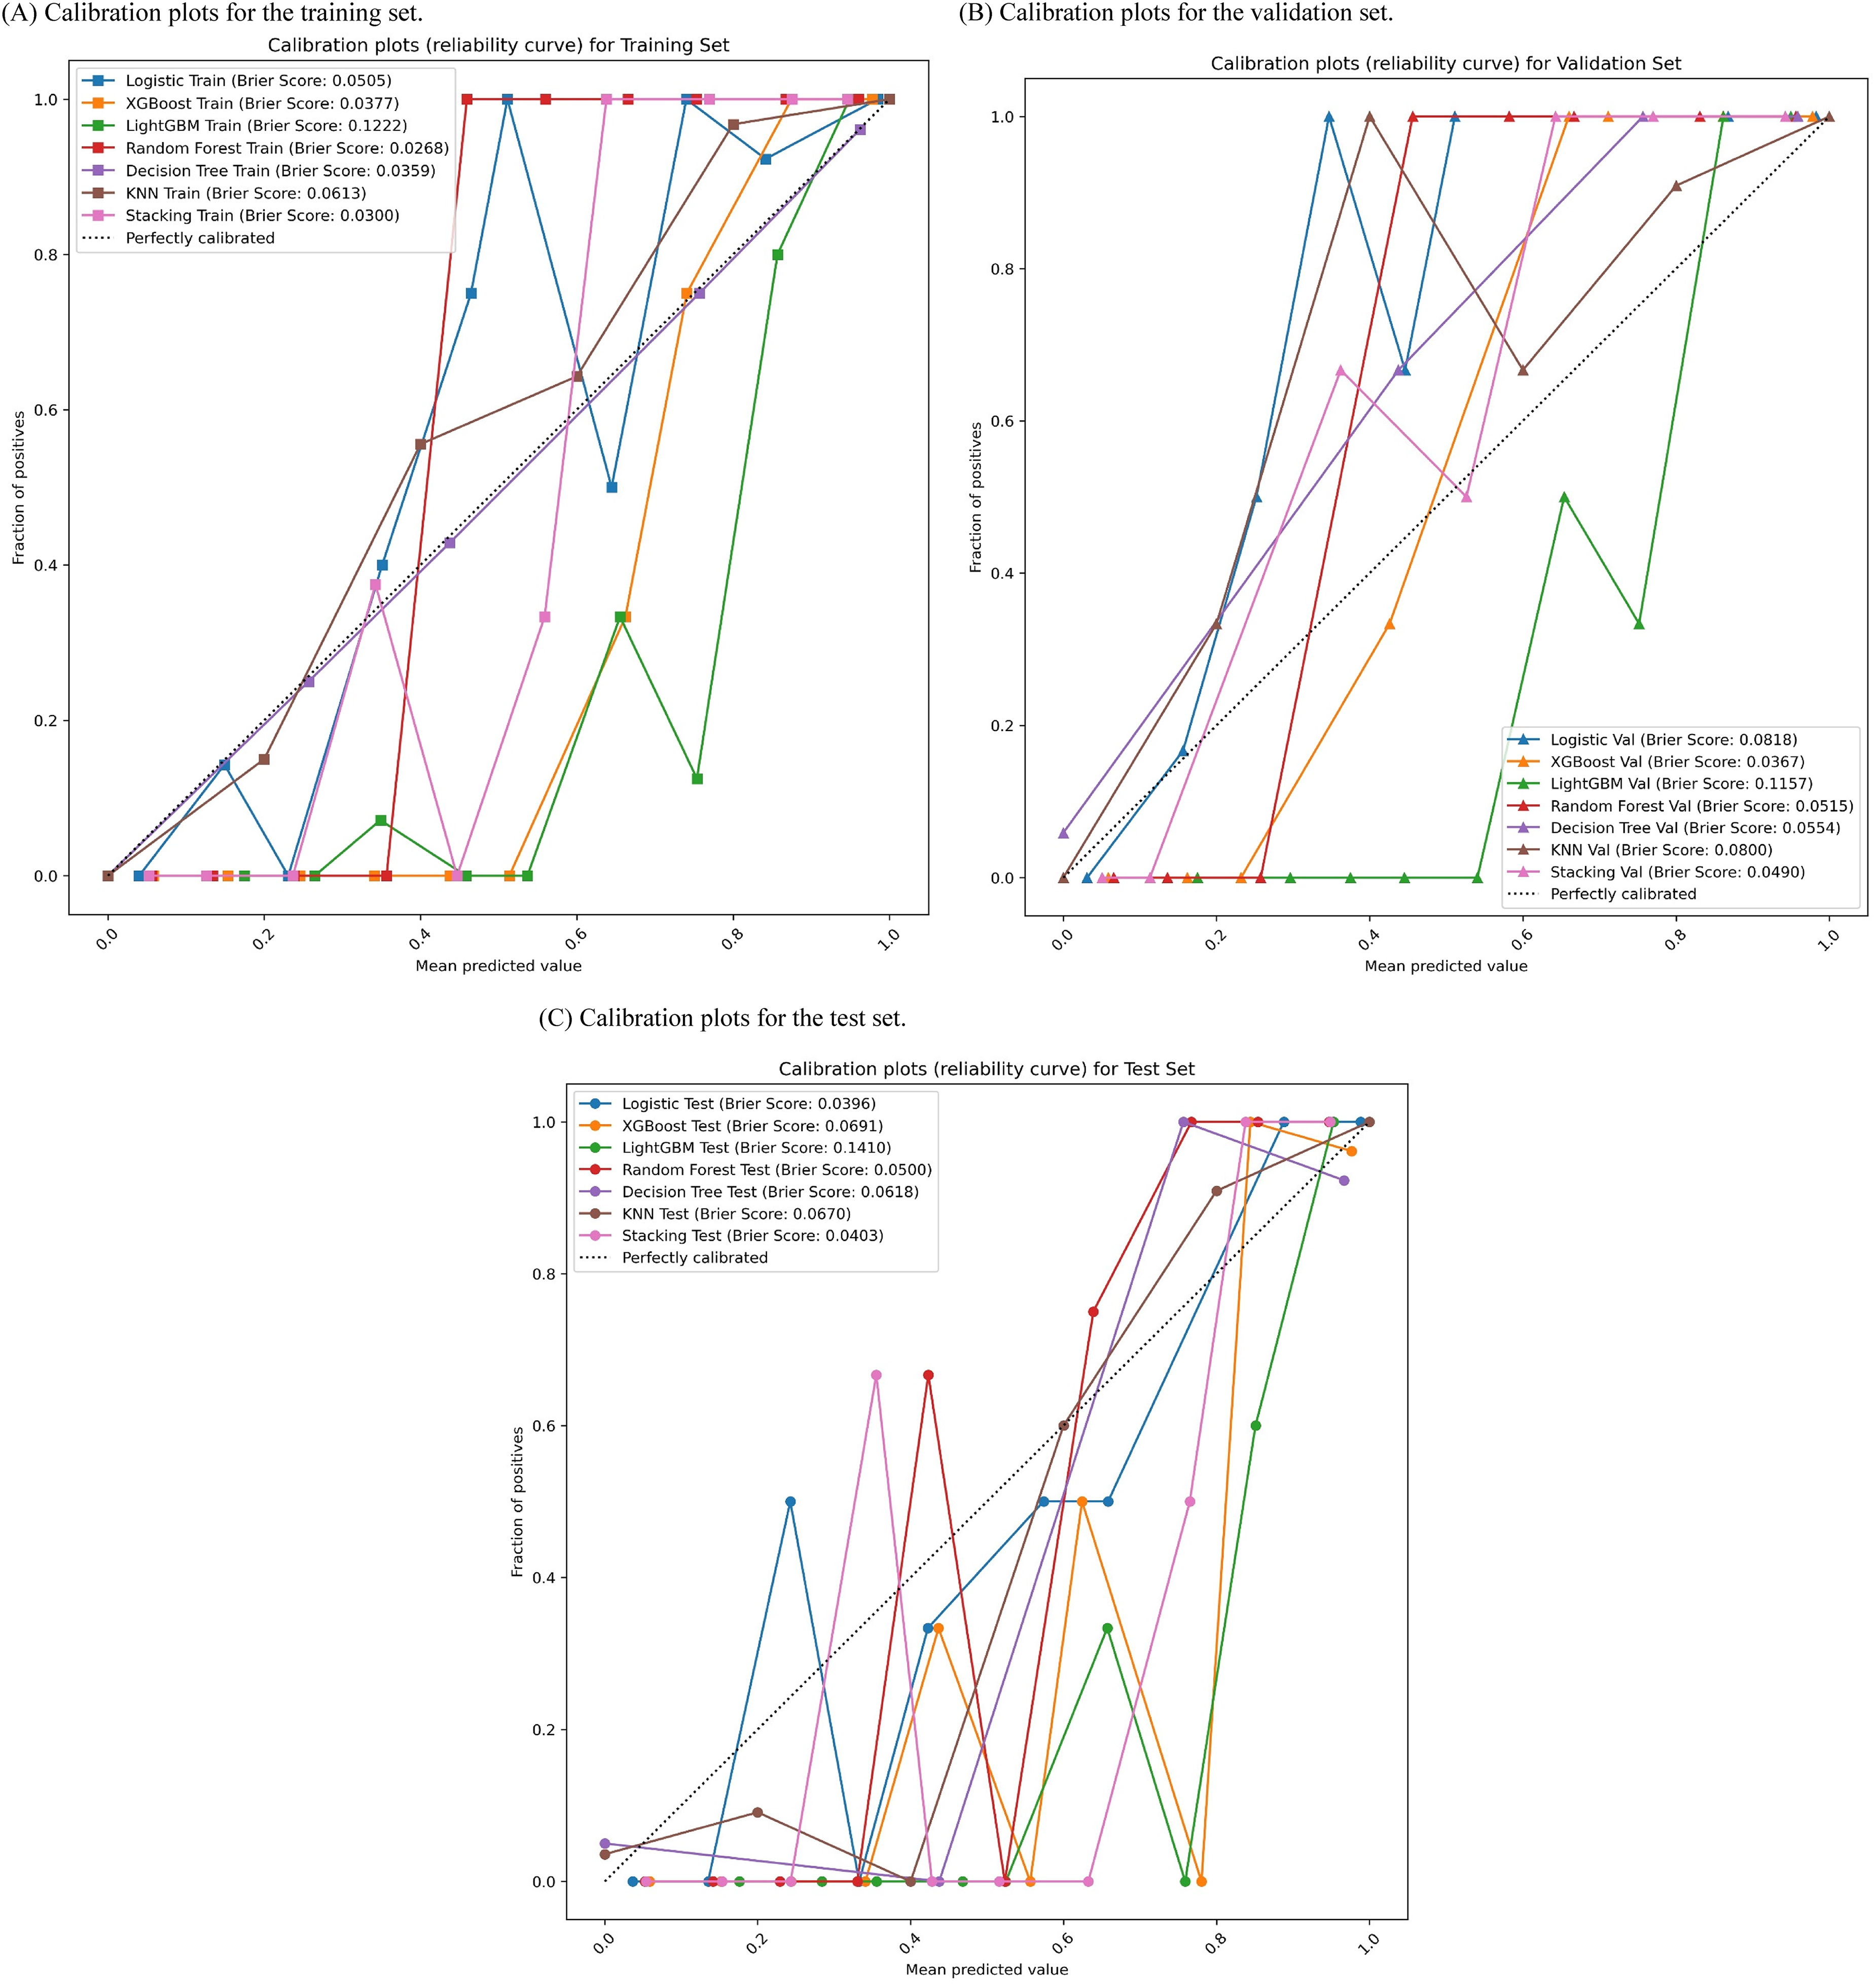
Calibration curves evaluating the concordance between predicted and observed PSA probabilities across three sets: the training set (Panel A), the validation set (Panel B), and the test set (Panel C). The dashed lines in the figures indicate perfect calibration, with Brier scores included for quantitative calibration evaluation. XGBoost: extreme gradient boosting; LightGBM: light gradient boosting machine; KNN: K-nearest neighbor.
DCA of the PSA risk prediction models
DCA was utilized to evaluate the net clinical benefit of each model at various threshold probabilities (Figure 6). In the training set (Figure 6A), the stacking model exhibited the highest net benefit across most probability thresholds (AUC = 0.998, ΔAUC = 0.0011), closely followed by XGBoost (AUC = 0.997) and LightGBM (AUC = 0.996), indicating significant clinical promise during model training. In the validation set (Figure 6B), the logistic regression model demonstrated superior net benefit within specific threshold ranges (AUC = 0.879, ΔAUC = 0.0016), while the stacking and XGBoost models maintained consistent performance. All three models surpassed the “treat-all” and “treat-none” strategies within the 0.2–0.7 threshold range, underscoring their favorable generalizability. In the test set (Figure 6C), the stacking model maintained its superiority (AUC = 0.933), with enhanced net benefit across the 0.3–0.8 threshold range. The logistic regression and XGBoost models also demonstrated substantial clinical utility (AUC = 0.926 and 0.930, respectively). Overall, the stacking model exhibited the most consistently advantageous DCA curves across all datasets, underscoring its robust clinical relevance.

Decision curve analysis (DCA) assessing the clinical net benefit of PSA prediction models across three sets: the training set (Panel A), validation set (Panel B), and test set (Panel C). This analysis depicts the model's performance across various threshold probabilities in comparison to “treat-all” and “treat-none” strategies. PSA: poststroke anxiety; XGBoost: extreme gradient boosting; LightGBM: light gradient boosting machine; KNN: K-nearest neighbor.
PR curve analysis
PR curves were utilized to evaluate model performance in the presence of class imbalance across the training, validation, and test sets (Figure 3). These curves depict the trade-off between precision and recall, a critical consideration given the modest class distribution between PSA and non-PSA instances in the dataset (109 vs. 129). Notably, both logistic regression and stacking models consistently demonstrated the highest average precision across all dataset partitions, indicating robust predictive performance in detecting PSA cases while minimizing false positives. These findings are consistent with results from ROC and DCA, highlighting the logistic regression model's superior generalizability and practical utility.
Model interpretation using SHAP
Figure 7 utilizes SHAP to explicate the logistic regression model, identifying crucial features influencing PSA prediction. In Figure 7A, recurrent stroke emerges as the most substantial positive predictor, exhibiting the highest SHAP values and a robust positive correlation with predicted PSA risk. Other noteworthy factors include hypertension, NIHSS score, sleep quality, working status, income level, and overwork. The majority of features demonstrate a direct relationship between higher values and increased risk, emphasizing their significance as PSA risk determinants. Figure 7B ranks the average SHAP importance, underscoring recurrent stroke, hypertension, NIHSS score, sleep disturbance, and working status as the primary contributors. These results underscore the model's focus on neurological function, comorbidities, and psychosocial aspects in risk evaluation.

SHAP summary plots for the logistic regression model. Panel A illustrates SHAP value distributions, indicating the direction and impact of each feature. Panel B ranks global feature importance based on mean absolute SHAP values. SHAP: Shapley Additive Explanations; NIHSS: National Institutes of Health Stroke Scale; BI: Barthel index; APTT: activated partial thromboplastin time; FIB: fibrinogen; TC: total cholesterol; LDL: low-density lipoprotein; WBC: white blood cell.
Figure 8 displays local SHAP explanations for six representative patients, demonstrating that distinct variables predominantly influenced PSA predictions for each individual. The key features identified were recurrent stroke, hypertension, NIHSS score, sleep quality, employment, and income. Notably, in Samples 1 and 2, “recurrent stroke” and “sleep disturbance” positively contributed significantly, while “hypertension” and “NIHSS score” made negative contributions in Sample 2. These personalized SHAP profiles highlight the model's capacity for tailored prediction and adjustment based on individual patient data, aligning with the principles of precision medicine. This individual-level elucidation advocates for the utilization of SHAP-guided model interpretation as a potential tool for clinical decision-making. Additionally, a normalized SHAP heatmap (refer to Supplementary Figure 1) offers a comparative summary of feature contributions across various ML algorithms, revealing consistent importance patterns for recurrent stroke, NIHSS, hypertension, and sleep across the models.
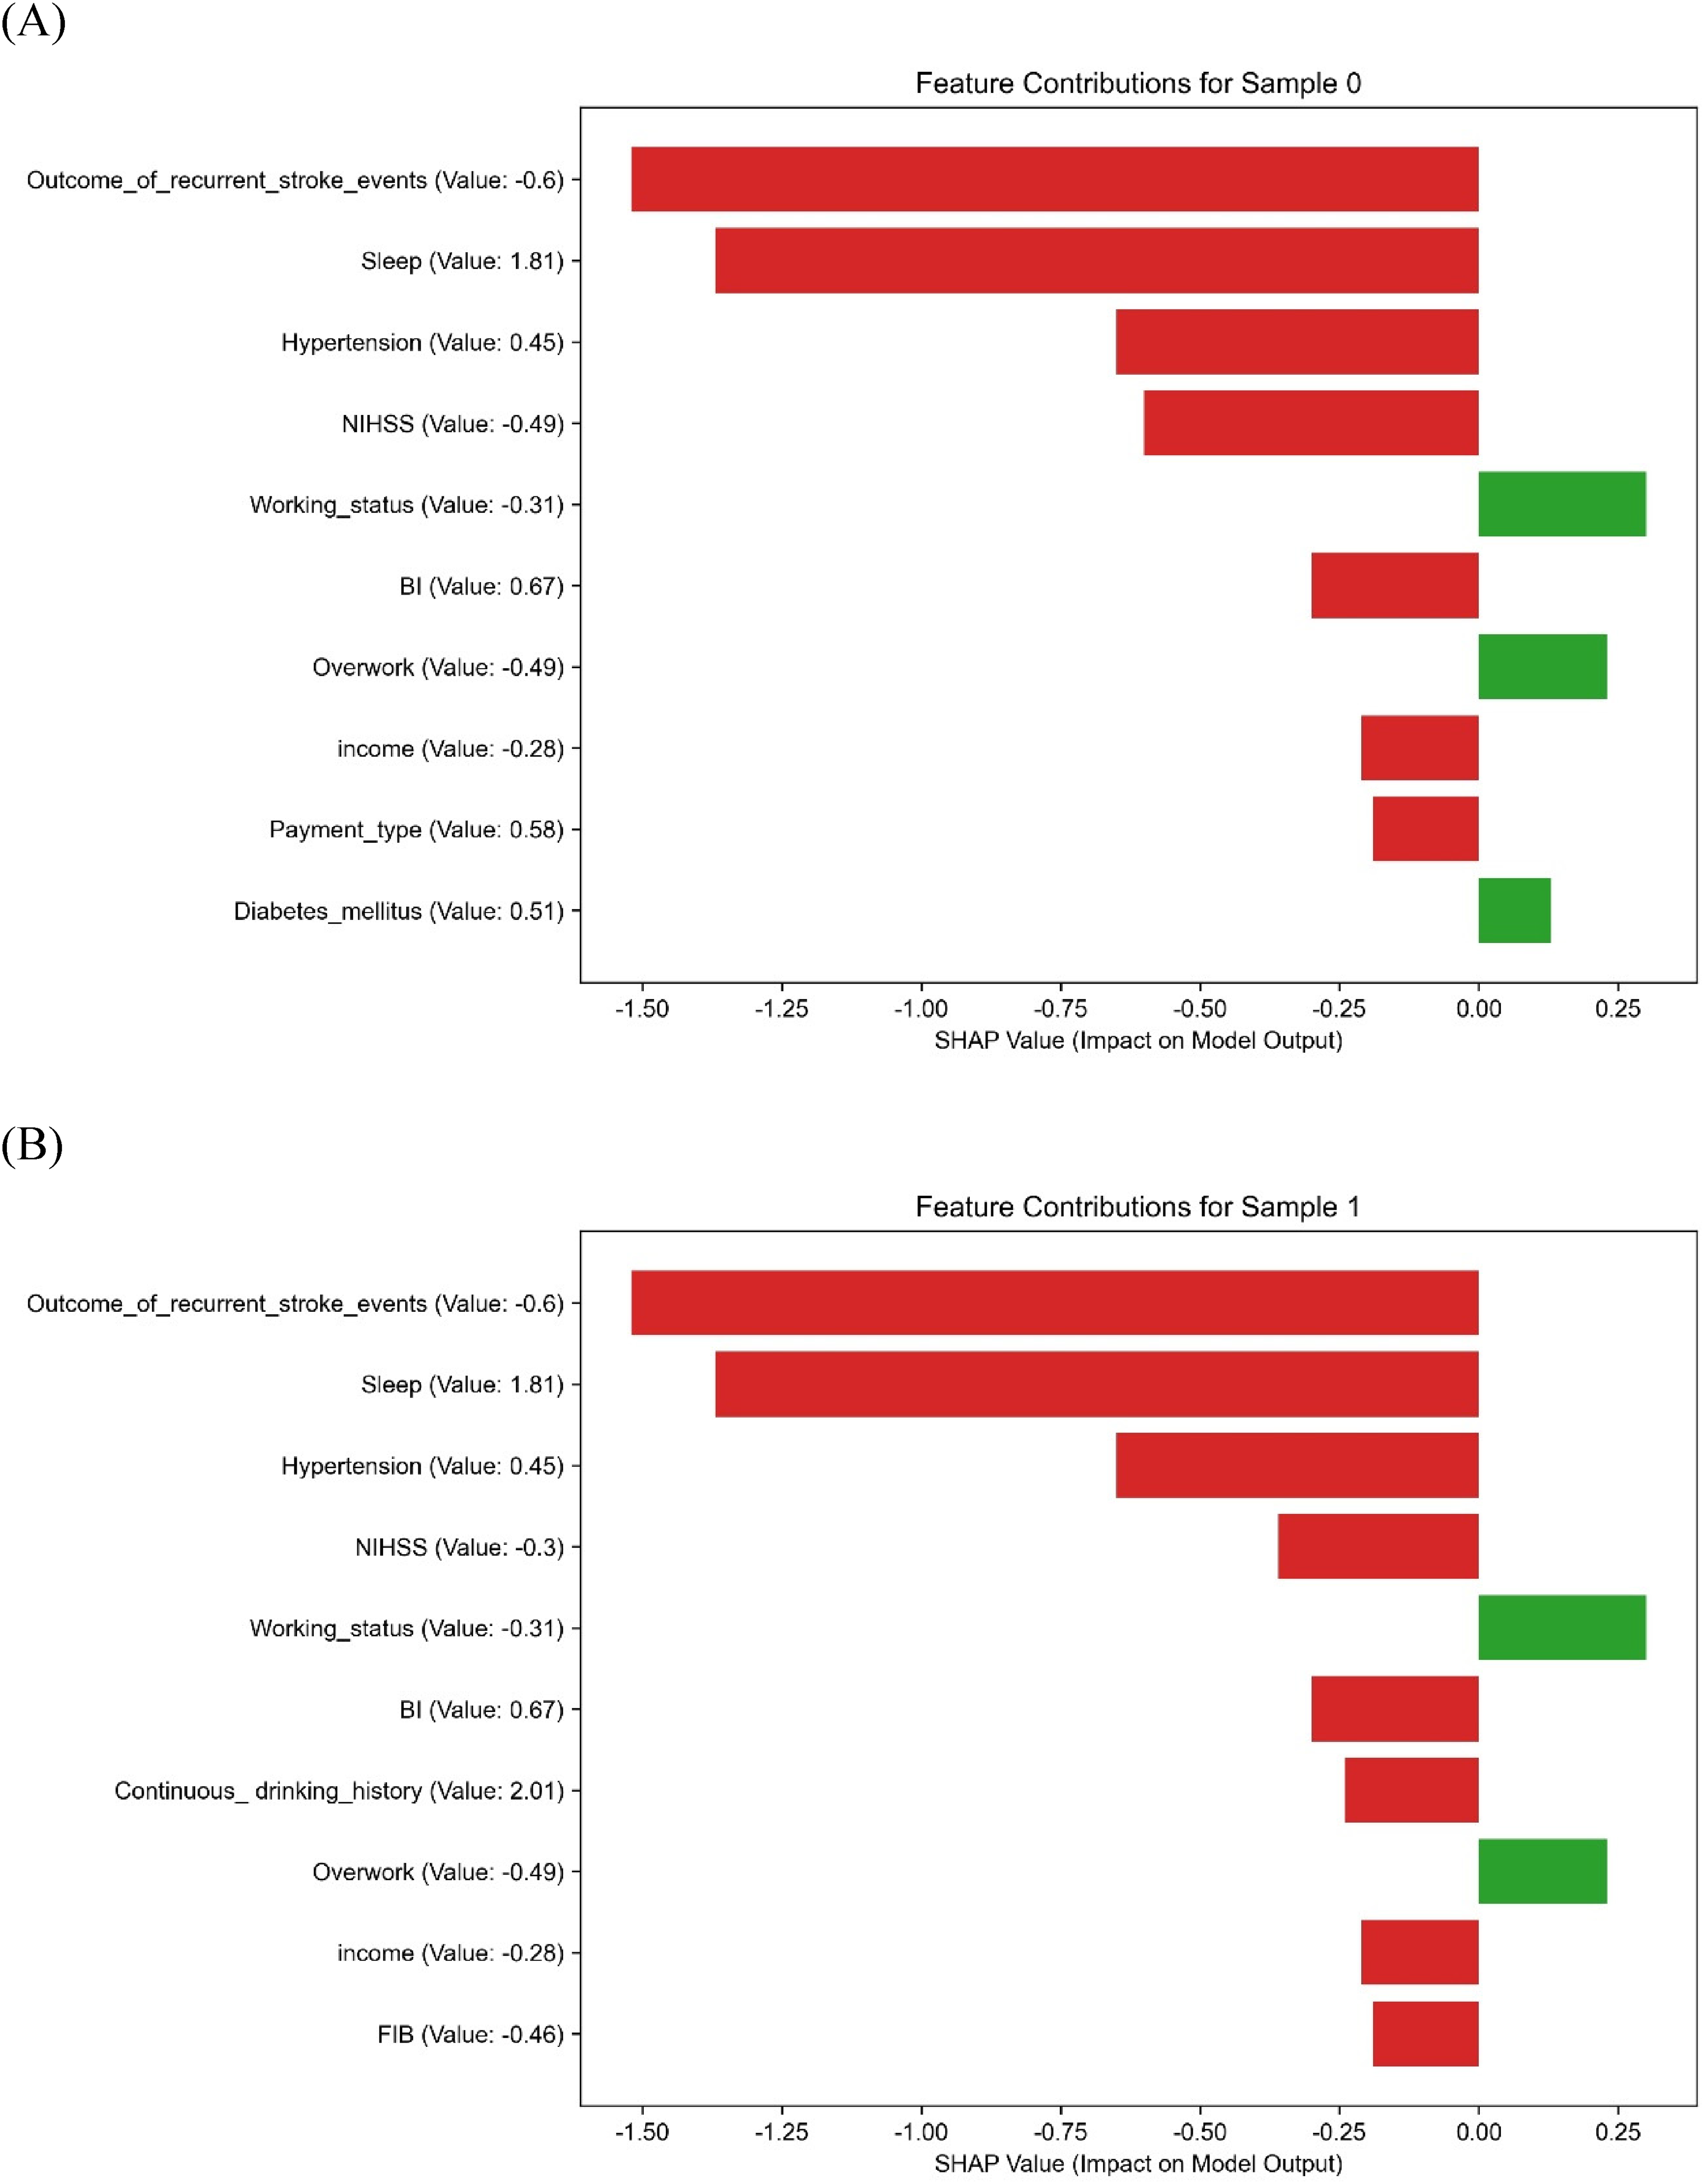
SHAP force plots providing personalized prediction explanations for six selected patients. Panels A to F display the predominant feature contributions for each patient, reflecting personalized PSA risk factors with directional indicators. SHAP: Shapley Additive Explanations; PSA: poststroke anxiety; NIHSS: National Institutes of Health Stroke Scale; BI: Barthel index; FIB: fibrinogen; APTT: activated partial thromboplastin time; TC: total cholesterol; LDL: low-density lipoprotein.
Visualization of the PSA risk prediction model
A nomogram was constructed based on the final logistic regression model, incorporating 10 SHAP-ranked predictors (NIHSS score, BI, LDL, APTT, income level, diabetes status, sleep quality, WBC, FIB, and hyperlipidemia) (Figure 9). The selection from the top 15 SHAP-ranked features followed three guiding principles: (i) minimizing redundancy, (ii) prioritizing clinical usability, and (iii) preserving predictive performance, in line with recent guidance for clinically deployable prediction models.12–15

A nomogram illustrating the final logistic regression model incorporating 10 essential features. This tool enables clinicians to assess an individual's PSA risk by aggregating scores corresponding to specific variables along the top axis and correlating them with the probability of anxiety on the bottom scale. PSA: poststroke anxiety; SHAP: Shapley Additive Explanations; NIHSS: National Institutes of Health Stroke Scale; BI: Barthel index; LDL: low-density lipoprotein; APTT: activated partial thromboplastin time; WBC: white blood cell; FIB: fibrinogen.
Rationale for excluding certain high-importance features (e.g. recurrent stroke)
Although recurrent stroke ranked highly in the global SHAP importance plot (Figure 7B), both the dependence plot (Figure 7A) and patient-level SHAP explanations (Figure 8A–F) showed that its predictive contribution substantially overlapped with NIHSS. For example, in several representative patients (Figure 8), the presence of recurrent stroke was accompanied by high NIHSS scores, and the SHAP contribution of recurrent stroke diminished once NIHSS was included. This reflects a clinical reality: recurrent strokes usually manifest with greater neurological deficits, which are already quantified by NIHSS at admission. Thus, NIHSS was retained as the more practical severity measure, while recurrent stroke was excluded to avoid redundancy and improve bedside feasibility.
Representative feature selection
For groups of highly correlated laboratory variables, we retained the most clinically informative and interpretable indicators. For instance, LDL was chosen over TC, as LDL is not only a central therapeutic target in secondary prevention of vascular disease but also more directly associated with atherosclerotic burden and disease progression. This ensures that the nomogram remains both statistically stable and clinically meaningful. 13
Parsimony with preserved performance and utility
The simplified 10-feature nomogram achieved almost identical discrimination compared with the 15-feature model (test AUC 0.981 vs. 0.983; sensitivity 0.867 vs. 0.872; specificity 0.952 vs. 0.948). DCA further demonstrated a higher net benefit for the simplified model across clinically relevant thresholds, underscoring its real-world utility. 12 Supplementary Figure 1 confirmed that the retained predictors were consistently important across multiple algorithms, supporting the robustness of feature selection.
Each predictor corresponds to a scoring axis, where the patient's feature value maps onto the “Points” axis to generate an individual score. The total score is then translated into a personalized probability of PSA on the “Total Points” and “Probability of Anxiety” axes. This nomogram functions as an intuitive bedside tool, enabling clinicians to perform rapid risk evaluation and tailor intervention strategies accordingly.
Discussion
This pioneering multicenter study integrates various demographic, clinical, biochemical, psychosocial, and stroke-related factors to establish and validate multiple ML models for predicting PSA. Although the stacking model exhibited marginally superior predictive efficacy during training and validation phases, its performance fluctuated in the test dataset, suggesting potential overfitting. Despite several models achieving nearly flawless AUC values during training, we implemented LASSO feature selection, L2 regularization, complexity control (e.g. max_depth), and cross-validation techniques to enhance model robustness and generalizability. The conclusive findings indicated that logistic regression and random forest models demonstrated the most consistent performance in the test dataset, affirming the effectiveness of our overfitting prevention strategies. Given the intricate nature and limited interpretability of the stacking model, logistic regression was selected for its simplicity and high explicability, enabling the construction of a nomogram to enhance clinical applicability.
Despite the small sample size of the test set (approximately 36 cases), we utilized fivefold cross-validation and hyperparameter optimization using GridSearchCV during model training to mitigate bias stemming from singular random splits. Additionally, we maintained the independence of the validation and test sets to uphold evaluation objectivity and stability. Subsequent studies should aim to augment the sample size and incorporate more rigorous validation techniques, such as nested cross-validation or external validation, to bolster the robustness of model testing.
The SHAP analysis offered a comprehensive explanation of the contribution of each feature to the prediction of PSA, effectively emphasizing significant influencing variables. Notably, recurrent stroke events, hypertension, and NIHSS scores were identified as impactful predictors with notably positive SHAP values, consistent with prior pathophysiological investigations. The occurrence of recurrent strokes may heighten the risk of PSA by instigating neuroinflammatory responses and compromising endothelial function. 16 Concurrently, chronic hypertension could disturb cerebral perfusion and metabolic equilibrium, thereby influencing emotional regulation. 17 Furthermore, NIHSS scores mirror neurological impairments strongly associated with the development of anxiety. 18
Sleep quality and income level are recognized as important psychosocial risk factors. Sleep disruptions can disturb the balance of neurotransmitters and neuroendocrine systems, increasing vulnerability to anxiety. 19 Likewise, lower income can exacerbate financial stress, leading to heightened emotional distress. 20 These results underscore the potential effectiveness of holistic interventions, including improving sleep and providing socioeconomic assistance, as novel approaches to addressing psychosocial adversity.
We found that specific biochemical markers, such as homocysteine, WBC, LDL, and FIB, demonstrated elevated SHAP values, suggesting potential roles in neurotoxicity, low-grade inflammation, and possibly endothelial dysfunction. Recent reviews and observational studies report associations between these biomarkers and endothelial functional impairment in stroke or vascular brain injury settings.21,22 These markers could contribute to destabilization of neuropsychiatric status following a stroke, providing a biological basis for PSA risk and potential therapeutic targets. Discrepancies in predictor importance among studies may stem from regional, age-related, or comorbidity-specific variations, underscoring the need for further investigation.
The nomogram, developed using the top 10 features ranked by SHAP values, demonstrated robust clinical utility and interpretability. This tool enables clinicians to promptly assess individual PSA risk and implement tailored interventions for high-risk individuals. While the stacking model exhibited strong performance during training, the logistic model presented enhanced interpretability and stability, better suited to the current sample size and feature complexity. Subsequent studies could explore integrating DL or multimodal interpretation approaches to augment both performance and clinical relevance.
This study presents several key strengths: (1) the utilization of real-world, multicenter data enhances the external generalizability of the model; (2) integration of multidimensional variables spanning clinical, biochemical, and psychosocial domains offers a comprehensive insight into PSA risk; and (3) implementation of SHAP and nomogram visualization techniques improves model interpretability and facilitates practical application.
Several limitations must be acknowledged. Firstly, the relatively small sample size, particularly within the PSA group (n = 109), may have restricted the generalizability of the findings. Although we applied strategies such as LASSO regression, regularization, and cross-validation to mitigate bias, the possibility of overfitting cannot be fully excluded. In particular, the perfect training performance observed in the stacking model (AUC = 1.00) suggests a risk of overfitting, which reinforces our decision to select logistic regression as the final model due to its superior interpretability and more stable generalization across datasets. Secondly, external validation is still lacking, and it is imperative to conduct larger, multicenter, and prospective studies to further evaluate the robustness and transferability of the model. Thirdly, although certain psychosocial features were considered, others such as social support and major life events were not included. Future studies should incorporate comprehensive psychosocial evaluations using standardized tools to improve the model's predictive precision and clinical applicability.
Conclusion
In this multicenter retrospective study, we developed and validated an interpretable ML model for predicting PSA. The model, based on logistic regression and enhanced by SHAP explainability and nomogram visualization, demonstrated high discrimination (AUC = 0.981 on the test set), good calibration, and consistent performance across multiple datasets.
Compared with more complex ensemble methods, the logistic regression model achieved comparable accuracy while maintaining simplicity, interpretability, and clinical applicability. By integrating demographic, clinical, psychosocial, and laboratory indicators, the model highlights the multifactorial nature of PSA risk.
This tool may provide clinicians with a practical instrument for early risk stratification and individualized intervention, thereby promoting precision medicine in stroke rehabilitation. Future prospective and externally validated studies are warranted to further confirm its generalizability.
Footnotes
Abbreviations
Acknowledgements
We express our gratitude to all collaborating institutions for their assistance in sharing clinical data and providing ethical oversight.
Ethical approval
Approval for this retrospective multicenter study was obtained from the Ethics Committee of The First Affiliated Hospital of Henan University of Chinese Medicine (approval number: 2024HL-457). As the coordinating institution, it oversaw ethical compliance across all 10 participating centers in accordance with the Guidelines for the Protection of Human Subject Research (2020 edition) issued by the National Health Commission of China and the Declaration of Helsinki.
Informed consent
Informed consent waiver rationale: The requirement for informed consent was waived because the study used only preexisting retrospective medical data, all of which were de-identified prior to analysis. No additional patient contact was conducted, and the study posed no risks to participants. Data de-identification protocols: To protect privacy, each center removed all direct identifiers (name, ID, contact information, admission and record numbers) from the dataset. Patients were assigned unique alphanumeric codes (e.g. ZZ-001, LY-002) for anonymization. The mapping file was password-protected, stored on an encrypted server accessible only to a designated data manager, and permanently destroyed after data verification. Source of psychosocial data: Psychosocial variables (income level, sleep quality, occupational stress, overwork) were extracted from routinely collected in-hospital records, including (1) admission assessment forms completed by nurses within 24 h of admission and (2) psychological evaluation records from clinical psychologists using validated tools (PSQI for sleep, Job Content Questionnaire (JCQ) for occupational stress). No retrospective patient contact was performed.
This process ensured strict compliance with national regulations and international ethical standards for retrospective medical research.
Contributorship
The study was designed and data collection supervised by Xiaoming Shen and Mengke Lyu. Data analysis was conducted by Min Li. Manuscript writing and revision were contributed by Mengke Lyu and Christian Hölscher. All authors have reviewed and approved the final manuscript.
Funding
The authors disclosed receipt of the following financial support for the research, authorship, and/or publication of this article: This research was financially supported by the National Natural Science Foundation of China (Grant Nos. 81303011 and 81973618).
Declaration of conflicting interests
The authors declared no potential conflicts of interest with respect to the research, authorship, and/or publication of this article.
Availability of data and materials
The datasets produced and/or scrutinized in this study are not publicly accessible to safeguard patient confidentiality and comply with institutional guidelines. However, interested parties may obtain the data from the corresponding author upon request.
Guarantor
Xiaoming Shen is the guarantor of this study and accepts full responsibility for the integrity of the data and the accuracy of the analysis.
Supplemental material
Supplemental material for this article is available online.