
Abstract
Background:
HIV testing is a cornerstone of prevention and care, yet disparities in testing uptake persist across populations. Traditional statistical approaches may not fully capture the non-linear interactions among sociodemographic, behavioral, and health-related factors influencing HIV testing. This study used explainable AI in addition to traditional epidemiological methods to identify determinants of lifetime HIV testing among adults in Tennessee, United States.
Methods:
This study applied both traditional epidemiological and machine learning (ML) techniques to predict lifetime HIV testing among 4911 (4 897 471 weighted) adults in Tennessee using the 2023 Behavioral Risk Factor Surveillance System (BRFSS) dataset. Sociodemographic, behavioral, and health-related characteristics were examined. A set of ML algorithms were trained using an 80/20 stratified train–test split, with fivefold stratified cross-validation applied within the training data. Model performance was evaluated on the unresampled test set using relevant metrics. SHAP and LIME were used for model interpretability.
Results:
The weighted prevalence of lifetime HIV testing was 38.8% among adults in Tennessee. Across ML models, Extreme Gradient Boosting (XGBoost) demonstrated the strongest overall discriminatory performance achieving the highest AUROC (0.718), PR-AUC (0.583), competitive performance across accuracy (0.694), precision (0.595), recall (0.447), and F1-score (0.511). The most influential predictors include age group, smoking status, veteran status, race/ethnicity, mental health status, marital status, income group, education level, physical health status, and sex.
Conclusion:
ML algorithms, particularly XGBoost, provide a robust and interpretable framework for predicting HIV testing behaviors in population-based survey data. Integrating ML with explainable AI methods can improve surveillance, support targeted interventions, and inform data-driven public health strategies.
Keywords
Background
Human immunodeficiency virus (HIV) remains a persistent public health challenge in the United States (U.S.) and globally. As of 2023, nearly 39.9 million people worldwide were living with HIV, including an estimated 1.2 million individuals in the U.S.1,2 Each year, approximately 38 000 new HIV diagnoses occur nationally, disproportionately affecting men who have sex with men (MSM), racial and ethnic minorities, and individuals in the Southern region of the U.S.3,4 In Tennessee, about 21 577 people were living with HIV in 2023, with a 14% increase in new diagnoses observed between 2018 and 2023. 5 The incidence of HIV in the same year was 12.7 per 100 000. 5 The proportion of adults aged 18 to 64 who reported ever testing for HIV in 2023 in Tennessee was 38.8%, nearly identical to the U.S. average of 38.7%. 6 Additionally, substantial racial disparities exist: 58.2% of Black adults reported ever testing compared to only 34.3% of White adults. 6 These disparities mirror national patterns, where Black/African American individuals account for 38% of new HIV diagnoses despite representing a smaller proportion of the population. 3
Despite significant medical advances in prevention and treatment, undiagnosed HIV infection continues to drive the epidemic. Nationally, 13% of individuals with HIV remain unaware of their status, contributing to an estimated 38% of new transmissions. 7 HIV testing is therefore considered the cornerstone of prevention and care, as timely diagnosis facilitates initiation of antiretroviral therapy, improves health outcomes, and reduces onward transmission.8,9 The U.S. Preventive Services Task Force (USPSTF) and the Centers for Disease Control and Prevention (CDC) recommend that all individuals aged 13 to 64 receive at least 1 lifetime HIV test, with annual testing for those at increased risk, including MSM, people who inject drugs, and racial/ethnic minorities in high-prevalence settings.10-12 Yet, despite these national guidelines, testing uptake remains suboptimal. National data show that fewer than half of U.S. adults have ever been tested for HIV, and disparities in testing persist across sociodemographic groups.6,13
The geographic distribution of HIV in the U.S. further underscores Tennessee’s importance in the national HIV response. The Southern region carries the greatest burden of HIV, accounting for 51% to 53% of all cases nationally, with the Deep South, Alabama, Florida, Georgia, Louisiana, Mississippi, North Carolina, South Carolina, Tennessee, and Texas, experiencing the highest diagnosis rates.14,15 In this region, HIV outcomes are consistently worse compared to other parts of the country, with higher late diagnosis rates and poorer linkage to care.16-18 National policy initiatives have recognized the urgency of addressing HIV in the South. The federal “Ending the HIV Epidemic in the U.S.” (EHE) initiative aims to reduce new HIV infections by 75% by 2025 and 90% by 2030 through scaling up testing, prevention, and treatment strategies. 19 Similarly, Healthy People 2030 emphasizes increasing the proportion of people who know their HIV status and reducing new infections. 20 Monitoring state-level testing trends is, therefore, critical to assess progress toward these goals.
State-specific barriers and policies, however, play a critical role in shaping HIV testing behaviors. Tennessee has not expanded Medicaid under the Affordable Care Act (ACA), leaving many low-income residents without routine access to preventive HIV screening.21,22 Evidence suggests that states that expanded Medicaid experienced significant increases in HIV testing compared to non-expansion states, where no such gains were observed. 21 Moreover, while Medicaid coverage of routine HIV testing is available in most states, gaps remain in several Southern states, including Tennessee, which limits access unless testing is deemed medically necessary. 23 These structural barriers compound existing disparities and reduce opportunities for early detection.
Recent policy decisions in Tennessee also highlight the tension between progress and setbacks in HIV prevention. For example, in 2023 the state removed HIV exposure from offenses requiring sex offender registration, a move likely to reduce stigma and encourage testing. 24 However, in the same year, Tennessee declined $6.2 million in CDC funding earmarked for HIV prevention among key populations, including MSM, transgender women, and heterosexual Black women, thereby reducing support for groups at highest risk. 25 These conflicting policy directions underscore the importance of evidence-based, targeted public health strategies to address testing disparities. Age-related differences in HIV testing also need attention. Older adults are increasingly affected by HIV, but are often diagnosed late, partly due to low testing rates.26,27 Studies using the Behavioral Risk Factor Surveillance System (BRFSS) have shown that testing prevalence declines with age, despite ongoing risk and clinical guidelines recommending routine testing through age 64. 28 Late diagnosis among older adults is associated with faster disease progression and higher rates of comorbidities, underscoring the need to understand and address testing determinants in this population.29,30
The BRFSS, the nation’s most comprehensive survey of health behaviors, provides critical data for monitoring HIV testing patterns across states and demographic groups. 31 Analyses of BRFSS data have demonstrated variations in HIV testing trends both nationally and within individual states.13,32,33 For Tennessee, Krueger et al 33 found a significant decline in the percentage of adults who reported ever testing between 2011 and 2017 using BRFSS, raising concerns about stagnation in testing uptake despite national prevention goals. More recent CDC surveillance indicates modest improvements, but overall progress remains insufficient to meet EHE and Healthy People 2030 targets. 12 Taken together, these findings highlight the utility of BRFSS to investigate the determinants of HIV testing at the state level, particularly in Tennessee, where structural barriers, policy gaps, and persistent disparities converge.
By leveraging explainable artificial intelligence (AI) methods, researchers can uncover complex, non-linear relationships between demographic, behavioral, and policy factors that influence testing behaviors.34,35 Such insights are essential for guiding targeted interventions, informing policy, and advancing equity in HIV prevention. This study builds on existing evidence by using BRFSS 2023 data to examine the determinants of lifetime HIV testing (defined as “Including fluid testing from your mouth, but not including tests you may have had for blood donation, have you ever been tested for HIV?”) among Tennessee adults. In doing so, it aims to generate actionable knowledge that supports policymakers and public health practitioners in designing tailored strategies to increase testing coverage, reduce disparities, and move closer to the national goal of ending the HIV epidemic.
Methods
Study Design and Data Source
This study applied a cross-sectional design using secondary data from the 2023 BRFSS, focusing specifically on adults residing in Tennessee. 31 The BRFSS is an annual, national- and state-based survey coordinated by the CDC in partnership with all U.S. states and territories. It collects self-reported information on health-related behaviors, preventive practices, and chronic health conditions among non-institutionalized adults aged 18 years and older through structured telephone interviews. 31 The 2023 BRFSS dataset was selected for its timeliness and inclusion of variables relevant to HIV testing, healthcare access, health behaviors, and sociodemographic factors. For this study, we extracted responses from Tennessee residents and restricted the sample to individuals with complete data on the outcome variable, self-reported lifetime HIV testing. After applying these inclusion criteria, the final analytic sample consisted of 4911 adults (4 897 471 weighted population). The study was conducted and reported in accordance with the Strengthening the Reporting of Observational Studies in Epidemiology (STROBE) guidelines. 36
Study Variables
The primary outcome variable in this study was lifetime HIV testing, defined by whether respondents reported ever been tested for HIV in their lifetime. This was measured using the BRFSS survey question: “Including fluid testing from your mouth, but not including tests you may have had for blood donation, have you ever been tested for HIV?” This measure is consistent with CDC and BRFSS protocols for monitoring HIV testing prevalence at both the state and national levels. In this paper, the terms “lifetime HIV testing” and “ever tested for HIV” are used interchangeably to enhance clarity of the text. A range of independent variables was selected based on prior research and theoretical relevance to HIV testing behaviors.6,13,33 These variables were grouped into 4 major domains. The first domain included sociodemographic characteristics such as age (categorized into 6 groups: 18-24, 25-34, 35-44, 45-54, 55-64, and 65+), sex (male or female), and race/ethnicity (White, Black, Hispanic, Other, or Multiracial). Additional sociodemographic indicators included marital status (married vs unmarried), educational attainment (less than high school, high school graduate, some college, and college graduate), employment status (employed vs unemployed), and annual household income (<$15k, $15-25k, $25-35k, $35-50k, $50-100k, $100-200k, and ≥$200k). Urbanicity, defined as urban versus rural residence, was also included to account for geographic differences in health care access and testing behavior.
The second domain captured healthcare access and utilization. This included variables such as health insurance coverage (insured vs not insured), healthcare affordability (whether respondents experienced cost-related barriers), and timing of the most recent medical check-up (within the past year, within the past 2 years, within the past 5 years, 5 or more years ago, or never). The third domain represented health status and comorbidities. Measures included self-rated general health (good/better vs fair/poor), body mass index (BMI: underweight, normal, overweight, or obese), number of chronic comorbidities (0, 1-2, or 3+), and disability burden (0, 1-2, or 3+). The comorbid conditions considered include High Blood Pressure, High Cholesterol, CHD or MI, Asthma, Arthritis, Stroke, Cancer, COPD, Depression, Kidney disease, and Diabetes. Respondents also reported the number of days in the past month they experienced poor physical health (0, 1-13, or ≥14 days) and poor mental health (0, 1-13, or ≥14 days). The fourth domain assessed health-related behaviors and psychosocial indicators. These included smoking status (every day, some days, former, or never), alcohol use in the past 30 days (yes vs no), physical activity in the past 30 days (yes vs no), veteran status (yes vs no), and self-reported wellbeing (good/better vs fair/poor; Supplemental Table 1).
Data Processing and Analysis
Data processing and analysis were performed using a comprehensive and structured analytical workflow. Initial exploratory and descriptive analyses were conducted using STATA 19.5BE to generate weighted frequency distributions, percentages, and summary statistics of study variables. The complex sampling design of the BRFSS was accounted for using the svyset commands. Bivariate relationships between the outcome and each predictor were examined using design-adjusted chi-square tests. Weighted crude odds ratios (CORs) and corresponding 95% confidence intervals (CIs) were estimated using bivariate logistic regression. Predictors associated at a liberal screening threshold (P ≤ .20) were retained via backward elimination for inclusion in the multivariable logistic regression model, from which adjusted odds ratios (AORs) and 95% CIs were derived. 37 Statistical significance was defined at P ≤ .05, with P ≤ .001 indicating high statistical significance.
The primary analytical procedures were then carried out in a Google Colab Python 3.12.12 environment. A suite of data science libraries, Pandas 2.2.2, NumPy 2.0.2, Scikit-learn 1.6.1, SciPy 1.16.3, Matplotlib 3.10.0, Seaborn 0.13.2, and SHAP 0.50.0, was utilized to facilitate data cleaning, transformation, exploratory visualization, model development, and interpretation of results. These tools also enabled the implementation of ML algorithms and explainable ML methods to assess the feature importance of predicting lifetime HIV testing (Figure 1).

Machine learning workflow for predicting lifetime HIV testing.
Data Pre-processing and Handling Missingness
The raw 2023 BRFSS dataset was subjected to a structured pre-processing phase to ensure data quality and readiness for analysis. As most study variables were categorical, normalization was not necessary. Outliers and rare response categories were examined; categories with very small frequencies were merged with similar groups. Specifically, measures of comorbidity and functional disability were combined to construct categorical variables representing the total number of reported conditions within each respective domain. Data cleaning steps included recoding variables for interpretability, ensuring consistent labeling across categories, and managing missing data. The proportion of missing data varied by variable, ranging from 0.02% for comorbidity burden to 16.5% for income group; apart from income, all other variables had less than 5.8% missing observations (Supplemental Table 2). Based on these low to moderate levels of missingness, missing values were imputed using the mode of each variable to preserve data integrity. Additionally, some variables were restructured into broader categories (eg, age groups and comorbidity counts) to improve model interpretability and enhance analytical robustness. This process streamlined the dataset while retaining key sociodemographic, behavioral, and health-related information relevant to HIV testing.
Addressing Class Imbalance Using Synthetic Minority Over-sampling Technique (SMOTE)
Exploratory analysis revealed a substantial imbalance in the outcome variable, with 3155 respondents (64.2%) reporting no history of HIV testing compared to 1756 respondents (35.8%) who reported ever being tested. To reduce potential bias toward the majority class, the dataset was first partitioned into training (80%) and testing (20%) subsets. The Synthetic Minority Over-sampling Technique (SMOTE) was applied exclusively to the training data, while the holdout test set was left unchanged to maintain its original class distribution and allow for an unbiased evaluation of model generalizability. Following resampling, the training dataset achieved balanced class representation through the generation of synthetic minority-class observations via interpolation between existing cases. This approach reduces model bias toward the majority class and enhances the ability of ML models to detect patterns associated with both tested and never-tested individuals.
Feature Selection
A systematic feature selection strategy was undertaken to identify the most relevant predictors of lifetime HIV testing among Tennessee adults. Exploratory data analysis (EDA), including descriptive summaries and visualizations, was first used to examine variable distributions and potential associations with HIV testing status. Bivariate analyses were then conducted to evaluate the direction and strength of relationships between individual predictors and the outcome variable. Also, for the epidemiological analysis in Stata, backward elimination (P ≤ .20) was used to retain potentially informative variables for the adjusted model. For the ML modeling, to further refine the predictor set, Cramer’s V statistic was employed to assess associations among categorical predictors, helping detect multicollinearity. Recursive Feature Elimination (RFE) was applied to iteratively remove less informative variables while building and evaluating the ML models, thereby enhancing model efficiency and reducing redundancy. By combining statistical approaches, ML techniques, and guidance from previous research, a robust and interpretable set of features was selected for model development.
Feature Importance
To interpret the contribution of individual predictors to lifetime HIV testing, we applied SHapley Additive exPlanations (SHAP) and Local Interpretable Model-agnostic Explanations (LIME), model-agnostic interpretability frameworks. SHAP values quantified the influence of each predictor on the model’s output, providing consistent importance scores across variables. 38 This approach allowed us to identify which sociodemographic, behavioral, or health-related factors had the greatest impact on predicting whether an individual had ever been tested for HIV. SHAP beeswarm and bar plots were used to summarize feature importance and their distributional effects. To improve interpretability, SHAP values were examined at both the encoded feature level and the aggregated variable level (one-hot-encoded categories recombined into their original predictors). LIME Local Feature Importance and SHAP Waterfall Plot were employed to generate individual-level interpretability, highlighting how specific features either supported or opposed the prediction of ever having been tested for HIV. 38
Model Development and Optimization
Given the complex and multifactorial nature of HIV testing behaviors, we employed a diverse suite of ML algorithms spanning different modeling paradigms. The models included Logistic Regression (linear baseline classifier), Support Vector Machine (SVM; kernel-based method for non-linear relationships), probabilistic (Naïve Bayes), Decision Tree and Random Forest (tree-based models capturing hierarchical decision rules and ensemble averaging), K-Nearest Neighbors (KNN; distance-based classification), and boosting algorithms including XGBoost and Gradient Boosting Machine (GBM; iterative ensemble methods that sequentially improve predictive accuracy). This integrated modeling approach facilitated a systematic comparison of predictive performance across multiple algorithms. Models were initially fit using default hyperparameters, with additional tuning performed as needed through grid search coupled with fivefold stratified cross-validation to optimize performance (Supplemental Table 3). All algorithms were developed within a unified preprocessing pipeline and trained on the SMOTE-balanced training dataset.
Logistic Regression served as the baseline model for its interpretability and straightforward estimation of odds. SVM was incorporated for its flexibility in handling non-linear associations through kernel functions. 39 Decision Trees and Random Forest were chosen for their ability to capture complex interactions among variables, with Random Forest reducing variance through ensemble averaging. 39 KNN classified observations based on proximity in feature space, providing a non-parametric benchmark. 39 Finally, boosting methods such as GBM and XGBoost were included for their strength in reducing bias and variance by correcting errors iteratively. 39 Each model was evaluated using key classification metrics, including accuracy, precision, recall, F1-score, balanced accuracy, PR-AUC, and AUROC. Additionally, models were compared based on their capacity to identify and rank the most influential predictors of HIV testing, thereby combining predictive power with interpretability.
Model Training and Evaluation
To ensure reliable model performance, the dataset was randomly partitioned into a training set (80%) and a testing set (20%) using stratified sampling to maintain the underlying distribution of lifetime HIV testing status. All ML models were trained using the SMOTE-balanced training dataset and subsequently evaluated on the unmodified holdout test set to ensure an unbiased assessment of predictive performance. Model performance was assessed using a suite of evaluation metrics, including accuracy, precision, recall, F1-score, balanced accuracy, the Precision-Recall Area Under the Curve (PR-AUC), the Area Under the Receiver Operating Characteristic Curve (AUROC), and confusion matrices to capture classification quality across both “ever tested” and “never tested” groups. To strengthen generalizability and minimize the risk of overfitting, a stratified fivefold cross-validation (k = 5) was employed. This approach divided the dataset into 5 equal partitions while preserving the distribution of HIV testing outcomes in each fold. Each model was iteratively trained and validated across the folds, and the average of performance metrics was calculated to provide a stable and robust estimate of predictive capability.
Model Selection
Final model selection was based on a comparative evaluation of performance metrics across all ML algorithms. Confusion matrices were used to generate a detailed breakdown of predictions, categorizing them into true positives (TP), false positives (FP), true negatives (TN), and false negatives (FN). Accuracy was considered as an overall measure of correctly classified cases. Precision quantified the proportion of respondents predicted as “ever tested” who were truly in that category, while recall (sensitivity) assessed the ability of the model to correctly identify individuals who reported HIV testing. 40 The F1-score, which represents the harmonic mean of precision and recall, provided a balanced measure of performance under conditions of class imbalance. 41 In addition, the precision–recall area under the curve (PR-AUC) was evaluated to provide a more informative assessment of performance when the outcome was imbalanced. 41 By systematically comparing these performance indicators across all models, the algorithm that demonstrated the most favorable balance of accuracy, precision, F1-score, PR-AUC, and AUROC was identified as the final predictive model for lifetime HIV testing (Figure 1).
Results
Prevalence of Lifetime HIV Testing and Sociodemographic Characteristics
Table 1 presents the unweighted and weighted descriptive characteristics of the study population, representing an estimated 4.9 million adults in Tennessee based on BRFSS survey weights. Overall, 38.8% of adults reported ever been tested for HIV, while 61.2% reported no lifetime HIV testing. The weighted sample was evenly distributed by sex, with 52.0% female and 48.0% male. Adults aged 65 years and older constituted the largest age group (23.6%), followed by those aged 25 to 34 (16.9%) and 35 to 44 (16.2%). The population was predominantly White (72.7%), with Black adults comprising 14.0%, Hispanics 6.8%, and smaller proportions identifying as multiracial or other racial/ethnic groups. Approximately half of the respondents were married (50.3%), and the majority were employed (61.2%) and resided in urban areas (88.6%). Educational attainment was relatively high, with nearly 57% reporting some college education or higher, and 42.5% reporting annual household incomes between $50 000 and $100 000.
Descriptive Characteristics of Study Participants.

Health-related characteristics indicated a substantial burden of chronic conditions and risk factors. Most adults reported having health insurance (91.5%) and rated their overall health as good or better (76.9%). However, 41.6% were classified as obese, and nearly 45% reported at least 1 day of poor physical health, while 47.6% experienced poor mental health days in the past month. With respect to health behaviors, 58.9% were never smokers, and 47.7% reported alcohol use in the past 30 days. Most participants reported engaging in physical activity (74.4%), though 14.8% reported difficulty affording healthcare due to cost. A large majority had accessed healthcare recently, with 79.2% reporting a medical check-up within the past year. In terms of health burden, 42.8% reported 1 to 2 comorbid conditions, and 30.4% reported 3 or more, while 38.1% reported at least 1 functional disability, highlighting the complex health profiles of adults represented in the sample.
Predictors Associated With Lifetime HIV Testing
In crude analyses, several sociodemographic, behavioral, and health-related characteristics were significantly associated with lifetime HIV testing (Table 2). Compared with males, females had slightly higher odds of HIV testing (COR = 1.07; 95% CI: 0.91-1.25). Age demonstrated a strong gradient, with adults aged 25 to 34, 35 to 44, 45 to 54, and 55 to 64 years exhibiting significantly higher odds of testing relative to those aged 18 to 24, while adults aged 65 years and older had substantially lower odds (COR = 0.58; 95% CI: 0.41-0.59). Racial/ethnic differences were pronounced, as Black adults had more than twice the odds of ever testing compared with White adults (COR = 2.63; 95% CI: 2.07-3.34). Lower income groups showed higher crude odds of testing relative to those earning less than $15 000 annually, and unmarried adults were more likely to report HIV testing than married adults (COR = 1.38; 95% CI: 1.17-1.62). Behavioral and health-related factors also showed significant crude associations: everyday smokers served as the reference group, while never smokers had lower odds of testing (COR = 0.45; 95% CI: 0.35-0.58); individuals reporting poor mental health days, difficulty affording healthcare, or higher comorbidity and disability burden generally exhibited higher crude odds of HIV testing.
Bivariate and Logistic Regression Analysis (COR and AOR) of Factors Associated With Lifetime HIV Testing.

Abbreviations: CI, confidence interval; OR, odds ratio; Ref, reference group.
P-value ≤ .001. *P-value ≤ .05.
After adjustment for covariates, several associations remained robust, while others were attenuated (Table 2). Females had significantly higher odds of ever testing for HIV compared with males (AOR = 1.36; 95% CI: 1.13-1.64). Adults aged 25 to 34, 35 to 44, and 45 to 54 years continued to demonstrate elevated odds of testing relative to those aged 18 to 24, whereas adults aged 65 years and older remained significantly less likely to have ever tested (AOR = 0.42; 95% CI: 0.28-0.65). Black adults retained markedly higher odds of HIV testing compared with White adults (AOR = 2.80; 95% CI: 2.14-3.68). Income remained an important predictor, with higher income categories consistently associated with greater odds of testing. Unmarried status (AOR = 1.30; 95% CI: 1.06-1.59) and unemployment (AOR = 0.75; 95% CI: 0.59-0.95) were independently associated with testing behavior. Never smokers had significantly lower odds of testing than everyday smokers (AOR = 0.54; 95% CI: 0.40-0.72). Poor mental health days, higher comorbidity burden (3+ conditions: AOR = 1.68; 95% CI: 1.27-2.22), and difficulty affording healthcare due to cost (AOR = 0.65; 95% CI: 0.50-0.84) remained significant predictors. Veteran status was also independently associated with higher odds of ever HIV testing, underscoring the influence of healthcare system–level screening practices. Collectively, these adjusted results highlight the independent roles of age, race/ethnicity, socioeconomic status, mental health, and healthcare access in shaping lifetime HIV testing patterns among adults in Tennessee.
Class Imbalance Adjustment and Assessment of Predictor Associations
Figure 2 depicts the impact of applying the Synthetic Minority Over-sampling Technique (SMOTE) to the training dataset, demonstrating its effectiveness in correcting the substantial class imbalance in lifetime HIV testing status. Before resampling, individuals who reported ever having been tested for HIV represented a smaller share of the training sample compared with those who had never tested (1405 vs 2523). After SMOTE was implemented, the minority class was synthetically oversampled to achieve near parity with the majority class. Notably, SMOTE was applied only to the training data to improve the model’s ability to learn patterns associated with HIV testing while maintaining the original class distribution and integrity of the independent hold-out test set. The test dataset consisted of 983 respondents (632 never tested and 351 ever tested) and was reserved for final model evaluation. Figure 3 shows the Cramér’s V heatmap used to examine associations among the categorical predictors included in the analysis. In general, correlations between variables were weak to moderate, suggesting minimal overlap or redundancy among predictors. Relatively stronger associations were observed between age group and employment status; however, none of the correlations reached thresholds commonly associated with problematic multicollinearity (≥.7). These findings support the simultaneous inclusion of all predictors in both the traditional regression and ML models.
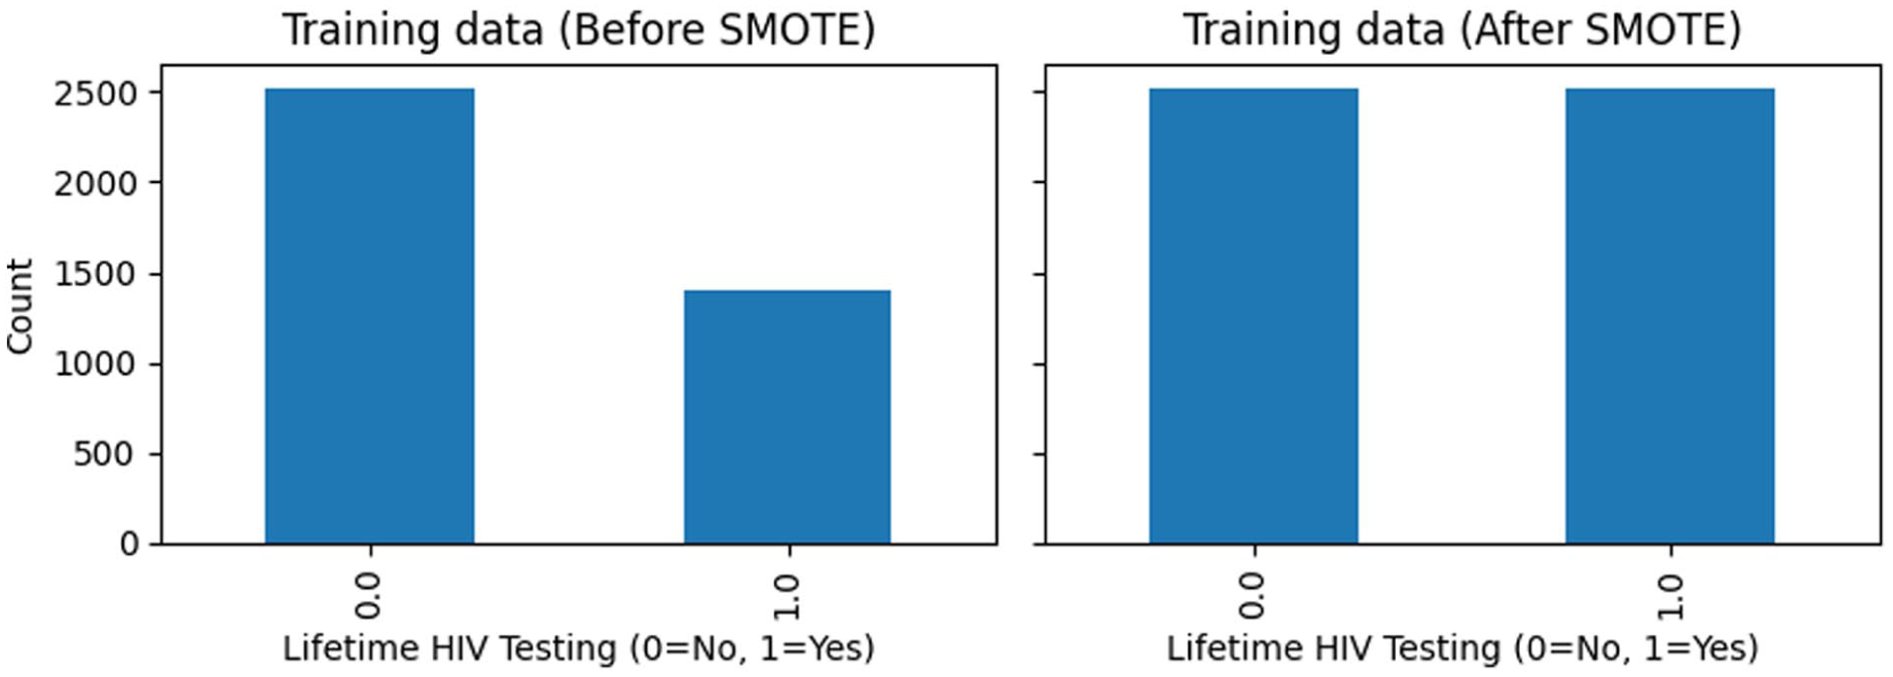
Impact of SMOTE on minority-class representation in the training dataset.

Strength of association between categorical predictors using Cramér’s V heatmap.
Model Performance and Evaluation
The performance of the 8 ML algorithms in predicting lifetime HIV testing is summarized in Table 3. Overall, model discrimination was moderate across approaches, with AUROC values ranging from 0.669 (KNN) to 0.718 (XGBoost). XGBoost achieved the highest AUROC (0.718) and one of the highest accuracy values (0.694), indicating the strongest overall ability to distinguish between individuals who had ever tested for HIV and those who had not. Decision Tree and Random Forest models also demonstrated relatively high accuracy (both 0.694 and 0.692, respectively), while Gradient Boosting showed a comparable AUROC (0.715). Logistic Regression and Naïve Bayes yielded similar overall performance, with balanced accuracy values of 0.651 and 0.637, respectively, and maintained higher recall compared with several ensemble models. KNN exhibited the lowest accuracy (0.614) and AUROC (0.669), suggesting limited discriminative capacity in this context. Across models, F1-scores ranged from 0.497 to 0.573, reflecting the trade-off between precision and recall in the presence of class imbalance.
Performance Evaluation Metrics and Confusion Matrix for ML Models Predicting Lifetime HIV Testing (Unresampled Test Set).
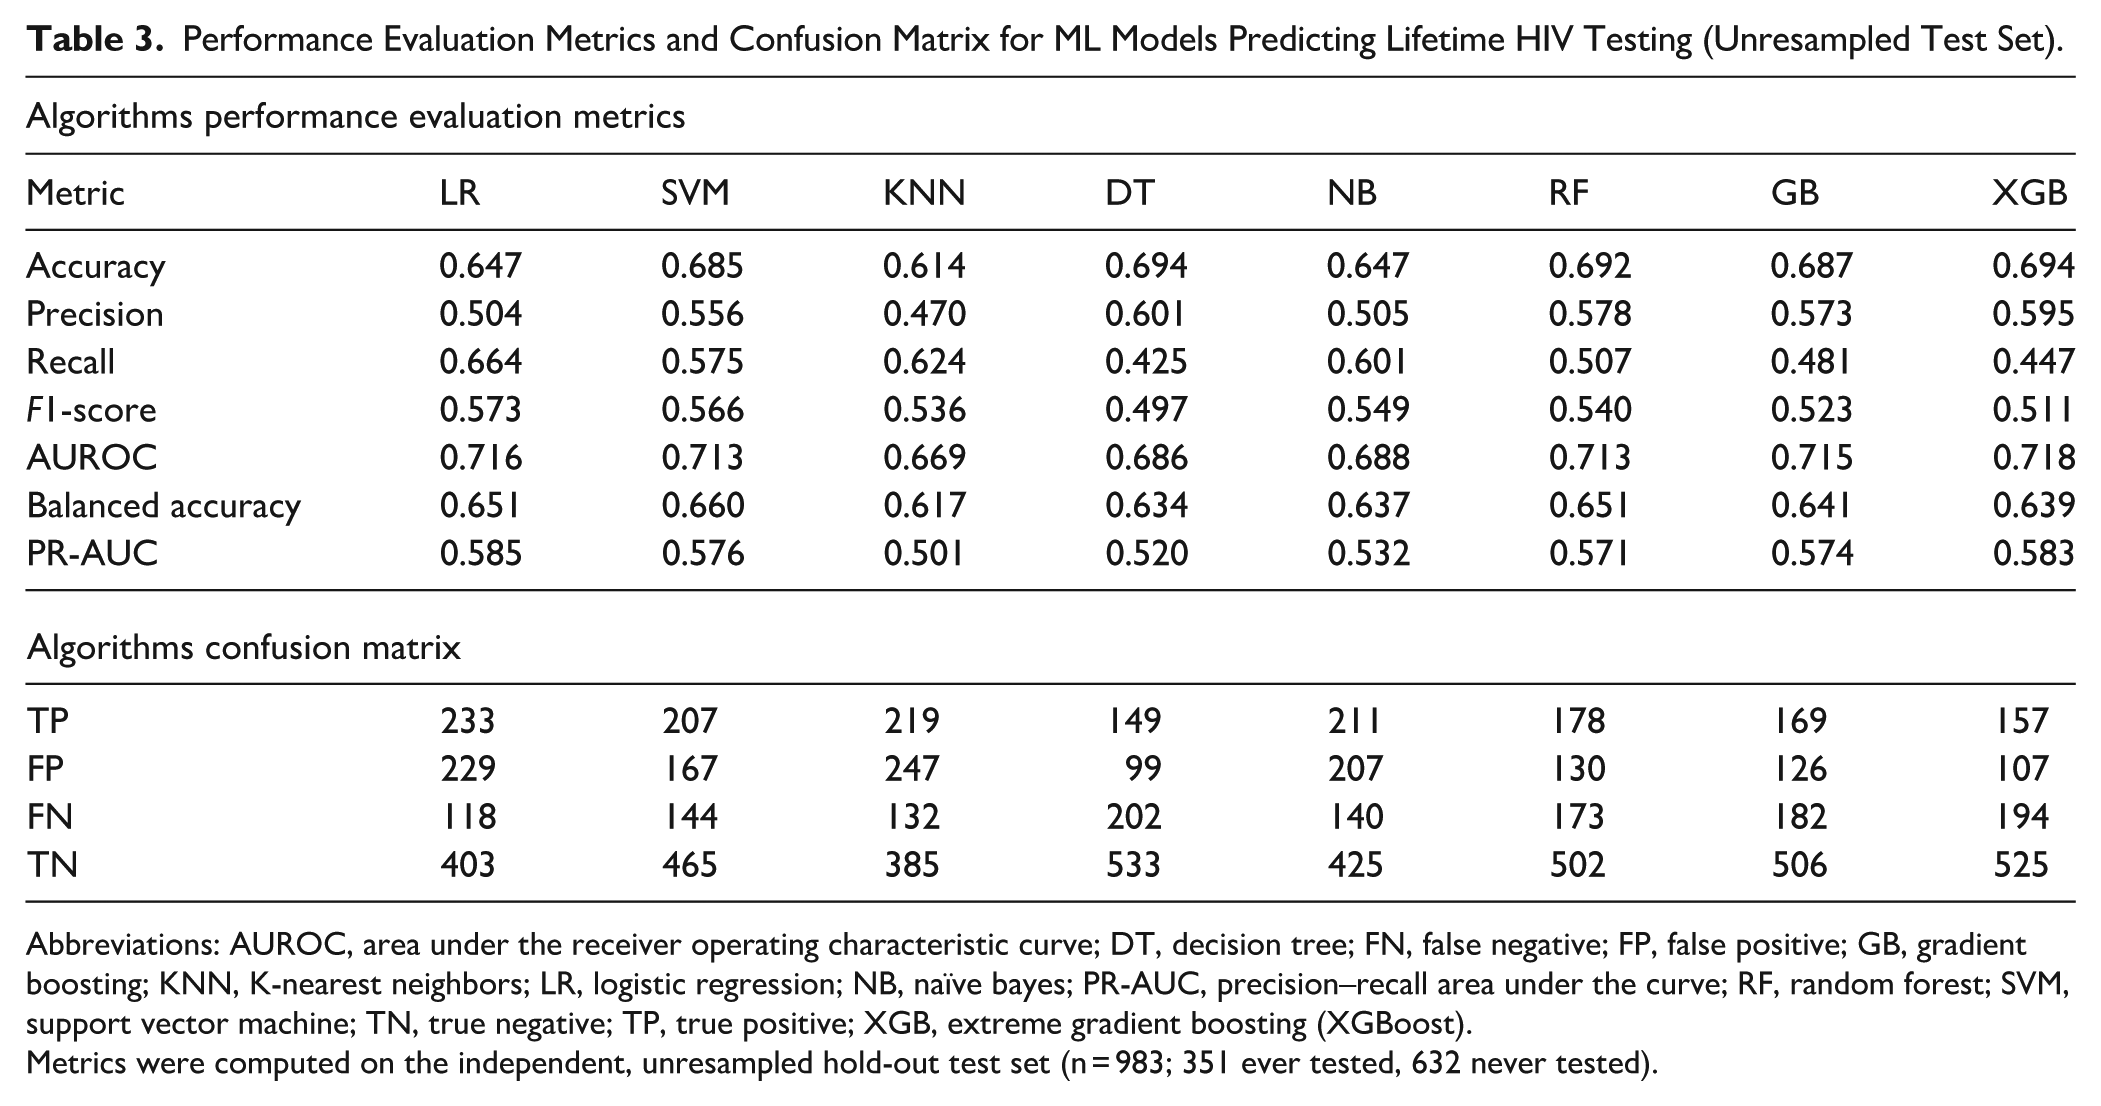
Abbreviations: AUROC, area under the receiver operating characteristic curve; DT, decision tree; FN, false negative; FP, false positive; GB, gradient boosting; KNN, K-nearest neighbors; LR, logistic regression; NB, naïve bayes; PR-AUC, precision–recall area under the curve; RF, random forest; SVM, support vector machine; TN, true negative; TP, true positive; XGB, extreme gradient boosting (XGBoost).
Metrics were computed on the independent, unresampled hold-out test set (n = 983; 351 ever tested, 632 never tested).
The confusion matrix results provide additional insight into model behavior and error patterns. Logistic Regression identified the largest number of true positives (TP = 233) but also produced a relatively high number of false positives (FP = 229), reflecting its tendency toward higher sensitivity at the expense of specificity. Decision Tree models yielded the highest number of true negatives (TN = 533) and the fewest false positives (FP = 99), but this came with the lowest recall (0.425) and the largest number of false negatives (FN = 202), indicating under-identification of individuals who had ever tested for HIV. Ensemble models such as Random Forest, Gradient Boosting, and XGBoost demonstrated a more balanced error profile, with lower false positive counts (FP ranging from 107 to 130) and moderate true positive detection. Notably, XGBoost achieved the lowest number of false positives (FP = 107) while maintaining strong overall discrimination, highlighting its strength in reducing misclassification of non-tested individuals. Together, these findings indicate that ensemble-based models provide a more balanced trade-off between sensitivity and specificity, making them particularly suitable for population-based HIV testing prediction (Table 3, Figure 4).

Model evaluation metrics for all models.
AUROC and PR-AUC Curve Analysis
The Receiver Operating Characteristic (ROC) curve is a widely used tool to evaluate the classification performance of predictive models by plotting the true positive rate against the false positive rate across different threshold values. 42 The Area Under the ROC Curve (AUROC) provides a single summary statistic of a model’s discriminative ability, reflecting how effectively it can distinguish between individuals who have ever tested for HIV and those who have not. 42 Figure 5 presents the ROC curves comparing the discriminative performance of the ML models used to predict lifetime HIV testing. All models demonstrated performance above the no-discrimination reference line, indicating meaningful predictive ability. XGBoost achieved the highest area under the ROC curve (AUROC = 0.718), reflecting the strongest overall capacity to distinguish between individuals who had ever been tested for HIV and those who had not. Logistic Regression (AUROC = 0.716), Gradient Boosting (AUROC = 0.715), Random Forest (AUROC =0.713), and Support Vector Machine (AUROC = 0.713) exhibited closely comparable discrimination, with largely overlapping ROC curves across most thresholds.

ROC curve for all models.
Figure 6 displays the precision–recall (PR) curves for the ML models predicting lifetime HIV testing, providing insight into model performance under class imbalance. All models performed above the baseline precision corresponding to the outcome prevalence (35.7%), indicating added value beyond random classification. XGBoost achieved one of the highest precision–recall area under the curve (PR–AUC = 0.583), very close to Logistic Regression (PR–AUC = 0.585), Gradient Boosting (PR–AUC = 0.574), Support Vector Machine (PR–AUC = 0.576), and Random Forest (PR–AUC = 0.571), reflecting relatively strong balance between precision and recall across thresholds. In contrast, K-Nearest Neighbors (PR–AUC = 0.501) and Decision Tree (PR–AUC = 0.520) demonstrated weaker performance, with more rapid declines in precision as recall increased.

Precision-recall (PR) curve for ML models.
Features Importance Analysis Using SHAP
To better understand the relative influence of predictors in determining the likelihood of lifetime HIV testing, SHapley Additive exPlanations (SHAP) and Local Interpretable Model-agnostic Explanations (LIME) were applied. SHAP is a model-agnostic interpretability method that quantifies the marginal contribution of each variable to the model’s output, providing insights into both the magnitude and direction of influence.35,38 Figures 7 and 8 present the SHAP-based interpretation of the XGBoost model, highlighting both the overall importance of predictors and the directionality of their effects on lifetime HIV testing. Figure 7 shows the aggregated mean absolute SHAP values, indicating that age group was the most influential predictor by a substantial margin, followed by smoking status, veteran status, race/ethnicity, and number of poor mental health days. Socioeconomic factors such as marital status, income group, and education level also contributed meaningfully, while health behaviors and access-related variables, including physical activity, alcohol use, recent medical check-up, urban–rural residence, and health insurance, had comparatively smaller effects.

SHAP feature importance bar plot.

SHAP Beeswarm summary plot (aggregated).
Figure 8 complements this ranking by illustrating the distribution and direction of feature impacts across individuals. Younger age groups were associated with positive SHAP values, indicating a higher likelihood of having ever tested for HIV, whereas older age groups contributed negatively. Higher smoking categories, veteran status, and certain racial/ethnic groups showed positive contributions toward HIV testing, while being married and higher income levels tended to shift predictions toward lower testing likelihood in some individuals. Mental and physical health burden exhibited heterogeneous effects, with greater numbers of poor health days generally increasing the predicted probability of testing. Together, these figures demonstrate how both sociodemographic and health-related factors jointly shape HIV testing behavior and underscore the value of SHAP in providing transparent, case-level insights into complex ML models.
Individual-Level Model Interpretability Using SHAP and LIME
Figures 9 and 10 provide complementary, case-level explanations of the XGBoost model’s prediction for a single individual (index observation 0), illustrating how specific characteristics jointly influenced the predicted probability of lifetime HIV testing. Figure 9 shows that the individual’s predicted probability of HIV testing (f(x) = 0.736) was substantially higher than the baseline expectation (E[f(x)] = 0.007), driven primarily by positive contributions from age group, race/ethnicity, smoking status, and marital status. In particular, belonging to a younger age group (25-34 years) and the Black race category contributed strongly toward increasing the predicted likelihood of testing. At the same time, former smoking status and being unmarried further shifted the prediction in a positive direction. Conversely, factors such as zero poor mental health days in the last 30 days, high school education level, 25 to 35k income group, and being a non-veteran exerted negative contributions, partially offsetting the overall prediction. Figure 10 reinforces these findings by highlighting a similar set of influential features and their directional effects in an interpretable, local linear approximation of the model. Both explainability methods consistently identify age group, race/ethnicity, smoking status, marital status, and veteran status as key drivers for this individual’s prediction, demonstrating how SHAP and LIME together provide transparent, individualized insight into the decision-making process of complex ML models for HIV testing behavior.

SHAP waterfall plot.

LIME local feature importance plot.
Discussion
This study applied an integrated analytical framework combining traditional epidemiological methods with ML and explainable AI to examine and identify the determinants of lifetime HIV testing among adults in Tennessee using weighted 2023 BRFSS data. By pairing survey-weighted logistic regression with multiple supervised ML algorithms, this work aimed to both estimate population-level associations and improve the prediction of HIV testing behavior in a complex, real-world dataset. Unlike conventional regression approaches that rely on linearity and additivity assumptions, ML models are well-suited to capture non-linear relationships and higher-order interactions among sociodemographic, behavioral, and health-related factors.43-45 The inclusion of explainable AI techniques further allowed transparent interpretation of model predictions, addressing common concerns around the “black-box” nature of advanced algorithms.35,38,46,47 Together, this hybrid approach provides a comprehensive framework for understanding HIV testing patterns at both population and individual levels.
Using survey-weighted analyses, the prevalence of lifetime HIV testing in Tennessee was estimated at 38.8%, indicating that a substantial proportion of adults have never been tested despite longstanding national recommendations for routine HIV screening. This is similar to the estimates reported by the Kaiser Family Foundation (KFF). 6 Multivariable logistic regression identified several factors independently associated with HIV testing, including sex, age group, race/ethnicity, marital status, income, employment status, smoking status, veteran status, mental health burden, comorbidity burden, healthcare affordability, and disability burden. Younger adults, females, Black respondents, unmarried individuals, and those reporting poor mental health days were more likely to report having ever tested for HIV, while adults aged 65 years and older and those reporting difficulty affording healthcare due to cost had significantly lower odds of testing. These findings are broadly consistent with prior literature showing persistent age, racial, and socioeconomic disparities in HIV testing uptake.6,13,48 Our findings are also consistent with state- and national-level trend analyses documenting modest gains in lifetime HIV testing since the early 2010s, and this low testing rate persists despite CDC recommendations for routine screening of everyone aged 13 to 64 and more frequent testing for people with ongoing risk.33,49 In addition, access barriers continue to matter: difficulty affording care and weaker ties to routine health services are linked to lower testing in community and survey research, echoing our affordability. 50 Overall, the traditional epidemiologic results provide robust, population-representative estimates that align with established HIV testing disparities while also identifying groups that may benefit from targeted interventions.
Among the ML models evaluated, XGBoost demonstrated the strongest overall discriminatory performance, achieving the highest AUROC and competitive performance across accuracy, balanced accuracy, and precision–recall metrics. This is consistent with emerging literature that demonstrates the advantages of ensemble-based approaches such as XGBoost, which are capable of modeling complex, non-linear relationships among sociodemographic, behavioral, and health-related predictors.51-54 SHAP-based feature importance analysis revealed age group as the most influential predictor of HIV testing, followed by smoking status, veteran status, race/ethnicity, mental health burden, and marital status. Socioeconomic indicators such as income and education, along with physical health burden and healthcare affordability, also contributed meaningfully to model predictions. Notably, SHAP beeswarm patterns showed that younger age groups were consistently associated with a higher predicted likelihood of HIV testing, whereas older age groups contributed negatively, reinforcing results observed in regression analyses. The prominence of smoking status, mental health days, and veteran status suggests that behavioral and psychosocial factors, often underemphasized in traditional screening models, play an important role in shaping HIV testing behavior. These findings are generally concordant with prior studies linking healthcare engagement, behavioral risk, and testing uptake, while also highlighting additional predictors that may operate in complex, non-linear ways.48,55,56 Our finding that Veteran status was associated with higher odds of ever having been tested for HIV should be considered in the context of VA policy. The Veterans Health Administration recommends at least 1 lifetime HIV test for all Veterans, and prior studies show that many within VA settings do receive testing, though uptake can vary and experienced declines during the COVID-19 pandemic.57,58 These results highlight the value of existing VA screening policies and suggest opportunities to further strengthen the consistency of routine, opt-out HIV testing within Veteran care systems. 58
The combined use of ML and explainable AI meaningfully complemented traditional epidemiologic analysis by uncovering non-linear patterns and individual-level heterogeneity not easily captured through regression alone. 59 This study’s application of explainable AI methods (eg, SHAP and LIME) enhanced interpretability through not only finding the importance of individual predictors, but also the direction and strength of their contribution to each prediction.34,35,38,60 In doing so, we address the common “black-box” critique by leveraging well-established XAI methods with demonstrated utility in healthcare.35,46,47 Additionally, while logistic regression quantified average associations across the population, SHAP and LIME enabled case-specific interpretation of how multiple factors jointly influenced individual predictions.34,61,62 For example, SHAP waterfall and LIME plots illustrated how age, race/ethnicity, smoking status, marital status, and veteran status interacted within a single observation to substantially increase the predicted probability of HIV testing, while other factors exerted offsetting effects. This individualized insight supports a more nuanced understanding of HIV testing behavior and aligns with emerging concepts of personalized public health, where interventions are tailored based on overlapping social, behavioral, and health profiles. 63 By bridging population-level inference with individual-level explanation, this approach enhances both interpretability and practical relevance for public health decision-making (through supporting targeted outreach in subpopulations with low testing uptake, prioritizing demographic groups for enhanced screening efforts, and informing surveillance systems to identify testing gaps).
This study has several notable strengths. First, it leveraged a large, population-based dataset with appropriate survey weighting, ensuring generalizability of findings to the adult population of Tennessee. Second, the integration of traditional epidemiologic methods with multiple ML algorithms allowed both inferential and predictive objectives to be addressed within a single analytical framework. Third, the use of explainable AI techniques, including SHAP and LIME, enhanced transparency and interpretability, overcoming key limitations associated with black-box predictive models. Fourth, careful handling of class imbalance through SMOTE, stratified sampling, and evaluation on an untouched hold-out test set strengthened model validity and generalizability. Finally, the structured and reproducible analytic pipeline provides a scalable blueprint for applying explainable ML to other public health surveillance outcomes, supporting more data-driven and equitable approaches to HIV prevention and screening. Future research can build upon this work by integrating longitudinal datasets, linking with electronic health records or other social determinants of health, and assessing the temporal stability of model predictions. Furthermore, evaluating more advanced algorithms, including deep learning architectures or ensemble meta-models, may further improve predictive performance and offer additional insights for guiding targeted HIV testing interventions.
Limitations
Although this study provides important insights into the predictors of lifetime HIV testing, there are limitations that should be acknowledged. First, the cross-sectional design of the BRFSS survey restricts the ability to establish causal relationships between the identified predictors and lifetime HIV testing. While associations were detected, temporal sequencing cannot be confirmed, making it unclear whether certain factors directly influence testing behavior. Second, the study relied on self-reported survey responses, which are vulnerable to recall bias and social desirability bias. This is particularly relevant for sensitive topics such as HIV testing, sexual health, income, and substance use, where underreporting or misclassification may occur.64,65 Third, the analysis was limited to variables available in the BRFSS dataset, potentially excluding other influential determinants such as HIV-related stigma, access to testing facilities, provider recommendation practices, or broader structural and community-level factors. Additionally, although the ML models demonstrated strong internal performance, the results were not externally validated with independent datasets. This limits the assessment of generalizability to other states or populations. Future research should prioritize external validation (with datasets such as BRFSS data from other U.S. states or years, the National Health Interview Survey (NHIS), and healthcare system–based datasets where HIV testing information is available), as well as the incorporation of longitudinal data, to better capture the temporal dynamics of HIV testing behaviors. Integrating additional data sources, such as electronic health records, local testing program data, or neighborhood-level indicators, could also strengthen predictive capacity and provide a more comprehensive understanding of testing uptake in diverse settings.
Conclusion
In conclusion, this study demonstrates the value of integrating traditional epidemiologic methods with ML and explainable AI to better understand, predict, and identify determinants of lifetime HIV testing behavior using population-based surveillance data. By combining survey-weighted regression with advanced predictive modeling and interpretable tools such as SHAP and LIME, the analysis identified key sociodemographic, behavioral, and health-related factors associated with HIV testing uptake while also revealing complex, non-linear, and individual-level patterns not captured by conventional approaches alone. Overall, this work illustrates how explainable AI can complement established public health methods to support more precise, equitable, and actionable HIV prevention efforts.
Supplemental Material
sj-docx-1-jpc-10.1177_21501319261428986 – Supplemental material for Leveraging Explainable AI to Identify Determinants of Lifetime HIV Testing Among Adults in Tennessee, United States: Evidence for Targeted Public Health Strategies From BRFSS 2023
Supplemental material, sj-docx-1-jpc-10.1177_21501319261428986 for Leveraging Explainable AI to Identify Determinants of Lifetime HIV Testing Among Adults in Tennessee, United States: Evidence for Targeted Public Health Strategies From BRFSS 2023 by Mustapha Aliyu Muhammad, Bless-me Ajani, Jamilu Sani and Mohamed Mustaf Ahmed in Journal of Primary Care & Community Health
Footnotes
Ethical Considerations
This study utilized a fully anonymized, publicly available dataset obtained from the Behavioral Risk Factor Surveillance System (BRFSS) 2023. Since the data were de-identified prior to analysis and no human subjects were directly involved in this secondary data analysis, ethical approval was not required. This study used de-identified, publicly available secondary microdata from the 2023 CDC BRFSS (Tennessee). As no identifiable information or direct contact with participants was involved, no additional ethics approval or consent was required for this secondary analysis.
Consent to Participate
This study used de-identified, publicly available BRFSS data; informed consent was obtained from participants by the Centers for Disease Control and Prevention at the time of data collection.
Author Contributions
MAM and BA conceptualized the study, developed the methodology, and performed the formal analysis. MAM, JS, and SAA assisted with data curation, implemented the software, and supported model evaluation. All authors contributed to the manuscript writing, reviewed the final draft, and approved the submitted version.
Funding
The authors received no financial support for the research, authorship, and/or publication of this article.
Declaration of Conflicting Interests
The authors declared no potential conflicts of interest with respect to the research, authorship, and/or publication of this article.
Data Availability Statement
Code Availability
Supplemental Material
Supplemental material for this article is available online.
References
Supplementary Material
Please find the following supplemental material available below.
For Open Access articles published under a Creative Commons License, all supplemental material carries the same license as the article it is associated with.
For non-Open Access articles published, all supplemental material carries a non-exclusive license, and permission requests for re-use of supplemental material or any part of supplemental material shall be sent directly to the copyright owner as specified in the copyright notice associated with the article.