
Abstract
Introduction/Objectives:
Primary care is fundamental to health equity, with evidence linking primary care physician (PCP) supply to reduced mortality and improved population health, particularly in underserved communities. While cross-sectional studies demonstrate associations between PCP availability and mortality rates, the relationship between sustained primary care access patterns and long-term mortality trajectories remains poorly understood. This study investigates the relationship between primary care physician supply trends and age-adjusted all-cause mortality trajectories in U.S. counties from 2011 to 2019.
Methods:
We utilized group-based trajectory modeling to identify distinct mortality trajectory patterns among U.S. counties from 2011 to 2019. County-level age-adjusted all-cause mortality rates were obtained from the CDC, and primary care physician supply data from HRSA. We examined associations between baseline PCP supply, changes in PCP supply over time, and mortality trajectory group membership using multinomial logistic regression, adjusting for sociodemographic factors including poverty rates, unemployment, racial composition, and rurality.
Results:
Eight distinct mortality trajectory groups were identified, revealing persistent and widening disparities across U.S. counties. Counties with favorable mortality trajectories had significantly higher baseline PCP supply and experienced less decline in physician availability. Every increase in 5 primary care physicians per 100 000 population at baseline was associated with a 11.0% increase in odds of membership in the most favorable mortality trajectory groups. Counties with less favorable trajectories demonstrated higher poverty rates, unemployment, and greater percentages of Black residents, with some experiencing PCP supply declines up to 20.1% over the study period.
Conclusions:
This study provides novel evidence that sustained primary care physician supply is associated with more favorable long-term mortality trajectories at the county level. Counties with persistently low PCP supply—which disproportionately serve communities of color and economically disadvantaged populations—experienced the worst mortality outcomes. These findings underscore the critical role of primary care in addressing health disparities and suggest that policies enhancing primary care access, particularly in underserved areas, could significantly improve population health equity. Comprehensive interventions addressing both primary care workforce distribution and social determinants of health are essential for equitable health outcomes.
Keywords
Introduction
All-cause mortality in the US declined between 1935 and 2014, but this trend reversed with rates beginning to increase in 2015, resulting in recent declines in US life expectancy.1-4 Since the 1970s, the US has experienced higher mortality rates among working-age adults compared to peer high-income countries. mortality disparities persist and have widened among racial and ethnic minority populations, rural populations, and medically underserved communities, reflecting broader patterns of health inequity. 5
Access to primary care has consistently been associated with better population health outcomes and reduced health inequities.6,7 Primary care physicians (PCPs) serve as the foundation of healthcare delivery, providing preventive care, managing chronic conditions, and coordinating care across the healthcare system—critical functions for addressing health disparities in underserved populations. 8 Predominantly Black and Hispanic communities tend to have fewer PCPs and lower-quality health care facilities than predominantly white communities, contributing to persistent health inequities. Over 100 million Americans do not have access to a regular source of primary care, with these shortages disproportionately affecting rural and underserved communities. Recent evidence demonstrates this relationship at the population level: a county-level analysis found that greater PCP supply in 2019 was associated with lower all-cause and cardiovascular disease mortality. 9 Similarly, a zip code level analysis found that increases in primary care physicians between 2001 and 2011 were associated with decreased mortality among adults 65 and older. 10 Additionally, Basu et al 11 demonstrated that each additional primary care physician per 10 000 population was associated with a reduction of 25.2 deaths per 100 000 population annually, with stronger associations observed in counties with higher proportions of Black residents, highlighting primary care’s role in addressing racial health disparities.
While these studies establish cross-sectional and short-term longitudinal associations between PCP supply and mortality, less is understood about how sustained patterns of primary care access relate to long-term mortality trajectories in more recent years, particularly in the context of widening health disparities across US communities.
Previous research identified 8 distinct groups of US counties with different patterns of age-adjusted all-cause mortality rates from 2009 to 2016 using group-based trajectory modeling (GBTM). 4 This methodology revealed that disparities in age-adjusted all-cause mortality widened significantly across county groups over time. Building on this approach, we performed a similar group-based trajectory analysis using more recent data (2011-2019), which allowed us to examine mortality patterns prior to the COVID-19 pandemic and to assess associations with PCP supply trends.
The goal of this study was to determine whether trends in PCP supply differed across counties grouped by their long-term mortality trajectories, providing novel insights into how sustained access to primary care may be associated with population health equity over time. This approach allows for assessment of existing strategies and can inform the development of tailored interventions across geographic boundaries. We hypothesized that counties with the most favorable mortality trajectories would have higher baseline PCP supply and experience less decline in PCP availability over time, while counties with the least favorable mortality trajectories would demonstrate lower and declining PCP supply.
Methods
Datasets
The Centers for Disease Control and Prevention’s (CDC) Compressed Mortality File 12 was the source of the yearly age-adjusted all-cause mortality rates in US counties. The Health Resources and Services Administration (HRSA) Area Health Resource File 13 was the source of yearly county-level primary care physician (PCP) supply per 100 000 population. We also obtained county-level sociodemographic data from 2013 estimates of 5-year (2009-2013) American Community Survey (ACS) data and 2013 Rural-Urban Continuum Codes (RUCC) data. Population Studied
U.S. counties were included in this study based on the following criteria: (1) from the 50 U.S. states or District of Columbia, (2) have data for at least 2 years of stable mortality rates with at least 20 deaths, rates for any year with less than 20 deaths were excluded from the models (based on the small area analysis literature14,15) from 2011 to 2019, (3) and have non-missing data of PCP supply for the years of 2011 and 2019. We defined primary care physician as the specialties of Family Medicine, General Practice, General Internal Medicine, and General Pediatrics. PCP supply included PCPs under 75 years old and who were not in hospital-based residency programs.
Measures
We applied group-based trajectory modeling (GBTM) to county-level age-adjusted all-cause mortality rates from 2011 to 2019, with the goal of identifying groups with significantly higher and lower rates (if they existed) and the groups in between the extremes, resulting in identification of 8 groups of U.S. counties that had distinct trends of mortality rate over time, see reference and
The main predictors in our model were PCP supply at baseline (2011) and change in PCP supply from 2011 to 2019. Both measures were presented as number of PCPs per 100 000 population in the county. Covariates were based on data from 2013, including percentage female population, percentage Black population, percentage Hispanic population, percentage of people without a high school diploma, percentage of people living under the Federal poverty line, unemployment rate, percentage of people without health insurance, number of Federally Qualified Health Centers (FQHCs), and whether the county was rural.
Statistical Analysis
We calculated and listed the mean PCP supply for each of the 3 mortality groups for each year. Descriptive statistics were calculated for the overall sample and compared across the 3 mortality trajectory group categories using one-way ANOVA or Welch’s ANOVA for continuous measures and Chi-square test for categorical measures. Using the membership in trajectory group category as the outcome, we performed univariate and multivariate multinomial logistic regressions with High Mortality (Group 6-8), as the reference group. Crude odds ratios and adjusted odds ratios were generated for univariate and multivariate models, respectively; 95% confidence intervals (CI) of ORs and P-values were also calculated. In the regression model, odds ratios were estimated based on every 5 PCP per 100 000 population for PCP supply in 2011, every 1 PCP per 100 000 population for PCP supply change from 2011 to 2019, and every 1% for all continuous covariates. All P-values were two-sided, and a P-value <.05 was considered statistically significant. SAS, version 9.4, was used to perform all analyses.
Additionally, we created a choropleth map of the 8-level mortality rate trajectory groups of U.S. counties using ArcGIS. We constructed figures of predicted trajectories of mortality rate for the 8 groups and the average PCP supply for each of the 8 groups for each year (Figure 2).
Results
There were 8 distinct all-cause mortality trajectory groups identified using GBTM among 3078 counties from 2011 to 2019. The equations for trajectory 1 and trajectory 3 included only negative linear terms, which produced a consistently decreasing trend of mortality rates over time; while trajectory 5 and trajectory 7 had only positive linear terms and followed a consistently increasing trend (Appendix A, Table B). Equations for trajectories 2, 6, and 8 contained quadratic terms; trajectory 2 had a slowing rate of decline in rates with increasing rates near the end of the study period; trajectories 6 and 8 showed a slowing rate of increase throughout the period. The numeric ordering of trajectories reflects mortality rate trajectories from most favorable (trajectory 1) to least favorable (trajectory 8). Trajectory 1 had the lowest average mortality rate at the beginning of the study (2011) and at the end of the study (2019) and a consistent declining trend over the study period. Trajectory 8 had the highest mortality rates at both time points and the fastest increasing trend over the study period (Figure 1A). The trajectories did not overlap, indicating that disparities in mortality rates across the trajectory groups persisted throughout the study period. The 8 groups of counties we identified based on mortality rate trajectories tended to cluster geographically as shown in Figure 2. Counties with the least favorable mortality trajectories were located in the Mississippi Delta, the Southeastern US, and Appalachia. Counties in the rural Western states with the least favorable trajectories were counties where Native American Tribal Nations are located.

(a) Trajectories of all-cause age-adjusted mortality for US counties, 2011 to 2019 and (b) PCP supply by mortality trajectory group for US counties, 2011 to 2019.
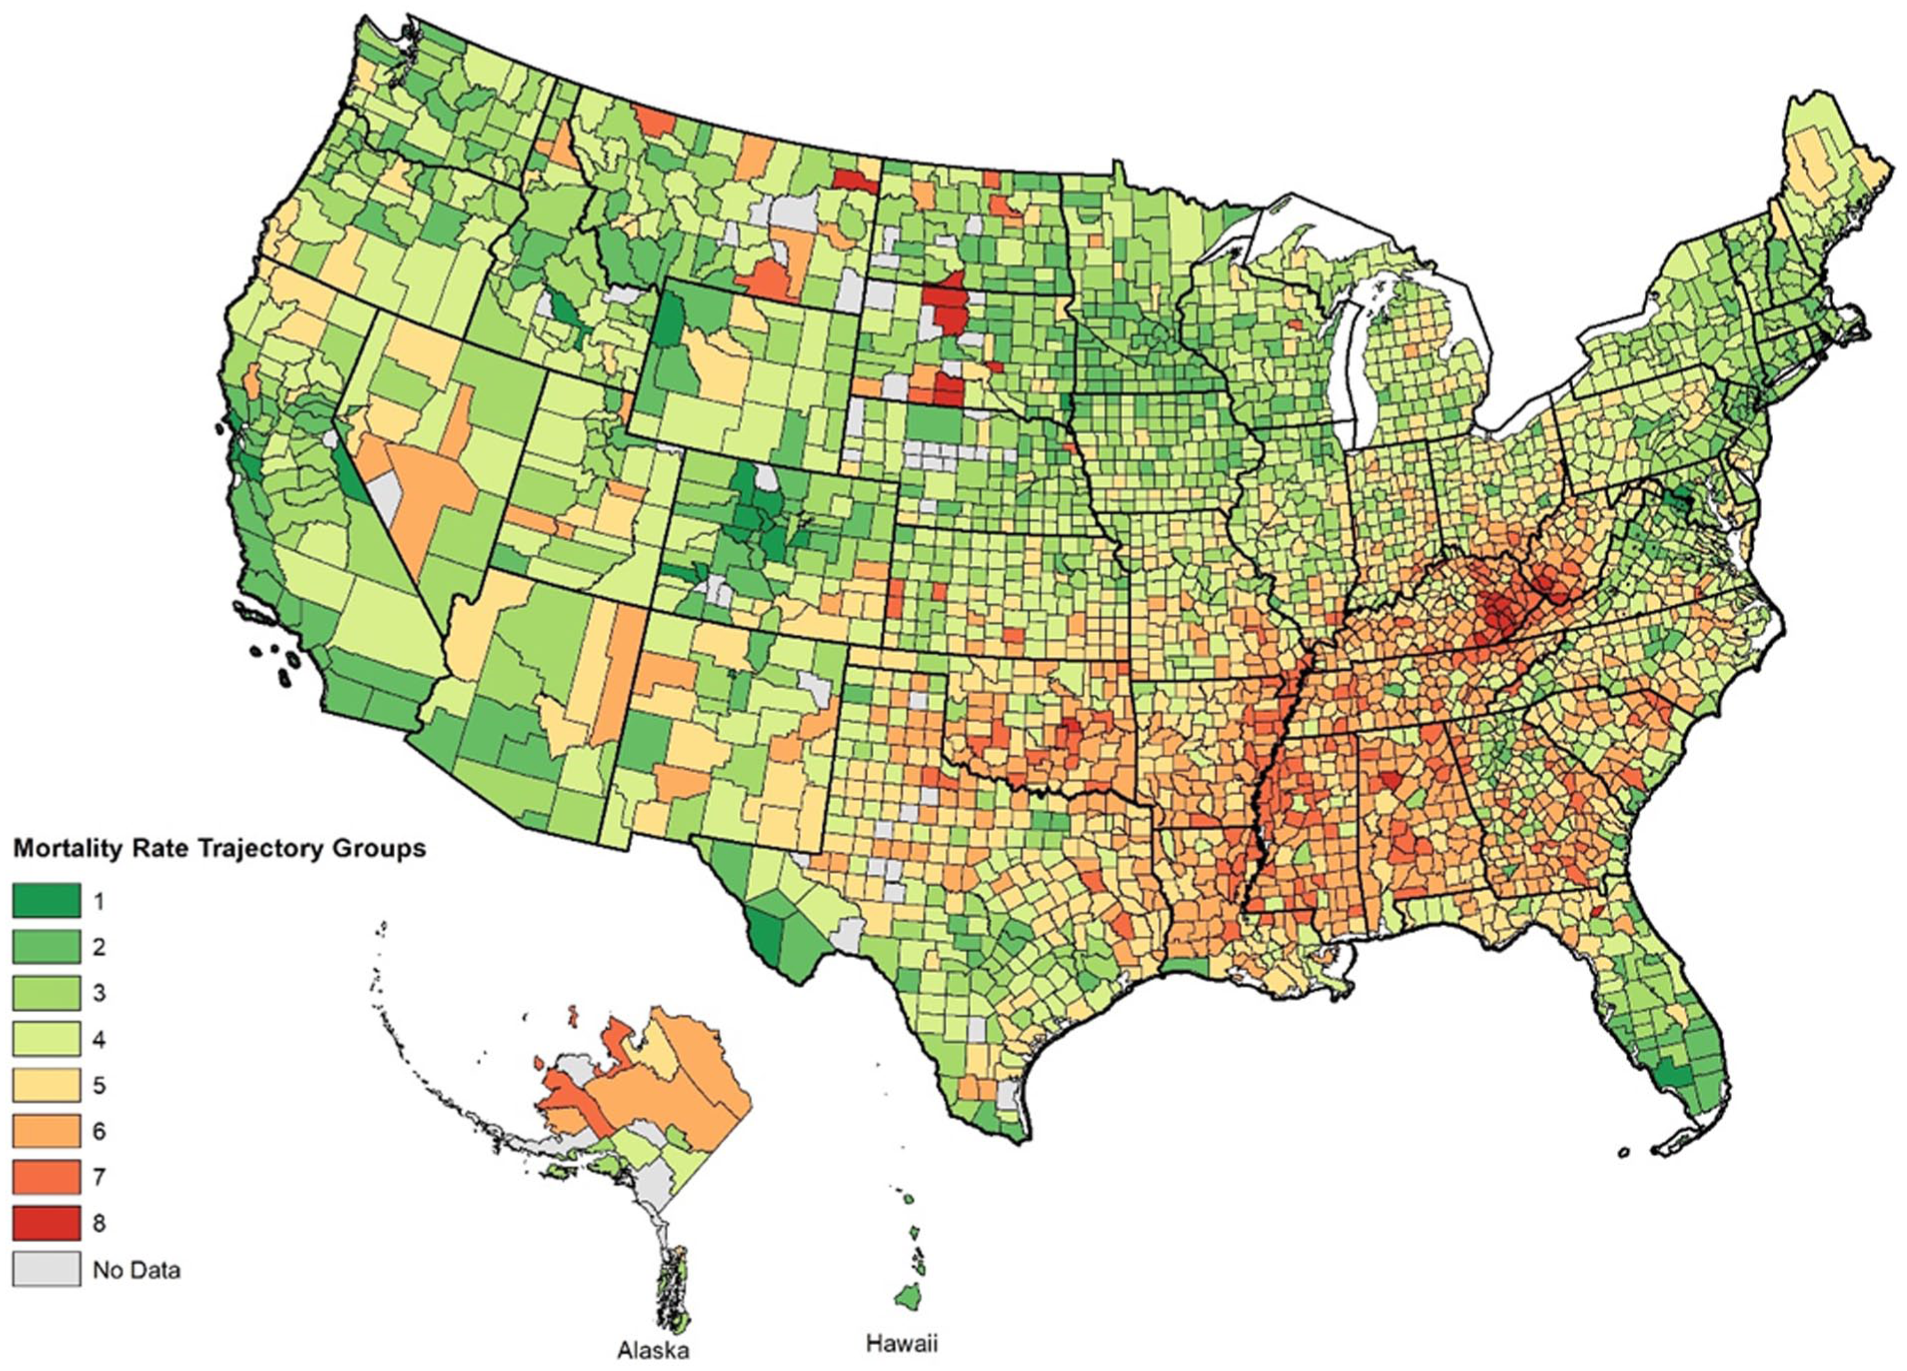
Geographical distribution of mortality trajectory group for US counties, 2011 to 2019.
There was a persistent gap in the average PCP supply across the mortality trajectory groups (Figure 1B). In general, more favorable trajectory groups had higher average PCP supply than less favorable trajectory groups through the study period. Outside of the 3 highest mortality trajectories, the confidence intervals did not overlap indicating statistically significant differences between the groups in physician supply over time. PCP supply for trajectory 1 increased by 2.1% from 91.1 to 93.0 PCP/100 000, while PCP supply for trajectory 8 decreased by 20.1% from 36.3 to 29.0 PCP/100 000 (Table 1). Overall, the PCP supply for US Counties included in the analysis decreased by 2.2% over the study period.
County-level PCP Supply/100 000 Population by Mortality Trajectory Group from 2011 to 2019.

Abbreviation: PCP, primary care physician.
The mortality trajectory groups collapsed into 3 new groups of Low (1,2,3), Mid (4,5), and High (6,7,8) for further analysis. There were no significant differences in the rural status of counties across the 3 mortality groups. There were significant differences in the socio-demographic characteristics across the 3-level mortality trajectory groups (Table 2). Counties in the least favorable trajectory group category had significantly higher percentages of Black population (17.6% vs 4.3%), percentages of people without a high school diploma (21.4% vs 11.4%), poverty rates (22.6% vs 12.7%), unemployment rates (11.5% vs 7.3%), percentages of people without health insurance (18.2% vs 12.7%), and lower number of FQHCs (0.2 vs 0.5) than those in the most favorable trajectory group category.
County-level PCP Supply and Socio-demographic Characteristics by Mortality Trajectory Group from 2011 to 2019.

Abbreviations: PCP, primary care physician; SD, standard deviation; FQHC, Federally Qualified Health Center.
P-value for rural counties was calculated using chi-square test, P-values for PCP supply in 2011 and change from 2011 to 2019 and other covariates were generated using one-way ANOVA or Welch’s ANOVA*.
In the unadjusted ordinal logistic regression model (Table 3), every 5/100 000 increase in the PCP supply in 2011 was significantly associated with 11.0% increase in odds of being in the most favorable trajectory group category (OR = 1.110, 95% CI = 1.090-1.129, P < .001) and 1.1% increase in the odds of being in the middle group trajectory category (OR = 1.054, 95% CI = 1.037-1.072, P < .001). Every 1/100,000 increase in the PCP supply change between 2011 and 2019 was significantly associated with 1.8% increase in odds of being in the most favorable trajectory group category (OR = 1.018, 95% CI = 1.012-1.024, P < .001). After adjustment for socio-demographic measures and number of FQHCs, every 5/100,000 increase in the PCP supply in 2011 was borderline significant (OR = 1.026, 95% CI = 0.999-1.054, P = .056) associated with the odds of being in the most favorable or the middle trajectory category group, and every 1/100,000 increase in the PCP supply change from 2011 to 2019 was significantly associated with 1.0% increase in odds of being in the most favorable trajectory category group (OR = 1.010, 95% CI = 1.001-1.019, P = .023).
Association of PCP Supply in 2011 and Change in PCP Supply from 2011 to 2019 on Mortality Trajectory Group Membership on the County Level Using Bivariate and Multivariate Ordinal Logistic Regression.

Abbreviations: PCP, primary care physician; OR, odds ratio; CI, confidence interval; HS diploma, high school diploma; FQHC, Federally Qualified Health Center; RN2, Nagelkerke R-squared (a pseudo-r-squared measure for logistic regression).
Discussion
This study provides a comprehensive analysis of long-term all-cause mortality trends in US counties from 2011 to 2019 and highlights the significant association of long-term PCP supply with these trends. The findings underscore the persistent disparities in mortality rates across different regions and their association with PCP supply over time.
Our analysis identified 8 distinct mortality trajectory groups, revealing significant variations in mortality trends across US counties. A previous analysis using data from 1999 to 2016 also found 8 county mortality rate trajectories which all showed a slight increase or leveling out in 2015 and 2016. 4 The current analysis found that from 2016 to 2019, the lowest rate group (group 1) continued to have a substantial decline in mortality rates, while group 7 had a modest increase, and group 8 (highest rates) showed a substantial increase. The intermediary groups overall showed a leveling off of rates, with group 6 being an exception, showing a modest decline. The overall effect being a widening in geographic disparities in mortality rates in recent years between low-rate and high-rate trajectory counties.
Counties with more favorable mortality trends consistently had higher baseline PCP supply and increasing PCP supply over the years, supporting the notion that greater access to PCPs is associated with better health outcomes. This aligns with existing literature demonstrating that increased PCP density is associated with lower mortality rates.11,16 Consistent with research indicating that socioeconomic and racial disparities significantly affect health outcomes,17,18 we found that counties with the least favorable mortality trajectories were characterized by higher percentages of Black population, poverty rates, and unemployment rates. The relationship between PCP supply and mortality trajectories remained significant even after adjusting for sociodemographic factors, suggesting that enhancing primary care access independently contributes to improved health outcomes. Physician supply and primary care access may also have differential impact based on area’s socioeconomic composition. A preliminary interaction analysis between PCP supply and percent poverty (Appendix B, Table E) found that the association between baseline PCP supply and mortality trajectories was only significant in counties where the percentage of households in poverty was above 10%.
These findings suggest that addressing PCP supply may at least partially help to alleviate the health and mortality disparities associated with these populations. Previous studies have shown that better primary care access is associated with lower hospitalization rates, improved management of chronic diseases, and ultimately decreases mortality.7,19 Our findings reinforce these conclusions.
In addition, an interesting finding of the multivariable regression that requires further research is the association between being Hispanic and decreasing mortality trends, which is consistent with literature on the Hispanic health paradox,20,21 but could also be due to more complex migration patterns like whether migrant workers in poor health leave the country when they are too sick to work. 22 The interplay between socioeconomic status, race, and access to primary care underscores the complexity of addressing health disparities. Interventions aimed at improving health outcomes in disadvantaged communities must consider these multifaceted factors.
Alarmingly, we found an overall decline in PCP supply rates, with small increases in the 3 counties with the most favorable mortality trajectories, and progressively larger declines in counties as the mortality rates increased, despite persistent nationwide and state-level efforts to address workforce shortages. Because PCP supply is a proxy measure for many characteristics associated with primary care access, the widening gap in mortality rates and PCP supply across U.S. counties highlights the need to re-examine primary care workforce policies and study the effectiveness of these and more nuanced interventions. Strengthening the primary care workforce in medically underserved areas through incentives such as loan repayment programs and increased funding for community health centers could mitigate these disparities.23,24 However, nationwide and state-level efforts to expand these initiatives have yet to demonstrate a sufficient positive effect. Moreover, policies that address the broader social drivers of health, such as poverty, education, and unemployment, continue to be essential for achieving equitable health outcomes.
This study has several limitations. First, PCP supply as a proxy for primary care access may not capture nor distinguish more general primary care workforce and access factors. We added number of FQHCs in a county to the analyses to capture more of the primary care capacity. We found that these centers were more likely to be in low mortality counties and associated with more favorable mortality trajectories in the logistic regression models. We used age adjusted mortality rates in order to not classify counties with older populations as having higher mortality rate trajectories. However, counties with a younger average population that also have a high premature mortality rate may be classified into more favorable mortality trajectory groups due to the age adjustment. This may have been particularly true of counties in Northwest New Mexico and Northeast Arizona which also have a high percentage of Native American people.25-27 Another limitation of this study is that it presents simultaneous trend analyses for both PCP supply and all-cause mortality rates in US counties which, together with the observational design of the study, precludes causal inferences. However, even if PCP supply is not causative of higher mortality rates it is alarming that high mortality counties (which presumable have higher rates of people with chronic conditions) have lower numbers of PCPs, FQHCS, and are losing PCPS at higher rate than lower mortality counties. Another limitation is that the analysis is based on aggregate county-level data, which may mask within-county variations. Additionally, the study does not account for potential changes in healthcare policies, temporal trends in other external factors, like the opioid epidemic, 28 or rates of smoking, obesity, physical inactivity, and food insecurity 29 that might influence mortality trends in specific regions and during specific time periods independently of physician supply. Future research should explore these dynamics using longitudinal data and investigate the impact of specific policy interventions on primary care access and health outcomes. Future research should also examine mortality trajectories during and after the COVID-19 pandemic and identify whether they were associated with PCP supply changes due to the pandemic. We found a sharp increase in mortality rates in 2020 when we examined the mean rates (rather than the modeled trajectories), that was substantially greater in the less favorable mortality groups (Appendix B: Table D). Prior research has noted a cross-sectional association with COVID-19 mortality and poor access to primary care.30,31
Despite the aforementioned limitations and the general limitations of small area analyses,14,15 our findings suggest that primary care may play an important role in long-term mortality trends in US counties. If this relationship is causal, addressing disparities in PCP supply and implementing policies that promote equitable access to primary care could be imperative for improving population health and reducing mortality rates. As the healthcare landscape continues to evolve, ensuring that all communities have access to high-quality primary care remains a fundamental public health priority.
Supplemental Material
sj-docx-1-jpc-10.1177_21501319251396046 – Supplemental material for Identifying Long Term All-Cause Mortality Trends in US Counties from 2011 to 2020 and Associated Spatio-Temporal Patterns in Primary Care Physicians Supply
Supplemental material, sj-docx-1-jpc-10.1177_21501319251396046 for Identifying Long Term All-Cause Mortality Trends in US Counties from 2011 to 2020 and Associated Spatio-Temporal Patterns in Primary Care Physicians Supply by Peter Baltrus, Chaohua Li, Megan Douglas, Anne Gaglioti and Dominic Mack in Journal of Primary Care & Community Health
Supplemental Material
sj-docx-2-jpc-10.1177_21501319251396046 – Supplemental material for Identifying Long Term All-Cause Mortality Trends in US Counties from 2011 to 2020 and Associated Spatio-Temporal Patterns in Primary Care Physicians Supply
Supplemental material, sj-docx-2-jpc-10.1177_21501319251396046 for Identifying Long Term All-Cause Mortality Trends in US Counties from 2011 to 2020 and Associated Spatio-Temporal Patterns in Primary Care Physicians Supply by Peter Baltrus, Chaohua Li, Megan Douglas, Anne Gaglioti and Dominic Mack in Journal of Primary Care & Community Health
Footnotes
Ethical Considerations
This study utilized publicly available, de-identified county-level data and did not require IRB approval. All data sources are appropriately cited and accessible to other researchers. Authors have no conflicts of interests with the reported research.
Author Contributions
All authors have contributed substantially to this work and approve the submitted version. Peter Baltrus conceived the research design, guided the analysis, interpreted results, and lead the writing of the manuscript. Chaohua Li performed all data management and analysis and wrote the Methods and Results section. Megan Douglas and Anne Gaglioti helped to interpret results and contributed to writing the paper. Dominic Mack contributed to writing the paper.
Funding
The authors disclosed receipt of the following financial support for the research, authorship, and/or publication of this article: This project was funded in part by the National Institutes of Health through the Research Centers in Minority Institutions (NIH-RCMI 2U54MD007602-36).
Declaration of Conflicting Interests
The authors declared no potential conflicts of interest with respect to the research, authorship, and/or publication of this article.
Supplemental Material
Supplemental material for this article is available online.
References
Supplementary Material
Please find the following supplemental material available below.
For Open Access articles published under a Creative Commons License, all supplemental material carries the same license as the article it is associated with.
For non-Open Access articles published, all supplemental material carries a non-exclusive license, and permission requests for re-use of supplemental material or any part of supplemental material shall be sent directly to the copyright owner as specified in the copyright notice associated with the article.