In small-scale communities, social-scientists can use photo-rosters to collect social network and dyadic peer-ratings data. In past work, we introduced an R package to automate photo-standardization, survey construction, and data-entry. This R package, however, lacked two key features required for fully-unsupervised data-entry. First, respondent IDs needed to be manually linked to cellphone photographs of the photo-roster before DieTryin could process the data; second, users needed to identify the locations of the photo-roster in each cellphone photograph using a point-and-click interface. To address the first shortcoming, we introduce a new Android application, DieTryinCam, which facilitates annotation of cell-phone photographs with respondent, question, and panel IDs. To address the second shortcoming, we add new functionality to the DieTryin R package, which allows for the precise location of the photograph roster to be automatically identified. Automated data entry in DieTryin now requires no user input beyond a single function call from R.
In the social and psychological sciences, there has been a recent uptake in the application of theory and methods from social network analysis and network science. Researchers have begun to collect a host of different kinds of social network data—for example, data that capture social relationships or interactions, measure the flow of goods or ideas between individuals, and/or record inter-personal perceptions—in a variety of cultural and ecological settings (e.g. Gervais, 2017; Koster and Leckie, 2014; Pisor et al., 2020; Power, 2017; Ready and Power, 2018; Rucas et al., 2010). At the same time, applied mathematicians, complexity scientists, and statisticians have been developing increasingly sophisticated tools for the analysis of such network data (e.g. Hoff et al., 2002; Redhead et al., 2023; Robins et al., 2007; Snijders, 2017). The rising popularity of social network analysis has been driven by the framework’s ability to answer a plethora of fundamental questions about the roles of social relationships and dyadic attributes in many socio-cultural (Lin, 2002; Redhead and Power, 2022), economic and financial (Allen and Babus, 2009; Jackson, 2010), evolutionary (Croft et al., 2008; Ohtsuki et al., 2006), and health-related (Liljeros et al., 2003; Smith and Christakis, 2008) phenomena, observed across human communities, and in other social species.
Despite the fact that network analysis has been involved in far-reaching theoretical and methodological advances in the social sciences—both pure and applied (Borgatti et al., 2009; Buyalskaya et al., 2021)—and the fact that the analytical methods used in network analysis have been constantly improving (e.g. Carrington et al., 2005; Newman, 2018), discussions on the methodology and tools used to generate social network data itself have somewhat lagged behind. Specifically, there is an existing need in the social sciences for tools that simplify the process of collecting and accurately coding social network data and dyadic peer-ratings data gleaned from interviews with respondents. More generally, issues related to methodological generalizability, cross-study comparability, data curation and provenance, and reproducibility still persist. Many of these issues, however, can be addressed with software that standardizes, simplifies, and automates the social network data-collection workflow.
Currently, the most popular instruments for measuring social networks are self-report name generator surveys (Marsden, 1990). With these surveys, researchers ask participants in a given sample to freely list the names of other individuals, in response to a battery of questions about particular relationships (e.g. “Who do you consider to be your friend?,” or “Who do you go to when you need to borrow money?”). Such name generator methods have several strengths (reviewed in Ross and Redhead, 2022). For example, they provide a logistically feasible, and relatively fast, approach for collecting network data from large samples. Likewise, they allow researchers to capture potentially important relationships with individuals outside of the community boundaries.
Name generators approaches do, however, come with substantial limitations, which may squander research time, introduce noise, and even substantially bias downstream analyses. Most importantly, there are key logistical hurdles involved in making name generator data usable for analysis. First, researchers must identify unique individuals from within the set of free-list nominations, where some survey respondents (or researchers recording interview data) might use different spelling variations of a given name, some respondents might use different combinations of first and last names when referring to a given person, and some respondents might even use nicknames rather than legal names. This process of individual identification (or entity resolution) is normally onerous—often taking longer than data collection itself—and is notoriously inaccurate. Researchers may fail to detect when the same individual is listed under multiple names—leading to a phenomena called duplication, where the same individual is included twice under different identities, inflating the apparent size of the dataset. Or, just as easily, researchers may inadvertently link the records of distinct individuals with similar names—leading to a phenomena called collision, where the apparent size of the database is deflated and some individuals are treated as statistical hybrids of multiple respondents. Either of these—very common—errors can have highly non-linear impacts on downstream network measures. These validity concerns are only multiplied when researchers attempt to conduct further record linkages between the free-list data and other databases containing additional covariate information.
To avoid the limitations associated with name generators, practitioners may instead implement roster-based designs for measuring social networks. This entails researchers asking all participants to report on their relationships to all other individuals listed on a community roster (Marsden, 2005). Roster-based approaches allow for greater confidence in the measurement of relationships within a given network, and free the researcher from having to grapple with complicated entity resolution procedures to make the data usable. Nonetheless, roster-based methods have traditionally been more limited in applicability across the social and behavioral sciences, in part because researchers need to determine a full roster of community residents prior to data collection. More importantly, the time burden of data collection and entry tends to scale with the square of sample size, making the process prohibitively burdensome for studies that contain even moderately large samples. This scaling issue, however, is being tackled through the introduction of photograph roster designs, which permit automated data entry and coding with machine learning algorithms (Ross and Redhead, 2022).
Here, we explore and build upon a recently released R software package, DieTryin, that facilitates the collection and provenance management of social network data (see Ross and Redhead, 2022). DieTryin records network ties using token placement on a physical photograph roster; cell-phone images are used to record ties, and replicable, auditable machine learning algorithms are used to classify and visualize these ties, returning labeled edge-list data to the user automatically. The approach to network data collection and provenience management introduced in DieTryin helps to standardize research protocols both across study locations and across interviewers within study locations, and provides a fully transparent and reproducible history of data provenance. By using a roster, it also circumvents the need for use of error-prone entity resolution protocols, increasing the accuracy of the resulting data.
To facilitate the dissemination of the new and improved DieTryin software, we first briefly review the functionality of the tools introduced in Ross and Redhead (2022), and comment on two major inefficiencies in the original DieTryin workflow. We then provide a step-by-step tutorial on how to use our new Android app to collect data, and the new and improved version of DieTryin—which now requires no time-consuming manual steps—to enter data.
Measuring dyadic ties with DieTryin v1.0
In Ross and Redhead (2022), we introduced an R package, DieTryin, designed to simplify the process of collecting and entering roster-based network and dyadic peer-ratings data. This package included functions for respondent photograph standardization, survey tool construction, manual data entry, and semi-automated data entry and coding from simple cell-phone photographs (see Figure 1 for a review of the workflow). This package aimed to make roster-based data collection more rapid, thus permitting use of roster-based methods in research contexts where sample-size constraints would generally push researchers toward use of name-generator methods and/or partial round-robin designs. By using a full community roster, DieTryin helps to minimize the validity concerns associated with these more restrictive methods. Specifically: (i) recall bias is attenuated by providing a visual prime for each and every community member, (ii) record linkage and de-duplication issues associated with post-processing of name-generator-based data are bypassed through the use of a full-community roster, and (iii) the in situ speed of name-generator-based data collection is maintained, reducing respondent fatigue.
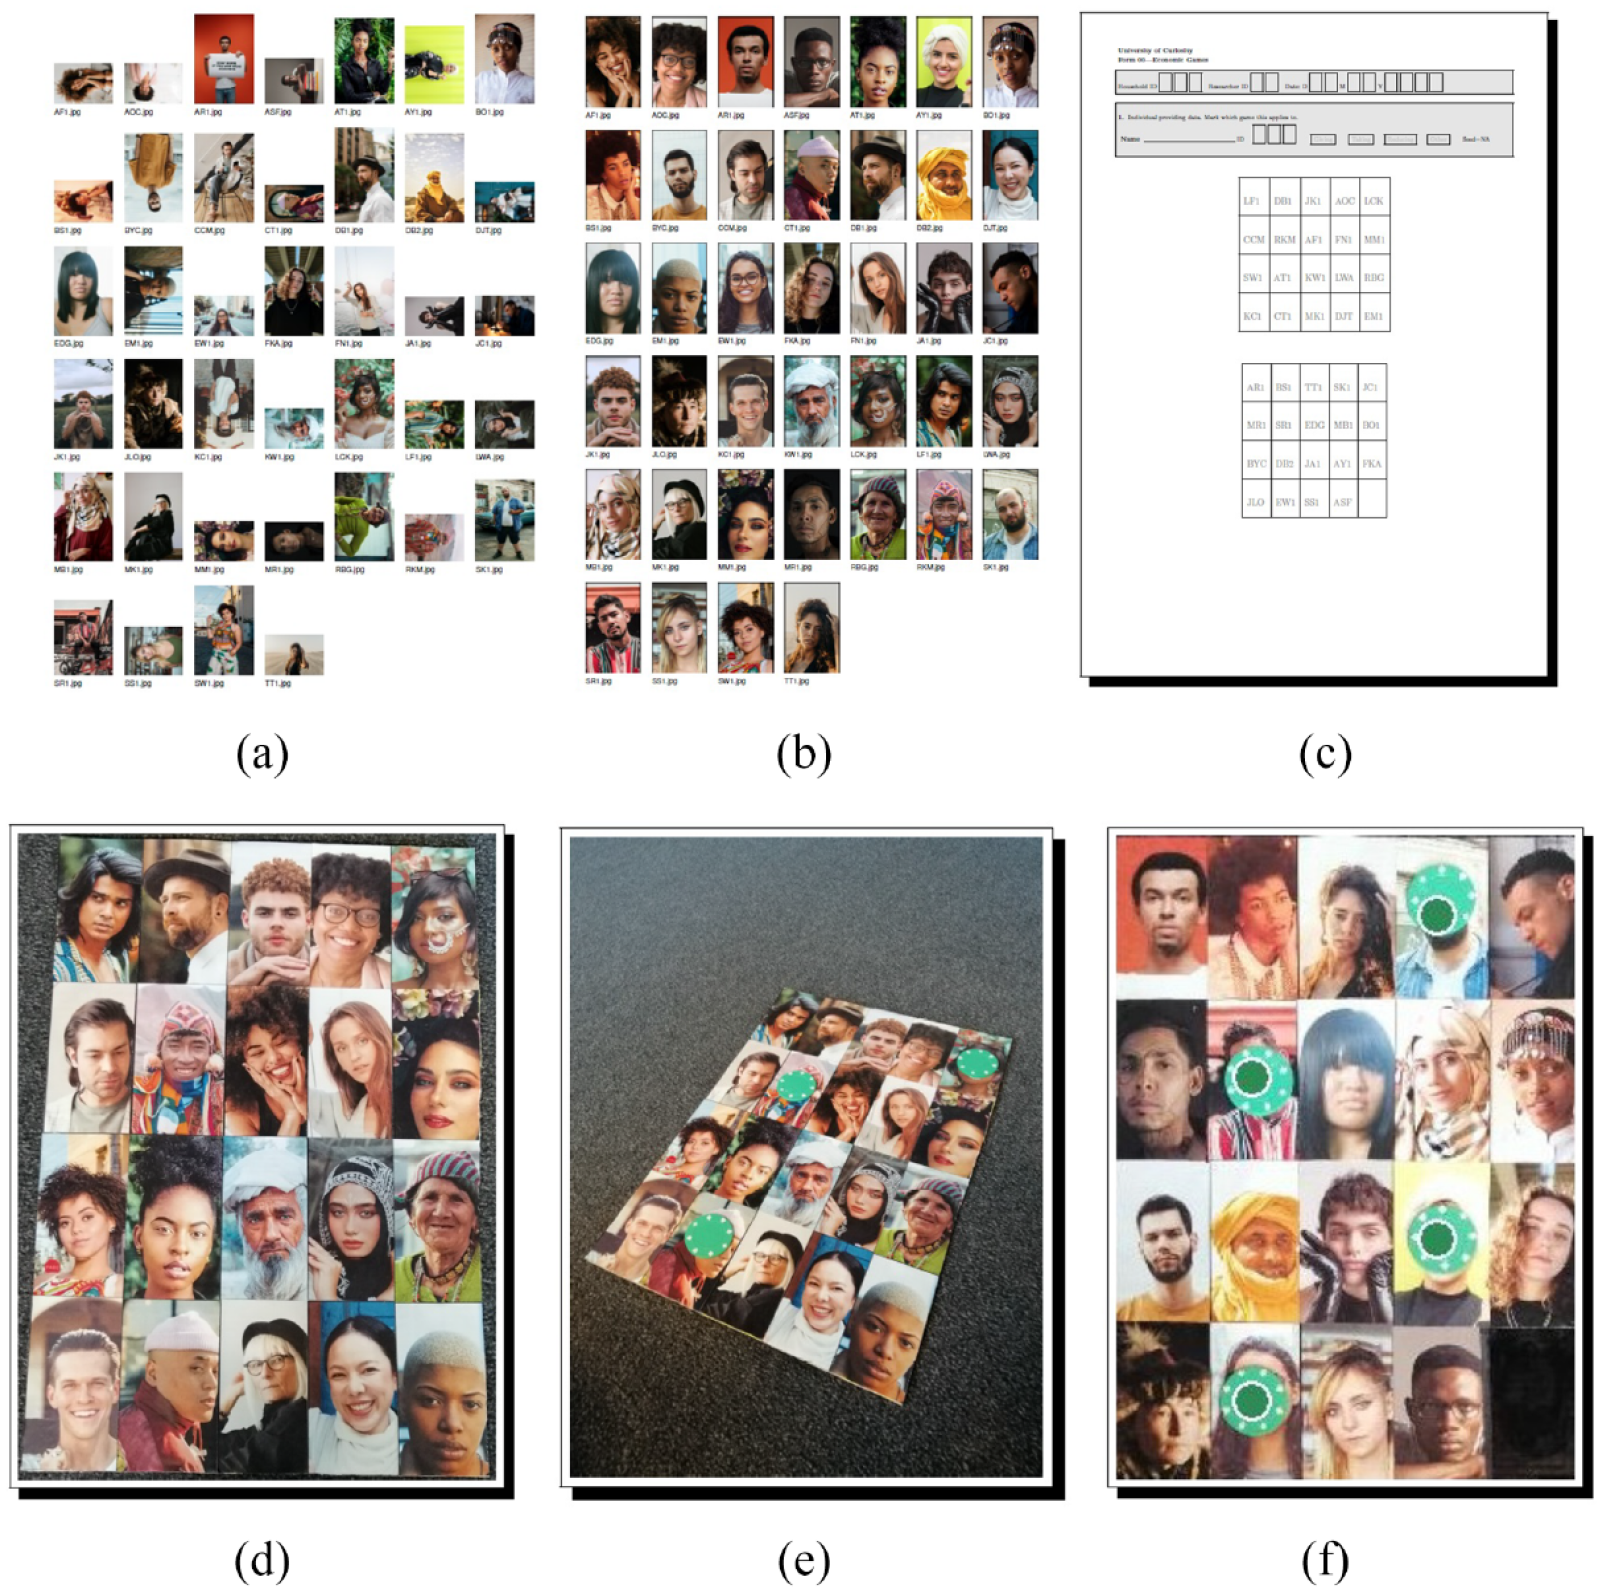
Collection of roster-based network ties or dyadic ratings using DieTryin v1.0. DieTryin is designed to facilitate photograph standardization, roster creation, and data entry. However, steps 5 and 6 above can become inefficient for social scientists working in large field-sites and/or collecting a large number of network layers, as both of these steps require manual tasks. In step 5, users must annotate their cell-phone images with key ID codes, and in step 6 users must use a point-and-click interface to identify the location of the roster in the image. (a) Step 1, the user creates a database of respondent photographs. (b) Step 2, the user standardizes the photographs to include only the face of each respondent. (c) Step 3, the user compiles a survey tool, which lists the respondents’ ID codes in a specific order. (d) Step 4, the user creates a physical photograph roster, with photographs appearing in the same order as on the survey tool. (e) Step 5, the user asks the participant to place tokens on the roster to indicate social ties and/or dyadic ratings, and then takes a cell-phone picture of the token allocation. (f) Step 6, the user uses DieTryin to automatically code edge-list data from the cell-phone photographs, but must manually identify the location of the roster in the image using a point-and-click interface.
The original package was only partially successful, however, in facilitating automatic data entry and coding. Specifically, in steps (5) and (6) of the workflow presented in Figure 1, some manual steps are required of end-users, and the time burden of these steps can be prohibitive for researchers working in large field-sites, and/or collecting numerous networks or peer-ratings during a single interview. In step (5) of Figure 1, for example, users must photograph each panel of the roster for each question. Alone, this is not very time consuming. However, for DieTryin to process these images, users must manually process the file names of each image to include the respondent ID, the question ID, and the panel ID. If the field project requires a large number of photographs to be taken, the process of renaming images can becoming quite burdensome. Similarly, in step (6) of Figure 1, users must manually identify the location of the photo-roster in every cell-phone image using a point-and-click graphical user interface. Although this data entry method is much faster than manual entry in a spread-sheet, permitting entry and classification of up to a hundred data points with only four mouse-clicks, it can still become burdensome when the number of photographs to be classified is very large. In this paper, we introduce methods to resolve each of these productivity bottlenecks. Photograph annotation is handled through the use of a new Android application, DieTryinCam, as described in the next section. Unsupervised data entry is made possible by the introduction of an algorithm in DieTryin v2.0 that automatically identifies the position of the photo-roster in each cell-phone image.
Data collection using DieTryinCam v1.0
The default camera on most Android or iOS devices does not permit users to easily change the file names of photographs in situ using a comfortable user interface, which makes organized data collection via cell-phone photographs difficult. The DieTryinCam v1.0 Android app is thus designed to simplify the process of annotating cell-phone photographs with respondent ID codes, question ID codes, and game-board ID codes, as these three pieces of information are essential for accurately coding network ties or dyadic peer-ratings using DieTryin.
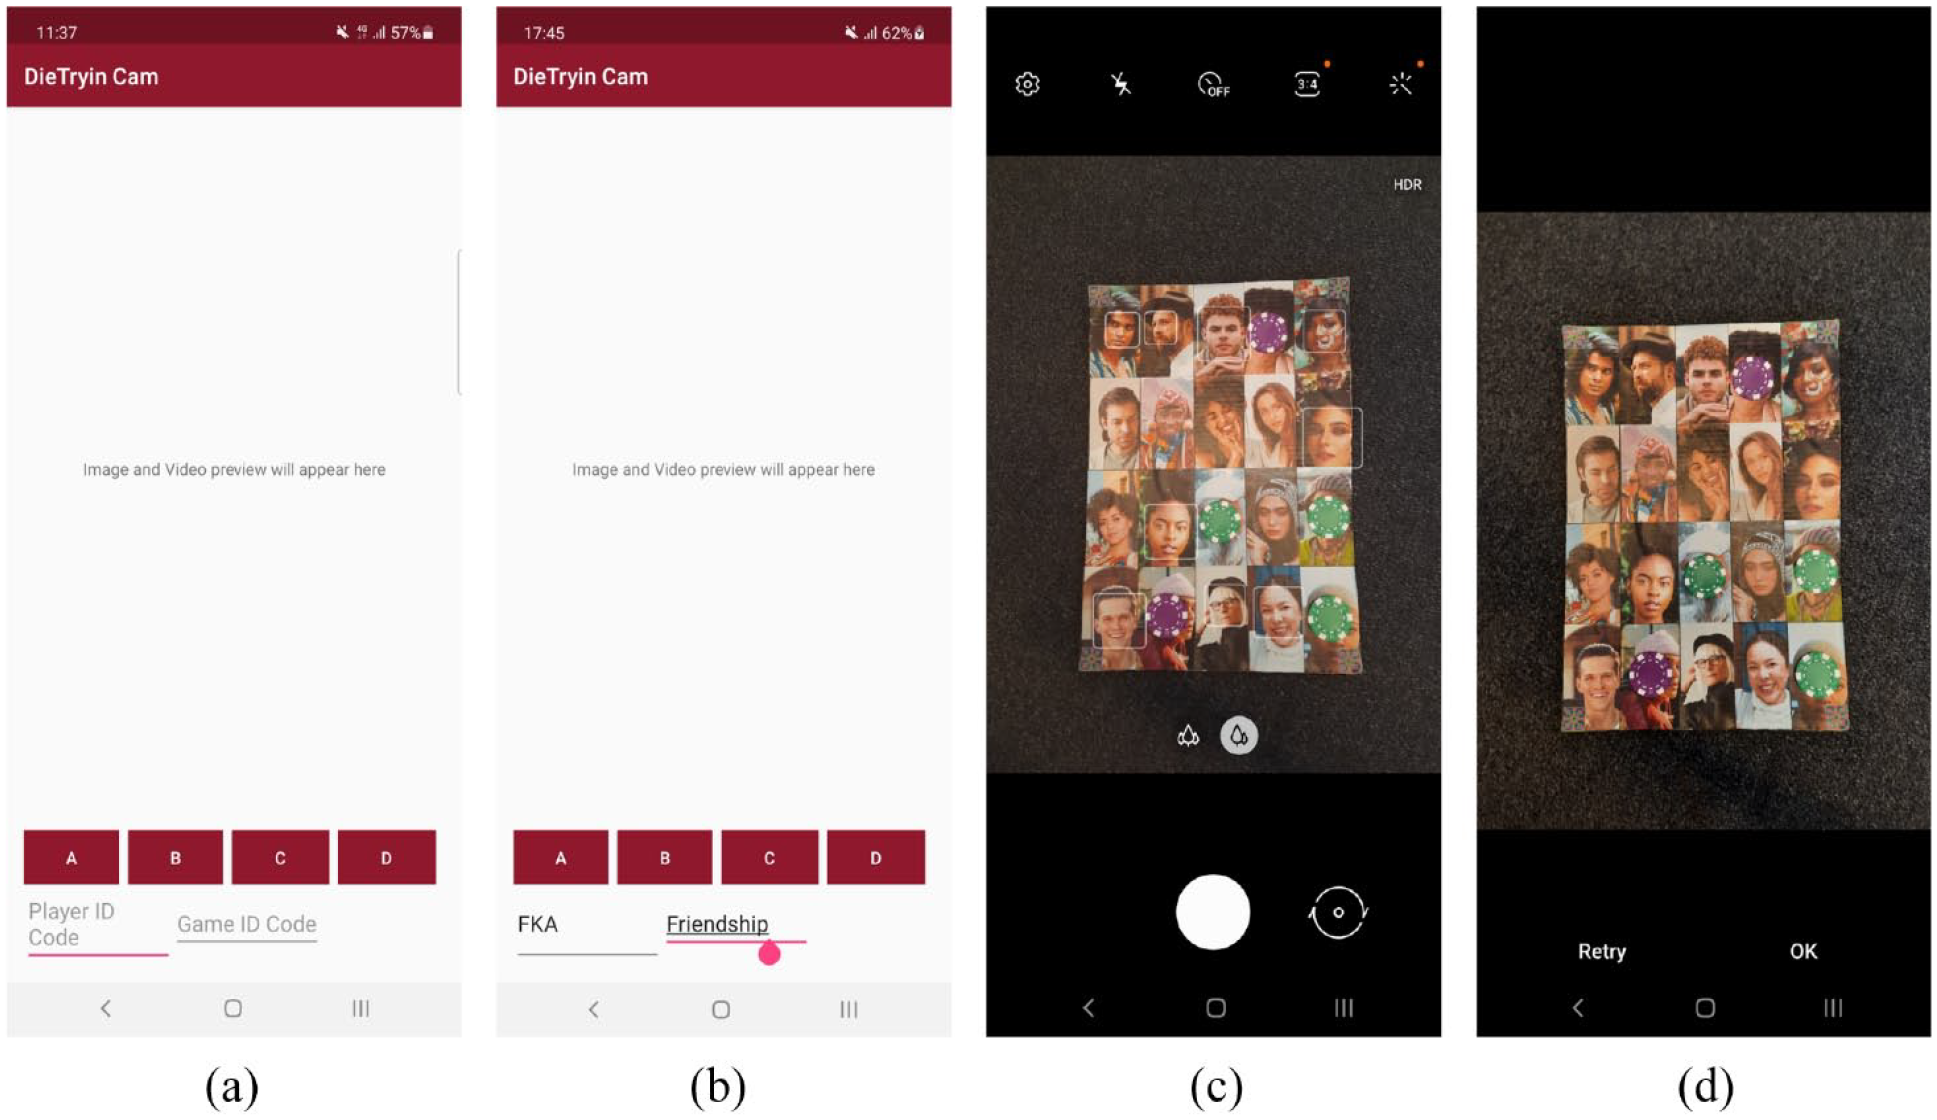
DieTryinCam v1.0 provides a simple graphical interface in which users can input relevant ID codes (see Figure 2), before calling the Android camera. Once the user photographs a particular game-board/photo-roster, the image will be saved in a dedicated folder with a file-name that includes all the information that DieTryin v2.0 needs to automatically code labeled edge-list data from the cell-phone image.
Collection of roster-based network ties or dyadic peer-ratings using DieTryinCam. In frame (a), the researcher opens the app. In frame (b), the researcher enters the ID code of the respondent along with the ID code of the game or question; in this example, individual FKA is being asked to name her friendship/adversary network (by placing green tokens on the roster to indicate friendships and purple tokens to indicate adversaries). In frame (c), the researcher takes a photograph of the distributed tokens to record the data, and then confirms the photograph in frame (d). Upon confirmation, DieTryinCam will save the photograph with a file name that includes the respondent ID (e.g. “FKA”), the question ID (e.g. “Friendship”), and the panel ID (e.g. “A”)—resulting in a file-name like “Friendship_FKA_A.jpg”. This data will be used by the DieTryin R package in order to create edge-list data labeled with game ID codes and token colors. (a) Step 1, the user opens the DieTryinCam app. (b) Step 2, the user enters the respondent/player ID code and the game/question ID code, and then clicks one of the four “panel ID” buttons, A, B, C, or D. (c) Step 3, the phone’s camera app will be opened, and the user can then photograph the appropriate game board panel. (d) Step 4, the user can either confirm the photo by pressing OK, or click retry to retake the photograph (if needed).
The DieTryinCam APK file is located at: https://github.com/ctross/DieTryin, and Android users can install it by permitting the installation of third party apps, and then opening the downloaded APK file.
Automatic data entry using DieTryin v2.0
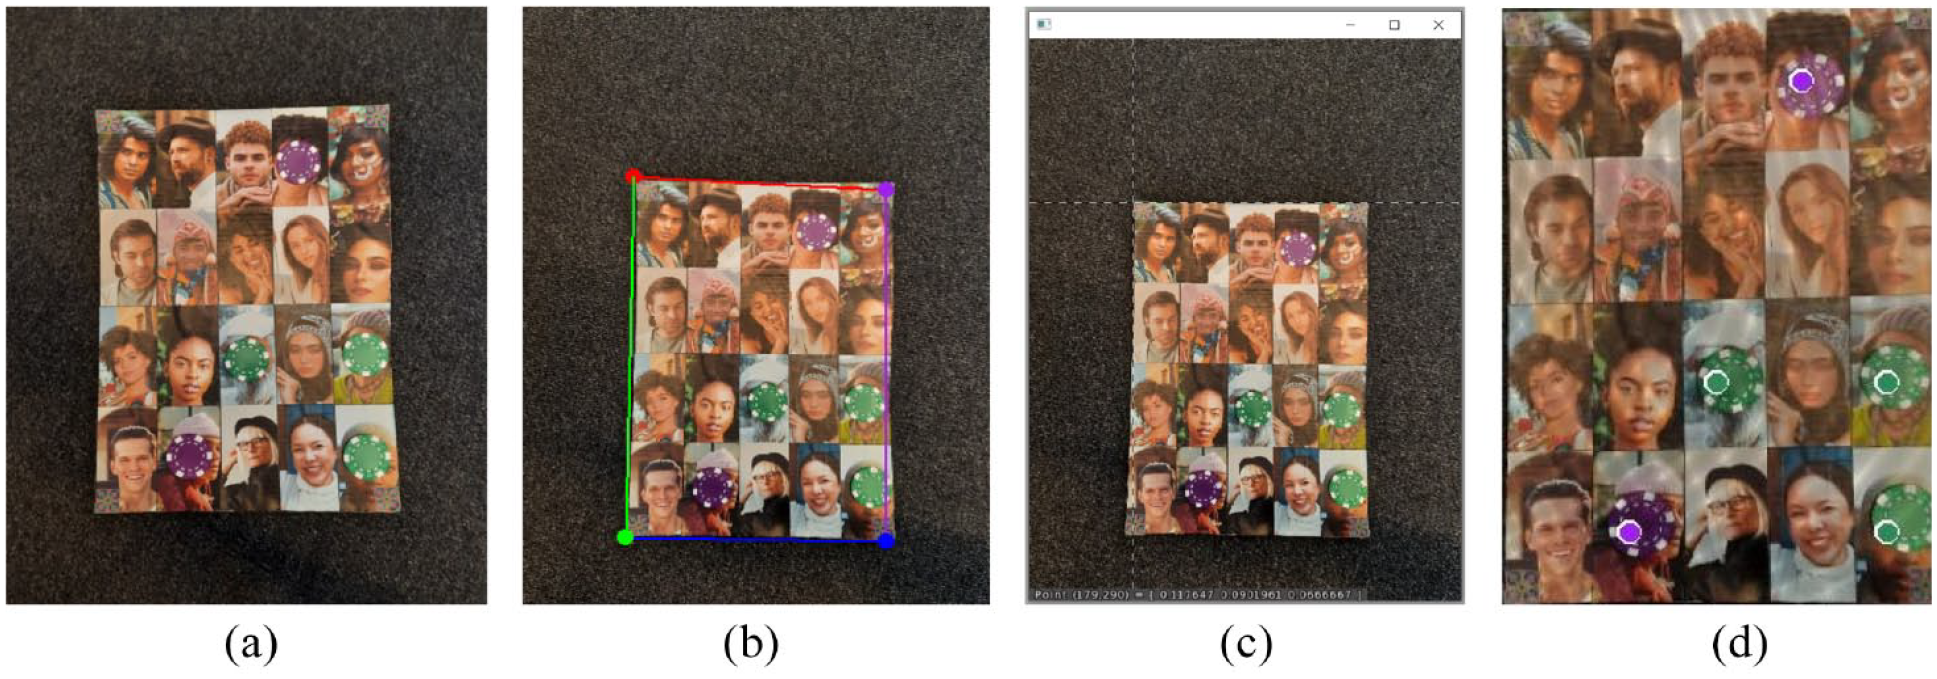
Fully automatic data entry in DieTryin v2.0 is made possible by an algorithm that detects the corners of the photo-roster in each cell-phone image, and then passes the roster sub-image into the classification algorithms discussed in Ross and Redhead (2022). The differences in the point-and-click versus unsupervised corner-detection algorithms are discussed in Figure 3. DieTryin v2.0 supports both manual and automatic corner detection, as the manual approach is sometimes needed to handle low-quality cell-phone images, or images captured under harsh or problematic lighting.
Tie classification using DieTryin v2.0. In frame (a), the social scientist uses DieTryinCam, and records, for example, the generosity ratings of a given respondent (with green tokens representing generous peers, and purple tokens representing selfish peers). DieTryinCam will save the photograph with a file name that includes the respondent ID (e.g. “FKA”), the question ID (e.g. “Generosity”), and the panel ID (e.g. “A”)—resulting in a file-name like “Generosity_FKA_A.jpg”. In frame (b), DieTryin v2.0 is used to automatically detect the corners of the game board. The details regarding the algorithm used to perform this classification are discussed in the Technical Methods section. In contrast, in frame (c), DieTryin v1.0 requires users to identify the corners of the game board using a point-and-click interface. Finally, in frame (d), the game-board/photo-roster is cropped out of the cellphone image, rotations and skews are corrected, and the image is fed into the token detection algorithm. DieTryin then builds and returns a color-labeled edge-list, linking the respondent ID code and the ID codes of each prospective token recipient on the game-board. (a) Step 1, a cell-phone photograph is taken using DieTryinCam, and respondent, game, and panel ID codes are stored in the file name. (b) Step 2, DieTryin v2.0 is used to automatically detect the edges of the game-board/photo-roster with zero user input. (c) Step 2, if DieTryin v1.0 is used, users must indicate game-board/photo-roster corners using a point-and-click interface. (d) Finally, image is cropped, corrected to remove rotation and skew, and then fed into the token detection algorithm.
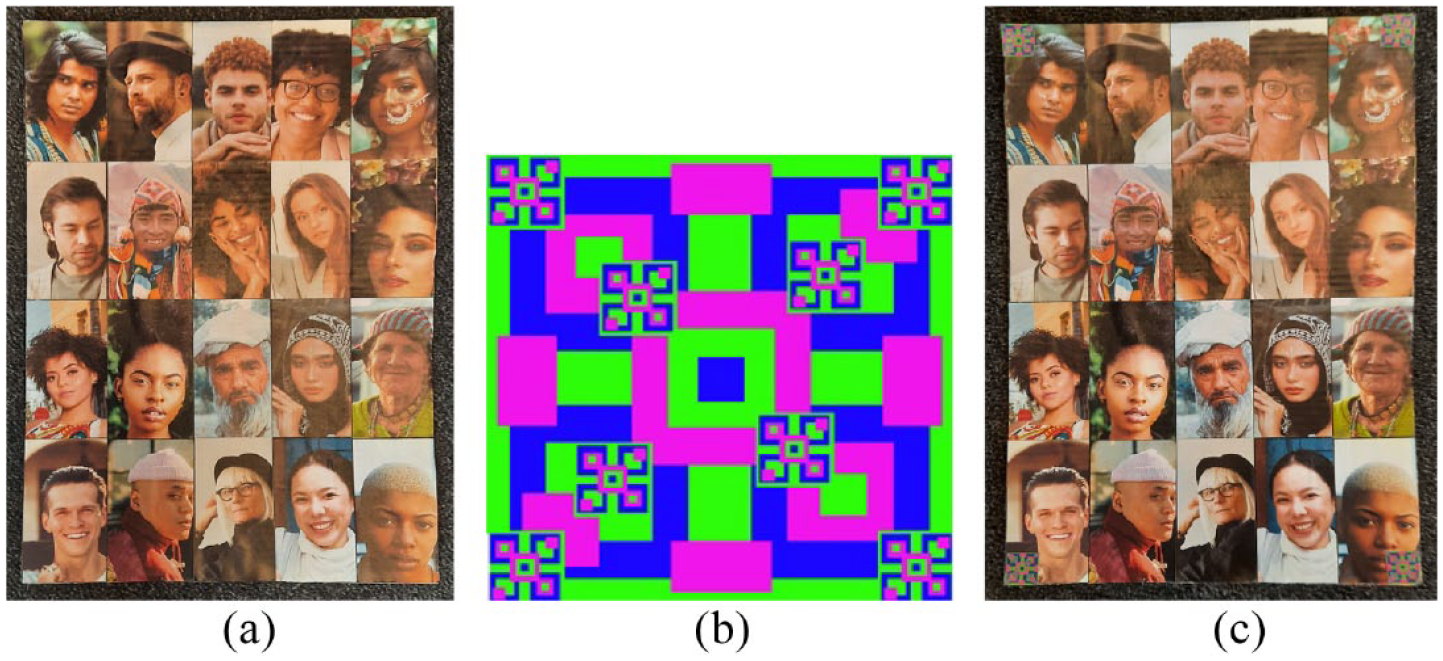
In order for automatic classification to be possible, the user must print out a simple matrix bar-code, which we will refer to as the “reference chip,” and place a copy in each corner of each roster panel (see Figure 4). The reference chip contains a specific distribution of hues, which can be detected by the corner detection algorithm in DieTryin v2.0. We provide the computational details in the Technical Methods section for interested readers.
In order for the roster to be automatically separated from the background image, DieTryin v2.0 identifies where a specific combination of colors occurs. The users must print out reference chip stickers and attach them to each corner of each roster panel. We provide a field-tested example of a reference chip in frame (b) above, but other patterns can be used by practitioners. (a) Step 1, the user creates a photograph roster. (b) Step 2, the user prints out a “reference chip,” an approximately 2 cm by 2 cm square that contains a specific combination of hues. (c) Step 3, the user places the reference chip in each corner of the roster.
A complete workflow with DieTryin v2.0
In what follows of the paper, we provide step-by-step instructions on how to use DieTryin to prepare, collect, and process roster-based dyadic data. We also provide an accessible tutorial workflow at: https://github.com/ctross/DieTryin, which contains additional annotated R code and example photograph datasets. Our tutorial trains end-users to run a full network study using DieTryin. Bug-reports, feature requests, and other relevant comments should be made through GitHub, where the package will be maintained.
Most of the functionally of DieTryin is already discussed in Ross and Redhead (2022). Here, we focus on the functionality related to data collection with DieTryinCam, and data entry with the unsupervised token detection algorithm.
Installation and setup
Much of the functionality of DieTryin is made possible by R (R Core Team, 2019) and the imager (Barthelme, 2019), philentropy (Drost, 2021), MASS (Venables and Ripley, 2002), and xtable (Dahl et al., 2019) packages and their dependencies, as well as by the LaTeX software system. The user must install these programs in order to reproduce our workflow.
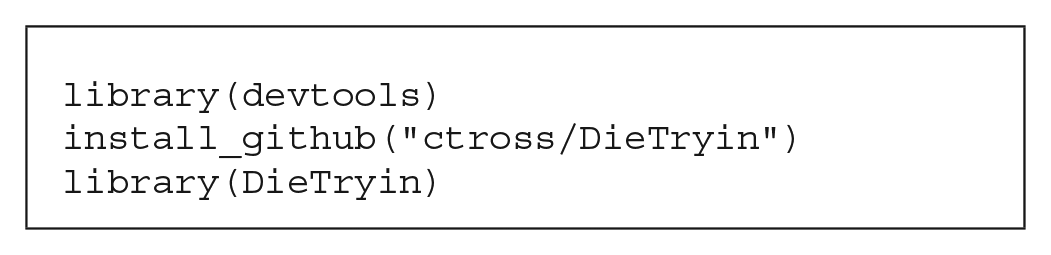
Installation and loading of DieTryin is then simple: just run three lines of code from R:
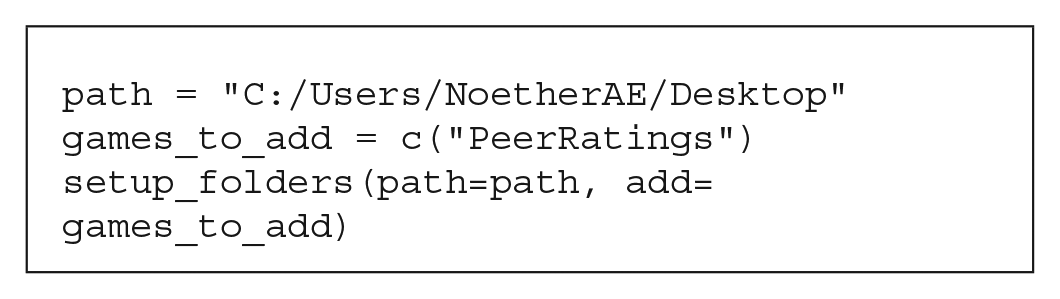
To add an extra folder to store data on peer ratings, we set: add=games_to_add, where games_to_add is a vector of folder names (in this case, we only add a single folder).
Next, the user must copy-and-paste respondent photographs into the RICH/RawPhotos folder. These should be jpg-formatted images. The filenames must include the unique identifier (ID) codes for the respondents: for example, FKA.jpg. If needed, the full directory of images can be rapidly processed to yield a database of standardized photos (see Ross and Redhead, 2022, for details). The user can then print these photographs and assemble the photo-roster.
Data collection with DieTryinCam
Once the photo-roster has been assembled, researchers can use it to collect social network data or dyadic peer-ratings. As an example, individuals might be asked to conduct peer ratings by placing green tokens on peers who are very generous, and purple tokens on peers who are very selfish. Then, following the example in Figure 2, researchers can use DieTryinCam to record the distribution of tokens, while simultaneously annotating the cell-phone photographs with respondent IDs, question IDs, and panel IDs. Once each panel of the roster is photographed, the researcher can ask the same respondent another question: for example, to indicate the wealthiest individuals on the roster by placing green tokens on their pictures, and indicate the poorest individuals by placing purple tokens on their pictures. The researcher then simply changes the question ID, while leaving the respondent ID unchanged, and records the data again. A complete interview must include a picture of each panel of the photo-roster with no tokens placed (the control condition; the question ID must be set to “Blank”), and images of each panel of the photo-roster for every other question asked.
Upon completion of the interview, the researcher will have a folder titled “RICH” in the images folder of their Android device, and this folder will contain all of the collected data. In order to automatically enter and code these data into a labeled edge-list, the researcher must transfer all key data to a computer where R has been installed and the installation and setup steps for DieTryin have been completed. In particular, the data photographs must be placed into the RICH/ResultsPhotos folder. Once this is done, the data are ready to enter.
Automatic data entry with DieTryin v2.0
For a user to implement automatic data entry, all photographs of a given respondent’s game boards must be pasted into the RICH/ResultsPhotos directory. To account for variation across respondents in the lighting of the photo-rosters, there should also be a photograph of each panel for each individual with no tokens placed (the control condition). Cell-phone photographs of the game boards, however, will normally suffer from rotation, skew, or shearing that can complicate automated data entry. To correct these visual distortions, DieTryin uses a two step process in R. First, the corners of each game board must be identified. Then, DieTryin will identify the camera position relative to the game board, and apply an algorithm that corrects any distortions and crops out the photo-roster.
To speed up the token detection and classification algorithms, photographs of the game boards can—optionally—be resized to smaller dimensions (e.g. 2000 by 1500 pixels):
downsize(path=path, scaler=2)
This line of code will copy all game board photographs, downsize them by a factor of 2, and save them in a new folder. If the files do not need to be resized, set scaler = 1.
If automatic classification is to be used, several pictures of the reference chip must be placed into the RICH/ReferenceChip folder; we recommend 5–10 images taken under a variety of lighting conditions (see Technical Methods section for details).
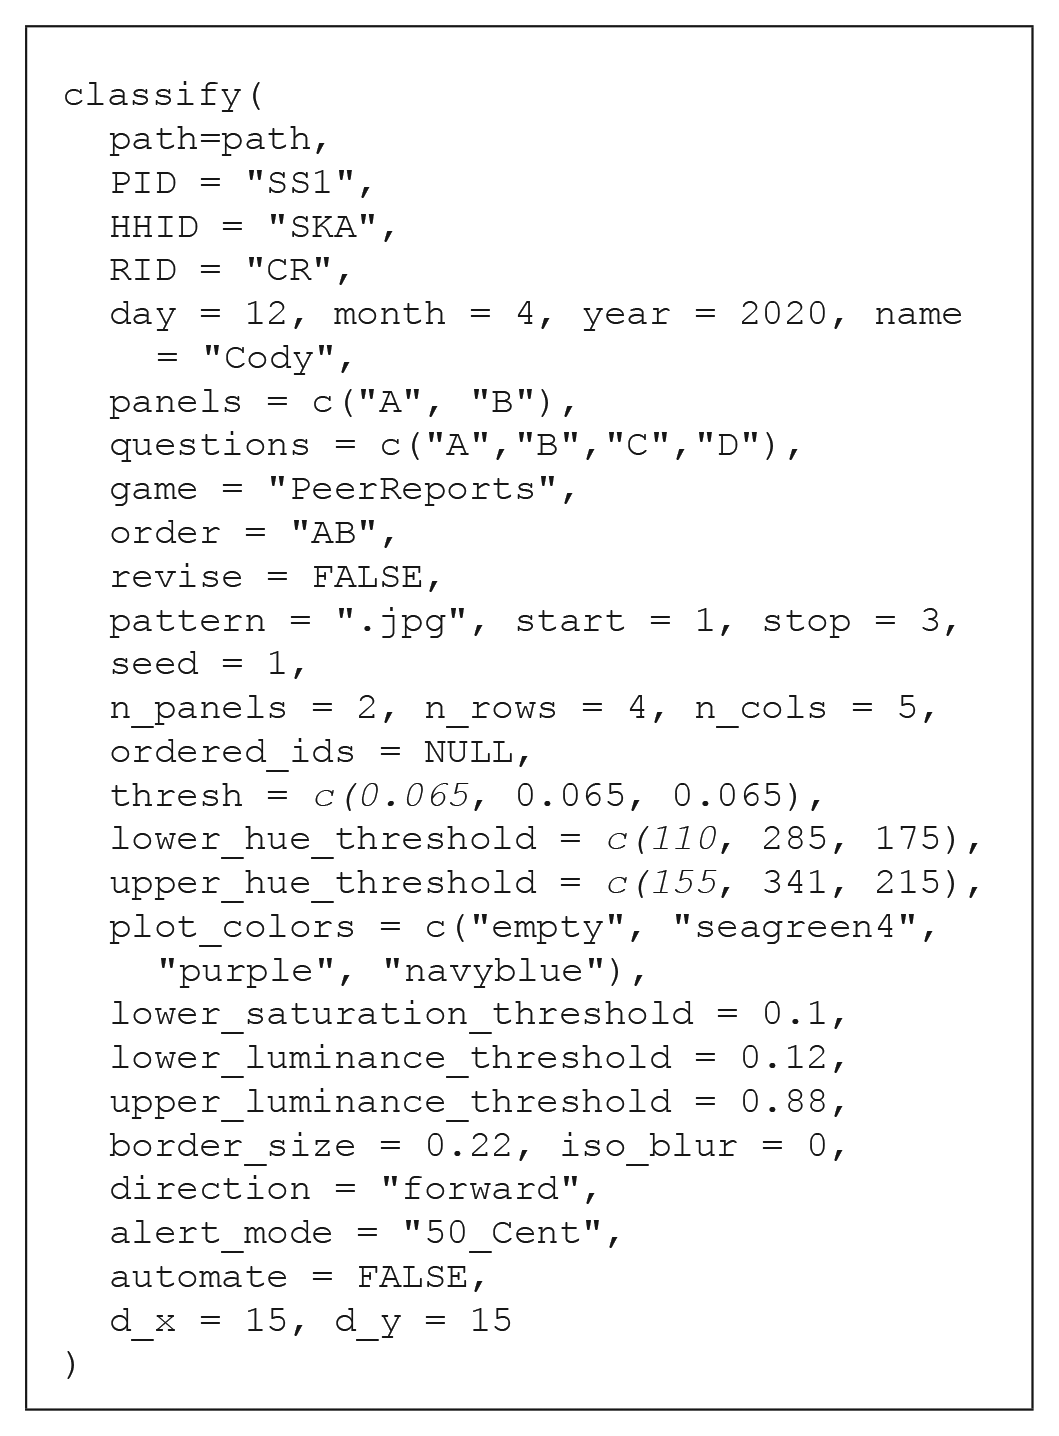
Next, the user can process all images for each respondent with a single function call:
The classify function has two main blocks of input arguments. The first block consists of header data that are typically respondent-specific. PID is a string giving the personal ID code of the respondent. HHID is a string giving the household ID code of the respondent. RID is a string giving the ID code of the researcher administering the interview. The arguments day, month, and year are numeric variables giving the date on which the interview was conducted.
The next block of arguments are typically invariant across all respondents, and are used to define which images should be classified, and control/tune the classification algorithms. The argument panels is a vector which contains the list of panel ID codes used in the study (DieTryinCam supports up to four panels). The argument questions is a vector which contains the list of question ID codes used in the study (this can be an arbitrarily long vector). The argument automate is a boolean variable which determines whether the roster is extracted from the image automatically using “reference-chip” detection, or manually using the version 1.0 point-and-click interface. The argument revise is a boolean variable; when set to TRUE, it allows the token detection algorithm to be run with updated parameter values, without requiring the user to re-run the corner detection algorithms.
There are three main parameters that control classification performance: thresh, which controls how much the percent difference in hue density must diverge between control and treatment cases for a tie to be declared, and lower_hue_threshold and upper_hue_threshold, which give the lower and upper bounds of the hue range corresponding to the token color (see Ross and Redhead, 2022, for more details). To identify good hue threshold values for a given token color, it is helpful to use a color picker app. We provide a simple interactive application in R—via the function: get_hue(file.choose())—for this purpose, but many online tools are also available. The argument plot_colors is a vector which contains the string “empty,” followed by the colors corresponding to the hue thresholds given above. These strings must be legal color values in R, as they will be used to label the edge-list data with token colors and used to plot inferred token placements back onto the photograph roster. Additionally, there are several other more technical parameters that can be modulated from their defaults to control classification (see Technical Methods).
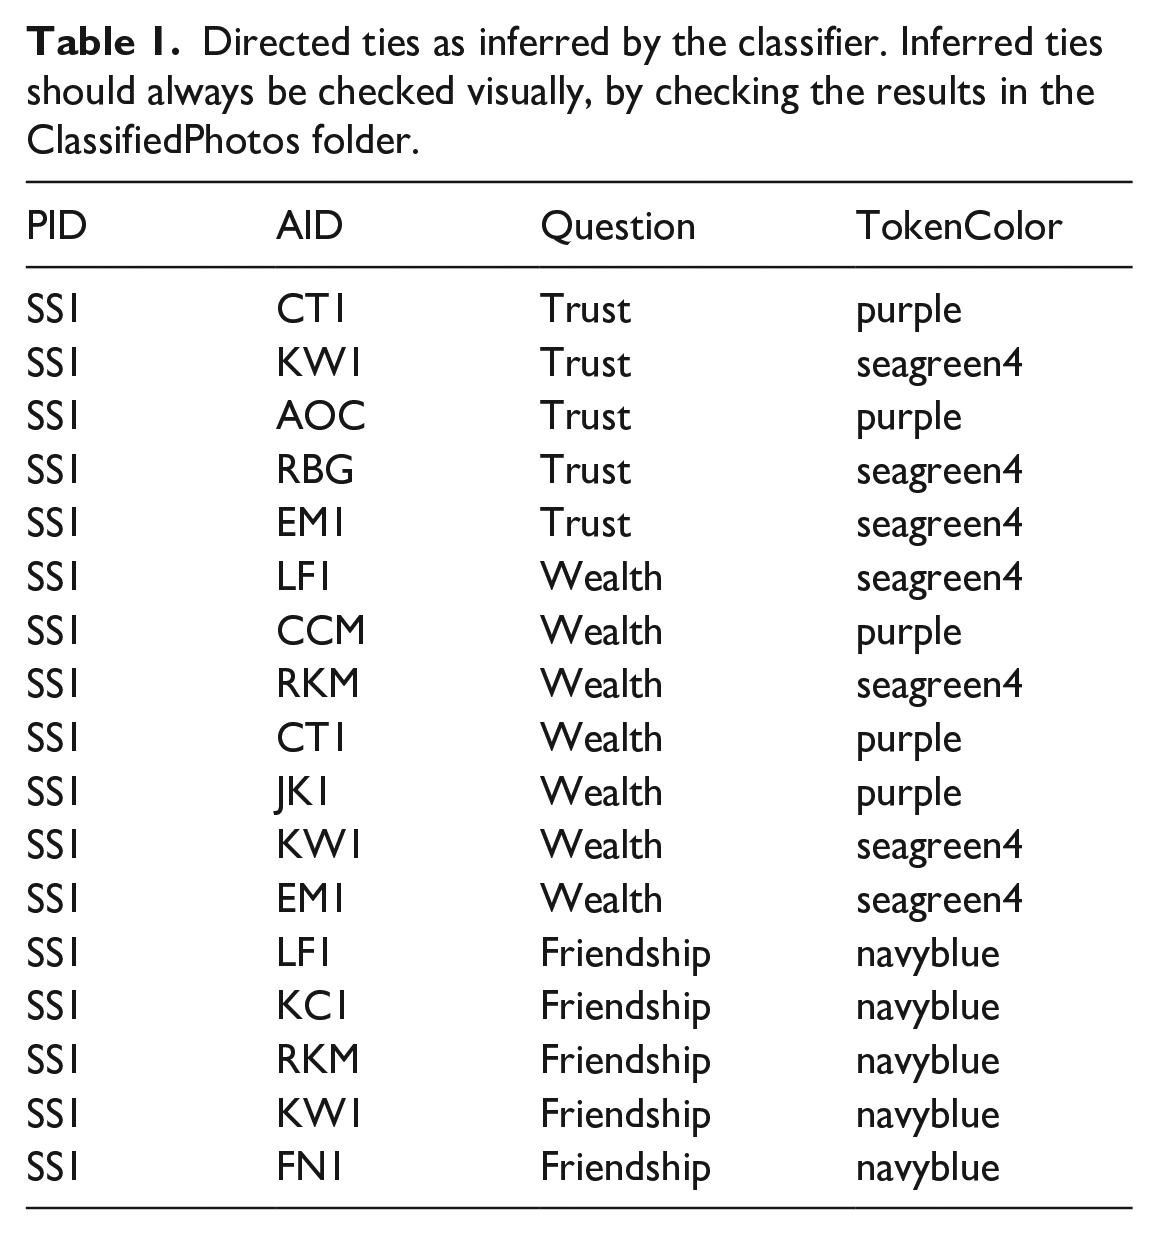
Running the classify function on the images included in the supplementary materials, yields a csv file with labeled edge-list data (see Table 1) and jpeg files that plot the predicted ties back on to the photograph roster. The plots of predicted ties allow users to rapidly check that the data have been classified correctly (e.g. see Figure 3d). These files are stored in the RICH/ClassifiedPhotos folder.
The classification model with default settings generally works well, but performance can be sensitive to input parameters, including the legal range of hues attributable to each token, and the required divergence in hue density between control and treatment photographs. These parameters can be optimized by the user prior to fieldwork using simulated allocations. Tokens of the cool hues like green, blue, and purple are generally easier to correctly classify, as they are less likely to overlap with skin hue than tokens of warm colors, like red or orange. Surprisingly, use of black-and-white recipient photos can decrease classification accuracy, since the hue of values of such photos in the control condition can vary a lot based on ambient lighting.
Directed ties as inferred by the classifier. Inferred ties should always be checked visually, by checking the results in the ClassifiedPhotos folder.
PID
AID
Question
TokenColor
SS1
CT1
Trust
purple
SS1
KW1
Trust
seagreen4
SS1
AOC
Trust
purple
SS1
RBG
Trust
seagreen4
SS1
EM1
Trust
seagreen4
SS1
LF1
Wealth
seagreen4
SS1
CCM
Wealth
purple
SS1
RKM
Wealth
seagreen4
SS1
CT1
Wealth
purple
SS1
JK1
Wealth
purple
SS1
KW1
Wealth
seagreen4
SS1
EM1
Wealth
seagreen4
SS1
LF1
Friendship
navyblue
SS1
KC1
Friendship
navyblue
SS1
RKM
Friendship
navyblue
SS1
KW1
Friendship
navyblue
SS1
FN1
Friendship
navyblue
Summary
Collecting and managing social network data in a generalizable and reproducible fashion has traditionally been difficult and time consuming. Nonetheless, such data are important for theoretical and empirical progress in a variety of disciplines. As such, there is value in advancing methods that make such data collection protocols more feasible. Building upon recent workflows and software for semi-automated data collection and processing of social network data (Ross and Redhead, 2022), we have developed an updated version of DieTryin that supports fully automated data entry and coding, easing the data entry and management burden of roster-based social network data collection. The DieTryin package provides a platform for generalizable and reproducible workflows in social network research. Alongside this, we have developed an Android app that simplifies data collection, and provides an intuitive interface that improves ease-of-use.
Technical methods
Much of the functionally of DieTryin is discussed in Ross and Redhead (2022). Our principle contributions here are the addition of an Android app to simplify data collection, the addition of under-the-hood functions to automatically segment cell-phone images and extract the photo-rosters, and the addition of some wrapper functions to simplify the workflow for end users. For example, the new classify function automatically implements the entire classification, validation, and annotation workflow that was presented piece-wise in Ross and Redhead (2022). Below, we provide some important technical details about the app and classification algorithm that may be of limited interest to most end-users, but may be important for a subset of researchers who seek to extend our software.
In some Android devices, the app may return an error: “User canceled image capture.” This error is remedied by creating a directory called “RICH” inside of the images folder on the Android device.
Other classification parameters
In the classify function, there are several other more-technical parameters that can be modulated from their defaults to control classification: lower_saturation_threshold controls the limit of saturation at which hue values are excluded from measurement (because they are essentially gray), lower_luminance_threshold and upper_luminance_threshold control the values of luminescence at which hue values are excluded from measurement (because they are essentially black or white, respectively), iso_blur controls the width (in pixels) of the isoblur applied to a target photo (a value of 0 turns off isoblur), border_size controls the width (in percent) of the excluded border zone (to minimize the effects of clothing or background colors), and direction ∈ {"forward", "backward"} indicates whether the distortion correction algorithm should be run in forward or backward mode. Forward mode is fast but produces lower-quality images, and backward mode is slower but produces higher-quality corrected images (see imager documentation for further details about these modes).
Corner detection and image segmentation in DieTryin
Corner detection and image segmentation in DieTryin is accomplished by using a reference chip (see main text) with a known hue distribution, and then measuring the KL divergence (Kullback and Leibler, 1951) between the reference pixel set and a kernel pixel set.
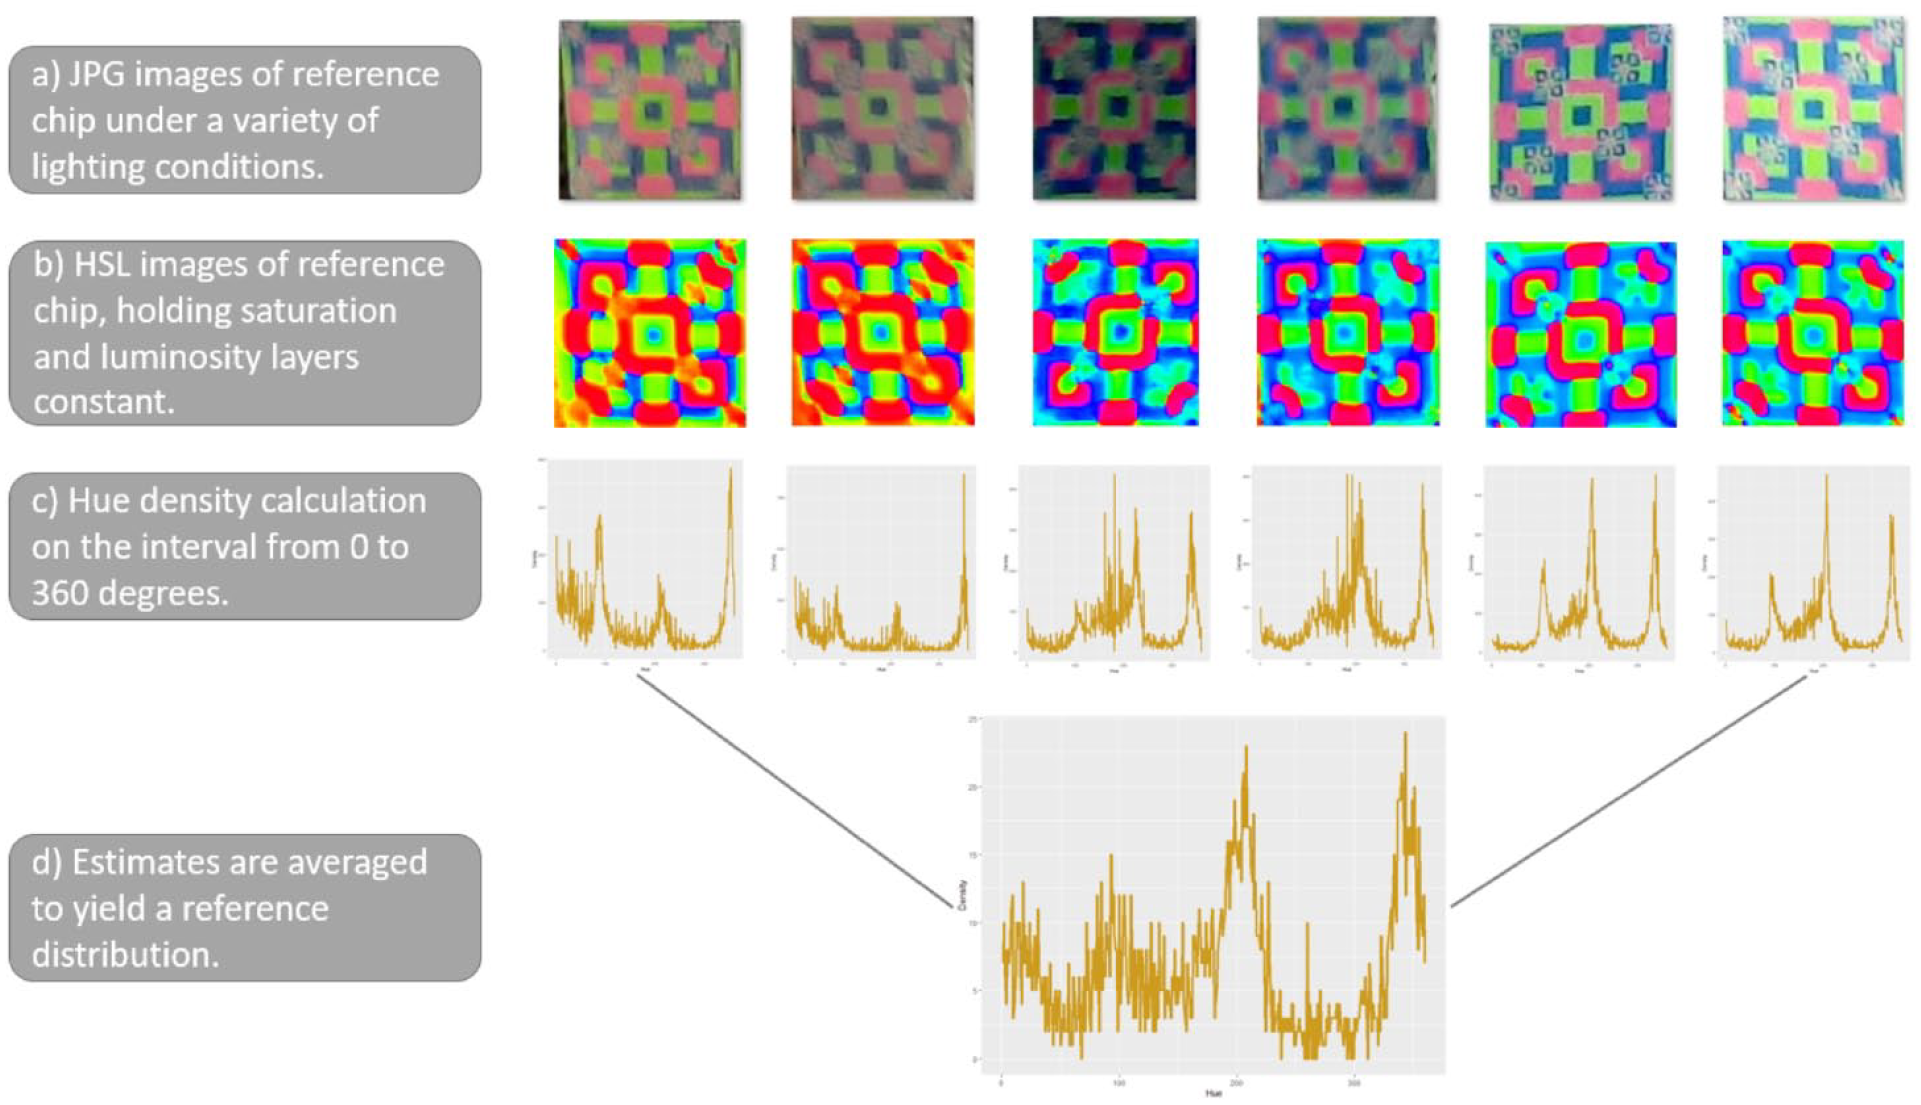
More specifically, we first build up a reference hue distribution, , by taking several JPG images of the photograph roster with the reference chip attached (it helps if there is some variance in lighting conditions between these photos). We then crop out only the reference chip, and save these files in the RICH/ReferenceChip folder. Under-the-hood, the grab_points_automatic function reads each of these files into R, standardizes their sizes and converts them into HSL images (Hue is represented in degrees around the unit circle and Saturation/Luminosity are represented as magnitudes on the unit interval). The hue layer is extracted from each image, , binned into one-degree intervals, and then normalized to yield a discrete probability mass distribution, . We then average across images to get the final reference distribution These steps are illustrated in Figure 5.
Construction of a reference set hue distribution.
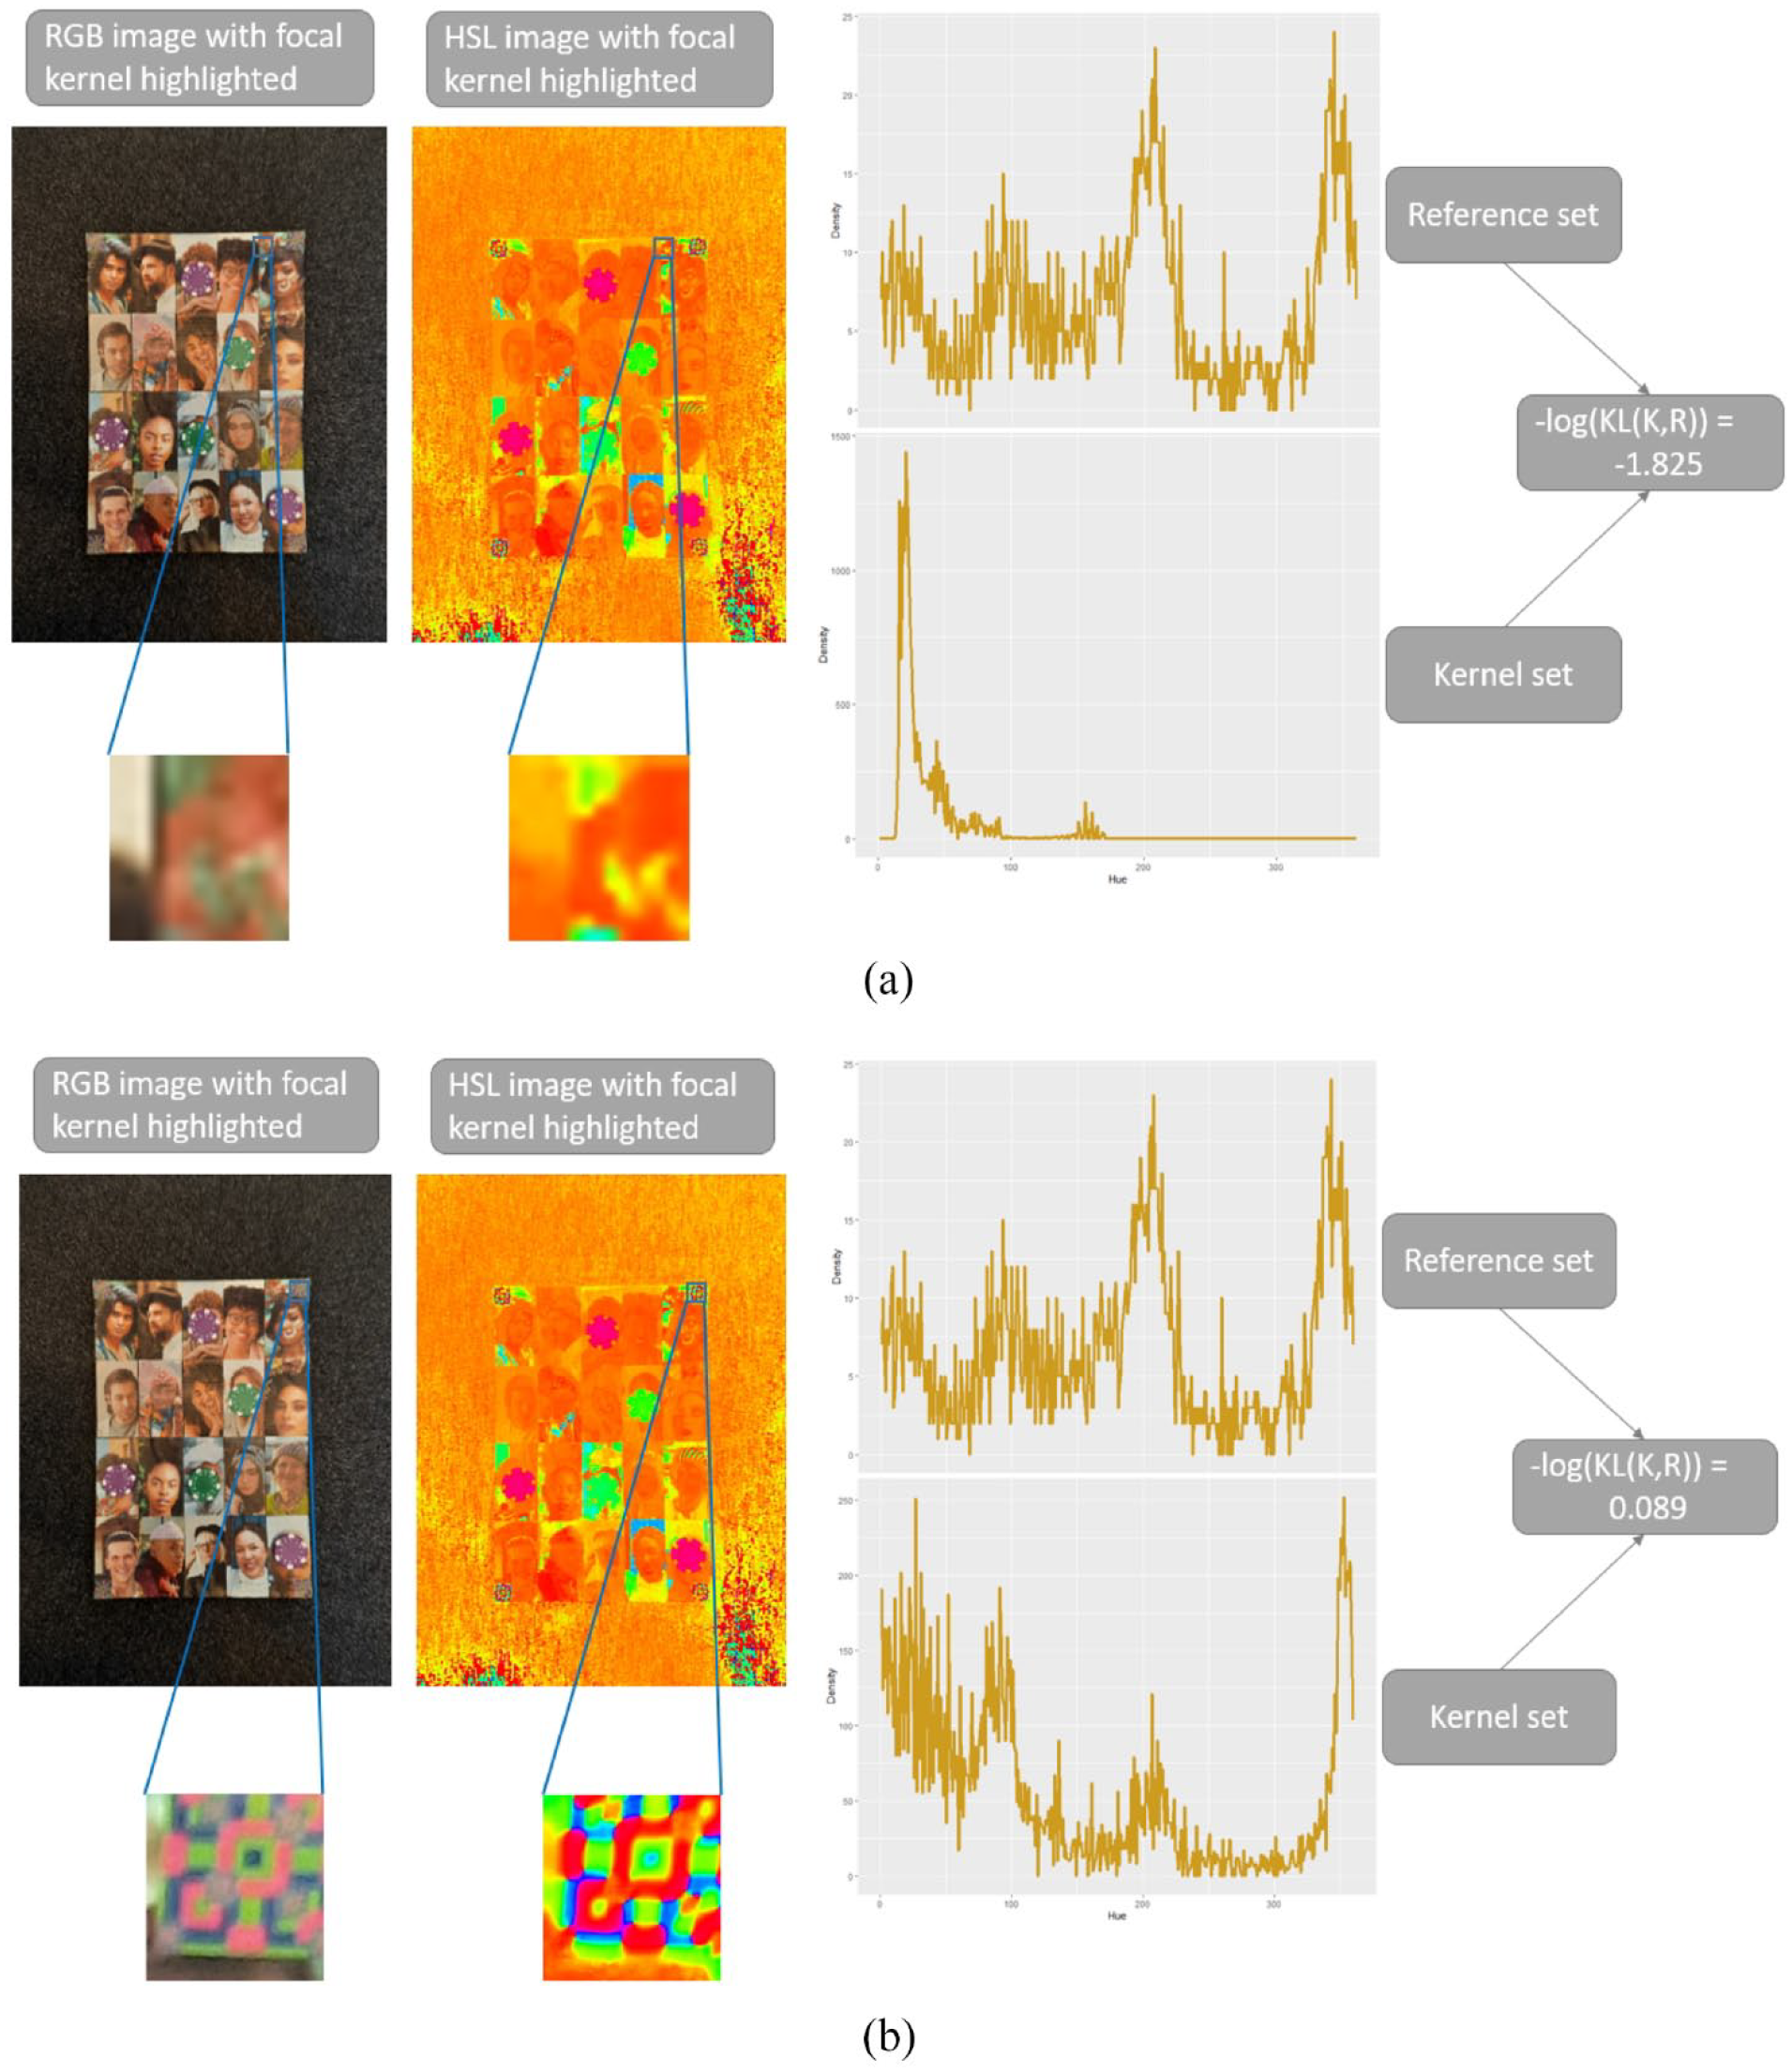
Next, the grab_points_automatic function reads the focal game-board image to be processed. A by pixel sub-image is then extracted from the focal image at coordinates ; we will refer to this set of pixels as the kernel set. This kernel set is then converted into an HSL image, and the hue density, , calculated as described above. We then calculate the (negative log of the) KL divergence, , between the kernel and reference sets using the KL function in the philentropy R package (Drost, 2021). The and values can then be incremented, and the process repeated. Figure 6 illustrates some values of for two positions of the kernel set on the focal image.
Measuring KL divergence between the focal image and the reference set. (a) The negative log KL divergence for a kernel set taken at a random position of the focal image. (b) The negative log KL divergence for a kernel set which covers the reference chip on focal image.
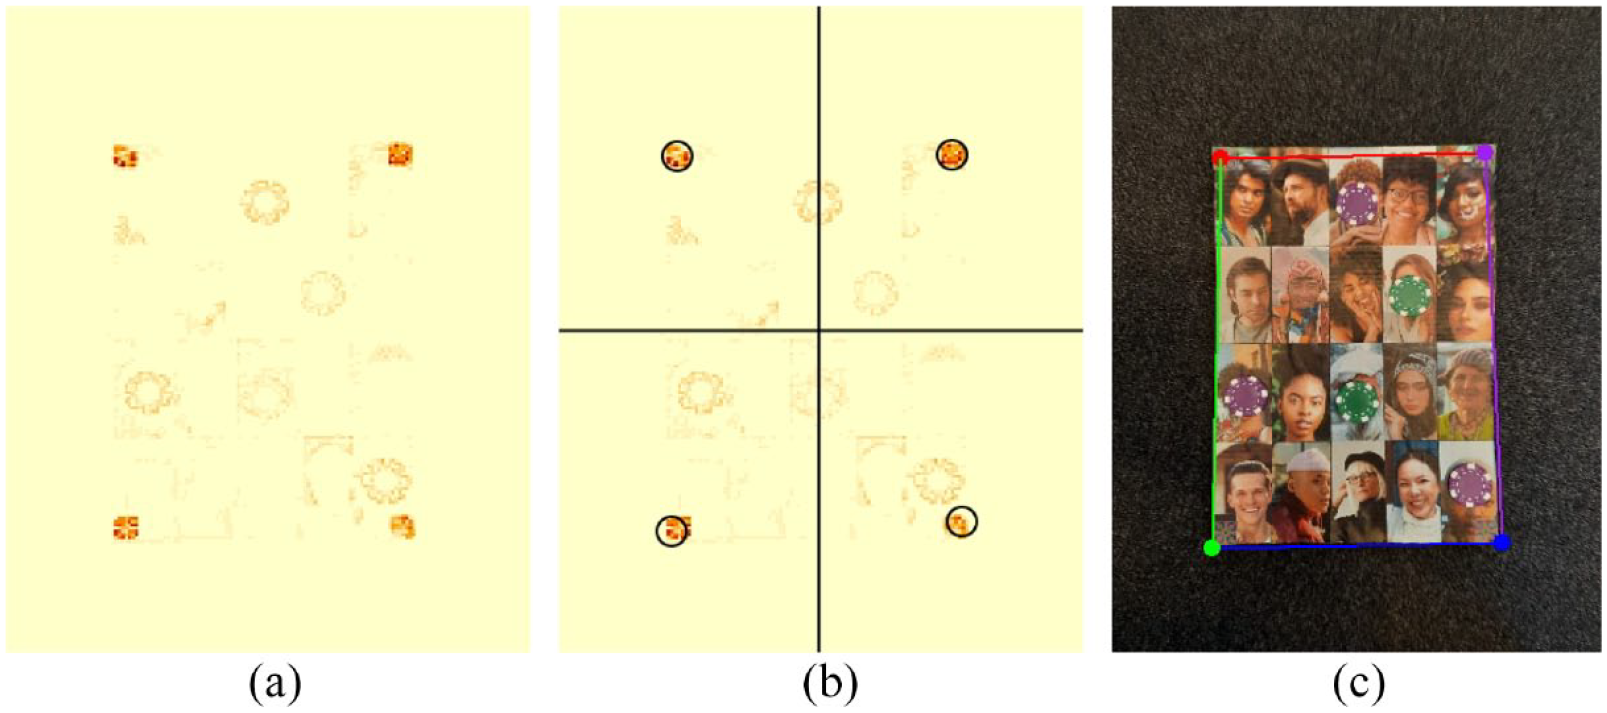
After the grab_points_automatic function has iterated KL divergence calculations across full sweeps of and values, we are left with a map, , of the similarity of each local pixel region to the reference set. We plot as a heat map in Figure 7a. Next, the focal image is broken into quadrants, and the location of the maximum of within each quadrant is determined, Figure 7b. Finally, the photograph roster is extracted from the focal image using the locations of the per-quadrant maxima.
Image segmentation based on KL divergence. (a) Similarity between the focal image and the reference chip. (b) The focal image is divided into quadrants and the location of the maximum of within each quadrant is determined. (c) The original focal image is segmented on the basis of the per-quadrant maxima.
Footnotes
Acknowledgements
C.T.R. and D.R. were supported by the Department of Human Behavior, Ecology, and Culture at the Max Planck Institute for Evolutionary Anthropology. Leipzig, Germany.
Declaration of conflicting interests
The author(s) declared no potential conflicts of interest with respect to the research, authorship, and/or publication of this article.
Funding
The author(s) received no financial support for the research, authorship, and/or publication of this article.
Cody T Ross is a group leader in the Department of Human Behavior, Ecology, and Culture at the Max Planck Institute for Evolutionary Anthropology. He holds a PhD in Anthropology from the University of California, Davis (2015). His research interests include social networks, inequality, and human well-being.
Daniel Redhead is a group leader in the Department of Human Behavior, Ecology, and Culture at the Max Planck Institute for Evolutionary Anthropology. He holds a PhD in Psychology from the University of Essex (2018). His research interests include cooperation, the dynamics of social relationships, inequality, and social hierarchy.
References
1.
AllenFBabusA (2009) Networks in finance. In: KleindorferPRWindYGuntherR (eds) The Network Challenge: Strategy, Profit, and Risk in an Interlinked World. Philadelphia, PA: Wharton School Publishing, pp.367–382.
BorgattiSPMehraABrassDJ, et al. (2009) Network analysis in the social sciences. Science323(5916): 892–895.
4.
BuyalskayaAGalloMCamererCF (2021) The golden age of social science. Proceedings of the National Academy of Sciences of the United States of America118(5): e2002923118.
5.
CarringtonPJScottJWassermanS (2005) Models and Methods in Social Network Analysis, vol. 28. Cambridge: Cambridge university press.
6.
CroftDPJamesRKrauseJ (2008) Exploring Animal Social Networks. Princeton, NJ: Princeton University Press.
GervaisMM (2017) RICH Economic games for networked relationships and communities: Development and preliminary validation in Yasawa, Fiji. Field Methods29(2): 113–129.
10.
HoffPDRafteryAEHandcockMS (2002) Latent space approaches to social network analysis. Journal of the American Statistical Association97(460): 1090–1098.
11.
JacksonMO (2010) Social and Economic Networks. Princeton, NJ: Princeton University Press.
12.
KosterJMLeckieG (2014) Food sharing networks in lowland Nicaragua: An application of the social relations model to count data. Social Networks38: 100–110.
13.
KullbackSLeiblerRA (1951) On information and Sufficiency. The Annals of Mathematical Statistics22(1): 79–86.
14.
LiljerosFEdlingCRNunes AmaralLA (2003) Sexual networks: Implications for the transmission of sexually transmitted infections. Microbes and Infection5(2): 189–196.
15.
LinN (2002) Social Capital: A Theory of Social Structure and Action, vol. 19. Cambridge: Cambridge University Press.
16.
MarsdenPV (1990) Network data and measurement. Annual Review of Sociology16: 435–463.
17.
MarsdenPV (2005) Recent developments in network measurement. In: CarringtonPJScottJWassermanS (eds) Models and Methods in Social Network Analysis. Cambridge: Cambridge University Press, pp.8–30.
18.
NewmanM (2018) Networks. New York: Oxford University Press.
19.
OhtsukiHHauertCLiebermanE, et al. (2006) A simple rule for the evolution of cooperation on graphs and social networks. Nature441(7092): 502–505.
20.
PisorACGervaisMMPurzyckiBG, et al. (2020) Preferences and constraints: The value of economic games for studying human behaviour. Royal Society Open Science7(6): 192090.
21.
PowerEA (2017) Social support networks and religiosity in rural South India. Nature Human Behaviour1(3): 1–6.
22.
R Core Team (2019) R: A language and environment for statistical computing. Available at: https://www.R-project.org/.
23.
ReadyEPowerEA (2018) Why wage earners hunt: Food sharing, social structure, and influence in an Arctic mixed economy. Current Anthropology59(1): 74–97.
24.
RedheadDMcElreathRRossCT (2023) Reliable network inference from unreliable data: A tutorial on latent network modeling using STRAND. Psychological Methods. Epub ahead of print 6 March 2023. DOI: 10.1037/met0000519.
25.
RedheadDPowerEA (2022) Social hierarchies and social networks in humans. Philosophical Transactions of the Royal Society B377(1845): 20200440.
26.
RobinsGPattisonPKalishY, et al. (2007) An introduction to exponential random graph (p*) models for social networks. Social Networks29(2): 173–191.
27.
RossCTRedheadD (2022) DieTryin: An R package for data collection, automated data entry, and post-processing of network-structured economic games, social networks, and other roster-based dyadic data. Behavior Research Methods54: 611–631.
28.
RucasSLGurvenMKaplanH, et al. (2010) The social strategy game. Human Nature21(1): 1–18.
29.
SmithKPChristakisNA (2008) Social networks and health. Annual Review of Sociology34: 405–429.
30.
SnijdersTAB (2017) Stochastic actor-oriented models for network dynamics. Annual Review of Statistics and Its Application4: 343–363.