
Abstract
Aggregated relational data (ARD), derived from questions of the form “How many people do you know who [belong to subpopulation X]?” are widely used to estimate the size and composition of social networks, often adopting the network scale-up method (NSUM). However, their measurement properties are insufficiently studied. The authors address this gap by assessing (1) the test-retest reliability of a large set of ARD questions and NSUM-estimated network sizes and (2) the convergent validity of these network size estimates. This mixed-methods study involved a heterogeneous quota sample of 50 citizens in Barcelona, Spain, in 2023. Respondents were interviewed twice over a 10- to 15-day period, answering a series of ARD questions on each occasion. Qualitative debriefing provided valuable insights into their response behaviors. Our findings indicate that NSUM accurately ranked respondents’ network sizes but did not estimate their values consistently across measurements. Respondents gave lower answers in the second interview than in the first. In particular, the network sizes of people with large networks (“hubs”) fluctuated significantly. NSUM-estimated network size moderately correlated with estimates from the summation method and Facebook friend counts. The authors discuss the implications and provide practical recommendations for ARD item selection and the use of NSUM instruments.
Keywords
Social scientists have long investigated how individuals’ relationships with different social groups reflect underlying population structures. Aggregated relational data (ARD) and the network scale-up method (NSUM) are effective tools for such research. ARD are responses to survey questions of the form “How many people do you know who [belong to subpopulation X]?” (Breza et al. 2020). When linked to respondents’ own subpopulation memberships, such questions reveal how well connected different segments of the population are. ARD questions form the core of NSUM (Bernard et al. 1989; Killworth, Johnsen et al. 1998; McCarty et al. 2001), which estimates the size of “hard-to-count” subpopulations (i.e., subpopulations that lack official statistics and are difficult to sample), such as undocumented migrants or lethal victims of a natural disaster. In this methodology, a random sample of the national population reports how many people they know who belong to the hard-to-count subpopulation, along with various subpopulations with known sizes. Responses for the known subpopulations help researchers estimate respondents’ network sizes (see the next section for more details). Responses for the unknown subpopulations are then used to infer their size on the basis of individuals’ estimated network sizes and the national population size.
NSUM has been used to estimate the size of subpopulations relevant to public health (e.g., men who have sex with men [Ezoe et al. 2012], women who have had abortions [Sully, Giorgio, and Anjur-Dietrich 2020]), criminal justice (e.g., victims of cybercrime [Breen, Herley, and Redmiles 2022], victims of trafficking [Li et al. 2023]), and disaster management (e.g., forcibly displaced people [Schroeder et al. 2019]), among other areas. Organizations such as the Joint United Nations Programme on HIV/AIDS and the World Health Organization have embraced these methods for gaining valuable information on vulnerable subpopulations (Shelton 2015; UNAIDS 2010; UNAIDS/WHO Working Group on Global HIV/AIDS and STI Surveillance 2010).
Beyond estimating hard-to-count subpopulations, ARD and NSUM have been used to assess individuals’ acquaintanceship network size (e.g., Feehan, Son, and Abdul-Quader 2022; Hofstra, Corten, and van Tubergen 2021; Lubbers, Molina, and Valenzuela-García 2019), network composition (Otero et al. 2022), and segregation (Breza et al. 2020; DiPrete et al. 2011; Zheng, Salganik, and Gelman 2006). These uses of ARD questions help us understand broad structural differences in social connectivity, such as between men and women or upper and lower social classes, and their implications, for instance, for mobilization of support, which affects individual outcomes like health and social mobility, and for collective outcomes such as societal cohesion. The growing interest in this type of data has fostered research into question-order and interviewer effects (Snidero et al. 2009) and the robustness of ARD instruments (Kunke et al. 2024). Researchers have improved estimation methods (e.g., Feehan and Salganik 2016; Feehan et al. 2016; Habecker, Dombrowski, and Khan 2015; Laga, Kunke, et al. 2024; Maltiel et al. 2015; McCormick, Salganik, and Zheng 2010) and implemented them in R packages (e.g., Laga, Bao, and Niu 2021; Maltiel et al. 2015).
Yet despite their growing popularity, the measurement properties of ARD questions and NSUM-estimated network sizes remain largely unknown, even though they are crucial for ensuring the outcomes’ robustness, credibility, and replicability. For instance, if individuals respond inconsistently to the same ARD questions on different occasions, these questions’ ability to accurately measure important social dimensions and their predictive power is questionable. To our knowledge, the test-retest reliability of individuals’ estimated network size and ARD responses has only been reported twice. Kazemzadeh et al. (2016) reported a substantial mean test-retest agreement of
In this article we address these gaps by (1) estimating the test-retest reliability of ARD and NSUM-estimated network size, (2) estimating the convergent validity of NSUM-estimated network sizes by providing “relationships between test scores and other measures intended to assess the same or similar constructs” (American Educational Research Association, American Psychological Association, and National Council on Measurement in Education 2014:16–17), and (3) reaching a deeper understanding of response behaviors. To achieve this, we conducted a mixed-methods study in Spain in 2023 among 50 respondents, interviewed twice over 10 to 15 days. Both interviews included ARD questions regarding a wide range of subpopulations, as well as questions about respondents’ attributes and two related measures of individuals’ acquaintanceship network size. We qualitatively debriefed respondents about their response behaviors.
The study addresses four research questions (RQs): (1) How well do respondents understand and follow the instructions for ARD questions? (2) What are the test-retest reliability and agreement of ARD questions, and which types of questions are more and less reliable? (3) What are the test-retest reliability and agreement of acquaintanceship network size estimated using NSUM procedures, and which types of individuals have more and less reliable network size estimates? and (4) How well does the NSUM-estimated network size align with other measures of acquaintanceship network size?
RQs 1 and 4 are exploratory. Regarding RQ 2, we expected individuals’ ARD responses to be similar on the two measurements, indicating good reliability. However, if responses varied over time, we expected higher responses in the second measurement because of potential recall. This pattern would suggest good reliability in terms of ranking but lower agreement in the values. For RQ 3, as ARD questions about relatively rare names generate fewer biases than questions about other subpopulations (see next section), we expected name questions to have higher test-retest reliability than questions regarding other subpopulations (e.g., the number of people with particular occupations or religions). We also expected the first ARD items in the questionnaire to be more reliable than subsequent ones, given respondents’ limited attention span and difficulty retaining the definition of knowing over time (Habecker 2017). Finally, we expected that test-retest reliability would be higher among younger individuals, because of better memory, and among higher educated individuals, because of potentially greater consistency in understanding.
The Network Scale-Up Method
The NSUM was designed to estimate the size of hard-to-count subpopulations. Its inventors (Bernard et al. 1989) stipulated that the size of these subpopulations could be estimated on the basis of their prevalence in the acquaintanceship networks of a representative population sample and the total population size. Killworth, McCarty, et al. (1998) formalized this relationship as
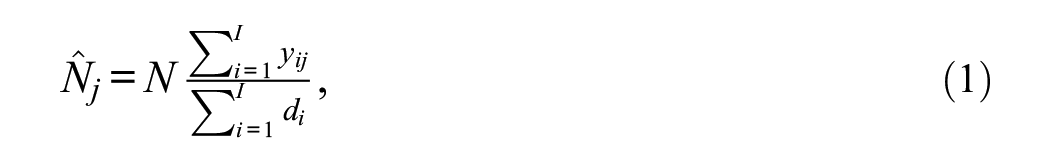
where
where
The method relies on three main assumptions. First, respondents are expected to know people independently of the subpopulations they belong to, for the subpopulations of interest. This assumption of random mixing would be violated if, for instance, respondents associate more with people from their own subpopulations than with others (i.e., homophily; McPherson, Smith-Lovin, and Cook 2001). Such violations are called barrier effects. Second, respondents are assumed to have full knowledge of each network member’s belonging to the subpopulations they are asked about. Violations of this assumption due to, for instance, not knowing network members well enough or network members’ hiding their attributes because of stigma are called transmission errors. Third, respondents are assumed to know their exact number of acquaintances in each subpopulation, which is easier for smaller than larger subpopulations. Violations of this assumption are called recall bias.
To estimate individuals’ degrees (and therefore the size of hard-to-count subpopulations) with minimal bias, McCormick et al. (2010) proposed using a set of relatively rare first names as subpopulations. By selecting names whose bearers collectively represent society in terms of gender, age cohort, and other attributes for which national statistics are available, barrier effects are minimized. First names are typically one of the first things people know about others (Morgan 2009), which reduces transmission errors. Furthermore, by selecting relatively rare names (McCormick et al. [2010] recommend names with a 0.1 percent to 0.2 percent population prevalence), respondents are more likely to accurately recall how many people they know with those names, reducing recall bias.
Subpopulations other than names have also been used, both as unknown subpopulations whose size is to be estimated (e.g., sex workers, homeless people) and as known subpopulations that help estimate acquaintanceship volume (e.g., occupations, demographics like “widow[er]s under 65”). Although they may have higher barrier effects than names, Zheng et al. (2006) and DiPrete et al. (2011) showed that instead of assuming random mixing, it is possible to estimate the extent to which observed variation exceeds expected variation on the basis of random mixing. This “overdispersion” indicates barrier effects and, more substantively, social segregation (DiPrete et al. 2011). Their proposal adds another substantive use to NSUM.
Killworth, Johnsen, et al. (1998) used a simple Maximum Likelihood estimator, and Zheng et al. (2006) proposed an improvement, using multilevel overdispersed Bayesian Poisson regression models to capture the variability in individual propensities to connect to different groups, thereby controlling for barrier effects. More advanced methods are available (see Laga et al. 2021), but they are too complex for our small, nonprobability sample.
Methodology
Sample
The data were collected between May and August 2023 for a pretest of a large survey. 1 A quota sample 2 of 50 individuals was drawn from the resident population of Barcelonès county in Spain, containing Barcelona and four adjacent municipalities. To ensure diversity in key variables that could affect response behaviors (e.g., comprehension and memory), we defined the quotas on the basis of the intersections of migration background (70 percent locals, 30 percent born abroad), gender (50 percent female, 50 percent male), and education level (50 percent lower to middle vocational education, 50 percent higher education). Each segment (e.g., men and women) included a range of ages. Because of some attrition caused by scheduling issues (n = 2) and nonresponse to the second invitation (n = 1), we calculated test-retest statistics for 47 respondents. Of these 47, 24 were women (51 percent); 16 were 18 to 34 years old, 16 were 35 to 54 years old, and 15 were 55 to 84 years old; and 60 percent were born in Spain and 40 percent abroad (32 percent of the latter were raised in Spain). Eighteen respondents completed secondary education or lower, 8 completed middle or higher vocational education, and 21 had university education.
Procedures
We interviewed respondents twice, 10 to 15 days apart (mean = 12.6 days; in one case, 19 days because of scheduling conflicts). The interval was based on Polit (2014), who reported one to two weeks, and Nunnally and Bernstein (1994), who suggested two weeks. Recommendations regarding time intervals vary widely, but the general advice is to choose a period long enough to avoid memory effects but short enough to prevent real changes in the underlying construct. Given the difficulty of recalling exact responses to 48 items and the instability of weak relationships (see Hidd et al. 2022), we chose 10 to 15 days.
Five field-workers with BSc or MSc degrees in social sciences conducted the interviews after receiving three training sessions. In the first interview, they administered the survey, including the ARD questions described below. At the end, respondents were debriefed qualitatively to understand response behaviors better. In the second interview, all ARD questions about first names and a selection of the other questions were readministered, with the exact same instructions. With respondents’ consent, both interviews were recorded to transcribe relevant parts and identify difficulties encountered during the interviews. Throughout the text, we denote the first and second interviews as
Respondents were informed about the study’s objectives and their right to skip questions and to withdraw at any time. They received modest compensation for both interviews, which the invitation had not mentioned. The ethics committee of the Autonomous University of Barcelona approved the procedures (ID 5675).
Measures
ARD
The first interview included 48 ARD questions for all respondents, preceded by the following introduction: Now I will ask you about people you know in general. By knowing someone, we mean that you know that person BY SIGHT AND BY FIRST NAME, and that this person also knows you by sight and name. This includes both CLOSE RELATIONSHIPS, such as your partner, family, and friends, and LESS CLOSE RELATIONSHIPS, such as people you have met in your neighborhood, at work, or through other people, and even PEOPLE YOU DON’T KNOW WELL OR YOU DON’T LIKE. These people do not have to live near you. (INTERVIEWER, IF NECESSARY, ADD: “Please do not include people who are deceased, under the age of 18, or yourself.”) Please take as much time as you need to respond.
ARD questions are cognitively demanding because people tend to organize relationships in their memory by context (e.g., family, work; Fiske 1995), and ARD questions require cross-referencing these contexts. To aid respondents’ recall, we designed an A4-sized response card listing potential social contexts and the definition of knowing someone (see Supplemental Figure S1 in the online supplement). Interviewers placed this card on the table for respondents to glance at if they wished.
Interviewers then asked, “How many people of 18 years and older do you know in Spain who [belong to a certain subpopulation]?” Twelve questions concerned occupations with varying prestige (e.g., lawyers), 3 social statuses (e.g., homeless, unemployed), 7 origins and ethnicities (e.g., people with African ancestry who live in Spain [e.g., from Morocco, Senegal, or Gambia]), 3 religions (e.g., Muslims), 3 political orientations (e.g., people probably voting VOX [a national far-right party] and people probably voting CUP [a radical left-wing, anticapitalist Catalan proindependence party]), and 20 first names (e.g., women whose first name is Amparo). Before the names questions, interviewers repeated the definition of knowing someone. Interviewers used the “if necessary” instruction in only a few cases, when they detected or suspected that respondents deviated from the instructions.
The response format was numeric (0, 1, 2, . . .), but higher numbers were categorized into bins (11–20, 21–50, >50). We used three bins because an earlier survey in Spain had many cases in a single upper category, “11 or more,” for some questions (Lubbers forthcoming). Past NSUM research has asked respondents to provide exact numbers, either with top coding (e.g., Lubbers et al. 2019; Sully et al. 2020) or without it (e.g., Habecker 2017; Killworth, McCarty et al. 1998) or to select from predefined bins (e.g., DiPrete et al. 2011; Hofstra et al. 2021). Bins reduce respondent burden, especially when asking about large subpopulations (DiPrete et al. 2011). For analysis, we recoded bins to their midpoints: “11 to 20 persons” to 15, “21 to 50” to 35, and “>50” to 51.
We used the same set of first names as a national survey conducted in Spain in 2021 (n = 1,500). The selection was based on national statistics of name prevalence by gender and birth cohort (in decades) in 2021 from Spain’s National Institute of Statistics. For the present study, we updated the prevalences using the most recent statistics (from January 1, 2022) available at the start of data collection. Name selection followed these principles: (1) each name had a low prevalence in the population according to national name statistics (0.06 percent to 0.26 percent in the updated statistics); (2) collectively, the bearers of these names represent, on a smaller scale, the gender × birth cohort distribution of Spain’s overall population; (3) names clearly associated with a specific social class, such as Cayetano or Borja for male upper-class names, were avoided; and (4) name variations were included to account for linguistic differences in Spain.
If individuals reported knowing no one on more than 10 first names, they were asked about four additional names twice as prevalent as the others, without being informed of this difference. Conversely, if they reported knowing five or more persons for each of 15 or more first names, they were asked about four additional names with half the prevalence as the others. These questions helped us discern over- or underreporting from having larger or smaller network sizes. Thresholds were chosen on the basis of previous survey data, where the number of zero responses was more evenly distributed than the number of high responses.
In the second interview, interviewers repeated the 20 name questions and a selection of 13 other ARD questions to estimate test-retest reliability (see Table 1 for the repeated subpopulations). These questions were preceded by the same introductions as at
Test-Retest Variability for ARD Questions and Network Scale-Up Method–Estimated Network Size.
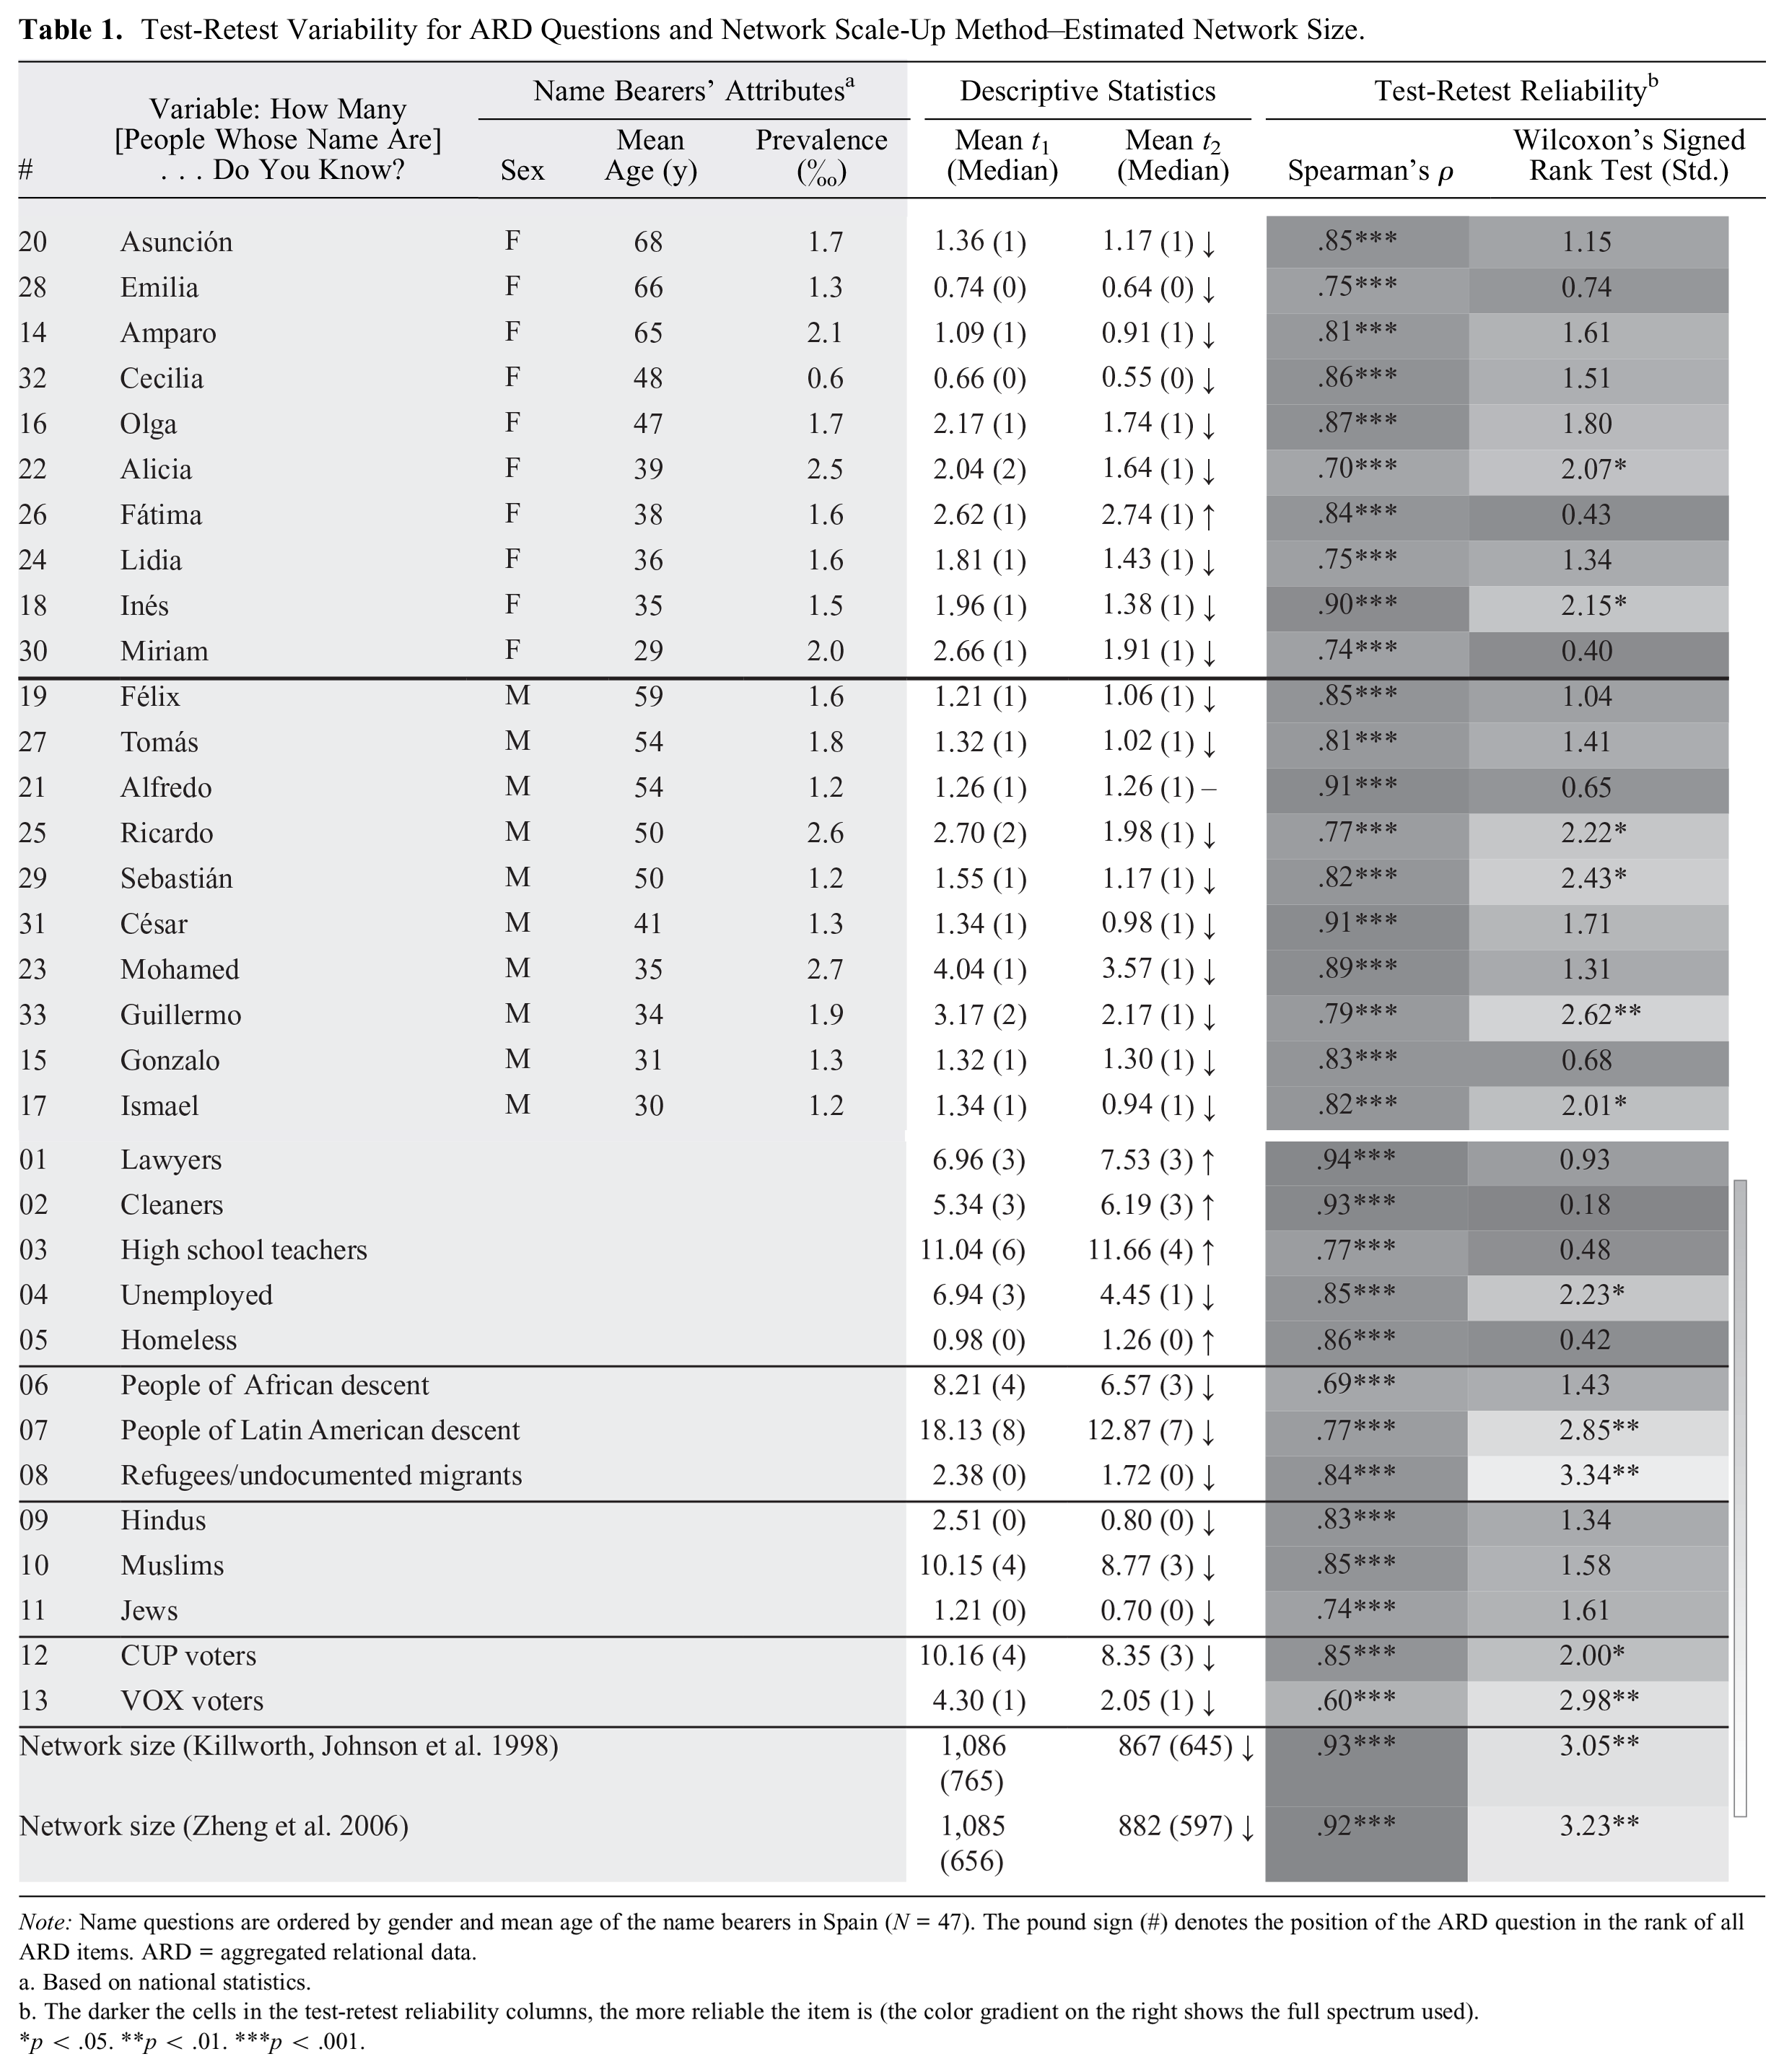
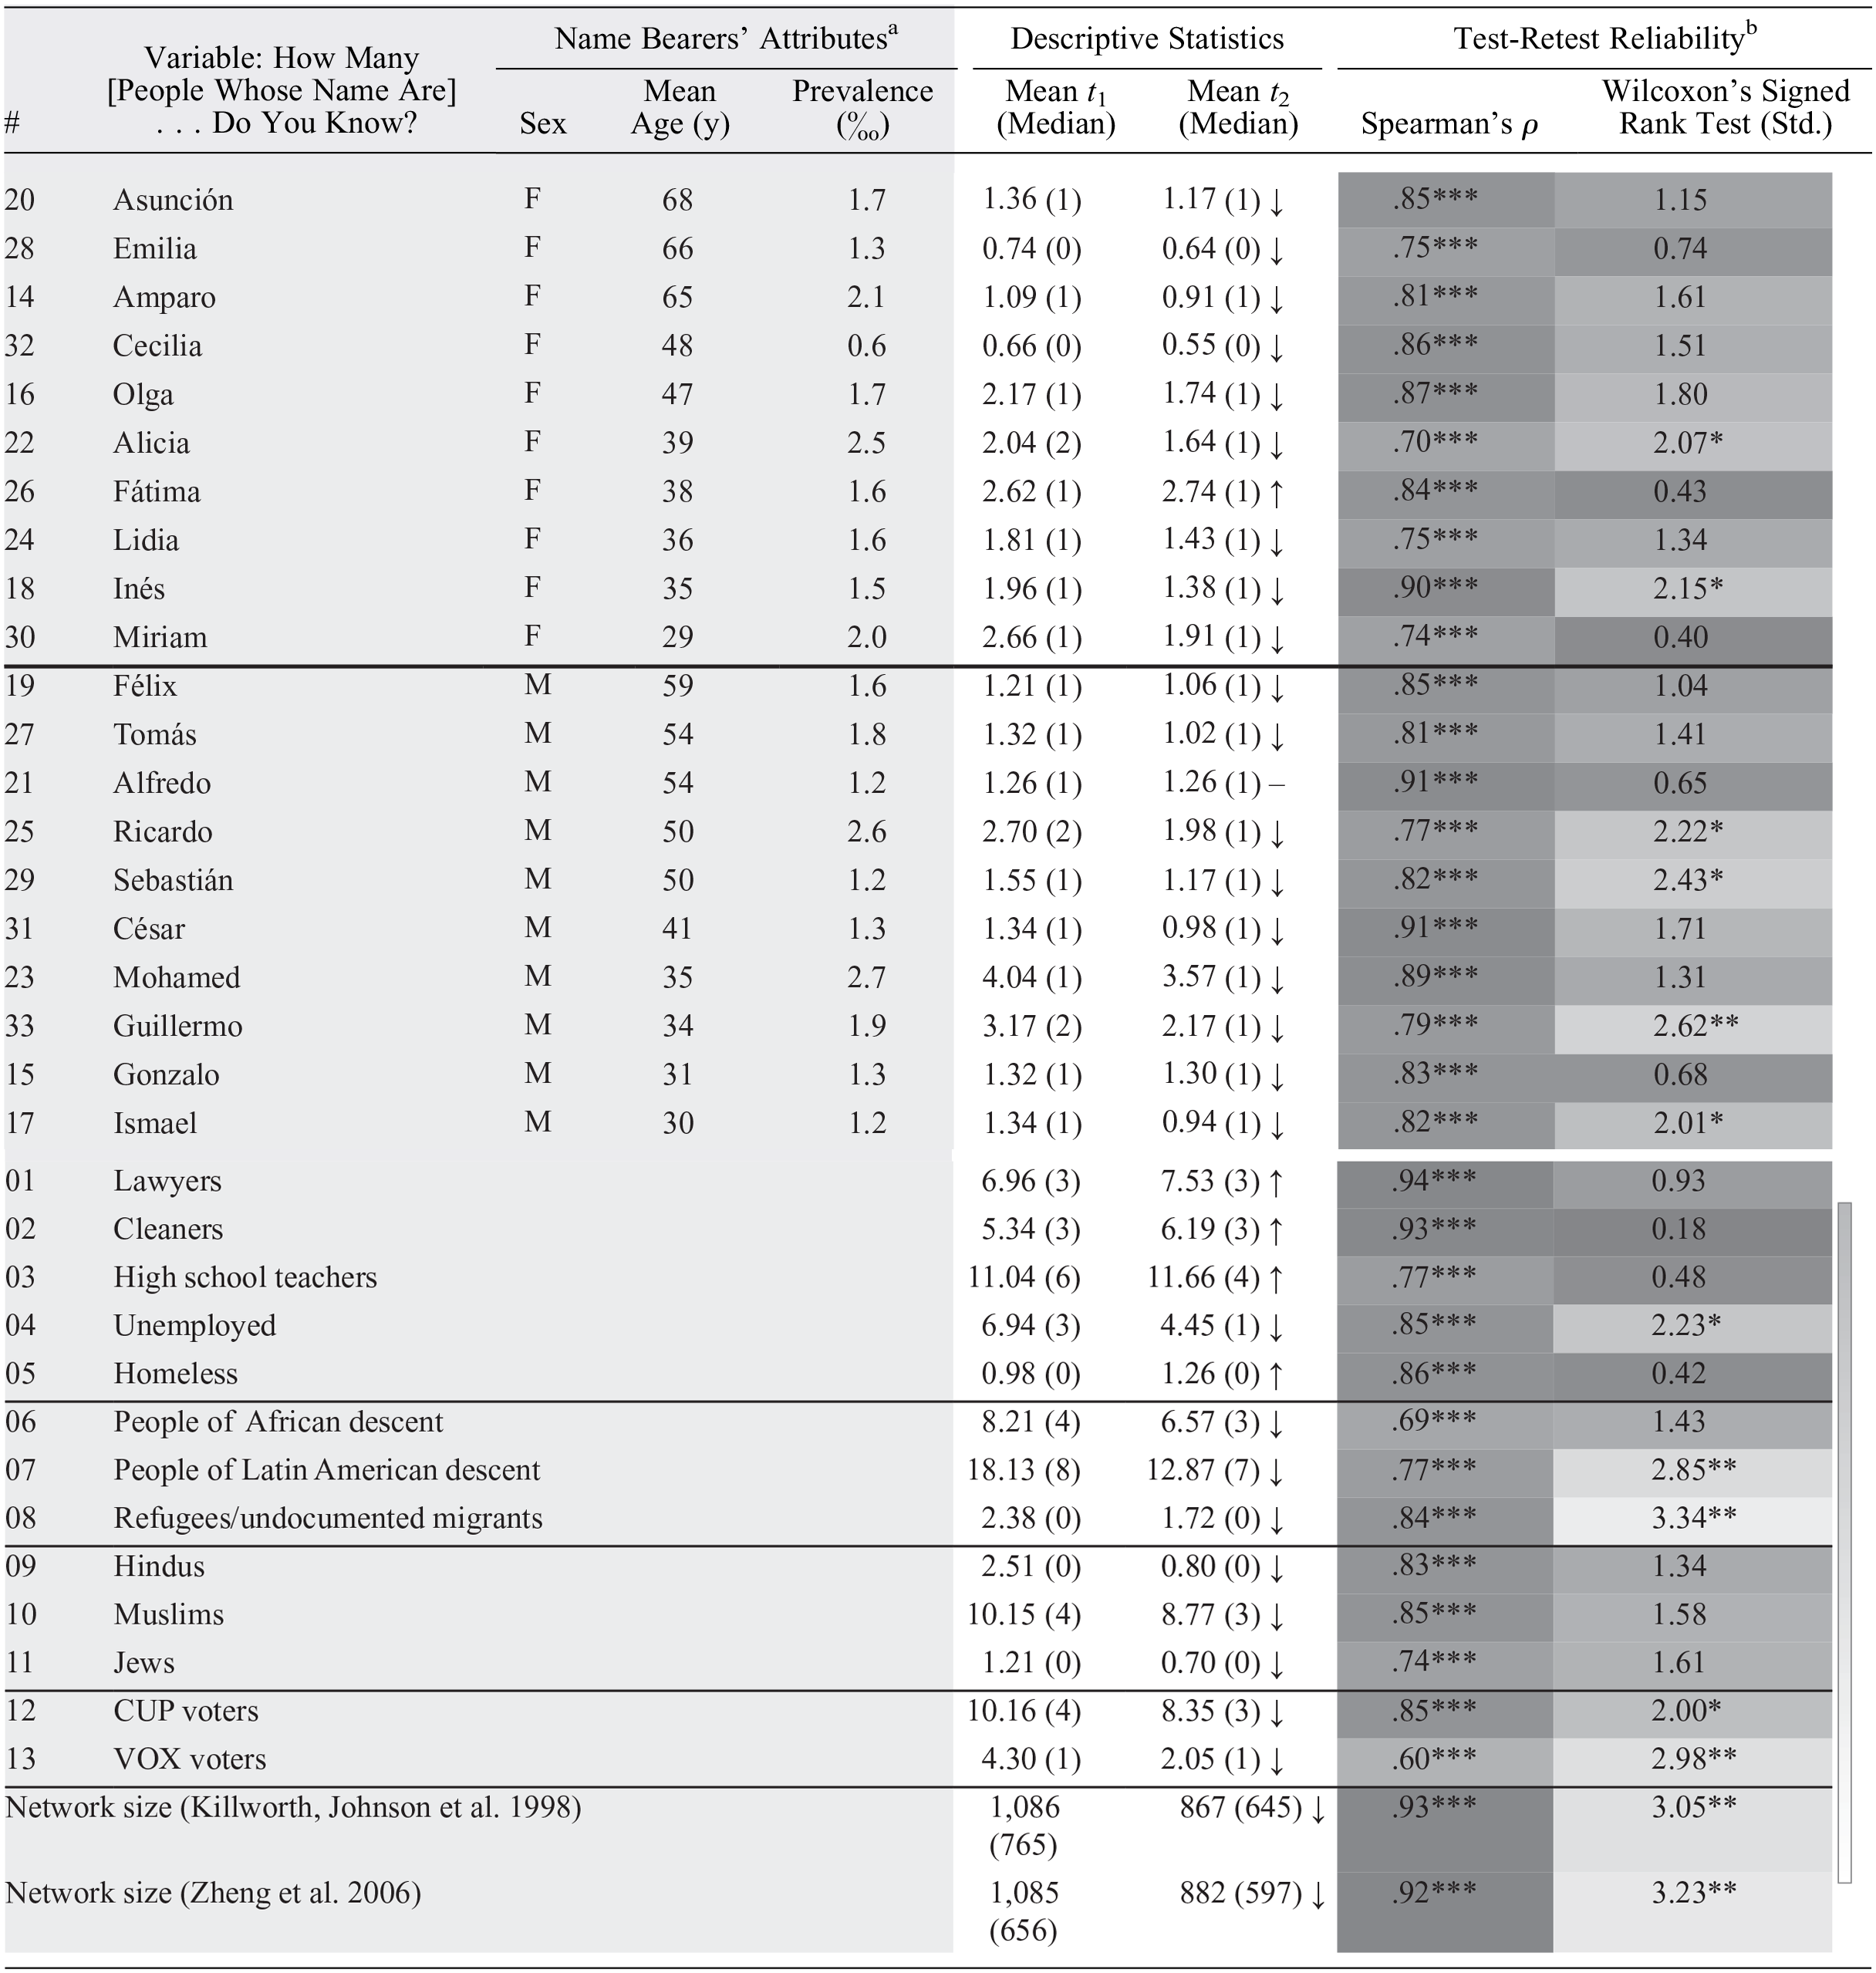
Note: Name questions are ordered by gender and mean age of the name bearers in Spain (N = 47). The pound sign (#) denotes the position of the ARD question in the rank of all ARD items. ARD = aggregated relational data.
Based on national statistics.
The darker the cells in the test-retest reliability columns, the more reliable the item is (the color gradient on the right shows the full spectrum used).
p < .05. **p < .01. ***p < .001.
NSUM Estimate of Acquaintanceship Network Size
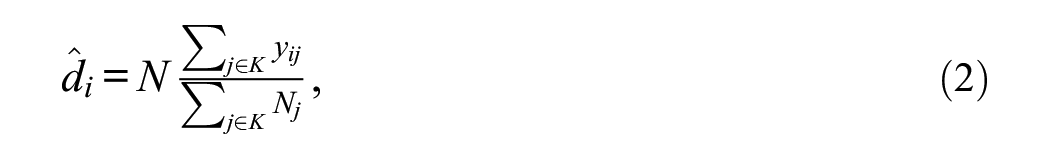
We estimated individuals’ degrees at
To estimate network size, we used Killworth, Johnsen, and colleagues’ (1998) Maximum Likelihood estimator, as implemented in the R package networkscaleup (Laga, Bao, and Niu 2024), and Zheng and colleagues’ (2006) barrier model, in the form
where
By assessing the reliability of estimated network size across these two methods, our conclusions about NSUM reliability will be more robust to the estimation technique. Furthermore, this process helps us assess whether the added complexity of Zheng and colleagues’ (2006) model, which adjusts for biases, improves the reliability of NSUM estimates.
Individual Predictors
Respondents’ gender, age (categorized in maximum 10-year bins), completed education level, and country of birth (Spain or abroad) were measured at
Item-Level Predictors
We used the following ARD-question attributes: type of subpopulation (first names, occupations/positions, world regions of birth, religions, voting), position in the item order (a ranked ratio-level variable), and for first names, gender and average age of the name bearers in the adult population of Spain as well as the name’s prevalence in Spain in per mille. Name characteristics (see Table 1) were derived from the previously mentioned name statistics.
Criterion Measures for Convergent Validity
At
As the NSUM and summation methods share method variance by asking similar questions, we additionally used a Facebook friend count. Although capturing slightly different interactions, this variable is often used as a proxy for network size (e.g., Arnaboldi et al. 2016; Brooks et al. 2011; Hofstra et al. 2021). Furthermore, Hampton et al. (2011) showed that 93 percent of Facebook ties are also known offline. We asked the 32 Facebook users in our sample to open their accounts and report their Facebook friends count (mean = 508, s.d. = 660, median = 289, valid n = 31). 4 Interviewers verified whether respondents checked their accounts to retrieve this information (n = 24, mean = 629, s.d. = 707, median = 409.5) or not (n = 7, mean = 94, s.d. = 48, median = 100). All respondents who did not check their accounts responded in multiples of 10 (40, 50, 100, 120, 150); only one respondent who checked did so. Respondents who did not check their accounts used social media less regularly (with a median of “every two weeks”) than those who checked their accounts (median tied between “daily” and “two to three times a week”).
Qualitative Debriefing
To better understand individuals’ response behaviors, we qualitatively debriefed respondents after the first interview (see Habecker 2017). Interview prompts included how easy or difficult respondents found the ARD questions, which questions were more challenging, whether the definition of “knowing someone” was clear, and if they used any additional criteria to include or exclude people, such as people they barely knew or had not seen for a long time. For high responses, interviewers could ask how respondents arrived at this number and who those people were. Conversely, interviewers could select a subpopulation for which respondents had reported knowing no one and ask them to review the social contexts on the response card (Supplemental Figure S1) for confirmation. Because the debriefing was qualitative, interviewers had flexibility in wording questions to enhance comprehension. Interviewers could also adjust the question order, skip redundant questions on the basis of prior responses, or add clarification questions. Responses were transcribed and coded inductively (i.e., without using preconceived categories, following an exploratory approach).
Statistical Analyses
We used nonparametric methods because ARD and NSUM estimates are highly skewed count data with, in this case, binned (and potentially influential) upper categories. First, we present descriptive statistics for the test-retest reliability of ARD and NSUM-estimated network size. We distinguish between reliability (the extent to which respondents’ rank order was reproduced) and agreement (the extent to which their values were reproduced; Berchtold 2016). We used Spearman correlations for reliability and the paired samples Wilcoxon’s signed rank test for agreement. We created Bland-Altman plots (Bland and Altman 1986) to explore individual variability in the estimated network size’s reliability. Bland-Altman plots depict the relationship between the average of the two measurements and their difference (for each individual), revealing the stability of difference values with increasing average counts.
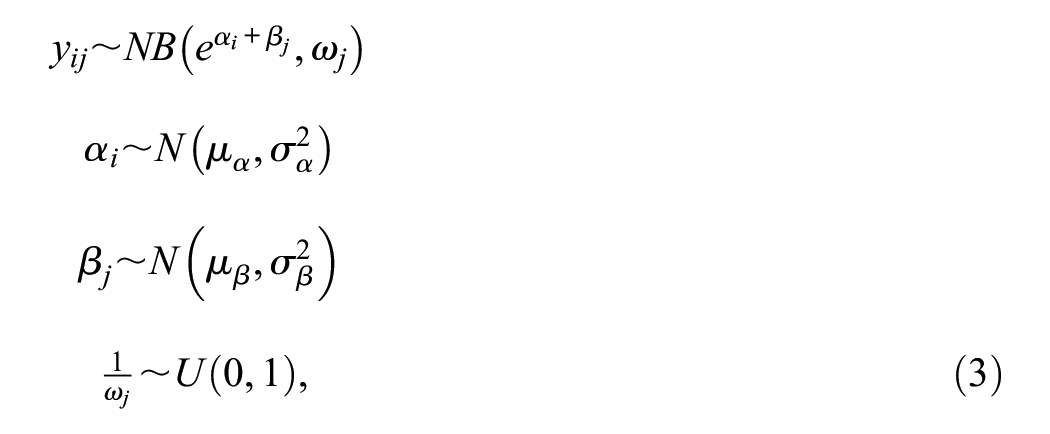
To understand how individual and item (or subpopulation) attributes predict the agreement of (1) ARD responses and (2) NSUM estimates of network size, we fit two-level negative binomial generalized linear models. For the agreement of ARD responses, we fit a longitudinal, cross-classified negative binomial random-intercept model where ARD responses at
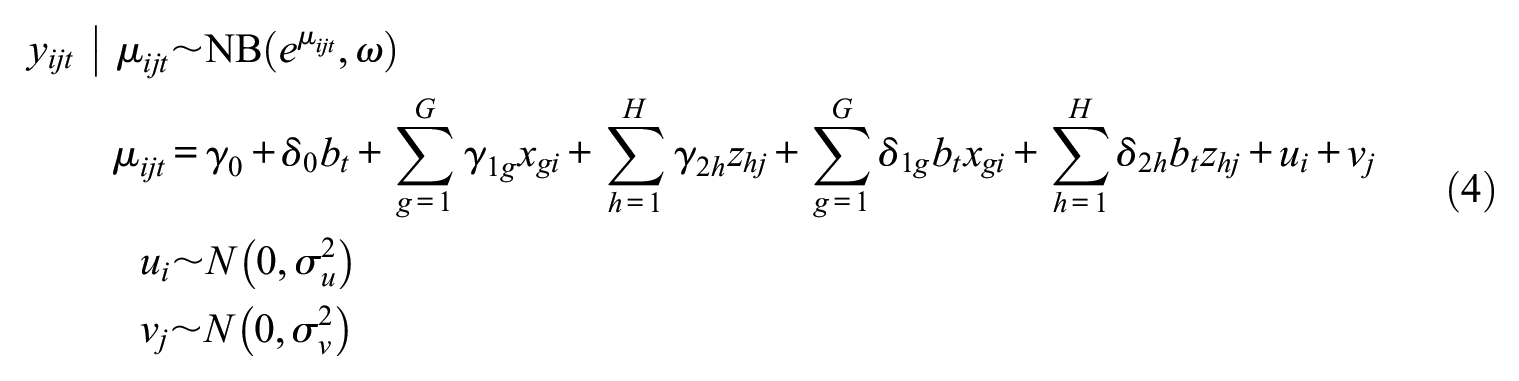
where the response
This model has random effects for individuals and items. The analysis uses 3,083 observations: responses from 47 respondents to 33 ARD items at two measurements each, excluding 19 missing responses (0.6 percent of the data). We used 6 individual-level variables (respondents’ gender, age, education, country of birth, and two dummies for relative change in social contact) and 5 item-level variables (question order and four dummies for item type) to predict test-retest agreement. To do so, we included the 11 interaction terms between these items and the binary variable test, capturing the test-retest difference. A separate model for only the name variables (n = 1,880) examined whether the name bearers’ gender, average age in the population, and population prevalence affect memorization, in addition to question-order and individual-level variables (i.e., 6 individual-level variables, 4 item-level variables, and 10 interactions).
The second analysis evaluates the agreement of the NSUM-estimated degrees using a longitudinal, two-level negative binomial regression with a random effect for respondents. Here, estimates of individuals’ degrees
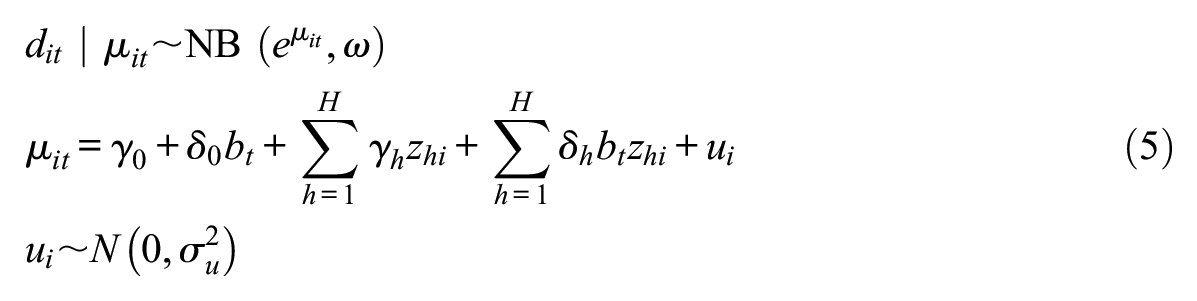
The fixed effects include the six individual attributes, the retest variable, and six interactions; models with fewer parameters can be found in Supplemental Table S4 in the online supplement. We fitted the models with the R package glmmTMB (Brooks et al. 2017).
Finally, we assessed the convergent validity of NSUM-estimated degrees, comparing them with degrees estimated with the summation method and Facebook friend counts using Spearman correlations. We also compared the scaling factor between Facebook friend counts and NSUM-estimated degrees with that of other studies.
Results
Comprehension and Response Behaviors
In the qualitative debriefing, respondents indicated they generally understood the questions and our definition of knowing someone by sight and name. For instance, respondent R06 said, “Yes, I think it’s good because by sight, there can be many more people but knowing your name will be a little more concrete, right?” and R21 said, “Yes . . . it seemed good to me because knowing someone’s name, you usually have a relationship that is not necessarily close, but of dialogue, of some kind, right?”
However, some respondents saw the criterion of knowing acquaintances’ names as a “barrier” (R13), having acquaintances whose names they did not know, such as the concierge they “talk to every day” (R13). Likewise, respondents may have forgotten some names. As R31 said, “Of many of the people I know, I forget the names. At a certain moment I don’t remember them, and I don’t know if I have to consider them acquaintances.”
Respondents occasionally included a person in a non-name ARD question whose name they did not know, such as R04: “That’s why [I included] the girl from China, I told you, I don’t know her name. She told me but I don’t remember, apart from that, I’m very bad [with names], I don’t remember people’s names.” Occasionally, respondents added other criteria. R31 excluded people with whom he had no “practical personal relationship,” and R06 only counted people she liked. Such personal criteria, deviating from instructions, may introduce interindividual variability.
Names were generally considered the easiest to respond to because they are “concrete” (R01). The inclusion criteria were clear, and their low prevalence facilitated recall: “if they tell you a name and no one comes to mind, you probably don’t know one” (R16). Regions of origin were also relatively easy for respondents to report, especially if “you can see that someone is, for example, South American” (R12). This comment suggests respondents may undercount people who do not fit their perception of a region’s “typical” inhabitants. Religions and jobs were considered the most difficult to report. However, one religious respondent found the ARD questions on religious affiliations the easiest, suggesting item salience varies across individuals. Even nonreligious respondents seemed better informed about their acquaintances’ religions than they initially thought, because “religious people normally manifest [their religion] in some way” (R28), such as by wearing veils (R30) or crucifix pendants (R28) or sending images of saints via WhatsApp (R06).
Some people doubted the inclusion criteria for jobs. For instance, at
When asked how they reached certain numbers, respondents reported counting the lower ones (“When they were few, I counted” R36), and estimating higher numbers, sometimes starting as low as four. R42, who reported knowing more than 50 lawyers, explained: It was an estimate, but since the figures [were] brackets, it was more like, “okay I don’t have to give exact [numbers], I have a margin.” But within those limits, I think I have chosen the right one. Yes, I know there are more than 50 for sure. . . . [They are] from my career, teachers—there are many people, parents of my friends, friends of my parents; many, many people in our social circle are lawyers.
In general, however, most respondents were quite confident about their answers, even when reviewing large and small numbers they had reported. Yet some respondents needed time for reflection. R44 initially said he only knew two people from South America but arrived at “approximately 10” upon reflection in the debriefing, thinking about specific countries. “I spaced out,” he said. In such cases, we kept respondents’ original answers to the ARD questions for subsequent analyses; we did not correct them after debriefing.
In the second interview, some respondents changed their response behaviors, such as trying to remember their earlier answers (unlikely, given the many questions) or changing their inclusion criteria after having misinterpreted them at
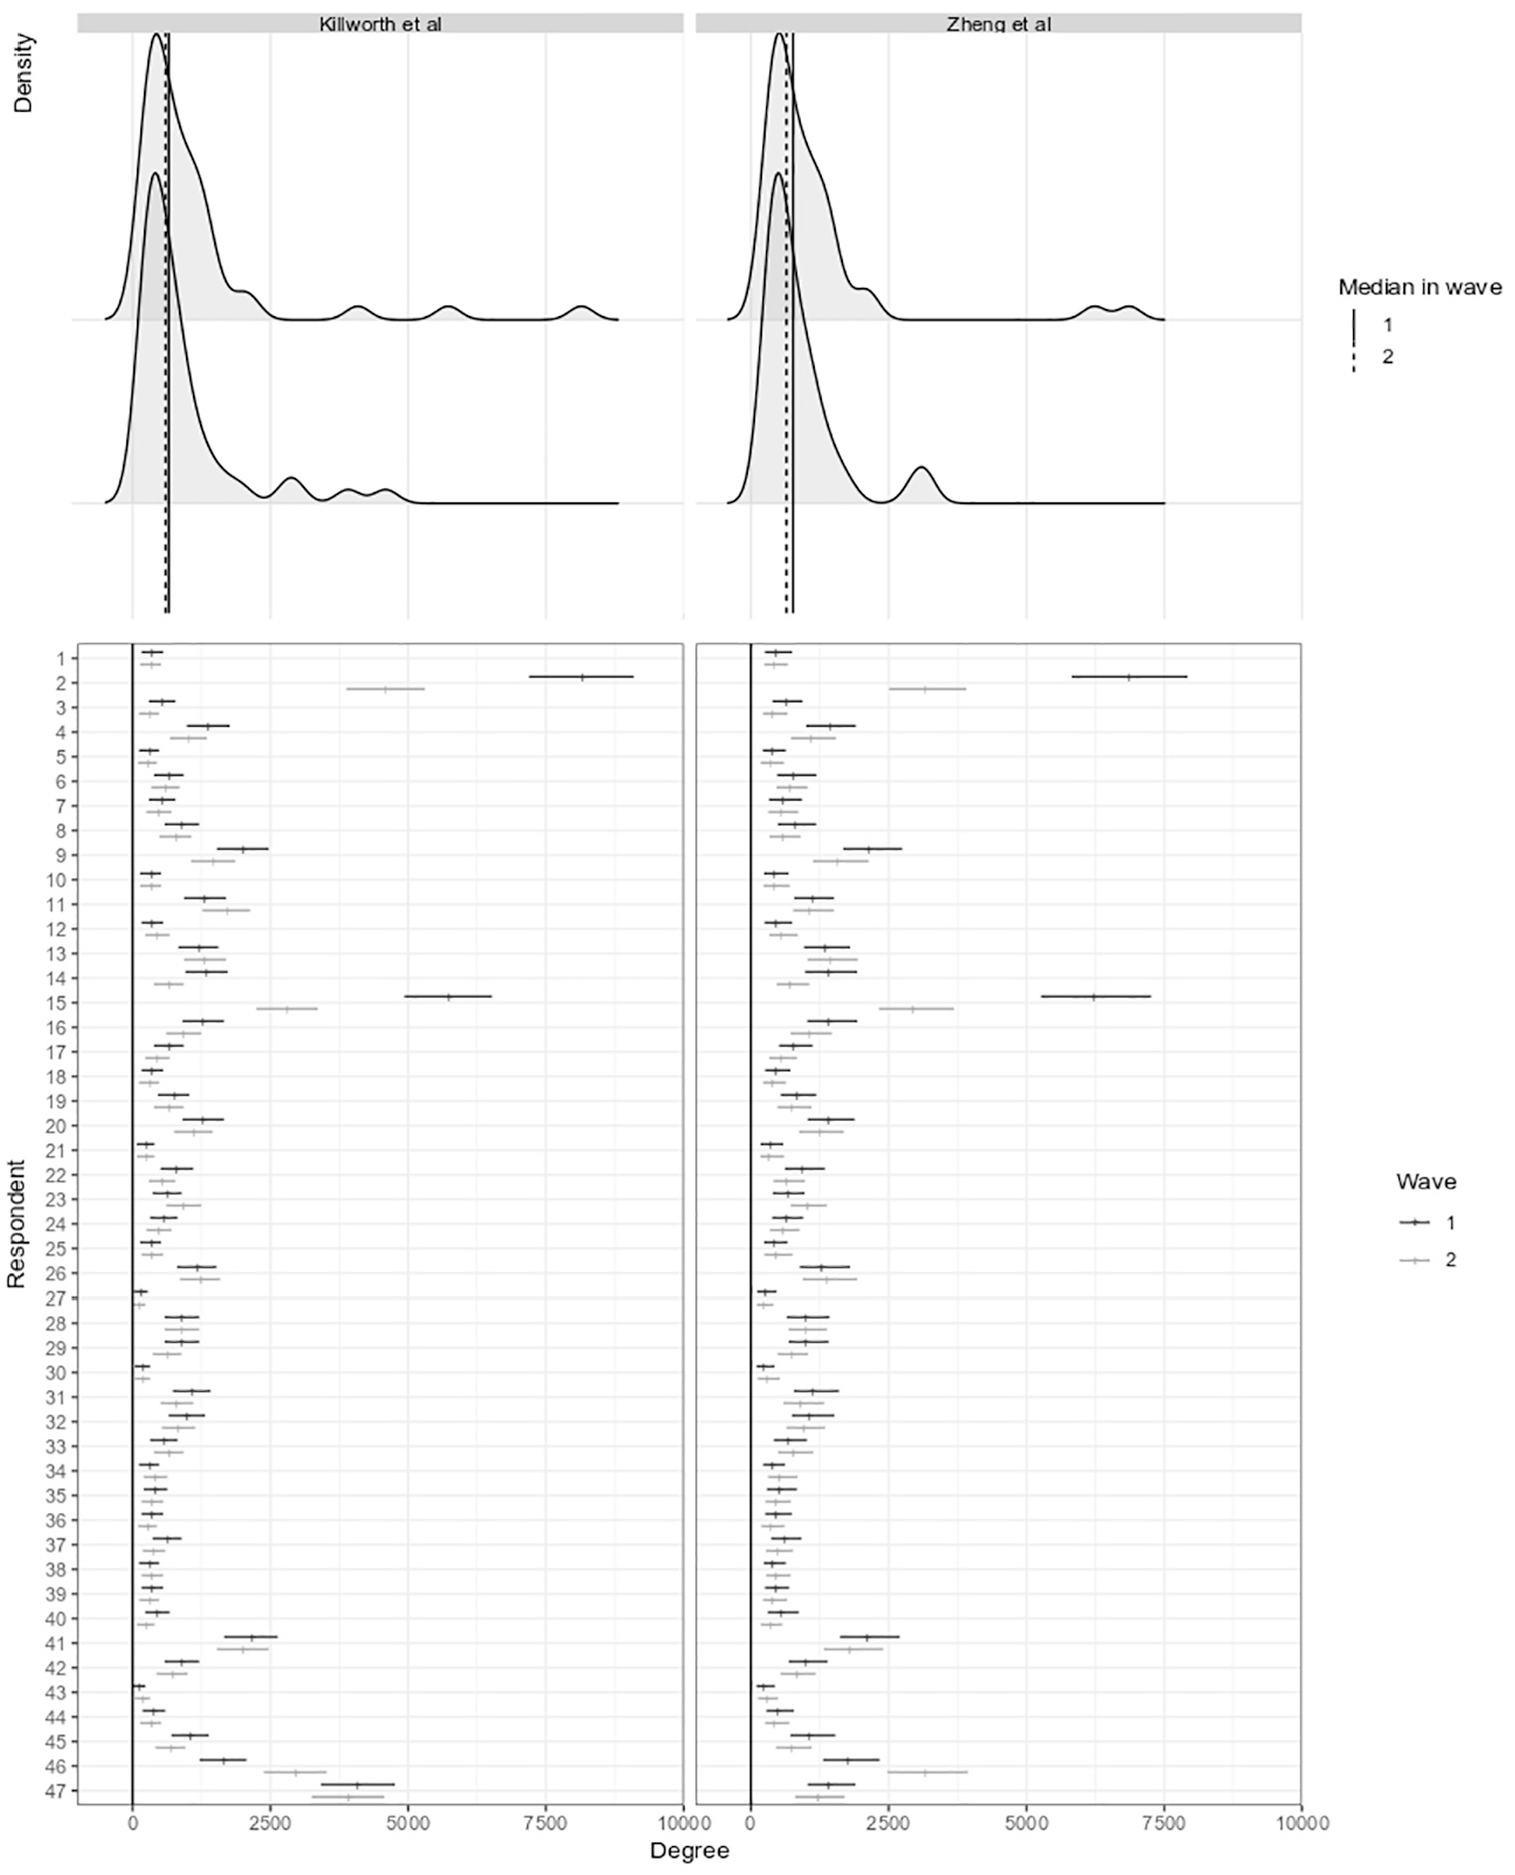
Distribution of estimated network sizes at both time points, using Killworth et al. s (L) and Zheng et al. s (R) model.
Seven respondents with low answers on ARD questions were routed to the names with double the prevalence (see “Measures: ARD”). Five gave higher answers on these items (on average, they reported 0.52 persons per question for the first 20 names, and 1.05 per question for the four names with double prevalence); the other two cases gave similar and lower answers. Only one respondent with a vast network received the four name questions with half the prevalence. This person mentioned, on average, 9.6 people on the first 20 names and 4.75 on the four names with halved prevalence. These patterns suggest high/low values mainly indicate larger/smaller networks, rather than a tendency to over- or underreport, providing evidence of the instrument’s reliability.
Test-Retest Reliability of ARD Items
Table 1 presents test-retest reliability statistics for all ARD items. Counter to our expectation that recall might increase
Despite lower responses at
Average and median responses on most other ARD subpopulations also decreased from
To understand whether respondent and item attributes affected test-retest agreement, we used two longitudinal, cross-classified negative binomial multilevel models (see Table 2). The first focused on the test-retest stability of items. Model 1 in Table 2, encompassing responses to all items, shows the origins and voting items received higher responses at
Longitudinal, Cross-Classified Negative Binomial Multilevel Models of Item Response.
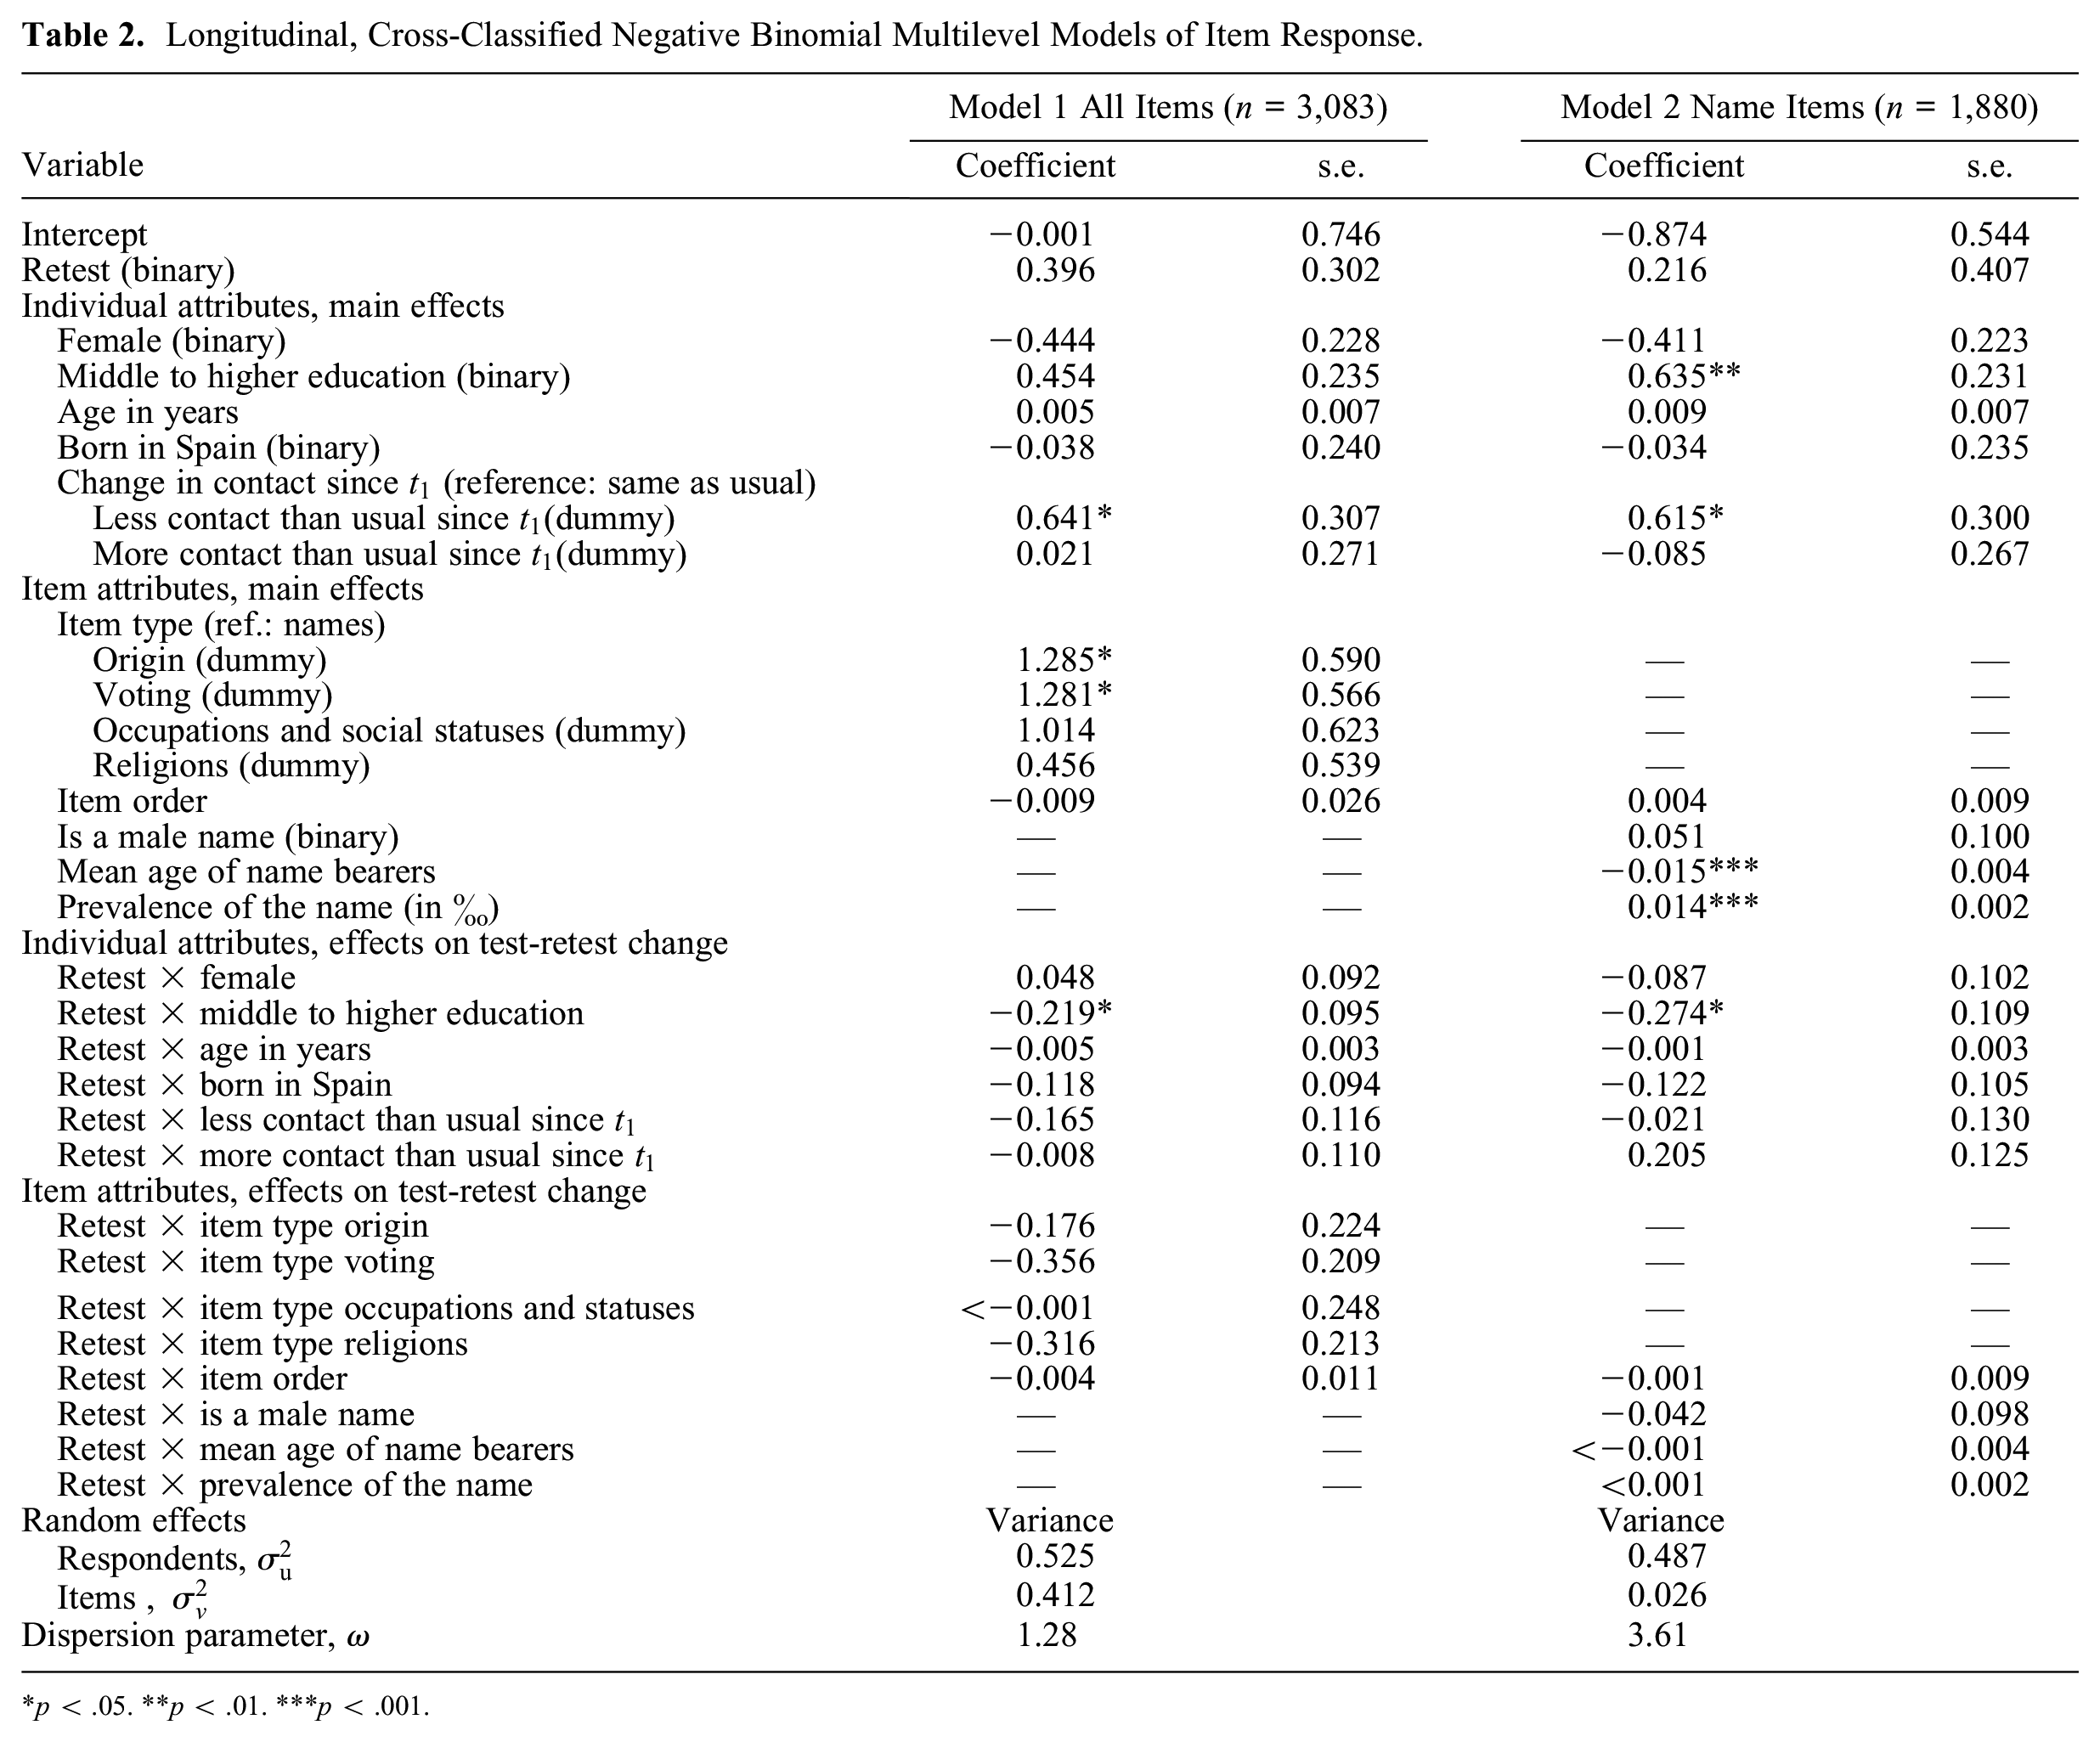
p < .05. **p < .01. ***p < .001.
Model 2 (Table 2), encompassing only responses to name items, examines how name attributes relate to test-retest agreement. The main effect of name prevalence (see also model 1, Supplemental Table S4) and its near-zero interaction effect with time reveal that respondents knew more people with more prevalent names in both interviews, confirming NSUM’s effectiveness. Furthermore, names more prevalent in older generations received lower responses, all else being equal, aligning with older people’s smaller networks. Interaction effects with measurement were generally nonsignificant, showing that test-retest stability was independent of the name bearers’ population prevalence, gender or age, or item position. The only significant interaction was with education.
Test-Retest Reliability of NSUM-Estimated Degrees
The name items formed the basis for estimating network sizes with Killworth, Johnsen, and colleagues’ (1998) and Zheng and colleagues’ (2006) NSUM models. As the bottom two rows of Table 1 indicate, respondents’ test-retest reliability was high for both methods (Killworth, Johnsen, et al.: Spearman’s
To better understand the test-retest reliability of NSUM-estimated network sizes, we plotted individuals’ size estimates from the two measurements (see Figure 1, bottom panel). Confidence intervals were wide, especially for higher estimates. Many respondents had higher estimates at
Bland-Altman plots (see Figure 2) confirm that changes in the initially smaller estimated network sizes generally fell within confidence interval limits. The outliers were concentrated at the scale’s higher end. All 11 respondents with Killworth estimates above 1,250 at
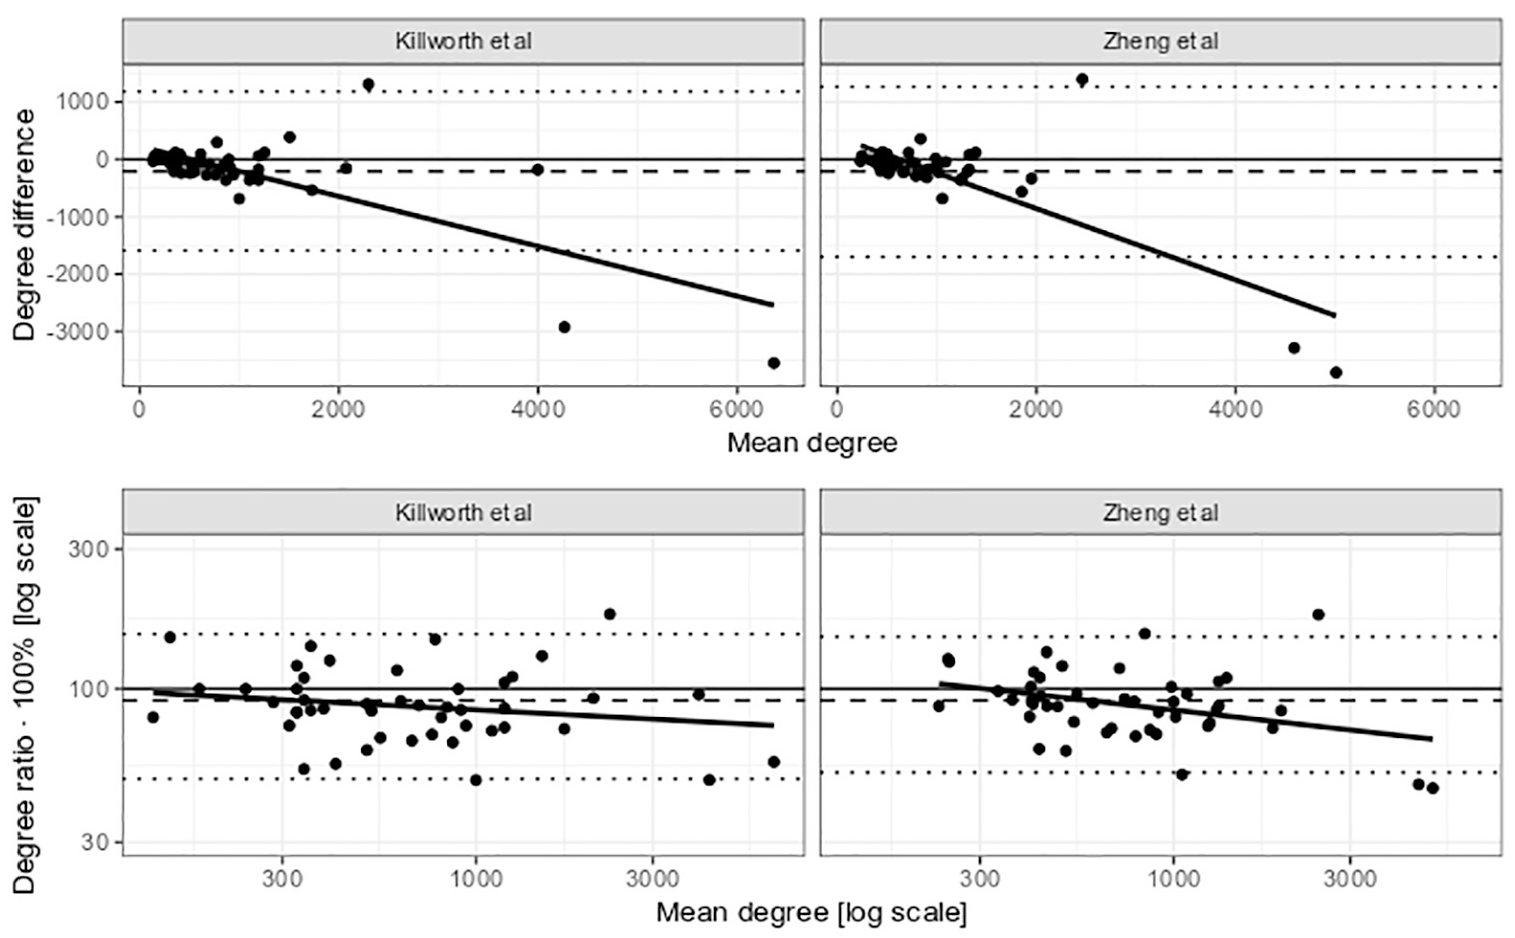
Bland-Altman plots for the degree estimate (upper panel) and logged degree estimate (lower panel) using Killworth et al.'s (R) and Zheng et al.'s (L) model.
To understand whether demographic variables explain individual variation in test-retest reliability, we ran longitudinal, two-level negative binomial regression models with respondents’ attributes as predictors (see Table 3). The significant positive main effect of education (see also model 1 in Supplemental Table S5 in the online supplement) and its negative interaction with retest show that higher educated respondents had larger networks than did lower educated respondents at
Longitudinal, Two-Level Negative Binomial Regression Model of the Estimated Degree (Using Killworth, Johnsen, and Colleagues’ Model;
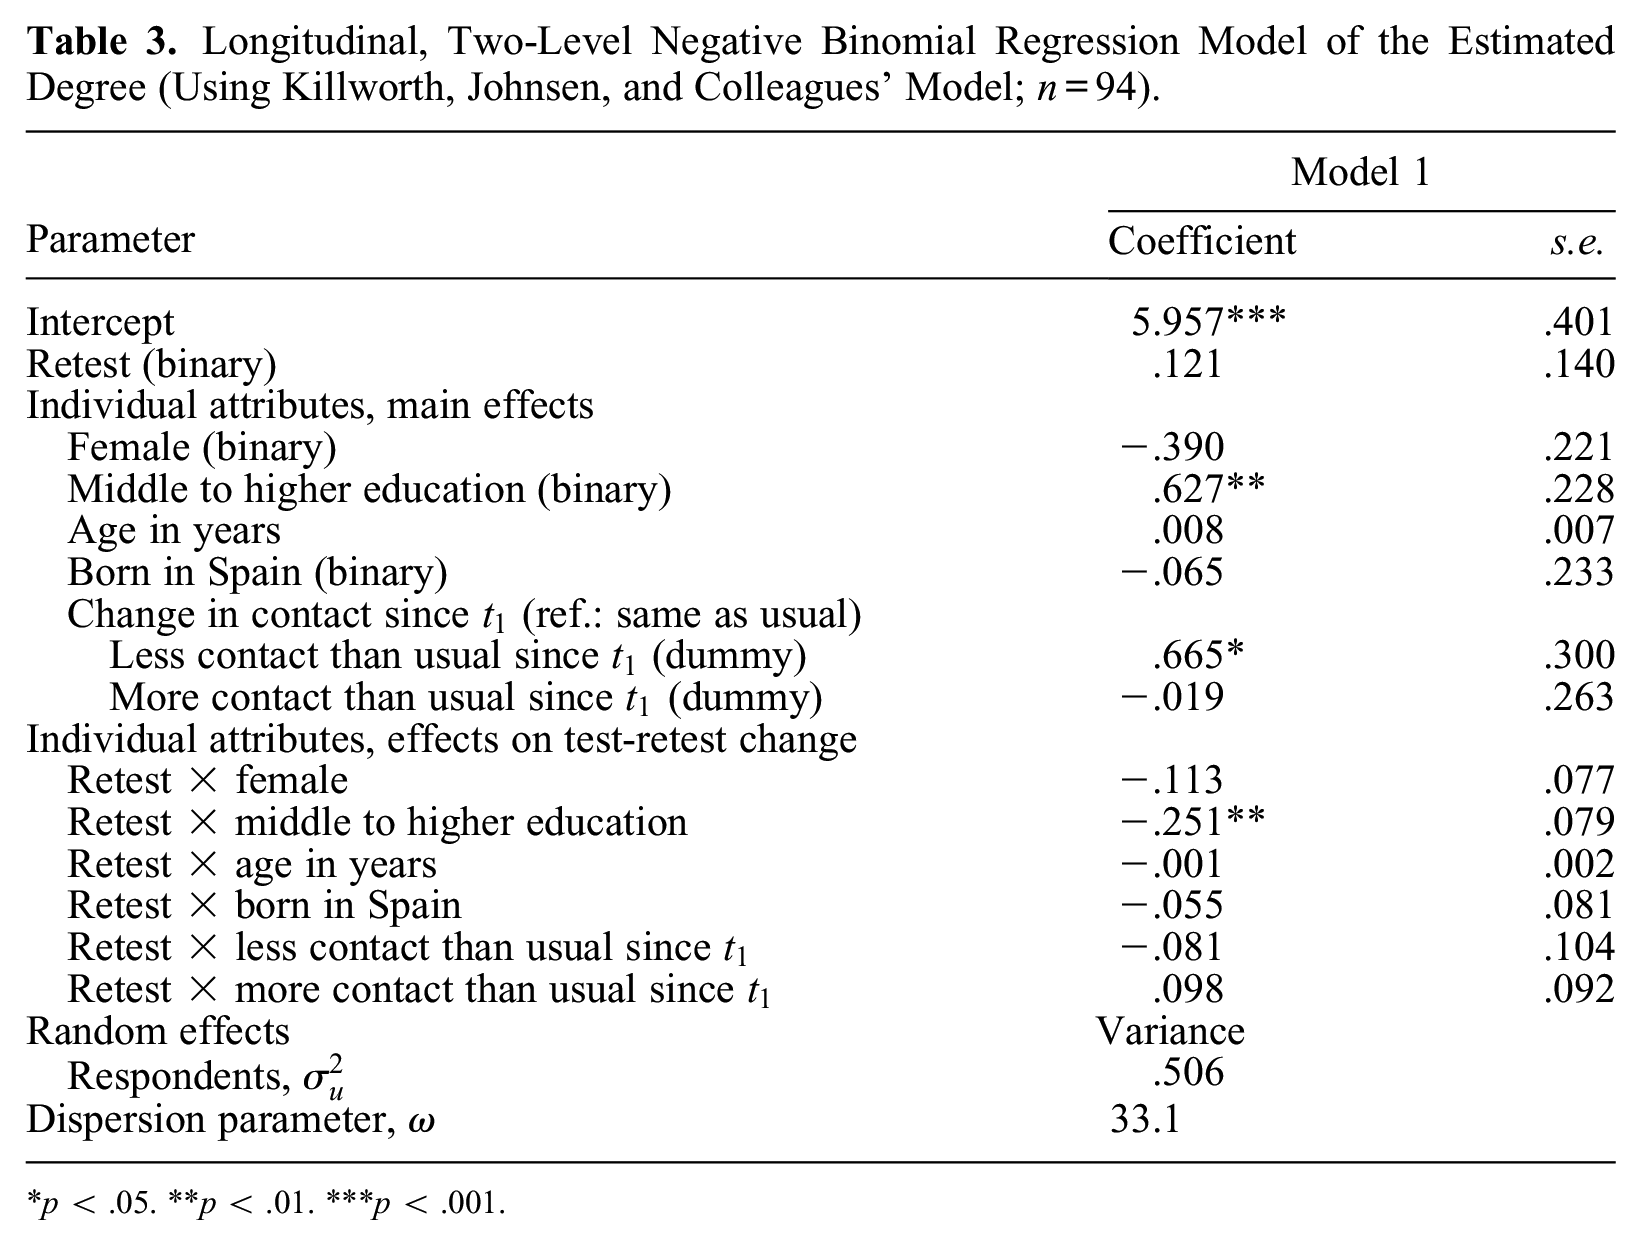
p < .05. **p < .01. ***p < .001.
Interviewer effects were evaluated separately (not shown here), but neither the main nor the interaction effects with retest were significant. This suggests interviewers did not influence the responses variably.
Convergent Validity
Finally, we examined the alignment between NSUM-estimated degrees at
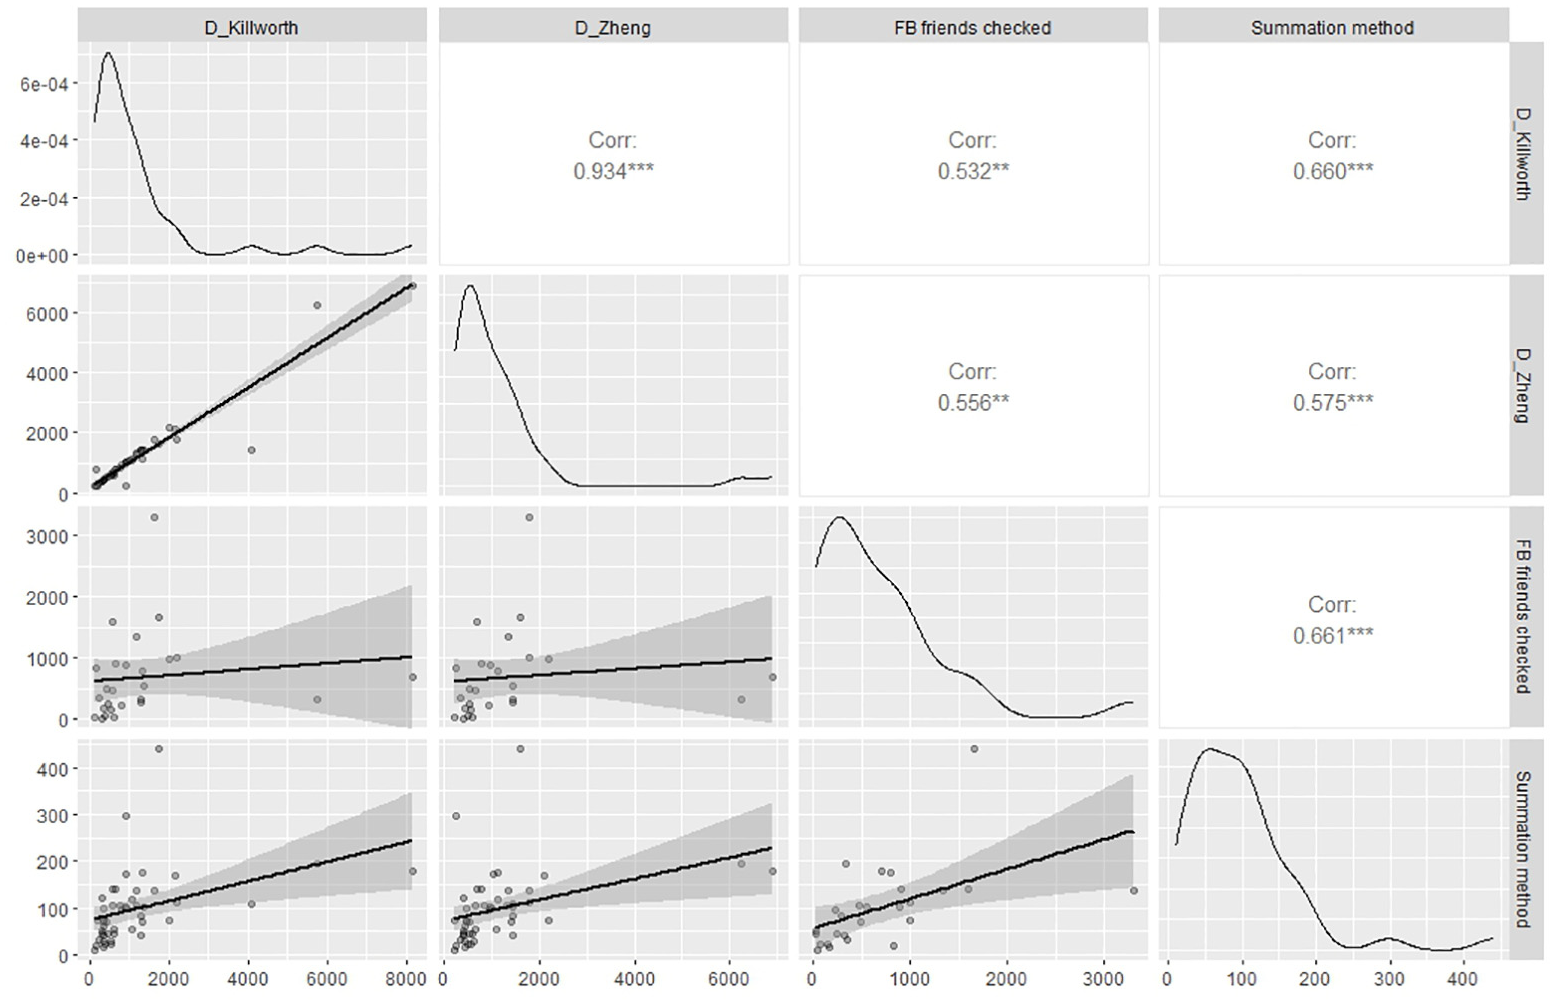
Correlation matrix of the logged network sizes estimated with Killworth et al.'s model, Zheng et al. s model, and the two convergent validity measures. *p < .05; *p < .01; ***p < .001.
At
Conclusions
ARD questions and NSUM estimates of network size have become increasingly popular, but their measurement properties have been insufficiently studied. In this mixed-methods study we examined these measurement properties in a quota sample of 50 individuals from diverse backgrounds in Spain. The results should be interpreted cautiously because of the small sample size and the possibility that pretest respondents exert more effort to provide accurate answers than do survey respondents (Habecker 2017:118). 5
We first analyzed response behaviors and found that respondents generally understood the ARD question instructions and the definition of “knowing someone.” However, some respondents questioned the inclusion criteria or added personal criteria, such as a minimum level of acquaintanceship or liking, despite instructions that neither strong relationships nor liking were necessary to count persons as acquaintances. The effect of these personally added or altered inclusion criteria on statistical inference depends on the prevalence of this behavior and whether it occurs randomly or nonrandomly. If specific subpopulations apply these criteria, it could introduce error in subgroup-specific degree variation. If these criteria are selectively applied to certain relationships (e.g., when the criterion of liking is added in a context of homophily), it could create new barrier effects and distort segregation estimates. Clear instructions help ensure uniform interpretation, even if some respondents still deviate.
To further foster uniform interpretation, we designed a response card listing a broad range of social contexts (e.g., family, work, neighborhood, associations) and reminding respondents of the definition of “knowing someone.” Such memory aids are uncommon in NSUM research despite ARD questions being cognitively demanding. Interviewers observed that respondents often glanced at the card, suggesting it helped them focus their recall. On the basis of these observations, we recommend using response cards or similar visual prompts in NSUM research. Although we have not tested the effect on test-retest reliability or debriefed respondents about their experience, we believe the visual prompt promotes a more uniform recall process by emphasizing contexts that structure social relationships. Future research could evaluate the effect of visual prompts on data quality and respondent experience.
Consistent with Habecker (2017), we found that people tended to provide exact counts when the true number was small, but switched to estimation as the numbers grew larger, with some estimating numbers as low as four. A reassuring finding was that responses to name items increased with the prevalence of the names in the population, not only on average, as other studies have shown, but also within respondents. Most respondents who gave low responses for names with 0.06 percent to 0.26 percent prevalence gave numbers twice as high for names with double that prevalence. Conversely, one respondent with exceptionally high answers showed the opposite pattern. These results suggest people with remarkably low and high degrees are not simply under- and overreporting, as they are likely unaware of each name’s national prevalence.
Second, we assessed the test-retest reliability of ARD items and whether item attributes affected their reliability. Contrary to our expectation that respondents would report similar or higher counts on the retest than on the test, respondents reported lower values on most items during the retest. All name questions showed high test-retest reliability (reproduction of the ranking of individuals across measurements), and most had high agreement (reproduction of their exact values). In the qualitative debriefings, respondents indicated that name questions were easier to answer than questions about other types of populations, because of more clearly defined inclusion criteria. In practice, however, they also responded consistently to questions about occupations and religions. Despite potentially larger recall bias, transmission errors, and barrier effects, ARD questions about these subpopulations were highly reliable. ARD questions on religions may have been simpler to answer than those on voting or regions of origin because of the low prevalence of the selected religions in Spain (Zurlo 2024; 0.06 percent for Hindus, 0.11 percent for Jews, and 2.76 percent for Muslims in 2020). Furthermore, respondents noted that small signals (veils, crucifix pendants) or comments via social media or in person often revealed people’s religions. The lower reliability of ARD questions on voting and regions of origin may be related to larger subpopulation sizes and less clear inclusion criteria. Question-order and interviewer effects were insignificant. Whether these findings are generalizable to other studies depends on the comparability of study designs, such as interviewer training, question formulation, and the placement of sensitive ARD questions within the questionnaire. In our case, the debriefing at the end of
Third, we examined the test-retest reliability of acquaintanceship network size estimates using NSUM on the basis of the name items, and assessed whether individual and item attributes predicted the stability of these estimates. We compared two estimation methods: the original method by Killworth, Johnsen, et al. (1998) and an improvement by Zheng et al. (2006), which produced strongly correlated estimates in our case, as we used relatively rare names for NSUM estimation that minimized biases. Researchers using more biased ARD items for NSUM may find larger differences in reliability between the two methods. Both estimates showed excellent test-retest reliability for NSUM-estimated degrees
Higher estimates of network size fluctuated considerably between measurements, even though they remained high. Thus, NSUM can reliably detect hubs but struggles to produce stable estimates of their network sizes. This instability is related to individuals’ difficulty in accurately recalling high numbers of contacts and the use of bins to ease those problems. Translating bins to their midpoints for estimation transforms one-category differences (e.g., from “11–20” to “21–50”) to seemingly much larger ones (from 15–35), potentially resulting in more volatile measurements. Whether NSUM estimation methods that do not simply take the midpoints of categories but treat them with distributional assumptions (see Feehan et al. 2016) improve test-retest reliability, especially for larger networks, remains to be seen.
Fourth, we evaluated the alignment of NSUM-estimated network size with alternative estimates of acquaintanceship network size. We found moderate correlations between NSUM measures and network size estimated with the summation method and Facebook friend counts
In summary, we demonstrate that ARD and NSUM estimates reliably reproduce the ranking of individuals across measurements, although the precise values of some ARD items and network size estimates may vary significantly between measurements. Consistent ranking is sufficient for research relating network size to its predictors or outcomes, which is the primary aim of most researchers using these estimates. However, whether consistent ranking suffices for estimating the size of hard-to-count subpopulations remains uncertain. Both the estimated acquaintanceship volume (equation 1’s denominator) and responses to the underlying ARD questions (equation 1’s numerator) decreased between measurements, suggesting that reestimates of a subpopulation’s size may remain within the initial estimate’s confidence interval. However, as Table 1 shows, items varied in their change over time, so the reliability of estimates of unknown subpopulation sizes depends on whether reported numbers of acquaintances in hard-to-count subpopulations change in tandem with those in the known subpopulations used for NSUM.
Furthermore, the lower stability of estimates of higher network size is concerning. Given the mulitfaceted of hubs in social networks, for example, in their role as superspreaders of diseases (Manzo and Van De Rijt 2020), brokers of innovative ideas (Clement, Shipilov, and Galunic 2018), and key nodes for network resilience (Callaway et al. 2000), future research should propose ways to estimate their network sizes more precisely. Rather than relying on high responses to ARD questions, a more robust approach could involve using very low-prevalence items in addition to standard items, as explored in this study.
This study provides numerous practical recommendations for ARD and NSUM research. Future research could be conducted in other cultural settings, for other types of ARD questions, and with variable time intervals to bolster the knowledge base regarding the measurement properties of ARD and NSUM. Such studies would further strengthen the design, use, and analysis of NSUM instruments.
Supplemental Material
sj-pdf-1-smx-10.1177_00811750251340398 – Supplemental material for The Measurement Properties of Aggregated Relational Data and NSUM-Estimated Network Size
Supplemental material, sj-pdf-1-smx-10.1177_00811750251340398 for The Measurement Properties of Aggregated Relational Data and NSUM-Estimated Network Size by Miranda J. Lubbers, Michał Bojanowski, Nuria Targarona Rifa and Alejandro Ciordia in Sociological Methodology
Footnotes
Acknowledgements
We thank the anonymous reviewers for their valuable input.
Funding
The authors disclosed receipt of the following financial support for the research, authorship, and/or publication of this article: This article is part of the project “A network science approach to social cohesion in European societies” (PATCHWORK; Miranda J. Lubbers, principal investigator). This project has received funding from the European Research Council (ERC) under the European Union’s Horizon 2020 research and innovation program (grant agreement 101020038; 10.17605/OSF.IO/BU2WK). Michał Bojanowski thanks ICM University of Warsaw for support through computational grant G74-3. Miranda J. Lubbers is grateful for funding from the Catalan Institution for Research and Advanced Studies (ICREA Acadèmia).
Supplemental Material
Supplemental material for this article is available online.
Notes
Author Biographies
References
Supplementary Material
Please find the following supplemental material available below.
For Open Access articles published under a Creative Commons License, all supplemental material carries the same license as the article it is associated with.
For non-Open Access articles published, all supplemental material carries a non-exclusive license, and permission requests for re-use of supplemental material or any part of supplemental material shall be sent directly to the copyright owner as specified in the copyright notice associated with the article.