
Abstract
This paper examines the frequency of midpoint responses in agree/disagree scales in a survey measuring attitudes toward science and scientific policy, a low-salience and difficult topic. It also examines the contribution of individual differences to explain the tendency to select this option. It is assumed that the use of the midpoint “Neither agree nor disagree” (NA/ND) in Agree/Disagree (A/D) scales is to some extent an indication of satisficing. It is also assumed that there are individual differences in respondents’ tendency to select the NA/ND response. Using a Generalized Linear Mixed Model we include Krosnick’s regulators of satisficing, socio-demographics and individual differences as predictors. We find that the contribution of the regulators of satisficing identified by Krosnick is small. In turn, factors associated with individual differences explain a great amount of variance on the number of NA/ND responses. We conclude that the presence of this option in a survey of a low-salience topic increases satisficing as strategy of the respondents to deal with the cognitive burden of both the A/D scale and the difficulty of the topic. Furthermore, the number of NA/ND responses may be understood as an indicator of individual differences in the propensity of respondents to satisficing when answering a survey on a low-salience or difficult topic.
Introduction
Responding to a survey requires respondents to invest a great deal of cognitive effort (Krosnick, 1991; Tourangeau et al., 2000) and thus the cognitive burden of survey questions has been identified as a source of response error (Lenzner et al., 2010).
The Agree-Disagree (A/D) response format is commonly used scale to measure attitudes and opinions. Because they provide a rapid and supposedly easy way of asking questions on surveys (Schuman and Presser, 1996), offering the opportunity to measure just about any construct relatively efficiently with the same response scale for the whole survey (Saris et al., 2010). However, the cognitive processes involved in answering A/D questions seem to be particularly burdensome and complex, as respondents first have to interpret the literal meaning of the question, discern the underlying dimension of interest to the researcher, and match their opinion with the scale. On the other hand, the interpretation of the scale is not straightforward and thus it is possible that respondents use it to indicate the position of their opinion between the two poles of the scale, but also as a measure of the intensity of their opinion (Saris et al., 2010). Therefore, it has been found that when asked for explanations about their answers, some respondents provide the same reason to justify opposite answers or use the same response option to express opposite opinions (Hipkins et al., 2002).
Respondents also tend to develop specific response patterns to A/D questions which varies from individual to individual, a strategy that generates correlations between items that are not related to the substantive variables asked about, leading to method effects that compromise the quality of the data obtained (Saris et al., 2010). They are also susceptible to acquiescence response bias, that is the tendency to agree with the statement offered regardless of its content (Krosnick, 1991).
Finally, the motivation to provide meaningful answers is likely to decrease with the cognitive burden generated by the need to respond to surveys on difficult or low-salient topics. To our knowledge, this consideration has received little attention in the literature.
Assuming that difficult topics may generate additional cognitive burden to the one that stems from A/D scales, this paper seeks to examine the tendency to select the midpoint option in agree/disagree scales in a survey about public attitudes toward science and science policy.
Midpoint responses and satisficing
Krosnick’s hypothesis is based on Herbert Simon’s notion of satisficing and presumes that the cognitive demands of answering survey questions may exceed a respondent’s motivation or ability to respond (Krosnick, 1991). If so, the respondent will look for clues in the question that suggest how to offer a seemingly defensible answer without spending real cognitive effort. The “neither agree nor disagree” (NA/ND) response option provides that clue (Nadler et al., 2015; Sturgis et al., 2014).
When asked in cognitive interviews for the reasons to choose the NA/ND option some respondents say that: “I do not have enough knowledge to say if I agree nor disagree” (Steen et al., 2019), or “I didn’t find the ‘don’t know option’” (McGee et al., 2019). Thus, respondents may select the middle option to express uncertainty without having to express ignorance (Sturgis and Smith, 2010) or to express lack of opinion instead of neutral opinion (Sturgis et al., 2014). The strategies for formulating opinion judgments are influenced by subjects’ motivation. Hence, the probability that respondents adopt a systematic strategy of cognitive processing increases if they are motivated. On the contrary, low motivation lead respondents to heuristic strategies, paying all their attention to the information that emerges easy and quickly in their mind (Schwarz and Vaughn, 2002). Therefore, the tendency to manifest an opinion that actually is not an opinion is higher among respondents with less interest (Krosnick et al., 2001) or less knowledge about the survey topic (Allum et al., 2008).
It has been found that some respondents tend to adopt a certain response style when answering surveys (Tourangeau et al., 2000). Midpoint response style (ERM) is the tendency to use the middle option of a rating scale regardless of content (Van Vaerenbergh and Thomas, 2013). This trend could explain the finding that when the midpoint is offered, it is the most frequent response (Toepoel et al., 2008). The decision to offer an odd number of alternatives is grounded on the assumption that the midpoint of the scale represents a neutral point of view about the issue. Following this rationale, the use of an even number of response alternatives is not recommended because it excludes the possibility of measuring neutral opinions which exist in the population (e.g. Matell and Jacoby, 1972; Sturgis et al., 2014). Nevertheless, it has been found that respondents tend to focus on the midpoint in scales with an odd number of alternatives when offered (Schuman and Presser, 1996; Toepoel et al., 2008). Therefore, it seems that the NA/ND option may act as a “shelter” when the cognitive burden is high and thus be a facilitator of satisficing.
Regulators of satisficing
If the selection of the NA/ND option is motivated by satisficing, it should depend on its determinants, that is, task difficulty, respondent ability, and respondent motivation (Krosnick, 1991). The difficulty of the task is associated with the complexity and familiarity of the language and concepts involved in a question, the scope of the recovery process involved in answering, the complexity of the information that will be integrated into a summary judgment, or the adjustment between the response alternatives offered and those judgments (Braverman and Slater, 1996). Considering that respondents tend to offer a neutral or DK answer as an easy way out when confronted with unfamiliar terms (Kamoen and Holleman, 2017) and that DK answers positively correlate with item difficulty (Shoemaker et al., 2002), the number of DK responses can be considered a proxy of task difficulty.
Respondent ability relates to cognitive sophistication, that is to say, the capability to perform complex mental operations, and also to the level of practice the individuals have in thinking about the topic of a particular question (Braverman and Slater, 1996). The degree to which an individual has a pre-consolidated attitude toward the issue in question also shapes responses (Krosnick, 1991; Schuman and Presser, 1996). Studies exploring the influence of respondents’ ability on their responses focus on cognitive sophistication indirectly measured as the level or amount of reported formal education, finding that response effects are stronger in respondents with lower education levels; the influence of the level of studies is also associated with age (e. g. Braverman and Slater, 1993; Krosnick, 1991).
Another indirect measure of cognitive sophistication has been a vocabulary test (Bobo and Licari, 1989) or more specific measures of cognitive skills (Braverman and Slater, 1996), finding that lower cognitive skills lead to greater tendency to satisficing.
Respondents’ motivation is probably influenced by the degree to which the topic of the survey is important to them, that is to say, the degree of interest participants have on it (Krosnick, 1991). Interest is associated with a pronounced readiness to acquire new domain-specific knowledge and thus interest in science can be revealed by using indirect measures such as choice of science courses (Krapp and Prenzel, 2011), that is also related to feeling informed about the topic. A great amount of what people learn in daily life is not because they have to, but because of the motivation to find out more (Falk et al., 2007). As a result, it has been found that respondents’ self-rated level of interest in science is positively correlated to being informed about it (r = 0.85) (Special Eurobarometer 401, 2013). Finally, although engagement in science, considered in a broad sense as the public participation in the governance of science, has been clearly promoted by scientific institutions, it has been found that a clear majority of the public have no desire to take on this participatory role (Sturgis, 2014). Hence, the willingness to engage in science governance can be considered an indicator of respondent motivation in relation to science.
Responding to a survey is an individual behavior related to making judgments and decisions. Each respondent brings his or her own experience, opinion, understanding, motivation, and involvement to the task of answering the survey. Individual differences is a broad term, covering any variable that differs between people, from decision style to cognitive ability to personality (Appelt et al., 2011).
The statistical analysis of the influence of individual differences in the respondents’ behavior has been very difficult to tackle until the development of the linear mixed effects and generalized linear mixed effects models (GLMMs). They extend traditional linear models to include a combination of fixed and random effects as predictor variables. Random effects typically allow the estimation of variance in the response variable within and among individuals. This reduces the probability of false positives (Type I error rates) and false negatives (Type II error rates). In addition, explicit modeling of the random effects structure aid correct inference about fixed effects and make it possible to quantify the strength of the influence of individual differences. Finally, these models allow modeling non-linear associations and heterogeneity and non-normal distributions of errors (Harrison et al., 2018).
It has been found that individual differences influences people’s tendency to engage in rational thought (Weller et al., 2018). We consider that, depending on the respondents, choosing the NA/ND response option may be a satisficing strategy when they are asked attitudinal questions with the A/D scale response format in low salient topics. Therefore, the midpoint would act as a “refuge” option for those who do not have a clear opinion on the issue but who wish to show they have one or who, not having such an opinion at all, do not want to seem to be shying away from responding to the survey (Cámara et al., 2018).
In summary, in line with Sturgis et al. (2014), we consider that selecting the NA/ND middle option may be motivated by satisficing. In accordance to Schuman and Presser (1996), we assume that individuals react differently to the presence of the NA/ND response option. Therefore, this study has two objectives. First, we aim to analyze the factors that contribute to explain the selection of the NA/ND response option. Second, we aim to analyze the influence of individual differences in the selection of the middle option NA/ND in A/D questions.
To achieve these objectives, we analyze the association among the number of NA/ND response options and the factors prompting satisficing that were proposed by Krosnick (1991) and Braverman and Slater, (1996) using GLMMs.
On the other hand, there is the possibility that the tendency to select the NA/ND option increases with the cognitive burden generated by the need to respond to surveys of difficult and low-salient topics. This consideration has received little scholarly attention. In one of the few studies on this issue, Sturgis et al. (2014) analyzed the NA/ND responses in low-salience topics assuming that high proportions of the public were likely to select the middle option as a result of their difficulties with the topic. Nevertheless, they included only three items: one about politics, and the other two about science, and only one of the items used the A/D scale. Science is a low-salience topic for many citizens (Sturgis et al., 2014) and therefore a survey measuring attitudes and opinions on this topic provides a good opportunity to analyze the respondents’ tendency to select the NA/ND option and the influence of individual differences.
Method
Data
We analyze the “Public Attitudes to Science (PAS, 2014)” survey, a study looking at attitudes toward science and science policy in a representative sample of UK adults aged 16 or over living in private residential accommodations. The multi-stage stratified sample was drawn covering England, Wales, Scotland and Northern Ireland. Fieldwork was undertaken by Ipsos MORI interviewers using face-to-face computer assisted interviewing. Interviewers were supplied with letters sent to all sampled main addresses 2 days before they intended to visit. This letter contained the contact details of the Ipsos MORI executive team, alongside information about the purpose of the survey and instructions on what to do next (Ipsos Mori, 2014).
Standard guidelines were issued to all interviewers about the timing and the number of calls they should make to an address in the sample. They stipulated a minimum of six calls (three of which must be made at either a weekend or evening) at each address over a 3-week period before recording a non-contact or refusal, and a maximum of nine calls. Fieldwork lasted for a total of 19 weeks, from 15 July 2013 to 24 November 2013. All respondents who completed the questionnaire were given a £10 high street voucher as an incentive immediately upon completion as a token of appreciation. The “don’t know” option was not mentioned by the interviewers, but these responses were allowed and registered (Ipsos Mori, 2014).
The PAS (2014) sample comprises of 1749 subjects from age 16 to 94 years, 46.9% are males (N = 821) and 53.1% are females (N = 928). PAS (2014) response rate was 47.5%. The main reason for unproductive outcomes was refusal (37.5% of the 51.9% interviews not achieved). Non-contacts accounted for 10.7% of interviews not achieved, and a further 3.5% corresponded to other unproductive outcomes, such as being away or ill during fieldwork. Refusal rate seemed to be closely related to the survey issue, as interviewers reported that people were reluctant to take part in a survey about science because they did not know anything about it and because they felt it would be too difficult for them (Ipsos Mori, 2014). Nevertheless, a response rate of 48% is usual in attitudinal surveys in the UK (e.g. the response rate of British Social Attitudes 2014 survey was 47%, being also the majority of nonresponse due to refusals (NatCen Social Research, 2015).
Variables
The PAS (2014) survey includes 65 items measured with a five points A/D scale and NA/ND as the middle option (questionnaire isavailable in Ipsos Mori, 2014; item wording for all covariates is included in the Supplemental Appendix). The response variable is the number of NA/ND options in these 65 items (Number of NAND).
The covariates are the proposed indicators to measure the factors facilitating the satisficing strategy. Task difficulty is related to the familiarity of respondents with the survey topic, while the number of DK has been identified as an indicator of task difficulty. Therefore, an independent variable is the number of DK responses in the remaining opinion questions, that is those that do not use the A/D scale (Number of DK). The PAS (2014) questionnaire includes a question with 11 applications of science and technology (S&T) of which respondents have to say how well informed they are about it. The response scale also includes the option “Have never heard of it.” The number of mentions of this option is also proposed as an indicator of task difficulty (Never Heard responses in Q7) (see the Supplemental Appendix).
Respondent’s ability is associated with cognitive sophistication, traditionally identified with education level. A second aspect is the level of practice the individuals have in thinking about the topic of a particular question. The PAS (2014) survey includes three quizzes on scientific regulation, scientific literacy, and cultural literacy. We created three indicators of respondent ability, summing the correct answers to each quiz: a quiz about science regulation (Regulation Science Quiz), a quiz about science literacy (Science Quiz), and a quiz about cultural literacy (Culture Quiz).
Regulation of Science Quiz includes five items and respondents have to say whether they think it is true or false. DK option is allowed although not offered as an option and we compute it as a 0. Thus, Regulation of Science Quiz includes the whole sample and its values can be comprised between 0 and 5.
Science Quiz is comprised by nine items to which respondents are instructed to say whether they think it is definitely true, probably true, probably false, or definitely false. Respondents are instructed to go on the next item if they are not sure. This possibility is recoded by the interviewer. We recoded the responses assigning a 0 to “not sure,” 1 if the respondent opted by “definitely true/false” and the response is incorrect, 2 if the respondent opted by “probably true/false” and the response is incorrect, 3 for “probable true/false” and correct, and 4 for “definitely true/false” and correct. Therefore, there are no missing values, and Science Quiz values can be in the range of 0–36.
Culture Quiz is defined from a question that includes the names of 12 people that respondents may have heard of. For each of them, they are instructed to tell if they associate them most with music, art, or science. Again, respondents are instructed to freely say they are not sure. This response option is recoded as a 0, the same than incorrect responses and, thus, the range of possible values is between 0 and 12.
The PAS survey does not include questions that directly identify the motivation of respondents, so we obtained three indirect measures. As it has been aforementioned, there is a high correlation between interest and being informed about science, so we use the responses to the question measuring the extent to which respondents feel informed about science to derive one of these indicators (Informed). To obtain the variable we assigned 0 to the option “Not at all informed,” 1 to the option “Not very well informed,” 2 to the option “Fairly well informed,” and 3 to the option “Very well informed.” So, the range of possible values is between 0 and 3 (there is more information in the Supplemental Appendix).
We included respondents’ attitude toward their involvement in decision-making about science issues as another indirect indicator of motivation (Engagement). To obtain the variable we assigned 1 to the option “I’m not interested in being involved in decision-making about science issues, as long as scientists are doing their jobs,” 2 to the option “I would like to know that the public are involved in decision-making about science issues, but I don’t want to be involved personally,” 3 to the option “I would like to have more of a say in science issues,” 4 to the option “I would like to become actively involved in decision-making about science issues,” and 5 to the option “I am already actively involved in decision-making about science issues.” So, it ranges between 0 and 5.
We considered that the question about how well informed about applications of S&T respondents feel to be may also be an indicator of motivation. Thus, we test this possibility besides its potential role as indicator of task difficulty. As an indicator of respondents’ motivation, it has been coded with a 0 for the option “Not at all informed,” a 1 for “Not very well informed,” 2 for “Fairly well informed,” and 3 for “Very well informed.” (Informed about S&T Applications). The responses to the 11 items have been summed, so the range of possible values is comprised between 0 and 33.
Finally, as sources of variation in the association between the number of NA/ND responses and satisficing indicators we include the ID variable (the numerical identification of each respondent in the dataset) to model individual differences, and five socio-demographic variables (Gender, Age, Education, Working Status, and Social Grade) (see the Supplemental Appendix). Regarding Education, the codified responses are: 1—GCSE/O Level/CSE, 2—Vocational qualifications (=NVQ1 + 2), 3—A Level or equivalent (=NVQ3), 4—Bachelor degree or equivalent (=NVQ4), 5—Masters/PhD or equivalent, 6—Other (vocational/work related qualifications, foreign qualifications—not stated, level unknown), and 7—No formal qualifications. Working Status categories are: 1—Working full-time (30+ hours), 2—Working part-time (9–29 hours), 3—Unemployed, 4—Not working/retired, 5—Not working—looking after house/children, 6—Not working invalid/disabled, and 7—Student. Social Grade has been derived taking into account the occupation of the Chief Income Earner and has the following categories: A—High managerial, administrative or professional; B—Intermediate managerial, administrative or professional; C1—Supervisory, clerical and junior managerial, administrative or professional; C2—Skilled manual workers; D—Semi and unskilled manual workers; and E—State pensioners, casual or lowest grade workers, unemployed with state benefits only. After the process of data cleaning to remove Not Available values, the final total N is 1.684.
Analysis
The association of the predictors of satisficing with the number of NA/ND responses is modeled as a Generalized Linear Mixed Model (GLMM) using the lme4 package (Bates et al., 2015) of R (R Core Team, 2019). In adjusting the model, a first step is to determine the random effects structure. We assumed that respondents’ reaction to the NA/ND middle option is heterogeneous and dependent on several factors. This assumption is tested in the random effects structure of the GLMM. To identify this structure, we tested the contribution of the socio-demographic variables and the ID variable (the number assigned to each respondent in the sample) as an indicator of individual differences. Model selection is grounded on Information-Theory approaches. These approaches allow the degree of support in the data for several competing models to be ranked using metrics such as the Akaike’s Information Criteria (AIC; Akaike, 1974). AIC maximizes the fit/complexity trade-off of a model by balancing the model fit with the number of estimated parameters. The best model will be the one with the lowest AIC using a threshold of differential of six points as the cutting point criteria (Harrison et al., 2018).
A second step involves adjusting the fixed effects structure. The number of NA/ND answers is a count (discrete) variable. This means that it cannot be assumed that the residuals of the response variable adjust to a normal distribution. Hence, to identify the fixed effects structure, the first step consists in including in the model the condition that the residuals of the number of NA/ND answers adjust to a Poisson distribution. Second, principal effects of the covariates are identified selecting the model with the lowest AIC.
Nevertheless, there are two covariates (Never Heard responses in Q7 and Informed about S&T Applications) obtained from the same questions and consequently only one of them can be included in the model. It is necessary to identify which, if any, better explains the response variable in the first place. Third, the potential inclusion of second-order interactions in the model will be tested if the complexity of the model makes it possible. Too complex models may generate failures to converge and thus, higher order interactions cannot be tested (Bates et al., 2018).
The third step involves model validation and goodness-of-fit assessment. First, in order to identify residual patterns, we obtained plots of Pearson’s residuals versus fitted values for the entire model, as well as model Pearson’s residuals versus all explanatory variables. Second, we obtained the QQ plot of the random effect means using sjPlot package (Lüdecke, 2020) and assessed predictor collinearity by the vif function of the car package (Fox and Weisberg, 2019). The r.squaredGLMM function of the MuMIn package (Barton, 2019) is used to obtain the Nakagawa and Schielzeth Pseudo-R2. The function returns two complementary values: the marginal Pseudo-R2 encompassing variance explained only by the fixed effects and the conditional Pseudo-R2, the variance explained by the whole model (Nakagawa and Schielzeth, 2013).
Three different methods are available for deriving the R2: the delta method, the lognormal approximation, and the trigamma function. The delta method can be used with for all distributions and link functions, while lognormal approximation and trigamma function are limited to distributions with logarithmic link (Barton, 2019); hence, we report the values obtained by the delta method.
In order to help interpret the model, we analyze the differences between the variables in the model and the other covariates. To develop these analyses, we use the rapportools package (Blagotic and Daróczi, 2014) for the identification of outliers, WRS2 (Mair and Wilcox, 2020) for robust analysis of mean differences, and vcd (Meyer et al., 2020) and descr (Aquino, 2020) to analyze the association between categorical variables. The complete process of model development, validation, and interpretation is included in the Supplemental Annex.
Results
The descriptive statistics of the response variable and the numerical covariates are shown in Table 1. The mean number of NA/ND answers is approximately 10 in a range between 0 and 56. Mean and median are similar, indicating a rather symmetrical distribution. Nevertheless, 75% of respondents have values that represent only 23% of the range of the variable, while the answers of the remaining 25% of respondents cumulate the other 77% of values. This finding shows how a relatively small number of respondents provided a NA/ND response to a high amount of NA/ND questions. This is even more evident in Number of DK and Never Heard responses in Q7.
Descriptive statistics. Number of NA/ND responses and numerical covariates.
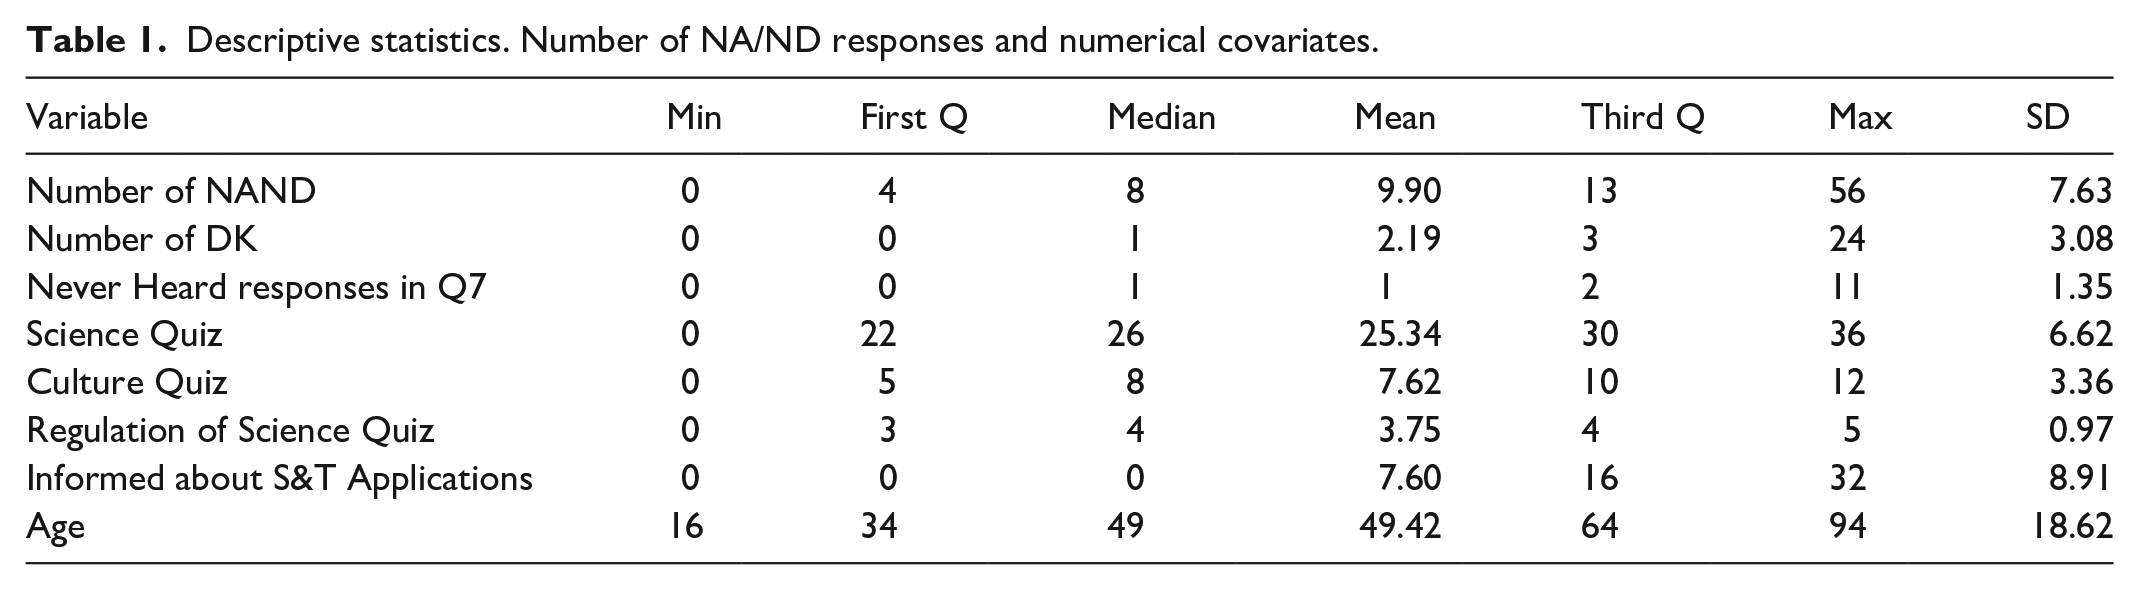
Regarding Informed about S&T Applications, half of the sample said they were not informed at all about the S&T applications they were asked about, while the other half said they were at least somewhat informed. The distribution of Science Quiz, Culture Quiz and Regulation of Science Quiz variables is clearly more even. In any case, respondents have obtained better results in the science quiz (mean is 25.34 in a range from 0 to 36) than in the other two quizzes, although they are especially unfamiliar with science regulation. The mean age is 49 years (it ranges from 16 to 94).
Table 2 includes the distribution of frequencies of the categorical covariates. Almost 60% of respondents demonstrate to be not at all or not very well informed about S&T, and only 28% of them seem to be interested in being engaged in S&T decisions. Mostly, respondents are working full time (37%) or retired (27%), another 13% is working part time, 5% is unemployed, 6.5% do not work because they are looking after the house or their children, another 5% do not work because they are invalid or disabled, and 6% are students.
Distribution of frequencies of the categorical covariates.
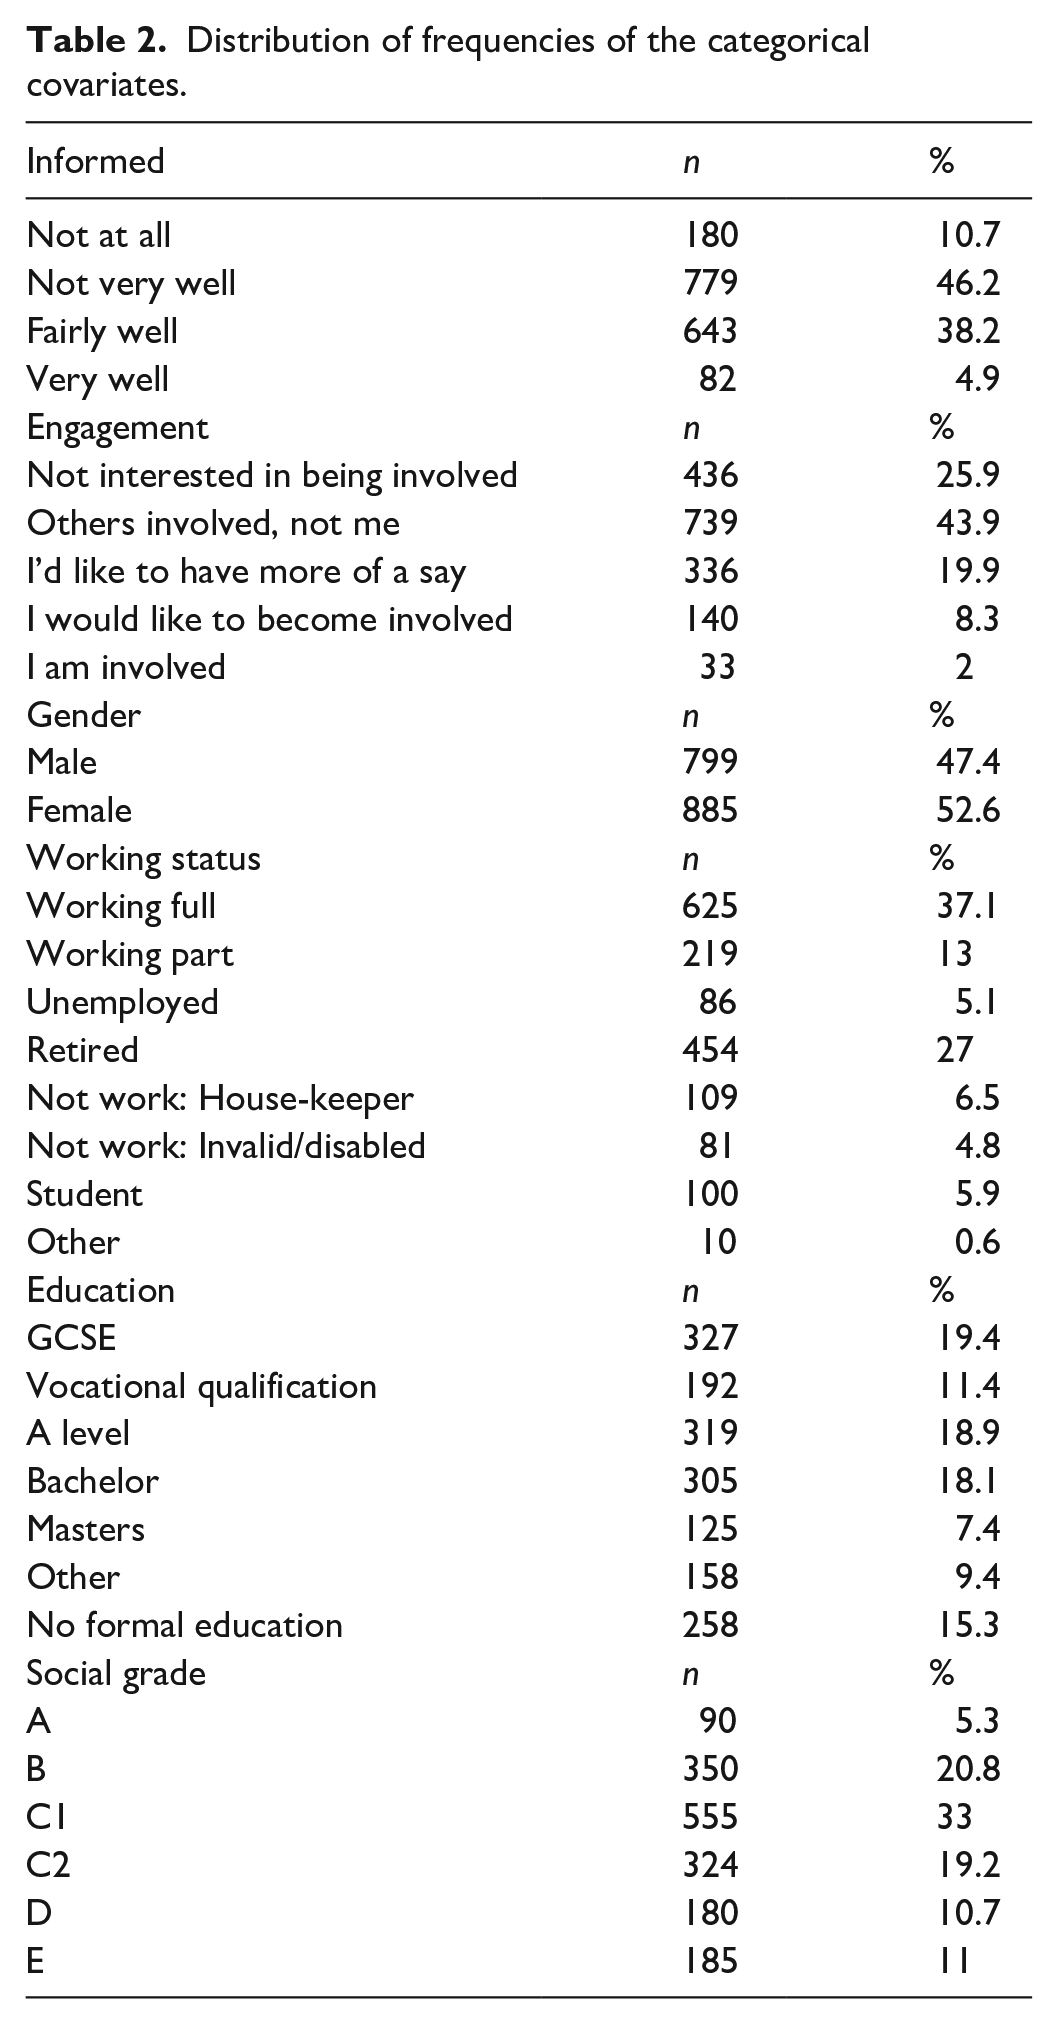
There is a 15% of the sample that has no formal education; the highest educational level of 19% match GCSE, another 19% correspond to an A level, 18% to Bachelor, and 7% to Masters. Finally, 33% of respondents are included in the C1 social grade category (supervisory, clerical and junior managerial, administrative or professional); 21% in the B group (intermediate managerial, administrative or professional); 11% in the lower levels, D (semi and unskilled manual workers) and E (state pensioners, casual or lowest grade workers); and 5% in the highest, A (high managerial, administrative or professional).
All the numerical covariates are significantly associated with the response variable (see Supplemental Annex). The strongest association is between the number of NA/ND and age (r = −0.22), followed by the association with Culture Quiz (r = −0.18). The correlations with Science Quiz and Regulation of Science Quiz are also negative (r = −0.13 for both variables). On the other hand, the correlation between the Number of NA/ND and Never Heard responses in Q7 is positive (r = 0.14). Finally, although statistically significant, the association of the number of NA/ND responses with the number of DK responses in Q7 and being informed about S&T applications is weak (r = 0.08 and r = −0.07, respectively). Therefore, it is probable that they do not significantly contribute to explain the number of NA/ND answers.
Table 3 displays the minimum, the maximum, the mean, and the standard deviation of the number of NA/ND answers as a function of the levels of the categorical covariates. In nearly all the groups, there are respondents that have not selected the NA/ND option in any of the 65 items with an A/D format. On the contrary, there are great variations in the maximum, as its value ranges between 29 and 56. Therefore, there are noticeable differences in the mean and in the standard deviation. The figures are lower for the following respondents: those that are more informed about S&T, showing more interest in being engaged in S&T decisions, have achieved higher levels of formal education, have been assigned to A and B social grade levels, are retired and unemployed, and males.
Descriptive statistics of the number of NA/ND answers in the groups of the categorical covariates.
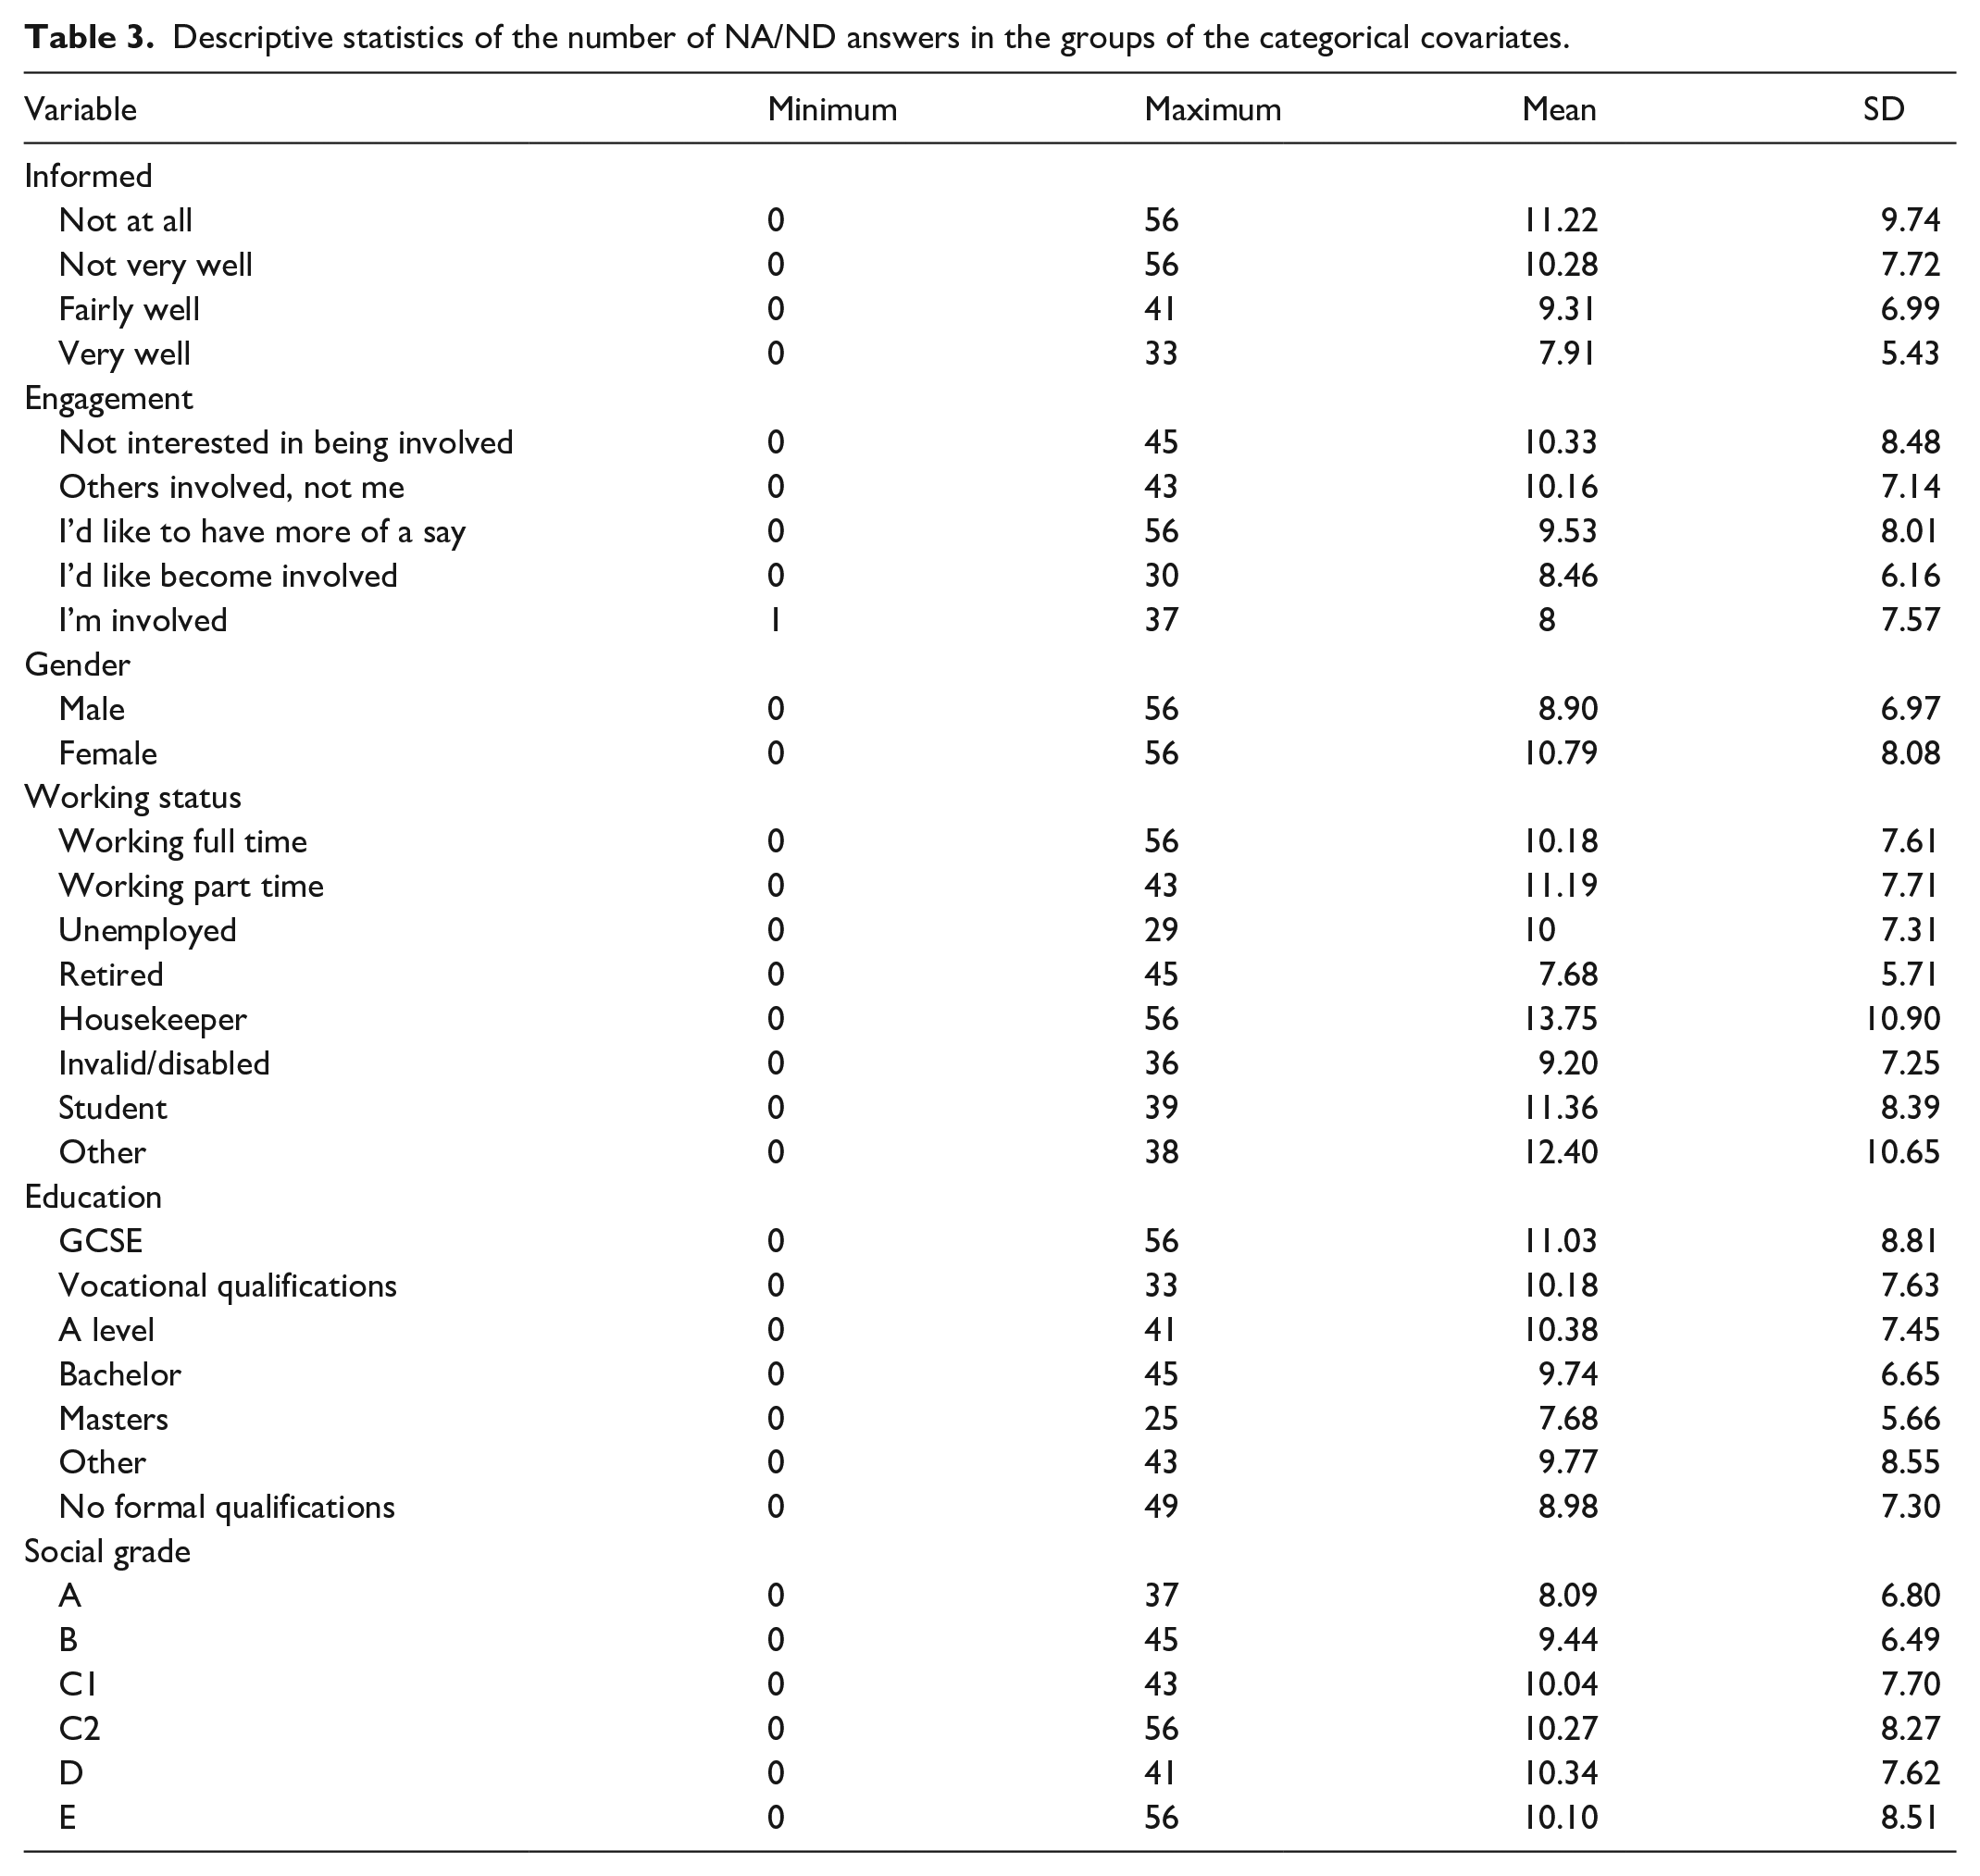
As it has already been pointed out, the correlation between the number of NA/ND responses and age is negative. This means that the number of these responses decreases when the age of respondents increases and, hence, older respondents are less prone to select the middle option in the items with the A/D response scale. On the other hand, the lowest mean among the groups of respondents defined from the categorical covariates corresponds to the respondents that are retired.
Regarding the GLMM, we are interested in analyzing the contribution of individual differences and therefore, we included the ID variable in the random effects structure. On the other hand, considering that it has been identified in the literature the influence of socio-demographic variables in surveys response, we tested the contribution to the fixed effects structure both of these variables and of the proposed indicators of satisficing.
When the ID variable is included in the random effects structure, working status and social grade are not relevant predictors of the number of NA/ND answers. The same occurs with Never Heard responses in Q7 and Culture Quiz. This can be interpreted as evidence that their effects are accounted for by individual differences. Therefore, we tested an additional model (see Supplemental Annex) and found that, with the exception of social grade, all the other covariates significantly contribute to explain the response variable when random effects structure is defined by age instead of ID. In that model the explicative power of the fixed effects structure increases (marginal Pseudo-R2 is 0.27), but its global explicative power is lower (conditional Pseudo-R2 is 0.44). Thus, we can establish that the random effects structure is best identified by the ID variable as a source of intercept variation. ID has 1.684 values (the sample size). The inclusion of this variable as the best indicator of fixed effects makes the model very complex and, hence, it is not possible to estimate random slopes. The variance of the intercept is 0.41, an indication that there are evident differences among the respondents.
Regarding the fixed effects structure, the results indicate that there are five significant variables: Regulation of Science Quiz, Science Quiz, age, gender and education dichotomized. The value of the intercept is 2.85. The slopes for Science Quiz and age are negative, indicating that the number of NA/ND responses increases when the age and the indicators of respondents’ ability decrease. The values are around −0.01.
The association between the response variable, gender and education is positive. Males are the reference category and hence, the value of 0.15 indicates that the mean number of NA/ND responses is 0.15 higher for females in comparison with males. A similar trend occurs with education. The reference level is having a Master, PhD or equivalent and the slope is 0.19, this means that the mean number of NA/ND answers is 0.19 higher for those that have not achieved the maximum educational level. The AIC is 10,806.6. Model residuals range between −1.81 and 0.77 and are inside the confidence interval of −2 and +2.
The marginal Pseudo-R2 of Nakagawa and Schielzeth (2013) is 0.09, while the conditional value is 0.82. This means that the variance explained by the fixed effects structure is only 9% while the whole model explains 82% of the variance in the response variable. This indicates that individual differences among respondents are a strong predictor of the number of NA/ND answers on the one hand, but also that the model failed to identify the predictors of satisficing on the other.
After adjusting the GLMM, the software generated a warning message concerning model convergence difficulties. It has been found that the lme4 package may generate these warnings for large data sets and large, complex models (lots of random-effects or fixed-effects parameters). A warning is not an error, but it is convenient to analyze different possibilities to identify the causes of the problem. The R package lme4 uses general-purpose nonlinear optimizers to estimate the variance-covariance matrices of the random effects. Assessing the convergence of such algorithms reliably is difficult, especially with complex models (great number of random-effects parameters). One of the possible strategies to address these warnings is to rescale the numerical variables, and after doing that, the warnings disappear (see Supplemental Annex).
Figure 1 depicts the plot of the Pearson’s residuals versus fitted values of the model, and the Pearson’s residuals plots versus the three predictors that significantly contribute to explain the number of NA/ND answers. It shows that the residuals are not randomly distributed among the predicted values and tend to accumulate in the lower values, an indication of bad model fit. Nevertheless, the model residuals are included in the confidence interval (between −2 and 2). There is also no indication of significant heteroscedasticity in the residuals regarding the predictors and, although there is less variation in the lower values of Science Quiz and Regulation of Science Quiz, there is not a clear pattern in the distributions. Therefore, the results provide evidence not that the model is wrong, but that it lacks relevant explaining variables, as evidenced by the fact that the fixed effects only explain 9% of the variance in the number of NA/ND answers.
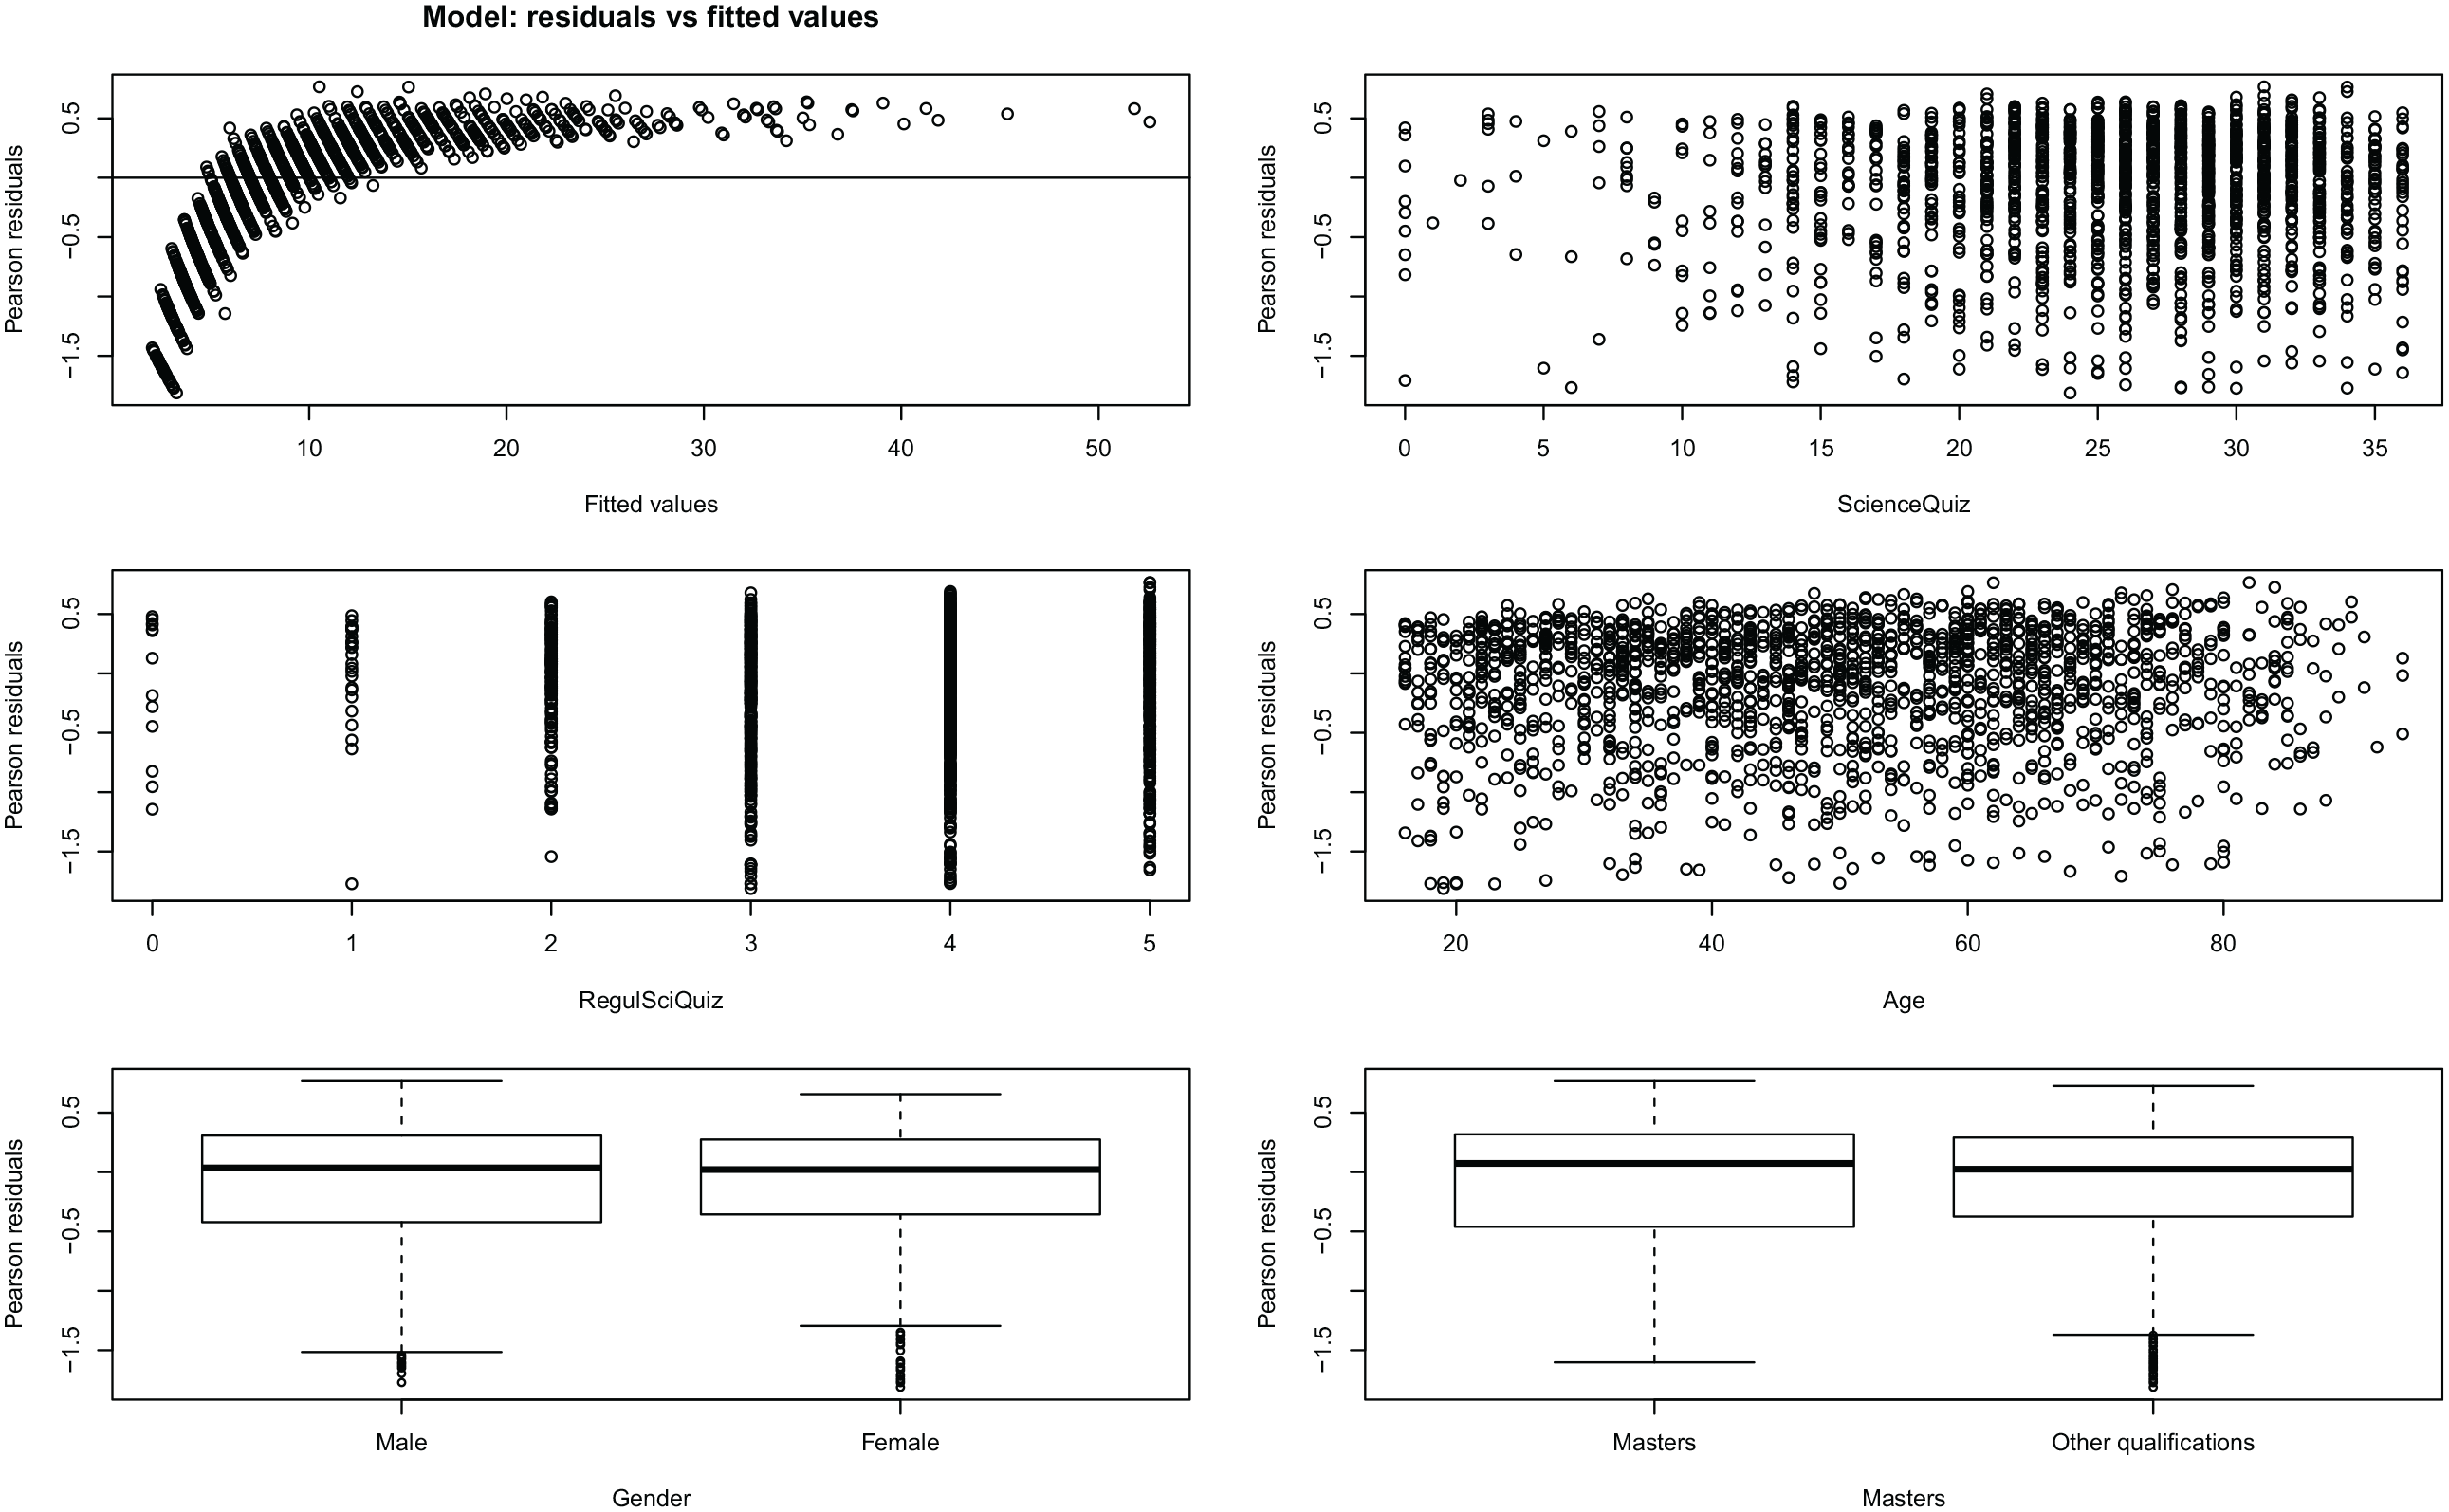
Plots of Pearson’s residuals versus fitted values and explanatory variables of the GLMM.
On the other hand, Figure 2 represents the QQ plot of the means of random effects, another graph for the diagnosis of the model. It can be said that, globally, the residuals of the random effects tend to fit a Normal distribution. However, the line curves off at the extremities, suggesting that there are more extreme values in the data than the expected.
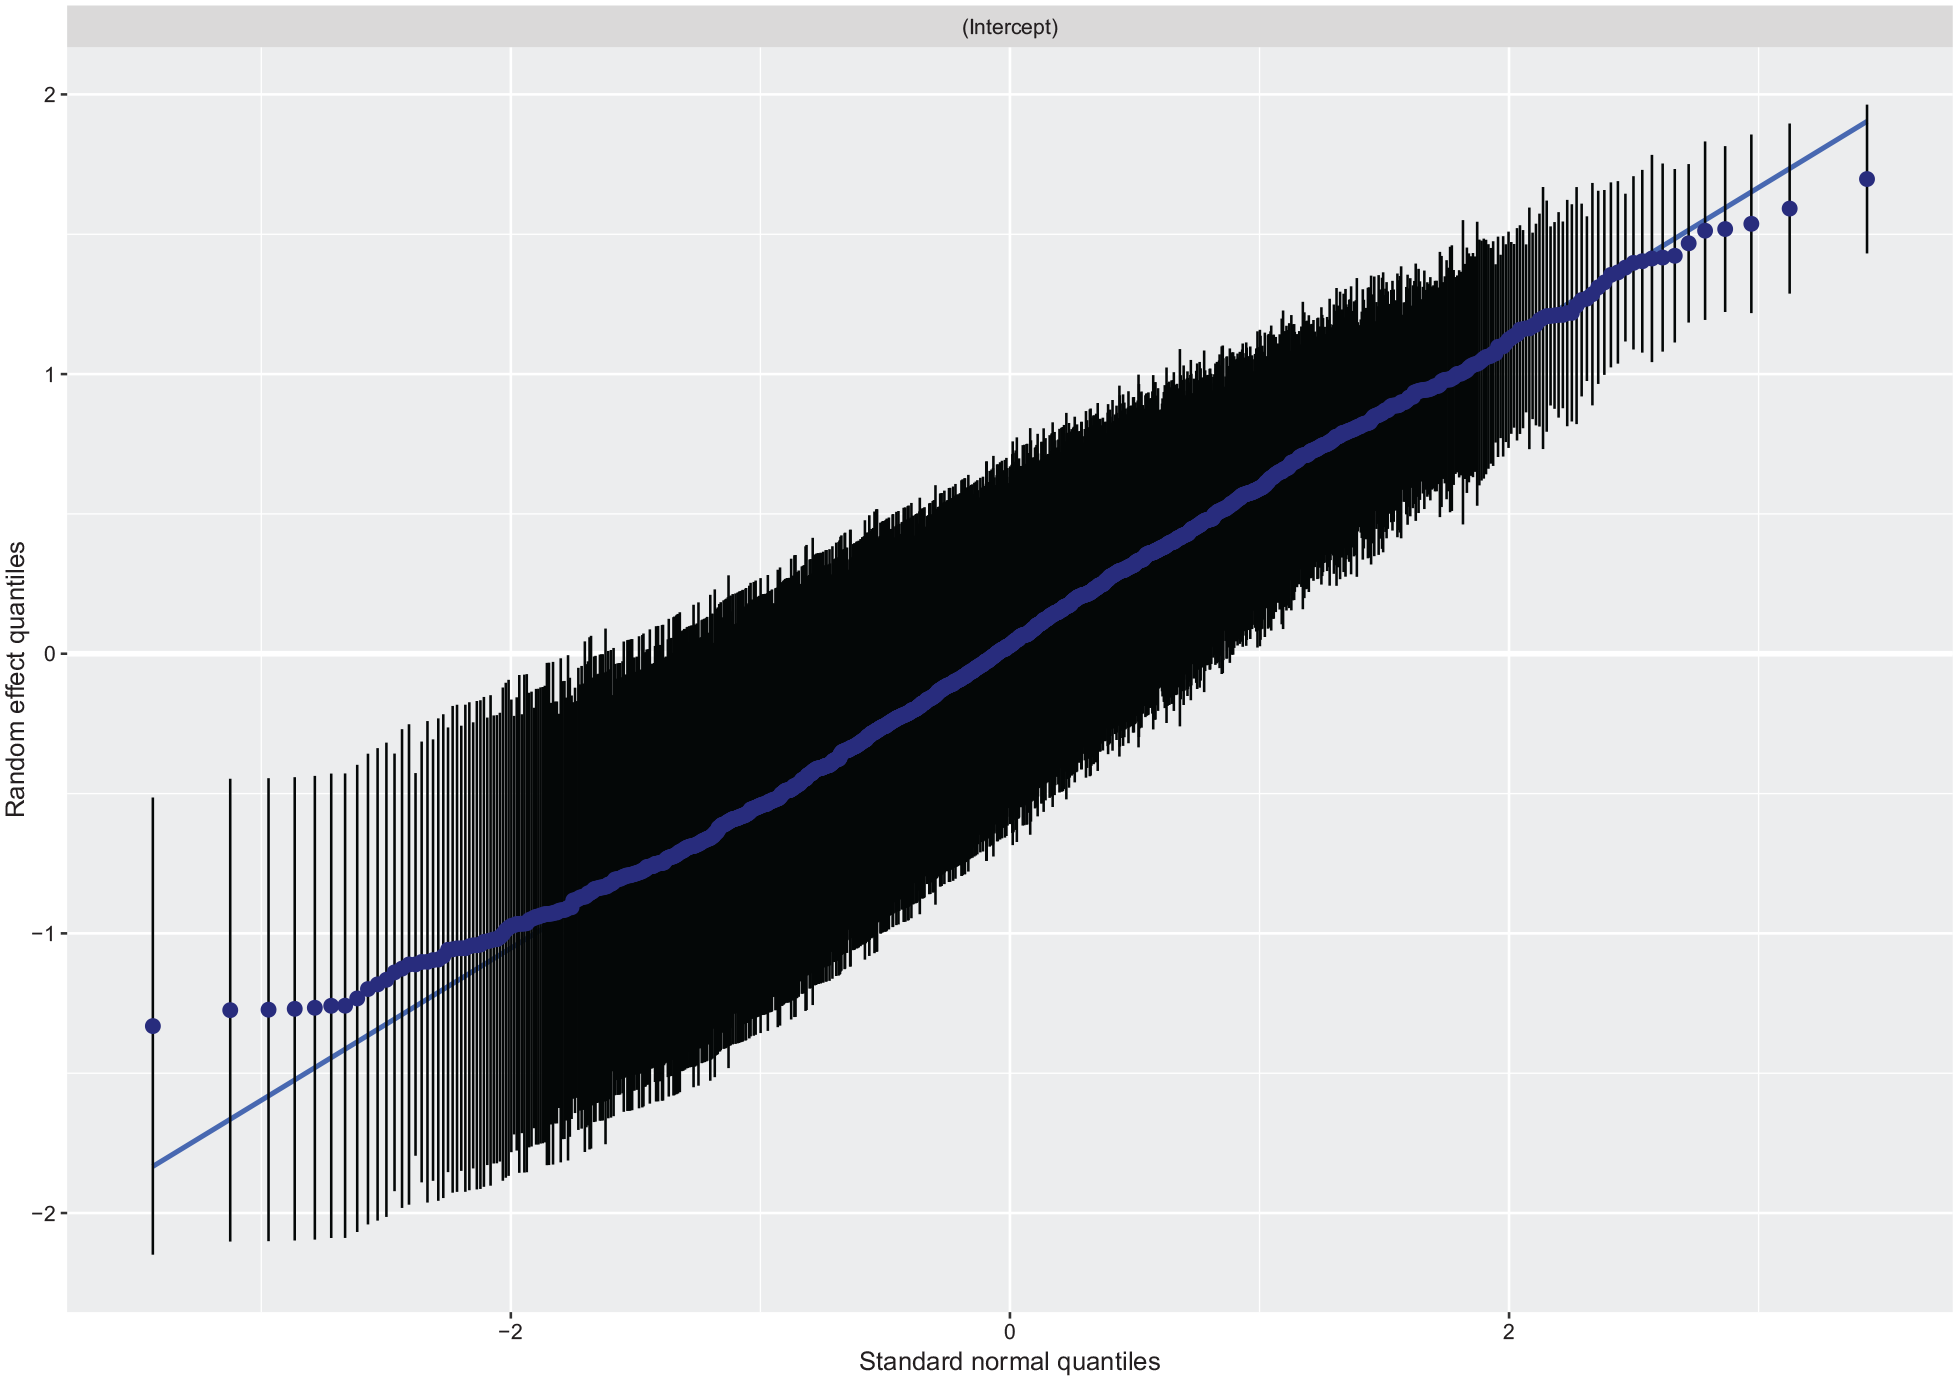
QQ plot of the means of the random effects of the GLMM.
The values of the Variance Inflation Factor (VIF) indicate the absence of collinearity between the predictors (values are 1.04 for Regulation of Science Quiz, 1.2 for Science Quiz, 1.08 for gender, 1.05 for age, and 1.04 for education).
Finally, Figure 3 shows the marginal effects on the number of NA/ND answers of Science Quiz, age and gender. There can be seen the negative slopes of the relationship of the response variable with age, Regulation of Science Quiz and Science Quiz. The slope is more pronounced for age, although there is more variability in Science Quiz and, especially, in Regulation of Science Quiz. The figure also shows the differences due to gender and level of education. There are, on average, one and a half more NA/ND answers in females than in males. There are also, on average, two more NA/ND answers in the respondents with educational levels distinct from Masters, PhD, or equivalent.
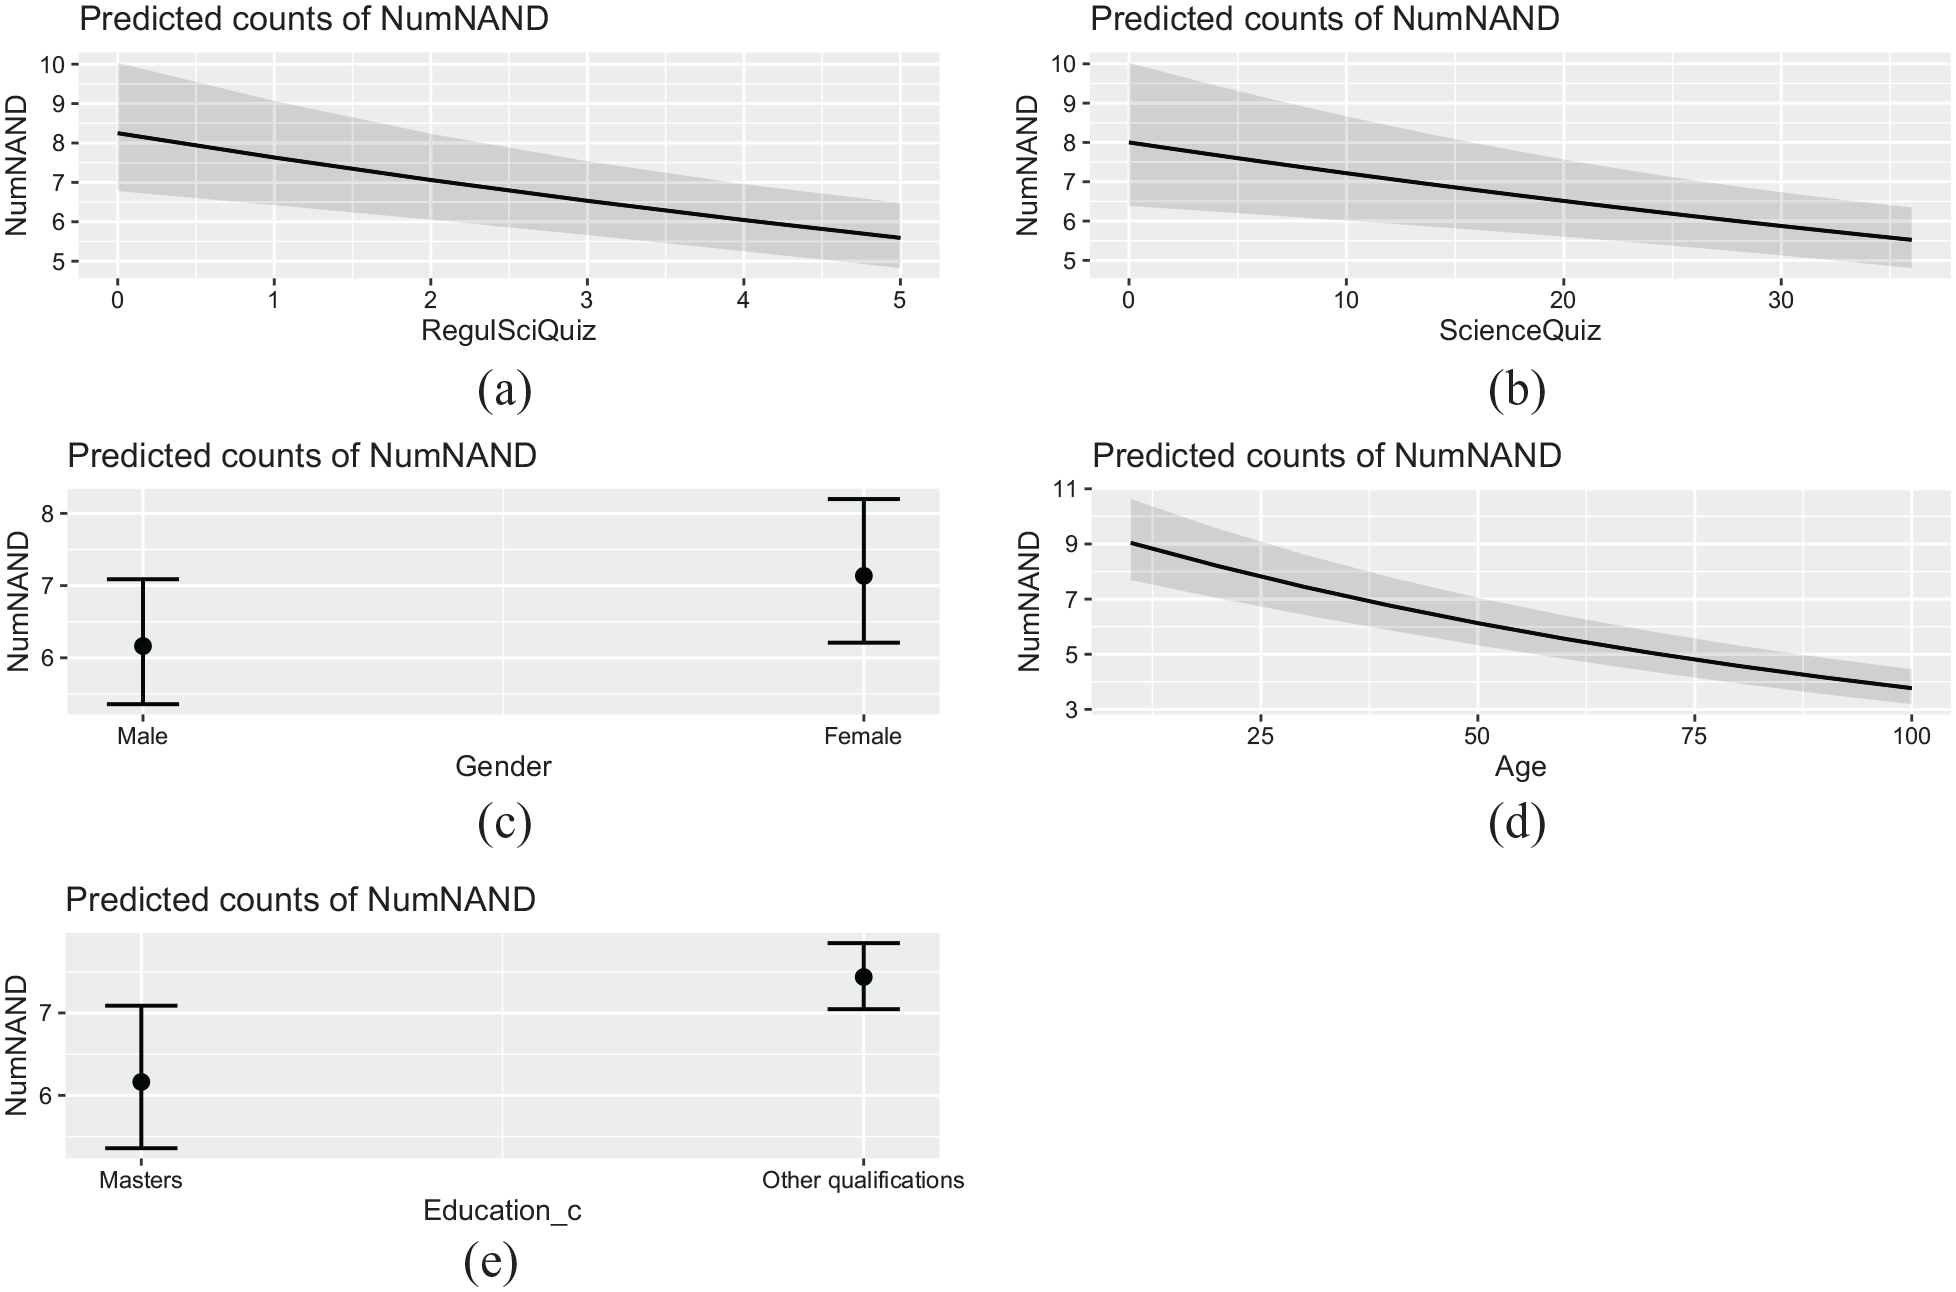
Marginal effects in the number of NA/ND answers of Regulation of Science Quiz, Science Quiz, age, gender and education dichotomized.
The influence of Science Quiz, Regulation of Science Quiz and education dichotomized on the number of NA/ND answers is positive and thus goes in the expected direction. To our knowledge, gender has not been deemed a significant predictor in survey research on question format. Therefore, we analyze gender differences in the other covariates in search of an explanation for this result and found that females provide more DK answers to the questions not including the A/D scale (mean for males is 1.63, for females is 2.7, and the measure of effect size is 0.26). They also mention more frequently that they have never heard of the S&T applications included in question 7 (mean for males is 0.74, for females is 1.25, and the measure of effect size is 0.3).
The results of females in the Science Quiz are significantly lower (means are 23.71 and 27.15 respectively, and the measure of effect size is 0.39). Regarding the perceived level of information about S&T, females select more frequently the options “Not at all” and “Not very well,” while males select more frequently the other two options: “Fairly well” and “Very well.” Cramers’ V is 0.22, a small effect size according to Mangiafico (2016). Females also show less interest in being engaged in S&T decisions, as they tend to agree that others should be involved, but not them; on the other hand, males more commonly express that they would like to have more of a say and they would like to become involved (Cramer’s V is 0.13).
There are more males that have a Masters, and more females with a GCSE (Cramer’s V is 0.13). Both values of Cramer’s V reflect a small size effect. The most significant association is between gender and working status. Cramer’s V is 0.34, a medium effect size. There are more males working full-time or unemployed, while there are more females working part-time or not working because they look after the house or children. These results show that despite females feel less familiarized with S&T than males, the greatest gender difference is related to working status.
Regarding the negative influence of age in the number of NA/ND answers and, following the rule of thumb of Gignac and Szodorai (2016), it can be said that there is a positive and small correlation between age and the number of DK answers in the questions not including the A/D scale (r = 0.15). The correlation between age and Science Quiz is negative and of medium magnitude (r = −0.21). On the other hand, the correlation with Culture Quiz is positive and large (r = 0.35). Older respondents manifest that they are not at all informed about S&T (effect size = 0.16) and are less engaged in S&T issues decisions (effect size is 0.25). They mainly stand out because they are more frequently placed in the categories “other” and without “formal qualification” in the educational level (effect size is 0.42).
Finally, age is strongly related to working status. The average age of people working full time is 42 years, of part-time workers is 46 years, of unemployed is 39 years, of retired is of 72 years, of those not working because of looking after the house or children is 39 years, of invalid or disabled respondents is 50 years, of students is 20 years, and of the category other is 43 years (Cramer’s V is 0.34). On the other hand, older people perform worse than younger respondents in all the variables with the exception of Culture Quiz. Therefore, these results seem to indicate that the negative association between age and the number of NA/ND answers is related to working status.
Discussion
We selected the PAS (2014) survey as the source of data for three reasons: first, it includes 65 items with a five point A/D response scale and NA/ND as the middle option; second, it incorporates a set of questions to measure specifically the respondents’ level of knowledge on the topic (questions about scientific literacy, cultural literacy and knowledge about scientific regulation) that hence allow to measure directly instead of indirectly this regulator of satisficing; third, science is a low-salient topic to most citizens and so we assumed that it can trigger the probability of satisficing. In this sample we found that the number of NA/ND answers depends on age, education level, and respondents’ knowledge about science, all of them regulators of satisficing related to respondents’ ability. On the contrary, none of the indicators of task difficulty or respondents’ motivation have significantly contributed to explain this variable. It is possible that engagement and interest are not good indicators of the motivational factors that regulate satisficing because they reflect attitudes toward science, not toward surveys, which seems to be a key factor to consider. On the other hand, the indicator of task difficulty is the number of DK answers in the questions not using the A/D format. It actually is an indicator of the difficulty respondents experience by and hence when is included in the random effects structure the variable accounting for individual differences, the number of NA/ND answers ceases to be explained by the number of DK.
The model explains 82% of the variance in the number of NA/ND answers. This is a good result that, however, may be to somewhat inflated because the regulators of satisficing only account for 9% of the variance in the number of NA/ND. The goodness-of-fit analysis of the model indicates the lack of relevant predictors that have not been included in the model because they were not available in the dataset, especially indicators of task difficulty and respondents’ motivation. It has been found that interest, an indicator of respondents’ motivation significantly influences the proportion of NA/ND (Truebner, 2021).
On the other hand, it is also possible that the topic of the PAS survey is generating some moderating effect not identified. Science is a low-salient topic and so it may have triggered some type of self-selection process in the sample. Task difficulty is induced by the topic, but is a constant and thus its effect cannot be analyzed. However, the PAS survey provided a specific indicator of respondents’ ability that has shown to be a better indicator than the indirect indicators used in other studies. This is not frequently available in other surveys of attitudes and opinions. On the other hand, although the survey did not include a direct indicator of task difficulty, our results suggest that the effect of gender and age might be explained, at least partially, by motivation. It seems possible that females feel that the task of answering the survey is disturbing and interfering with their daily life, while older people would perceive it as the opportunity to be useful or do something different. We consider this is to be an interesting hypothesis to analyze in future studies specifically designed for this purpose.
Despite its limitations, the PAS survey has the advantage of including 65 items that use the A/D scale. It is a figure high enough to show that there are people who choose the NA/ND option very often and others who do not use it at all. Therefore, it is possible that a key element in identifying respondents’ propensity to satisfice is the frequency with which they select the NA/ND option. The number of NA/ND answers of 75% of the respondents is between 0 and 13 (a maximum of 20% of the questions). However, the remaining 25% have selected this option in up to 86% of the questions. This finding goes in the direction pointed by Schuman and Presser (1996) and Krosnick (1991) and seems to imply that there is a continuum among respondents in their propensity to select the middle option that, at the high end, seem to reflect lack of opinion or low motivation.
This article presents various limitations. There is an evident decompensation between the explicative power of the structures of fixed and random effects in the GLMM as a result of the impossibility to incorporate relevant predictors of respondents’ motivation and task difficulty in the fixed effects structure. However, the model manages to explain 9% of the variance in the number of NA/ND using only predictors of the respondents’ ability. Truebner (2021) found that education level A (general indicator) has a significant but negligible influence on the proportion of NA/ND answers.
On the other hand, when the percentage of variance explained by the fixed effects structure increases, the percentage explained by the random effects structure decreases. Therefore, our results indicate that it remains pending to identify what factors contribute to explain individual differences. In turn, identifying the relevance of individual differences to explain responses to surveys is a strength of this article, as when the contribution of individual differences is neglected, it becomes part of the error variance (Eysenck, 1997). In line with our results Truebner (2021) found that the tendency to select the NA/ND option is the result of “unobserved heterogeneity between respondents” (p. 16). Baka et al. (2012) found that people’s reaction to NA/ND option seems to be far from homogeneous and depend on “the respondents’ contempt about the question” (p. 257). Future works should address two important tasks: (1) analyze the influence of individual differences in other samples, other contexts, on surveys of other topics and with other modes of administration; and (2) disentangle the specific factors that contribute to explain the influence of individual differences (e.g. self-perceived efficacy, motivation, or attitudes to surveys).
Lastly, the strategies used to formulate judgments about opinions depend on the subjects’ motivation. The more involved the respondents, the higher the probability to adopt a systematic strategy to process the available information that in a survey is mainly provided by the question. On the contrary, the less motivated the respondents, the higher the probability of using heuristic strategies of information processing (Schwarz and Vaughn, 2002). In this sense, it has been found that being interested on the topic of the survey significantly diminish the proportion of NA/ND in attitudinal questions (Truebner, 2021).
Conclusions
Our results indicate that understanding individual differences is relevant for survey research. Future analyses must pay close attention to respondents’ motivation, self-perceived efficacy, and attitudes toward surveys, among other factors that could contribute to explain the influence of individual differences.
People select the NA/ND middle point for different reasons. In accordance with Schuman and Presser (1996), our results indicate that there are differences in respondents’ propensity to select this option when offered. There is also evidence that A/D scales threat reliability in two senses: first, individuals are less certain when choosing a position on the A/D scale than on item specific response options scale (the categories used to express the opinion are exactly those answers researchers would like to obtain from respondents), and second, respondents tend to develop a response pattern to A/D questions which varies from individual to individual (Saris et al., 2010). Therefore, it seems that A/D scales with the middle point NA/ND are not a good option to measure attitudes and public opinion with accuracy and reliability, at least in difficult and low-salient topics.
Despite the problems generated by the use of agree-disagree rating scales they remain popular among researchers due to practical considerations (Revilla et al., 2014). But the analysis of the answer option NA/ND in the Agree/Disagree scales must take into account that this option is not always used as a midpoint by the interviewees but as a satisficing option. When this is the case, the data distribution does not respond to an ordinal logic (Sturgis et al., 2014) and, consequently, the midpoint should by analyzed separately. On the other hand, as far as the Agree-Disagree rating scale remains commonly-used, the high figures of NA/ND answers may be a hint that respondents are providing effortless answers when faced with low-salient or difficult topics.
Supplemental Material
sj-docx-1-mio-10.1177_20597991221127407 – Supplemental material for Analysis of the tendency to select the “neither nor” option in agreement/disagreement scales on a low – salience topic: The contribution of individual differences
Supplemental material, sj-docx-1-mio-10.1177_20597991221127407 for Analysis of the tendency to select the “neither nor” option in agreement/disagreement scales on a low – salience topic: The contribution of individual differences by Ana Muñoz van den Eynde and Josep Lobera in Methodological Innovations
Footnotes
Declaration of conflicting interests
The author(s) declared no potential conflicts of interest with respect to the research, authorship, and/or publication of this article.
Funding
The author(s) disclosed receipt of the following financial support for the research, authorship, and/or publication of this article: The corresponding author disclosed receipt of the research project: “Praxeología de la Cultura Científica: Evaluación y Medición” (FFI2017-82217-C2-2-P) Spanish Ministry of Science and Innovation, for the research, authorship, and publication of this article.
Supplemental material
Supplemental material for this article is available online.
Author biographies
References
Supplementary Material
Please find the following supplemental material available below.
For Open Access articles published under a Creative Commons License, all supplemental material carries the same license as the article it is associated with.
For non-Open Access articles published, all supplemental material carries a non-exclusive license, and permission requests for re-use of supplemental material or any part of supplemental material shall be sent directly to the copyright owner as specified in the copyright notice associated with the article.