
Abstract
Although some research effort has been devoted to the comparison of probability- and nonprobability-based Web surveys, different types of nonprobability-based samples have not been thoroughly examined. This exploratory study compares the data quality between online panel and intercept samples. Online panel refers to a pre-recruited and profiled pool of respondents. An intercept sample is a pool of respondents that are obtained through banners, ads, or promotions. Anyone can click on them and subsequently respond to a survey. Respondents are not pre-recruited or profiled. Three surveys with 52, 29, and 19 questions, respectively, were administered to both samples. Propensity score weighting adjustment is used for the analyses. The results show that the completion rates are higher for the panel than the intercept sample. The completion times are similar for these two samples. Data quality, on average, tends to be higher for panel than intercept samples.
Introduction
Research has shown that many factors contribute to the rapid growth of Web surveys, including high Internet penetration, low cost, timeliness, and so on (see, for example, Fricker and Schonlau, 2002; Sheehan, 2001; Wright, 2005). A major challenge that Web surveys face is the lack of a sampling frame of the general population and hence making inference from it. Couper (2000) classifies Web surveys into two broad categories: nonprobability-based and probability-based. He further classifies nonprobability-based Web surveys into three groups, namely, polls as entertainment, unrestricted self-selected surveys, and volunteer opt-in panels.
This study focuses on the last two types of nonprobability-based Web surveys and compares data quality between them through six surveys. As indicated by the name, unrestricted self-selected surveys, or a web intercept sample, usually use open invitations (e.g. banners or ads on websites) and impose no restriction on survey access. The identity of the potential respondents is unknown, and the personal contact information is usually not sought and no re-contact is attempted. It relies on recruiting anyone who happens to be passing through a website at a particular time. In contrast, opt-in panels collect panelists’ contact information, along with profile data at the sign-up stage for contacting and targeting respondents in later surveys. Previous research has examined different nonprobability sample acquisition strategies (Alvarez et al., 2003).
Nonprobability samples have been used in many fields. For example, researchers in fields like psychology and market research have long used nonprobability samples for experimental studies. For those types of studies, the representativeness of the sample is not critical. However, other aspects of data quality, in particular, the conscientiousness of the respondents, are of critical importance. Satisficing theory is often cited as a framework for understanding respondents’ cognitive process and efforts when responding to survey questions (Krosnick, 1991, 1999). According to this theory, respondents can be classified into two broad categories: optimizers and satisficers. Optimizers are those who carefully and conscientiously go through each cognitive step, including comprehension, retrieval, judgment and estimation, reporting, and mapping, before providing an answer. On the other hand, satisficers tend to take cognitive shortcuts and stop the cognitive process as soon as they reach a good enough yet not perfect answer.
Why should we expect the data quality as measured by satisficing to differ between the two sample sources? To answer this question, it is necessary to explain the nature of the two sample sources first. The intercept samples in this study come from offer walls. An offer wall is a page that appears within a mobile app that offers users rewards in exchange for completing some tasks. In this study, a survey invitation was offered on the offer wall when mobile game players needed additional game coins to continue with their games. Game players can click on one of the offers (tasks) displayed on the offer wall, and a survey is one of the offers. If the participants click on the survey invite, they will be redirected to the survey. Once they have completed the survey, participants are directed back to the offer wall page to collect their rewards and continue with their previous actions, in this case, mobile games. The online panel used in this study is SurveyMonkey Audience, an online nonprobability-based Web access panel. The panelists are recruited from over 30 million people who complete SurveyMonkey surveys every month. After one completes a survey on the SurveyMonkey platform, he or she will be directed to a landing page, called the survey thanks-page. On that web page, participants are asked to sign up for SurveyMonkey Audience. After signing up, panelists need to first take a profile survey asking a variety of demographic characteristics and behaviors, which are later used for targeting.
Three major differences between the intercept sample and the online panel under study can influence their data quality. First, the context of the survey environment could be different. For the intercept respondents, the survey is during the process of another action in which they are engaged. The respondents probably have more motives to rush through the survey so that they can return to their previous actions. This may lead to suboptimal data quality, that is, satisficing behaviors (Krosnick, 1991, 1999; Krosnick and Alwin, 1987). Although the survey-taking context of the panel respondents is not clear, considering that they are invited by emails, they have more control over the time and place at which they take the survey. Thus, it is less likely for panel respondents to start taking a survey when they are in the middle of another task and having to rush through the survey.
Second, incentives are different between these two sample sources. For the intercept sample, respondents are rewarded with game coins or lives in order for them to continue with the game. They benefit directly from taking the survey. For the panel survey, SurveyMonkey rewards panelists with charitable donations. There is no direct financial benefit from taking surveys for the panelists. The literature has examined the impact of incentives on the web survey response rate (Bosnjak and Tuten, 2003; Dykema et al., 2013; Göritz, 2006; Göritz and Wolff, 2007). One study examined cash incentives and charity donation and found that the charity donation actually decreased survey participation (Pedersen and Nielsen, 2014). Another study showed that incentives improved not only survey participation but also data quality (Van Veen et al., 2015). The direct incentive used in the intercept sample can probably provide more motivation to the respondents, and hence, they are more likely to treat the survey more seriously and give more conscientious responses. On the other hand, the charity donation in the panel survey suggests that respondents are doing the survey for altruistic reasons rather than personal benefit. Research has shown that altruistic-oriented people are more likely to accept survey requests (Abraham et al., 2006; Groves et al., 2000). In principle, those people should also be more likely to provide better data quality. Considering these, the different incentive strategies between the two sample sources produce competing expectations on their impacts on data quality.
Third, the survey experience is different between the two sample sources. The online panel respondents, in principle, should have more survey experience than the intercept samples. The literature shows either negative (Toepoel et al., 2008) or no correlation (Matthijsse et al., 2015) between survey experience and data quality. Given the mixed findings in the literature and the lack of data on survey experience, no specific prediction will be made based on this.
It is important to note that in this study, all intercept respondents used mobile devices, while panel respondents could choose from all types of devices, including mobile and non-mobile. Therefore, the mode could be another contributor to the difference, if any, between the panel and intercept samples. Previous studies found similar responses from both mobile and non-mobile survey participants (Couper et al., 2015). However, the current design does not allow a separation of the effects.
Data and measures
Three surveys with 52, 29, and 19 questions were tested on both online panel and intercept samples in the United States. The surveys were conducted in May 2015. Surveys were programmed and administered using the SurveyMonkey platform. The completion rate is calculated as follows 1

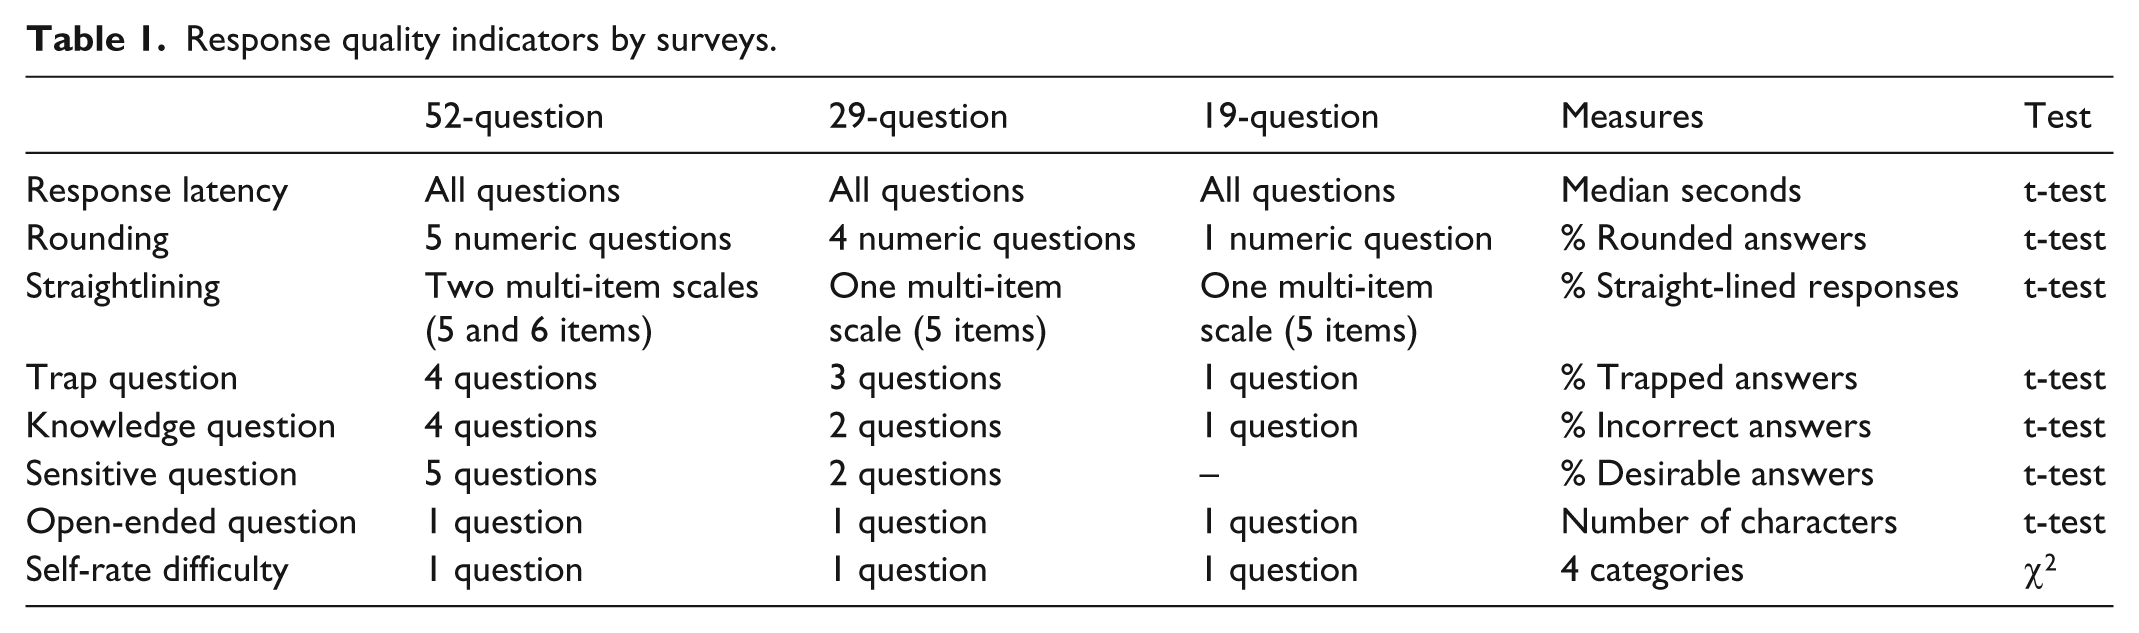
The 52-question survey is the most comprehensive; the other two are shorter versions of the 52-question survey. The data quality indicators are drawn from the satisficing literature (Krosnick, 1991, 1999). The satisficing literature suggests that satisficers, as opposed to optimizers, stop their cognitive process as soon as they reach a good enough but not optimal answer when they are responding to survey questions. The study also supplemented the satisficing indicators with other data quality measures. The measures used in the 52-question version include (1) response rounding of numeric questions—the percentage of numeric answers that are integers of 5; (2) straightlining of matrix questions—the percentage of respondents selecting the same response option regardless of the items in a matrix; (3) trap questions—the percentage of failed trap responses. An example of a trap question is “Please select B regardless of your real answer,” and failure means selection of any options other than “B” (for more examples, see Jones et al., 2015); (4) knowledge question answers—the percentage of inaccurate answers to knowledge questions; (5) sensitive questions—the percentage of socially desirable answers; (6) open-ended response quality—the number of characters for the open-ended responses; (7) time to complete in seconds—the median time for completing the entire survey. The 29-question and 19-question surveys included fewer questions. Table 1 summarizes the measures in each survey. All questions were required.
Response quality indicators by surveys.
Given the nature of this study, that is, to compare the survey responses from two different sample sources, it is impossible to conduct a strictly randomized experiment. Consequently, the sample compositions, in terms of demographic variables, in each pair of surveys under comparison can be different. To remove as much of the impact of demographic difference as possible, I analyze the data using t-tests or chi-square tests, with the propensity score weight. Specifically, I first fit a propensity model to predict participation in the online panel versus intercept survey, using variables that are potentially related to the response propensity for both surveys. The variables used in the three surveys are different, as the short surveys have fewer variables than the long survey. For the 52-question survey, the variables used in the propensity model include gender, age, race/ethnicity, education level, marital status, household income level, house ownership, insurance ownership, credit card ownership, census region, party ID, and ideology. The variables for the 29-question survey include gender, age, race/ethnicity, education level, marital status, household income level, census region, party ID, and ideology. The variables for the 19-question survey include gender, age, race/ethnicity, education level, household income level, and census region. Next, I create the propensity weight by taking the inverse of the probability of responding to the online panel versus intercept sample. In all models, a full propensity distribution was used for adjustment. Each propensity model showed balanced distributions of the variables used in the model, suggesting that the propensity model performed well.
For each survey, I conduct two sets of analyses. I first analyze all the samples together to compare intercept versus panel. Then, I separate the mobile panel respondents and compare them with the intercept respondents since all intercept respondents in this study used mobile devices. The numbers of respondents in the mobile samples for the three panel surveys are 178, 131, and 88, respectively, for the 52-, 29-, and 19-question surveys. The propensity score weights are calculated separately for these two sets of analyses.
Results
Completion rate
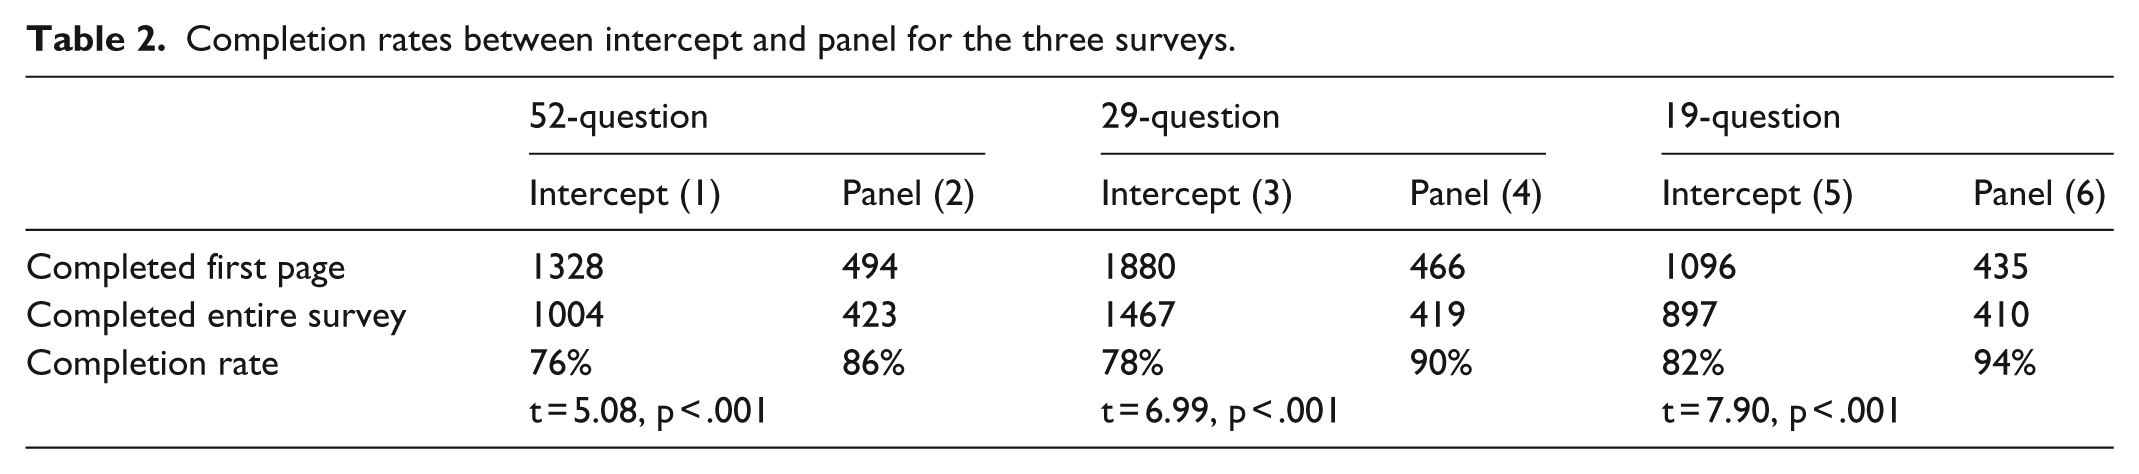
The completion rates for intercept surveys were significantly lower than the completion rates for panel surveys for all three versions of surveys (Table 2). When comparing completion rates across the three surveys for intercept and panel samples separately, a clear trend emerges: a short survey leads to a higher completion rate.
Completion rates between intercept and panel for the three surveys.
52-question survey
Table 3 presents the survey responses between intercept and panel respondents.
Data quality indicators for 52-question intercept and panel surveys.
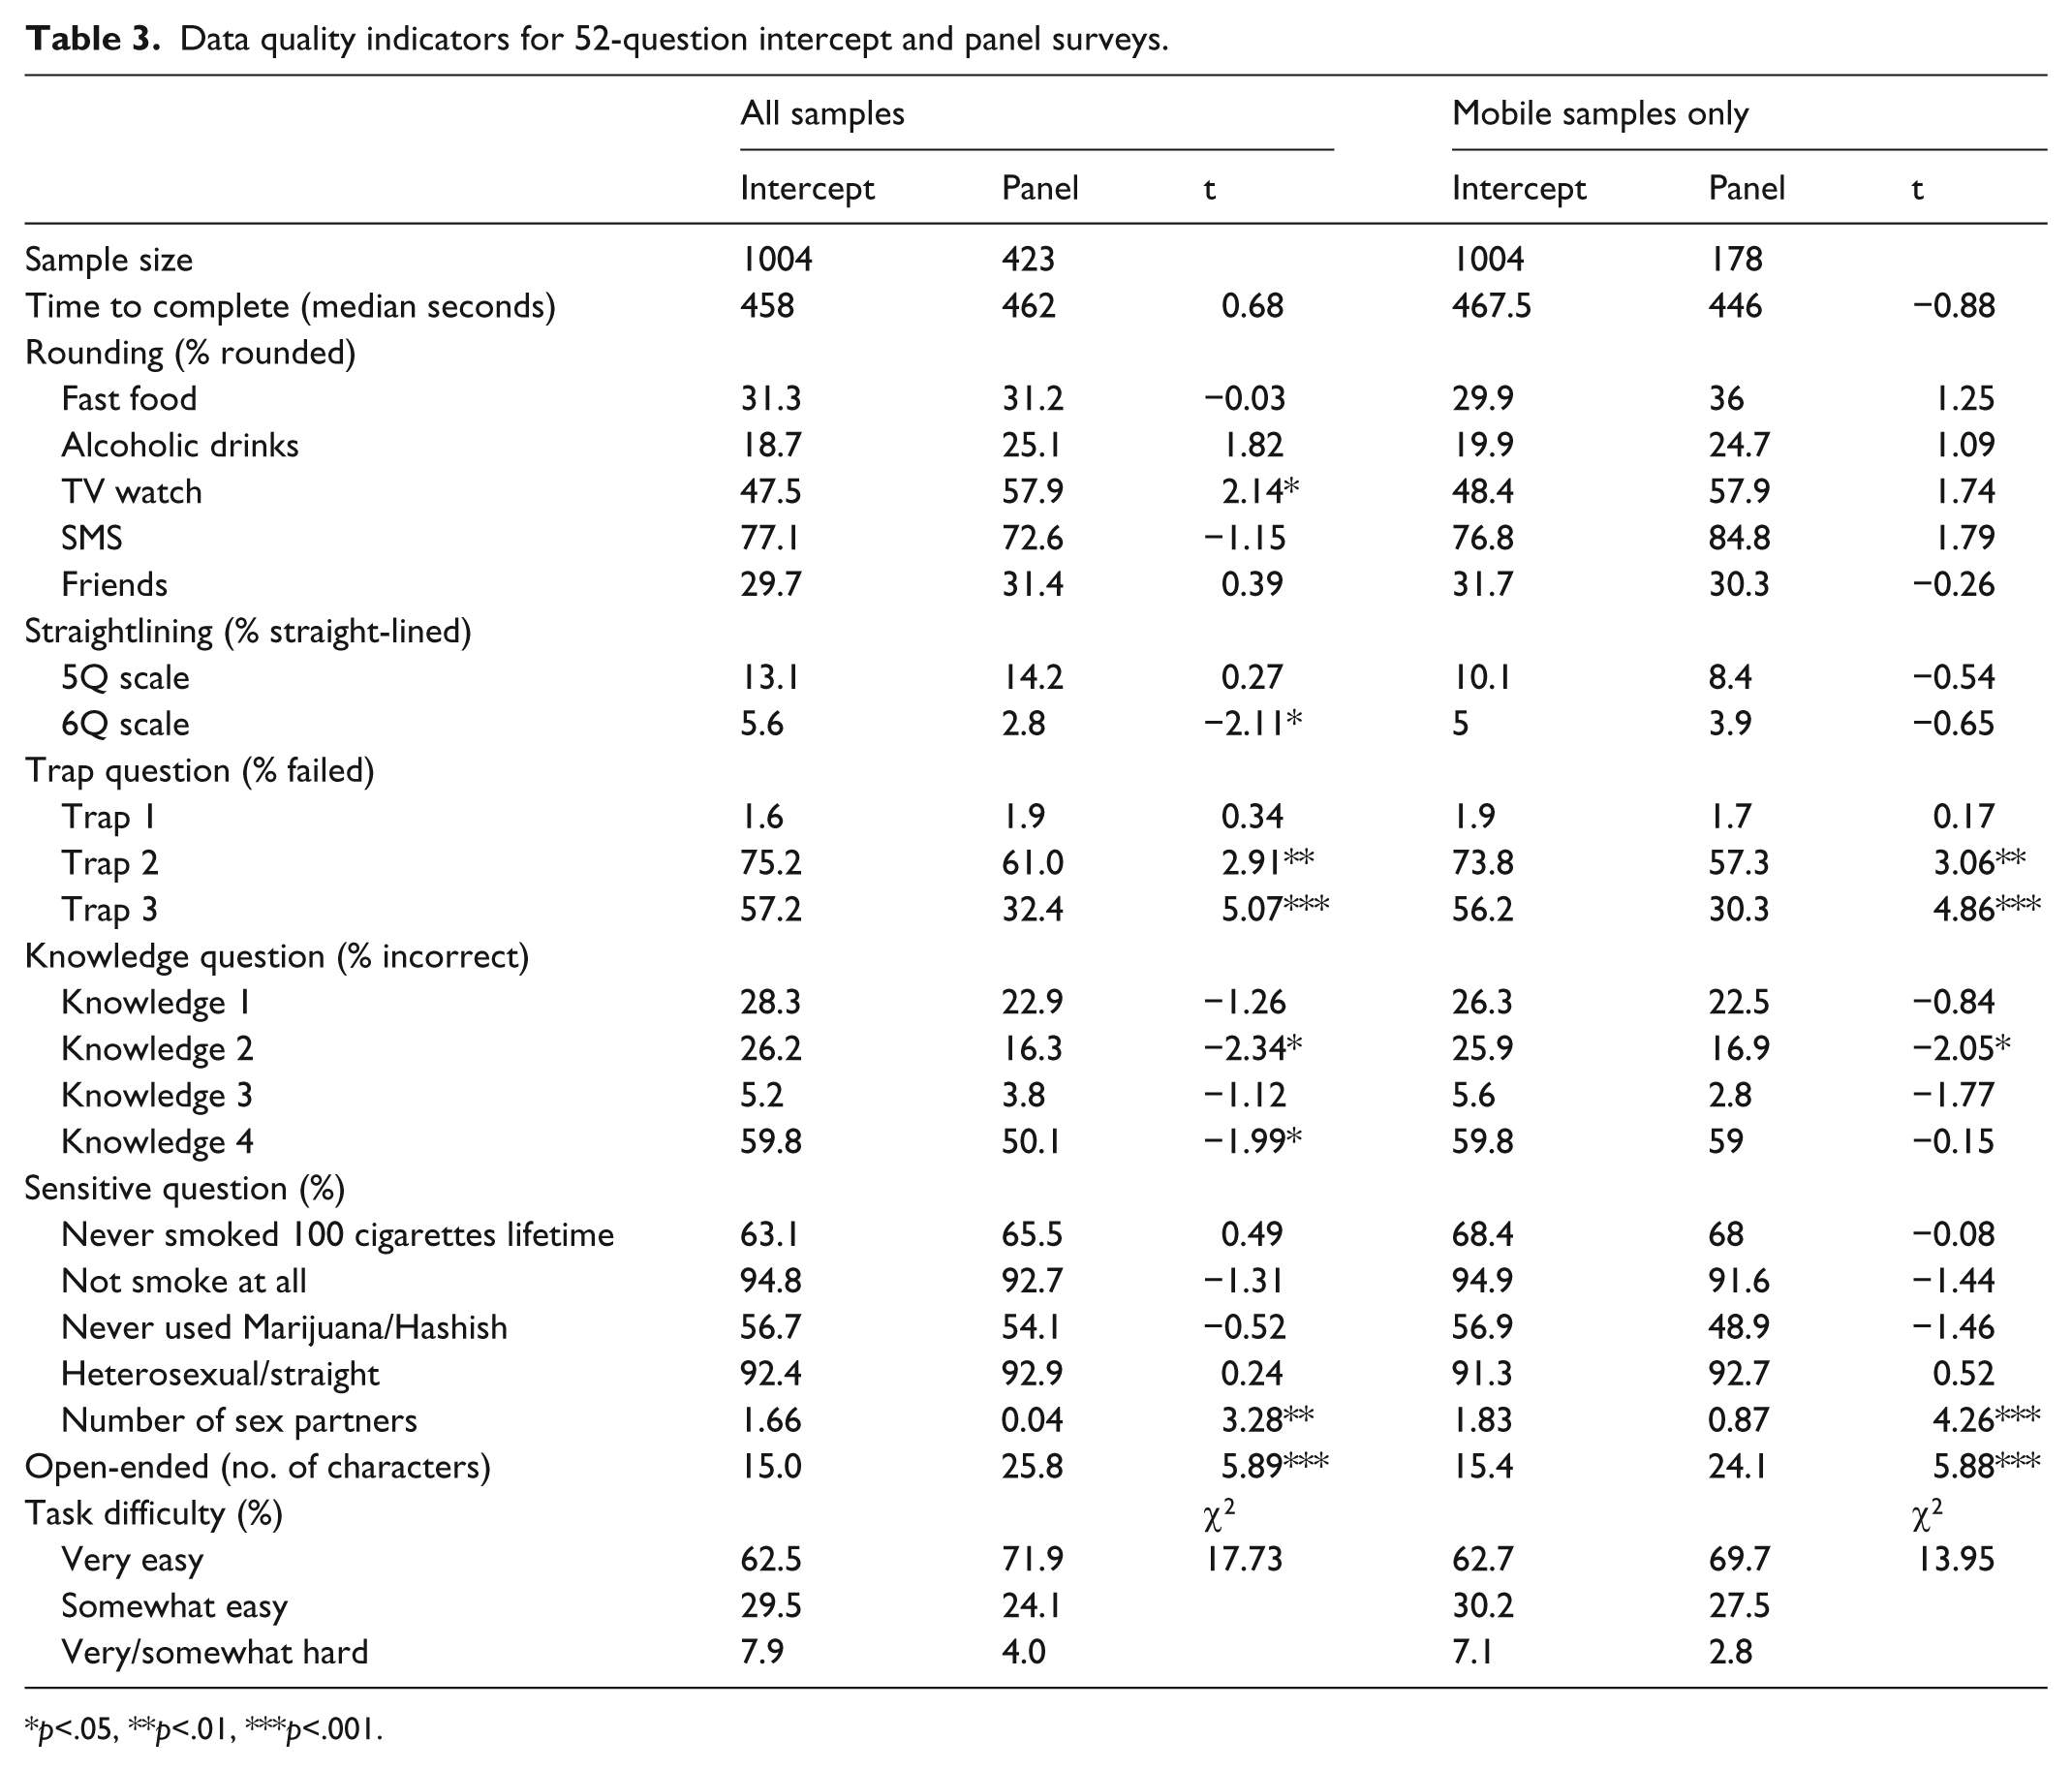
p<.05, **p<.01, ***p<.001.
Time to complete
The median time to completion for the intercept and panel surveys was not significantly different between the all samples and mobile samples only.
Response rounding
One item showed a significant difference, in which the panel survey produces more rounded answers than the intercept survey. When only comparing mobile respondents, panel respondents tend to provide more rounded answers than intercept respondents, although the differences were not significant.
Straightlining
Straightlining is measured through two sets of multi-item rating scales, one with five items and the other with six items. For the 6-item scale, panel respondents are significantly less likely to straightline than intercept respondents (t = −2.11, p < .05). The difference is smaller and not significant for the mobile-only comparison.
Trap question
Three trap questions were asked in the survey, where the first one is much easier than the other two. For the easy question (Trap 1), almost all respondents answered it correctly. For the two more difficult questions, significantly fewer panel respondents failed than did intercept respondents (Trap 2: t = −2.91, p < .01; Trap 3: t = 5.07, p < .001). The same trend is found for the mobile-only respondents (Trap 2: t = 3.06, p < .01; Trap 3: t = 4.86, p < .001).
Knowledge question
Four knowledge questions were asked in the surveys and panel respondents were more likely to provide correct answers to all of them than were intercept respondents, although only two are significant in the all samples comparison and one is significant among the mobile samples. In the mobile-only comparison, the intercept sample provided significantly more wrong answers than the panel sample to one question.
Sensitive question
Among the five sensitive questions, only the one on the number of sexual partners shows a significant difference; intercept respondents report more lifetime sexual partners than panel respondents (all samples: t = 3.28, p < .01; mobile samples: t = 4.26, p < .001).
Open-ended question
Panel respondents provided longer responses to the open-ended question than intercept respondents, and this was the case for both the all samples (t = 5.89, p < .001) and mobile samples only (t = 5.88, p < .001)
Most of the open-ended responses were valid, although the panel respondents provided even fewer invalid responses than the intercept respondents in the all samples analysis (t = −2.13, p < .05).
To sum up, there are 21 indicators under comparison, and for all samples, eight data points show significant differences between the two sample sources. When restricted to mobile respondents only, only four comparisons are significantly different. It needs to be pointed out that the mobile panel sample size is relatively small (n = 178), and therefore, the lack of significant findings may simply be lower. To reflect the data quality difference while accounting for the smaller sample size, I calculated the average difference between the intercept and panel samples (except time to complete and open-ended response because these are in a different metric from the other variables), and it is 3.77 for all samples comparison and 2.48 for mobile comparison. A positive number suggests lower data quality for the intercept than the panel sample. This means that, on average, intercept respondents produced somewhat worse data quality than panel respondents.
29-question survey
The 29-question survey contained the same set of data quality indicators as the 52-question survey, although fewer questions for each indicator (Table 4).
Data quality indicators for 29-question intercept and panel surveys.
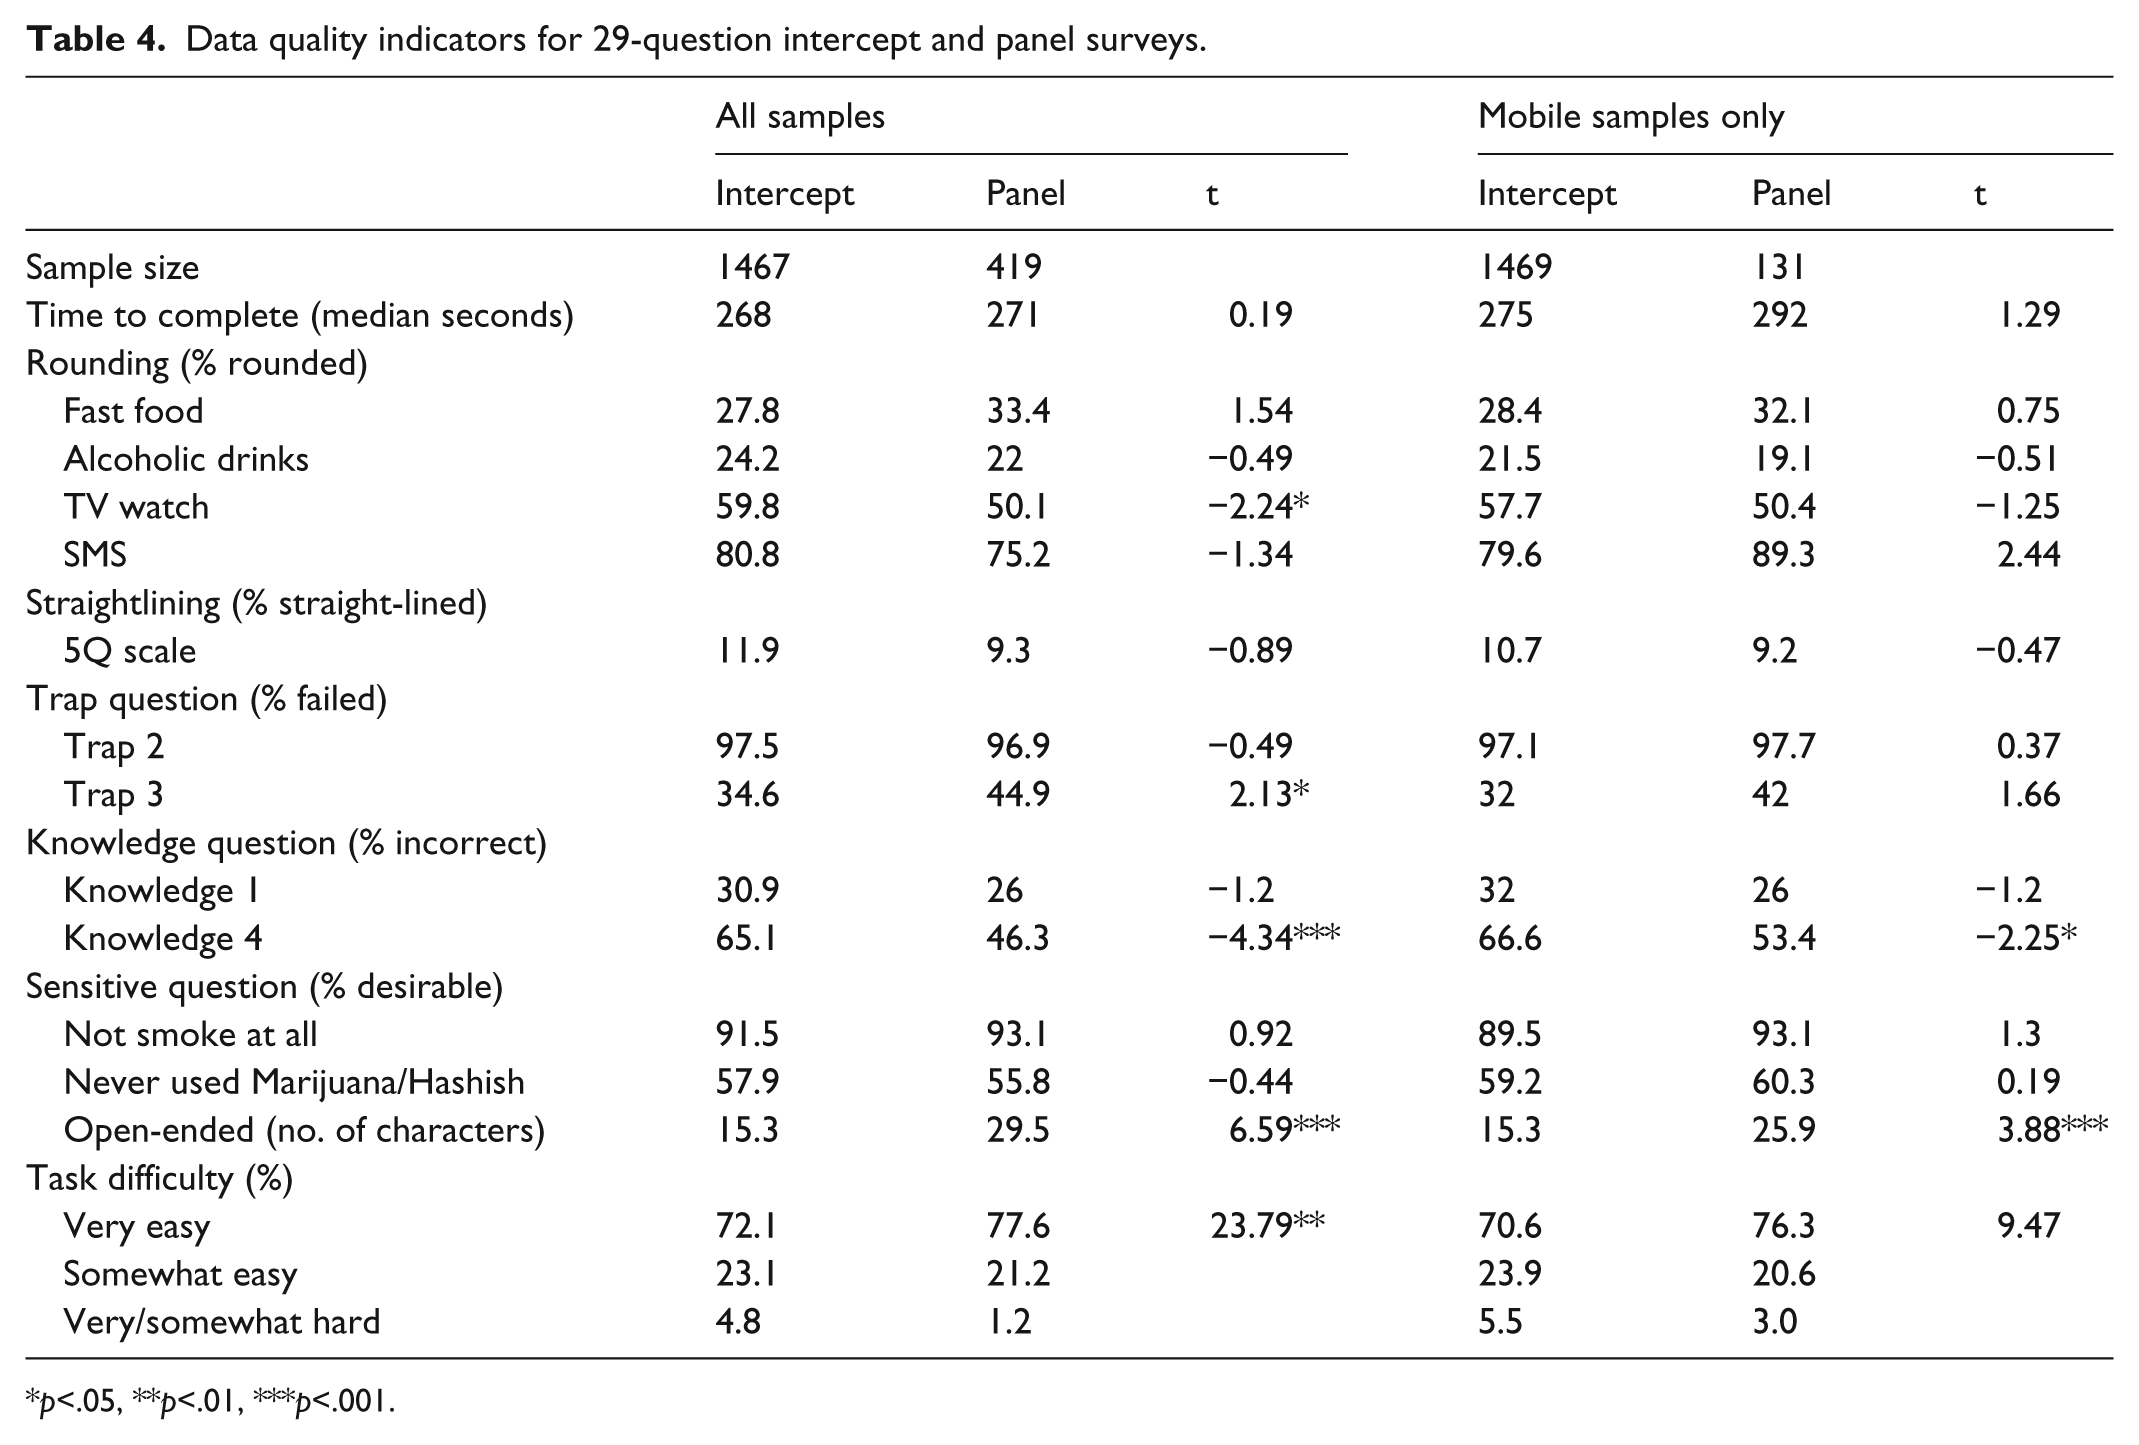
p<.05, **p<.01, ***p<.001.
Time to complete
Similar to the 52-question survey, in this 29-question survey, the median time to completion for intercept and panel surveys was not significantly different for both the all samples and mobile samples only.
Rounding
Four numeric questions were used to measure response rounding. Intercept respondents gave significantly more rounded answers to only one question (t = −2.24, p < .05) in the all samples analysis. The disparity between the two samples becomes smaller and is not significant in the mobile-only analysis.
Straightlining
Only the 5-item scale was asked in this survey and the difference between the two samples is small and not significant for both the all samples and mobile-only comparisons.
Trap question
The two more difficult trap questions were used in this survey. The difference of the percentages of failed respondents for Trap 2 is small between the two samples but large for Trap 3 (t = 2.13, p < .05, all samples). The difference in the mobile-only sample is not significant.
Knowledge question
Two knowledge questions were kept for this version of the survey. Panel respondents consistently provided more accurate answers than intercept respondents, although the difference was significant only for the Knowledge 4 question (all samples: t = 4.34, p < .001; mobile respondents: t = 2.25, p < .05).
Sensitive question
Two questions on smoking and drug use were asked, and the responses were similar between the two samples and no significant differences were found.
Open-ended question
Panel respondents provided longer responses to the open-ended question than intercept respondents, and this was the case for both the all samples (t = 6.59, p < .001) and mobile samples only (t = 3.88, p < .001)
Across all the data quality indicators except for response latency, the average difference is 3.16 for all samples and 0.71 for the mobile samples comparison.
19-question survey
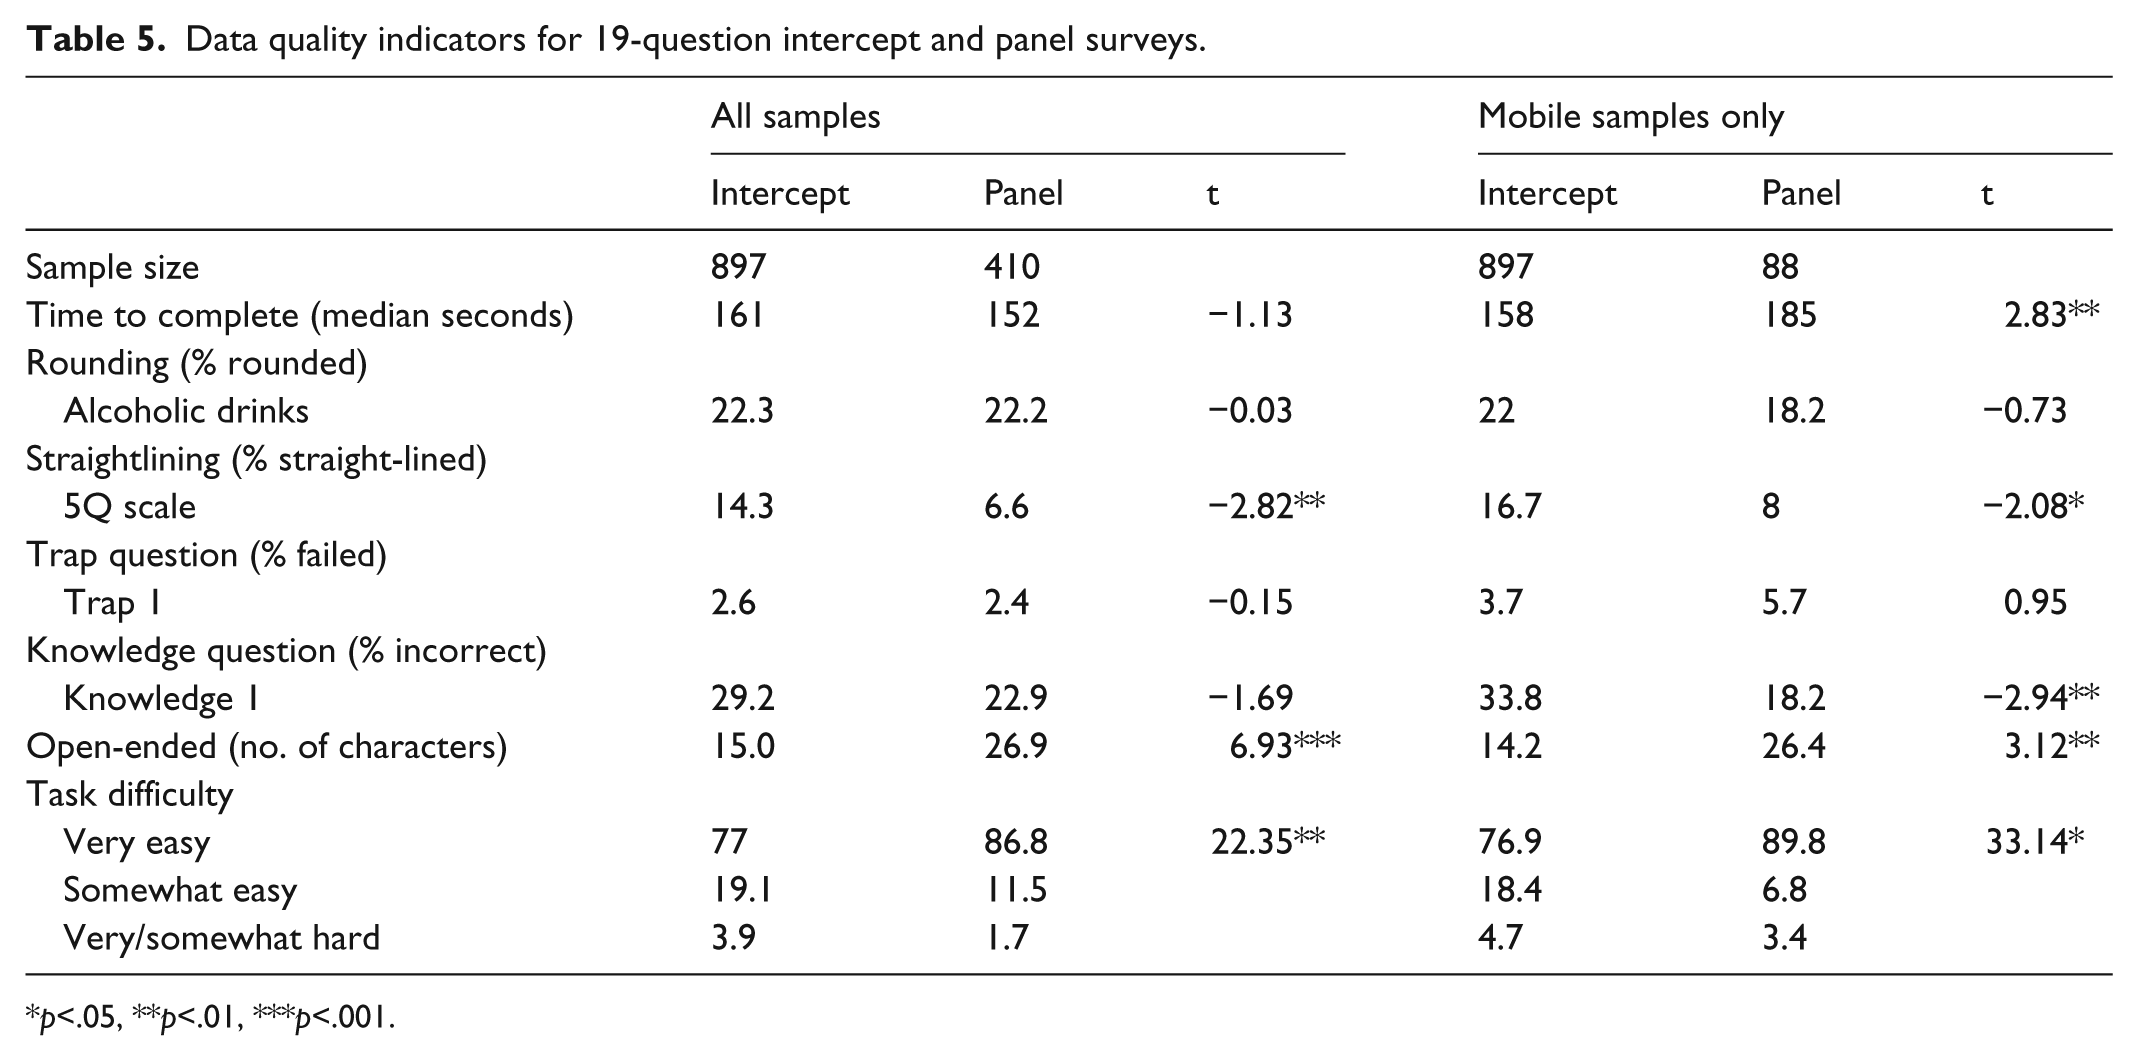
With the exception of the sensitive questions, the 19-question survey included all the data quality indicators. However, only one question was asked for each data quality indicator (Table 5).
Data quality indicators for 19-question intercept and panel surveys.
p<.05, **p<.01, ***p<.001.
Time to complete
The median time to completion for the intercept and panel surveys was not significantly different when all samples were combined. However, for the mobile-only samples, the median time was significantly longer for the panel than the intercept sample.
Rounding
The differences between the two samples were small and not significant for both all samples and mobile-only respondents.
Straightlining
More straight-lined responses existed in the intercept than the panel samples, and the differences were significant for both analyses (all samples: t = −2.82, p < .01; mobile respondents: t = −2.08, p < .05).
Trap question
Only the easiest trap question was retained in this survey. Hence, the failure rates were quite low and similar between the two samples.
Knowledge question
Panel respondents provided more accurate answers than did the intercept respondents. The difference was significant for the mobile respondents (t = 2.95, p < .01).
Open-ended question
Panel respondents provided longer responses to the open-ended question than intercept respondents, and this was the case for both the all samples (t = 6.93, p < .001) and mobile samples only (t = 3.12, p < .01).
On average, the difference between the intercept and panel samples is 3.57 for the all samples comparison and 6.52 for the mobile samples comparison.
Task difficulty
At the end of each survey, the respondents are also asked to evaluate the level of difficulty of the survey through a 4-point rating scale. For the 52-question survey, the differences between the panel and intercept samples were not significant. For both the 29- and 19-question surveys, significantly more panel respondents thought the survey to be very easy than intercept respondents, in the all samples comparison. The same pattern emerged for mobile samples only in the 19-question survey.
Conclusion and discussion
Different survey sampling strategies have their own pros and cons. Previous studies have largely focused on the examination of nonprobability survey data quality by benchmarking the survey estimates on external probability benchmarks. To our knowledge, this is the first study that compares data quality between intercept and panel surveys. Instead of examining the representativeness of the survey data, this study focuses on respondent satisficing, a data quality perspective that is of crucial importance for nonprobability surveys.
The completion rates of panel surveys are consistently higher than intercept surveys, regardless of the survey length. This suggests that the online panel has advantages over the intercept in terms of cost and efficiency. One thing to point out is that the higher completion rate for the panel survey may be due to the fact that PC respondents tend to have greater response propensity than mobile respondents in general, and, should we remove the PC respondents from the completion rate calculation, a different pattern might emerge. Unfortunately, such data were not captured in the platform for me to calculate a mobile-only completion rate for the panel sample.
For the 52-question survey, the overall comparison between the two samples revealed eight significant differences among 21 data points. Among the eight significant data points, six showed indications of superior data quality for the panel compared to the intercept sample. However, after restricting the comparison to mobile-only respondents for the panel, the number of significant differences drops to four and all but one suggest that a panel survey produces better quality data than does an intercept survey. Similarly, for the 29-question survey, among the 13 data points studied, three showed significant differences, among which two indicated that the panel survey respondents had fewer satisficing behaviors. Only one data indicator remains significant and it indicates that intercept respondents produce better data among mobile respondents. The 19-question survey only has six data points under comparison, of which two showed significant differences; both indicated that panel respondents satisfice less than intercept respondents. Interestingly, for the mobile-only comparison, one more data quality indicator becomes significant.
The fewer significant differences in the mobile samples could be due to the smaller sample size of mobile respondents in the panel survey. Another analytical approach we took was to calculate the average difference between the two sample sources across all data quality indicators in each survey. The results show that the panel respondents engaged in fewer satisficing behaviors than the intercept samples.
The cost of each complete response was US$3.00 in the 19-question survey, US$4.50 in the 29-question survey, and US$7.00 in the 52-question survey, for both panel and intercept samples. There is no financial benefit in choosing one over the other.
There are several limitations to this study that future research could address. First, the panel sample is a combination of both mobile and non-mobile respondents, but the intercept sample is entirely mobile, and hence with the data available, it is not possible to separate out the sample source effect from the mode effect. Other studies have found few differences in data quality between mobile and PC respondents (for a review, see Couper et al., 2015), and they provide some confidence for me to believe most of the differences observed are due to the sample sources rather than the mode. However, it is very important for future study to tease out the mode effect from sample differences. Second, not all propensity models are the same. The shorter surveys have fewer predictors in the model than do the longer surveys simply because fewer questions are asked in the shorter surveys. Consequently, the power of propensity score weighting adjustment is not equal across the three survey lengths and it may therefore contribute to the data quality difference. Should there be the same propensity model for all surveys, the difference between intercept and panel might be further reduced for the shorter surveys. Third, there is more than one way of recruiting and inviting survey participants from intercept samples. For example, participants could be recruited through more targeted approaches, by targeting populations that are potentially interested in the survey and using messages that appeal to their altruism (for examples, see Barratt et al., 2015; Barratt and Lenton, 2015). A different recruiting and incentive strategy might appeal to different sectors of the population and hence lead to different data quality. Future studies should examine whether the findings in this study hold if the intercept samples are recruited differently. Last but not least, this study targeted the general population, without any targeting or screening. Everyone from the intercept and panel samples was eligible for this study. In reality, many web surveys target a specific group or people with specific characteristics. Whether the findings of this study hold when the goal of the survey is to target a subgroup of the population is unknown, and I encourage future study to explore this.
Footnotes
Appendix 1
Declaration of conflicting interests
The author(s) declared no potential conflicts of interest with respect to the research, authorship, and/or publication of this article.
Funding
The author(s) received no financial support for the research, authorship, and/or publication of this article.