
Abstract
Research on mixed devices in web surveys is in its infancy. Using a randomized experiment, we investigated device effects (desktop PC, tablet and mobile phone) for six response formats and four different numbers of scale points. N = 5,077 members of an online access panel participated in the experiment. An exact test of measurement invariance and Composite Reliability were investigated. The results provided full data comparability for devices and formats, with the exception of continuous Visual Analog Scale (VAS), but limited comparability for different numbers of scale points. There were device effects on reliability when looking at the interactions with formats and number of scale points. VAS, use of mobile phones and five point scales consistently gained lower reliability. We suggest technically less demanding implementations as well as a unified design for mixed-device surveys.
Keywords
Introduction
Surveys are important methods of collecting data in social science, sociological, psychological, behavior and related research, and online or web surveys are becoming increasingly popular (Dillman, Smith and Christian 2014). Online surveys are not only accessed on regular desktop PCs, but also on other devices such as tablets or mobile phones. Web survey designers can use many different response formats to program an online survey, and these may have an impact on respondents’ behavior due to a wide variation of screen sizes between devices and different methods of navigation. Likert-type rating scales, in which respondents are asked to select an answer falling within a continuum (e.g., agree-disagree), are commonly used as a response format in surveys. Traditional PC-based web surveys usually gather data by means of rating scales made from Radio Buttons that are circles to click on. With the rise of mobile-friendly (responsive) design, tiles or so called Big Buttons are often used to increase the size of the clickable format. Alternatives are Visual Analogue Scales (VAS), which represent clickable lines. These are frequently used in the medical sector. Slider scales, which are often used in market research, use a slider to define the answer position on the line (Funke 2016).
It is well known that response formats (Jenkins and Dillman 1995; Couper et al. 2004; Toepoel and Dillman 2011; Toepoel, Das, and Van Soest 2009) and their visibility (Couper et al. 2004) influence respondents’ answers. Visibility in particular could be more problematic on mobile phones, owing to the small size of their screens. Visibility may also be related to the length of the response format, in particular to the number of scale points. As Radio Buttons do not make efficient use of space, the number of scale points quickly affects the visibility and usability of answer scales on mobile phones (because of the small screen sizes). It is not clear whether the answers given on a mobile phone can be compared with answers given using a tablet or desktop, as using a mouse and a large desktop PC or using a finger on a small mobile phone screen are two very different ways of pointing to a desired answer category. This raises the question of how device, scale points and response formats interact, in order to see if they provide equivalent measures. In addition, research is needed not only on how devices and different response format realizations affect respondents’ behavior, but also on whether there is a response format that can be recommended for use with different devices.
In this paper we present results from an experiment conducted in the GfK Online Panel in the Netherlands. Respondents were randomly requested to complete the survey on either a regular desktop PC, a tablet, or a mobile phone. The response formats (Radio Buttons, Big Buttons, Slider Bars, or VAS and combinations of the latter two) and the number of scale points (5-, 7- 11, or 100-point scale) were also varied.
The comparability of data between different devices, formats or modes can be assessed by two main methods (Hox et al. 2015): i) comparison of distributions or means and ii) evaluation of comparability of variance, covariance and mean structures. The first method was used by Toepoel and Funke (2018), who found strong differences in mean scores and item nonresponse between devices and response formats with regards to this experiment. To investigate comparability of data more thoroughly, we apply the second method in this paper. To evaluate comparability of data between devices, with different formats and different number of scale points, we conducted exact measurement invariance tests (Meredith 1993). In addition, we compared measurement quality by means of reliability scores among different groups using a Latent Variable Modeling (LVM) approach (Muthén 2002; Raykov and Marcoulides 2011).
Background
Mixed-Device Surveys
Respondents can complete an online survey on a regular PC, a tablet or a mobile phone. Use of these devices within one online-survey has been referred to as mixed-device surveys (Toepoel and Lugtig 2015; Toepoel and Funke 2018). In this sense, mixed-device surveys are similar to mixed-mode designs where a combination of different survey modes, e.g. face-to-face, telephone, paper-and-pencil, or web, is used. Research on mixed-mode designs shows that respondents’ participation behavior and measurement effects can make it difficult to compare results obtained in different modes (e.g., Hox et al. 2015; Schouten et al. 2013). Respondents chose a device for survey completion at their own preference. Haan, Lugtig and Toepoel (2019) show that device ownership does not predict device use. Rather, it is the attitude of respondents towards the use of mobile devices that drives the intention to use them and which in turn explains the use of mobile devices in surveys.
There has been an increasing amount of research on mixed-mode design in recent decades (Couper 2011; DeLeeuw 2018; Dillman, Smyth, and Christian 2014). Although the literature on mixed-device surveys is still in its infancy, it is reasonable to expect similar problems in mixed-device surveys.
More and more people access online surveys via mobile devices (cf. Toepoel and Funke, 2018). Johnson (2015) shows that around 25% of respondents to an online survey use a mobile device (tablet or phone). De Bruijne and Wijnant (2014) report around 15% use in the Dutch probability-based CentER and LISS Panel. Poggio, Bosnjak and Weyandt (2015) report about 18% use of a mobile device in the German Social Science Infrastructure Services (GESIS) Panel. Lugtig, Toepoel, and Amin (2016) show that about 30% of respondents sometimes complete surveys on a mobile device and about 12% always use a mobile device in the American Life Panel. For different German election studies, Gummer, Quoß and Roßmann (2019) report an increase in the use of mobile phones to approx. 20% and in the use of tablets to approx. 10%. This suggests that mobile-friendly web survey design is growing in importance (see, e.g., Revilla, Toninelli, Ochoa and Loewe 2016).
With growing mobile Internet use, people increasingly expect surveys to be adapted for and work well on mobile devices. This has an impact on the way we design online surveys. Tourangeau, Couper, and Conrad (2013) show that the position of an item on a screen has a systematic (even if not always large) effect on responses. They argue that screen position effects may jeopardize comparisons if items have different screen positions. De Bruijne and Wijnant (2013) found no significant differences in answer distributions in a regular PC layout and a mobile web layout using responsive design (where software detects the respondent’s browser type based on the automatically logged user agent string as soon as a respondent accesses the survey). Toepoel and Funke (2018) found lower item non-response for desktop PC than mobile devices. In their study, respondents evaluated the survey more negatively on smartphones than on other devices. With small screen sizes on mobile phones, and the fact that visibility is a powerful indicator for response endorsements (Couper et al. 2004), there is a need to study the functionality of different realizations of answer formats or their length across devices in order to find out which particular format is desirable in an era of multi-device completion.
Number of Scale Points
It is common practice to use a scale length of between five and eleven scale points for Likert-type rating scales (De Beuckelaer, Toonen and Davidov 2013). 11-point scales may be beneficial because they allow a higher level of precision, but they also put a high cognitive burden on respondents. This can result in higher levels of measurement error. De Beuckelaer et al. (2013) demonstrate that an 11-point scale is beneficial in that the analytical operations to be performed result in more consistent scoring (i.e., higher reliability). However, their results also indicate that a seven-point scale is a reasonable alternative. A further reduction to five-point scales was troublesome and produced a relatively high level of inconsistency in answer scores. Choudhury and Bhattacharjee (2014) noted an increase in reliability with a larger number of scale points although such increments were found to be insignificant. These authors conclude that a 5-point scale may be easier to implement and consequently preferable. However, 5-point scales elicited higher non-response rates than longer answer scales and 11 points gained more positive evaluation of the questionnaire in a mixed-device context (Toepoel and Funke 2018). Preston and Colman (2000) conclude that response scales with seven or more points perform better on indices of reliability, validity, and discriminating power. The test-retest reliability of scales with more than ten response categories tended to decrease while respondent preferences were highest for 10-point scales, closely followed by 7- and 9-point scales. 7-point scales seem to be an optimal solution as far as the number of scale points is concerned. Preston and Colman (2000) argue that the superiority of scales with around seven response categories is in line with Miller’s (1956) theoretical analysis of human information-processing. The preference for 7-point scales is confirmed in a literature review by Maitland (2009). In addition, a review by Krosnick and Fabrigar (1997) found a curvilinear pattern in which scales of 5 to 7 points were more reliable than scales with either fewer than 5 or more than 7 points.
It is possible to make an almost unlimited increase in the number of scale points for web surveys. For example, every pixel could potentially be a response option. Relatively little is known about how these continuous scales (VAS) perform in terms of reliability.
Visibility is affected by the number of scale points. Couper et al. (2004) show that options that are initially visible (in a dropdown list) are endorsed more often than response options that are not initially visible. The visibility of answer options is influenced by the size of the screen and personal settings. De Bruijne and Wijnant (2014) demonstrate that the visibility of answer options differed significantly on mobile phones: an entire 5-point scale was visible on mobile phones for 99 percent of respondents, while an 11-point scale was only visible for 59 percent of respondents.
Response Formats
Apart from scale points, response formats may interact with the device being used. Survey software vendors are already trying to adapt to more mobile survey completion by applying relatively large buttons (tiles) that are preferable in a touchscreen layout as they are easier to pinpoint than small Radio Buttons. In addition, bars (slider scales or VAS) might become more popular response formats because they require less space on a screen than Radio Buttons. The choice for a particular format is often based on the designer’s preferences, with little consideration given to measurement error. However, it is a well-known fact that response formats affect respondents’ answers (Smith 1995; Jenkins and Dillman 1995; Couper et al. 2004; Toepoel and Dillman 2011; Toepoel, Das, and Van Soest 2009). In the following, we provide descriptions of response formats relevant to online and mixed-device surveys, according to Toepoel and Funke (2018: 114-115).
Radio buttons (see Appendix A, Figure 1) are round circles which a respondent clicks to provide an answer. Radio buttons use standard HTML and work with every browser. They are a low-tech response format and all respondents know how to use them. A problem with Radio Buttons is that they are not very efficient in the use of space on a screen because they are not scalable.
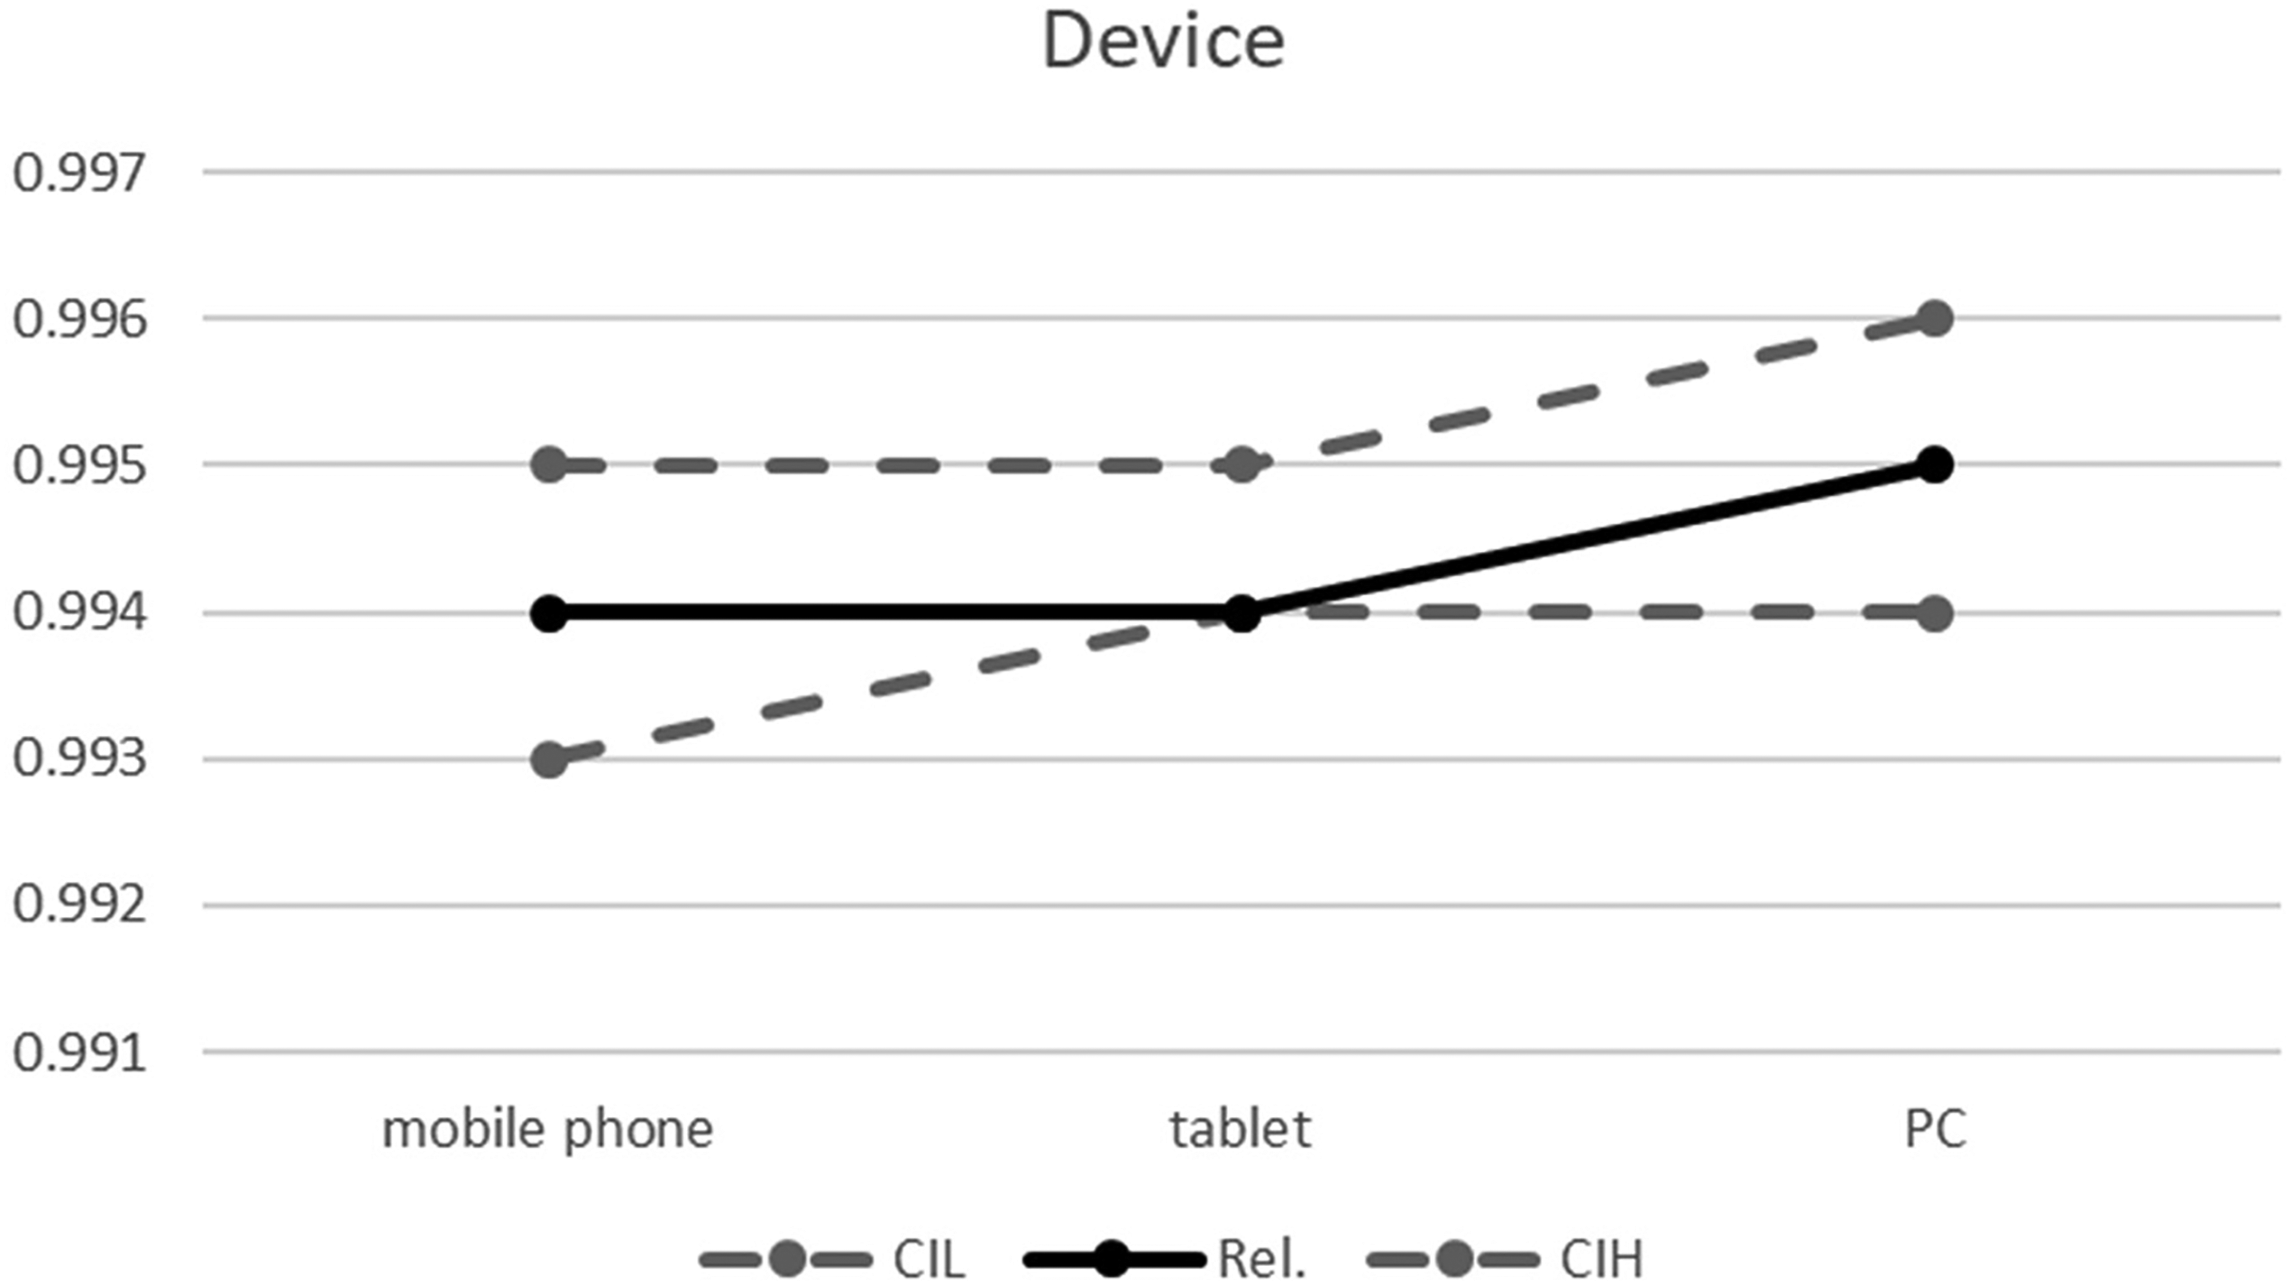
Reliability coefficients by device. Note. Rel.: Composite Reliability; CIL and CIH: lower and higher borders of the 95% Confidence Interval.
Tiles or Big Buttons (see Appendix A, Figure 5), in which entire cells can be clicked, instead of a small circle in traditional Radio Buttons, are becoming more and more apparent in surveys because they are easier to handle on touch screen devices with small screen sizes.
Slider scales (see Appendix A, Figure 2) consist of a line. Sliders work on a drag-and-drop principle: respondents drag a “handle”, such as the circle on the left hand side of Figure 2 (Appendix A), to the desired answer point on the line. Slider scales suffer from the problem of the handle’s starting position. Funke, Reips, and Thomas (2011) have demonstrated that the initial position of the slider leads to a different distribution of answer scores in comparison to Radio Buttons. Sliders can be realized with HTML5 or client-side technology like JavaScript and are efficient in the use of space (see VAS).
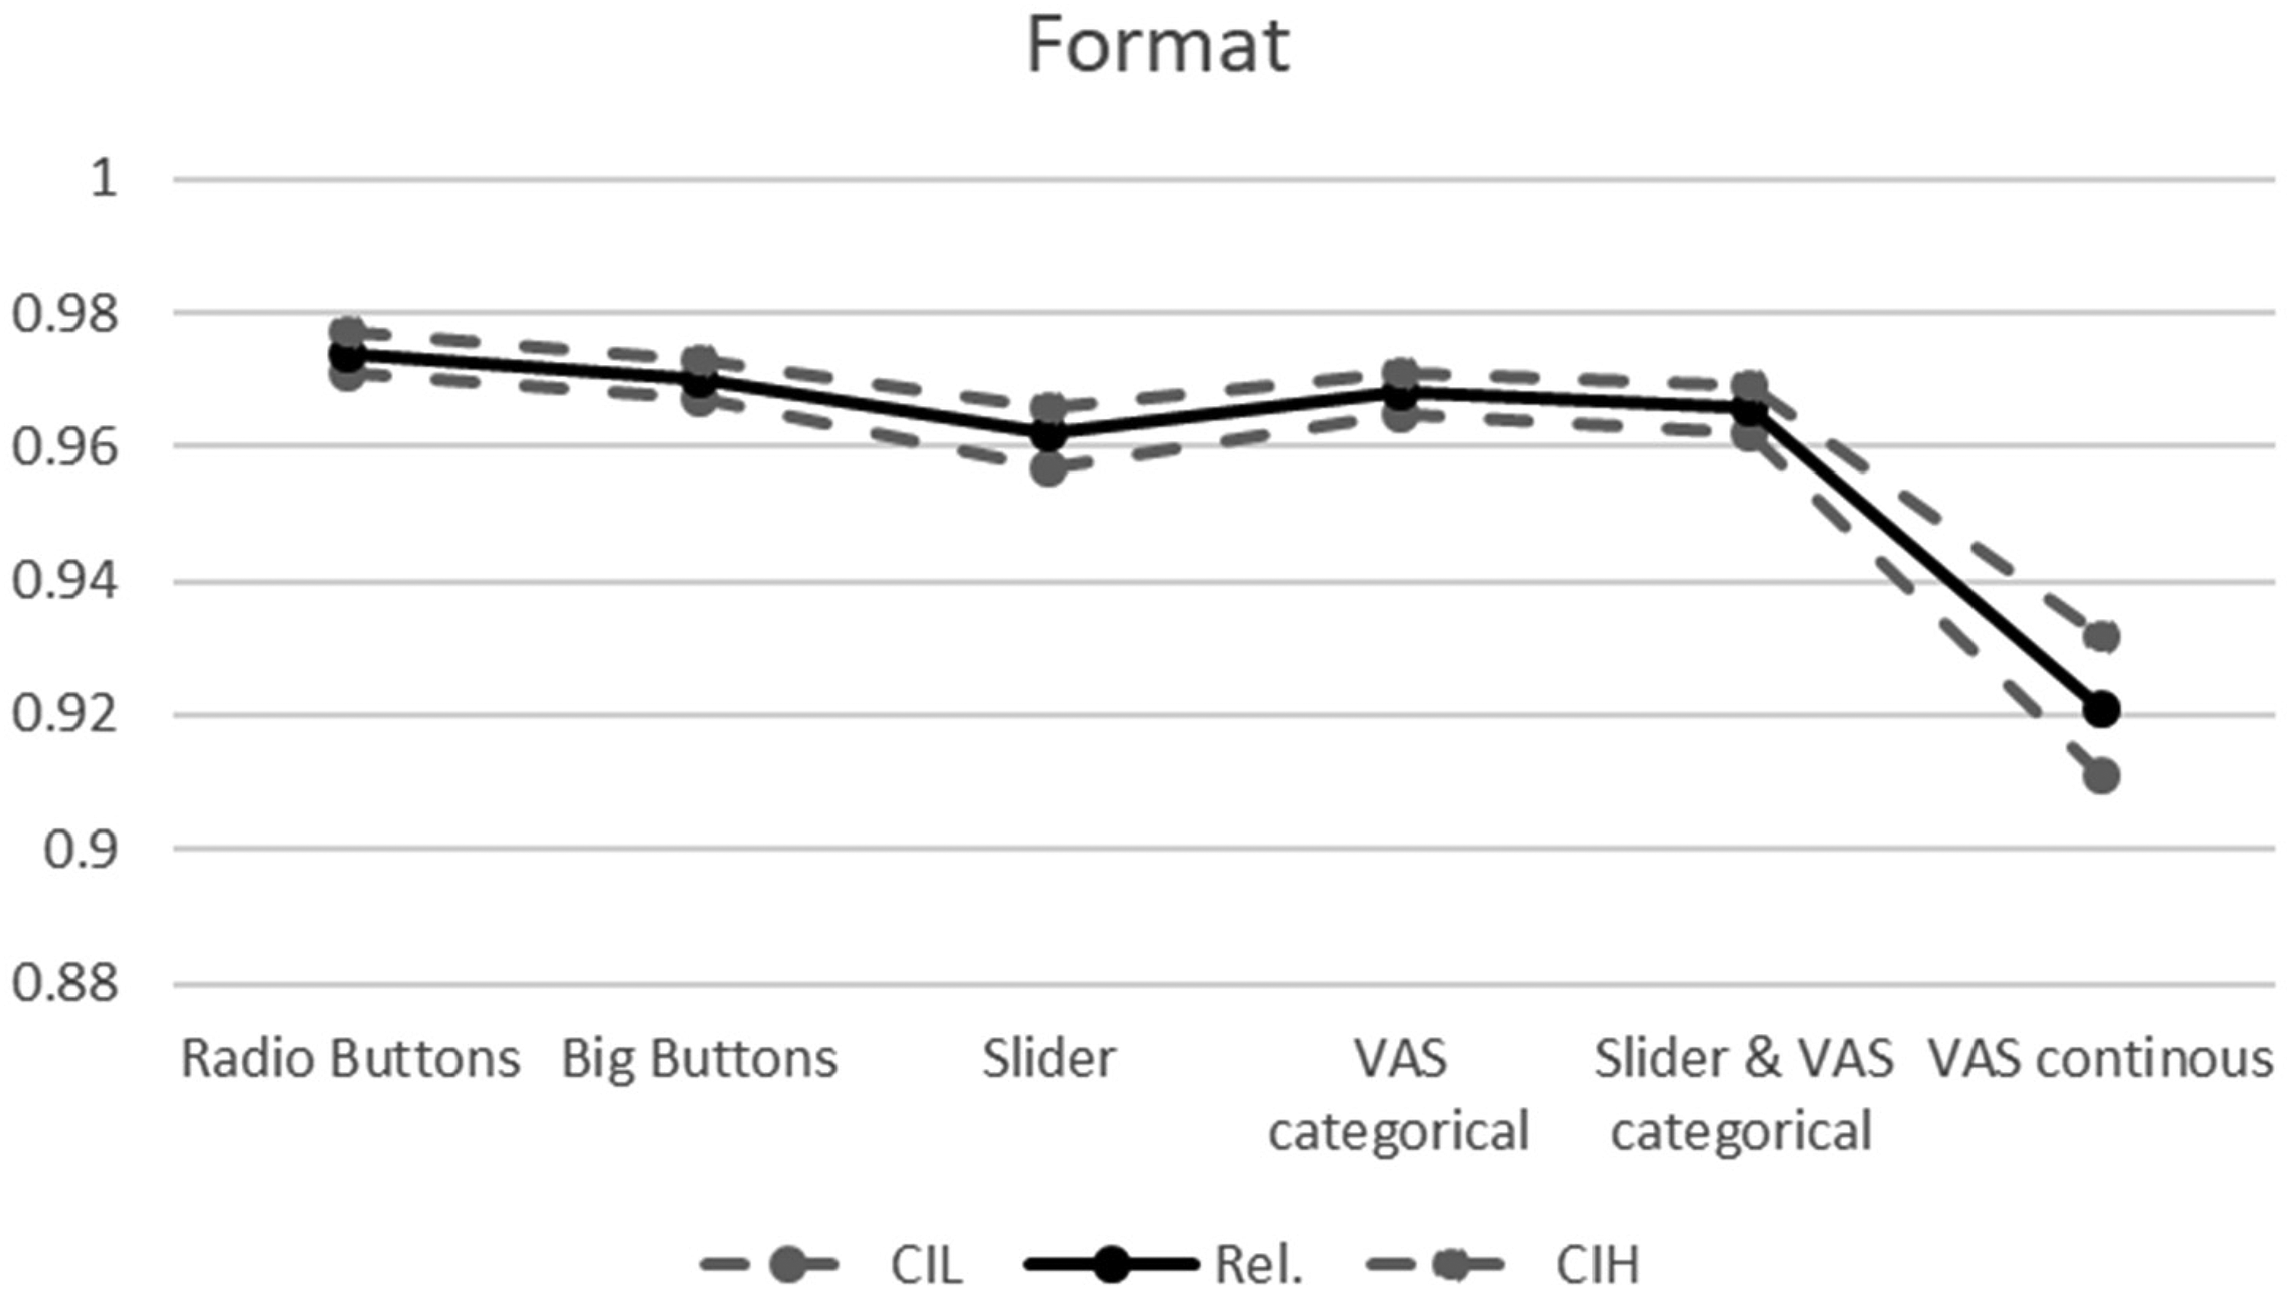
Reliability coefficients by format. Note. Rel.: Composite Reliability; CIL and CIH: lower and higher borders of the 95% Confidence Interval.
VASs (see Appendix A, Figure 3) are similar to sliders in that they also consist of a plain, mostly horizontal line but, unlike sliders, they do not use a handle. Respondents give a rating by placing a click on the line. VASs are very efficient in the use of space. A VAS with about 50 response options can take about the same space as a 3-point scale made from Radio Buttons (Funke 2016). VAS can be operationalized as a continuous (a pixel serves as a possible rating) or as a discrete n-point scale. VASs require client-side technology (e.g. JavaScript) and hence are more high-tech than Radio Buttons.
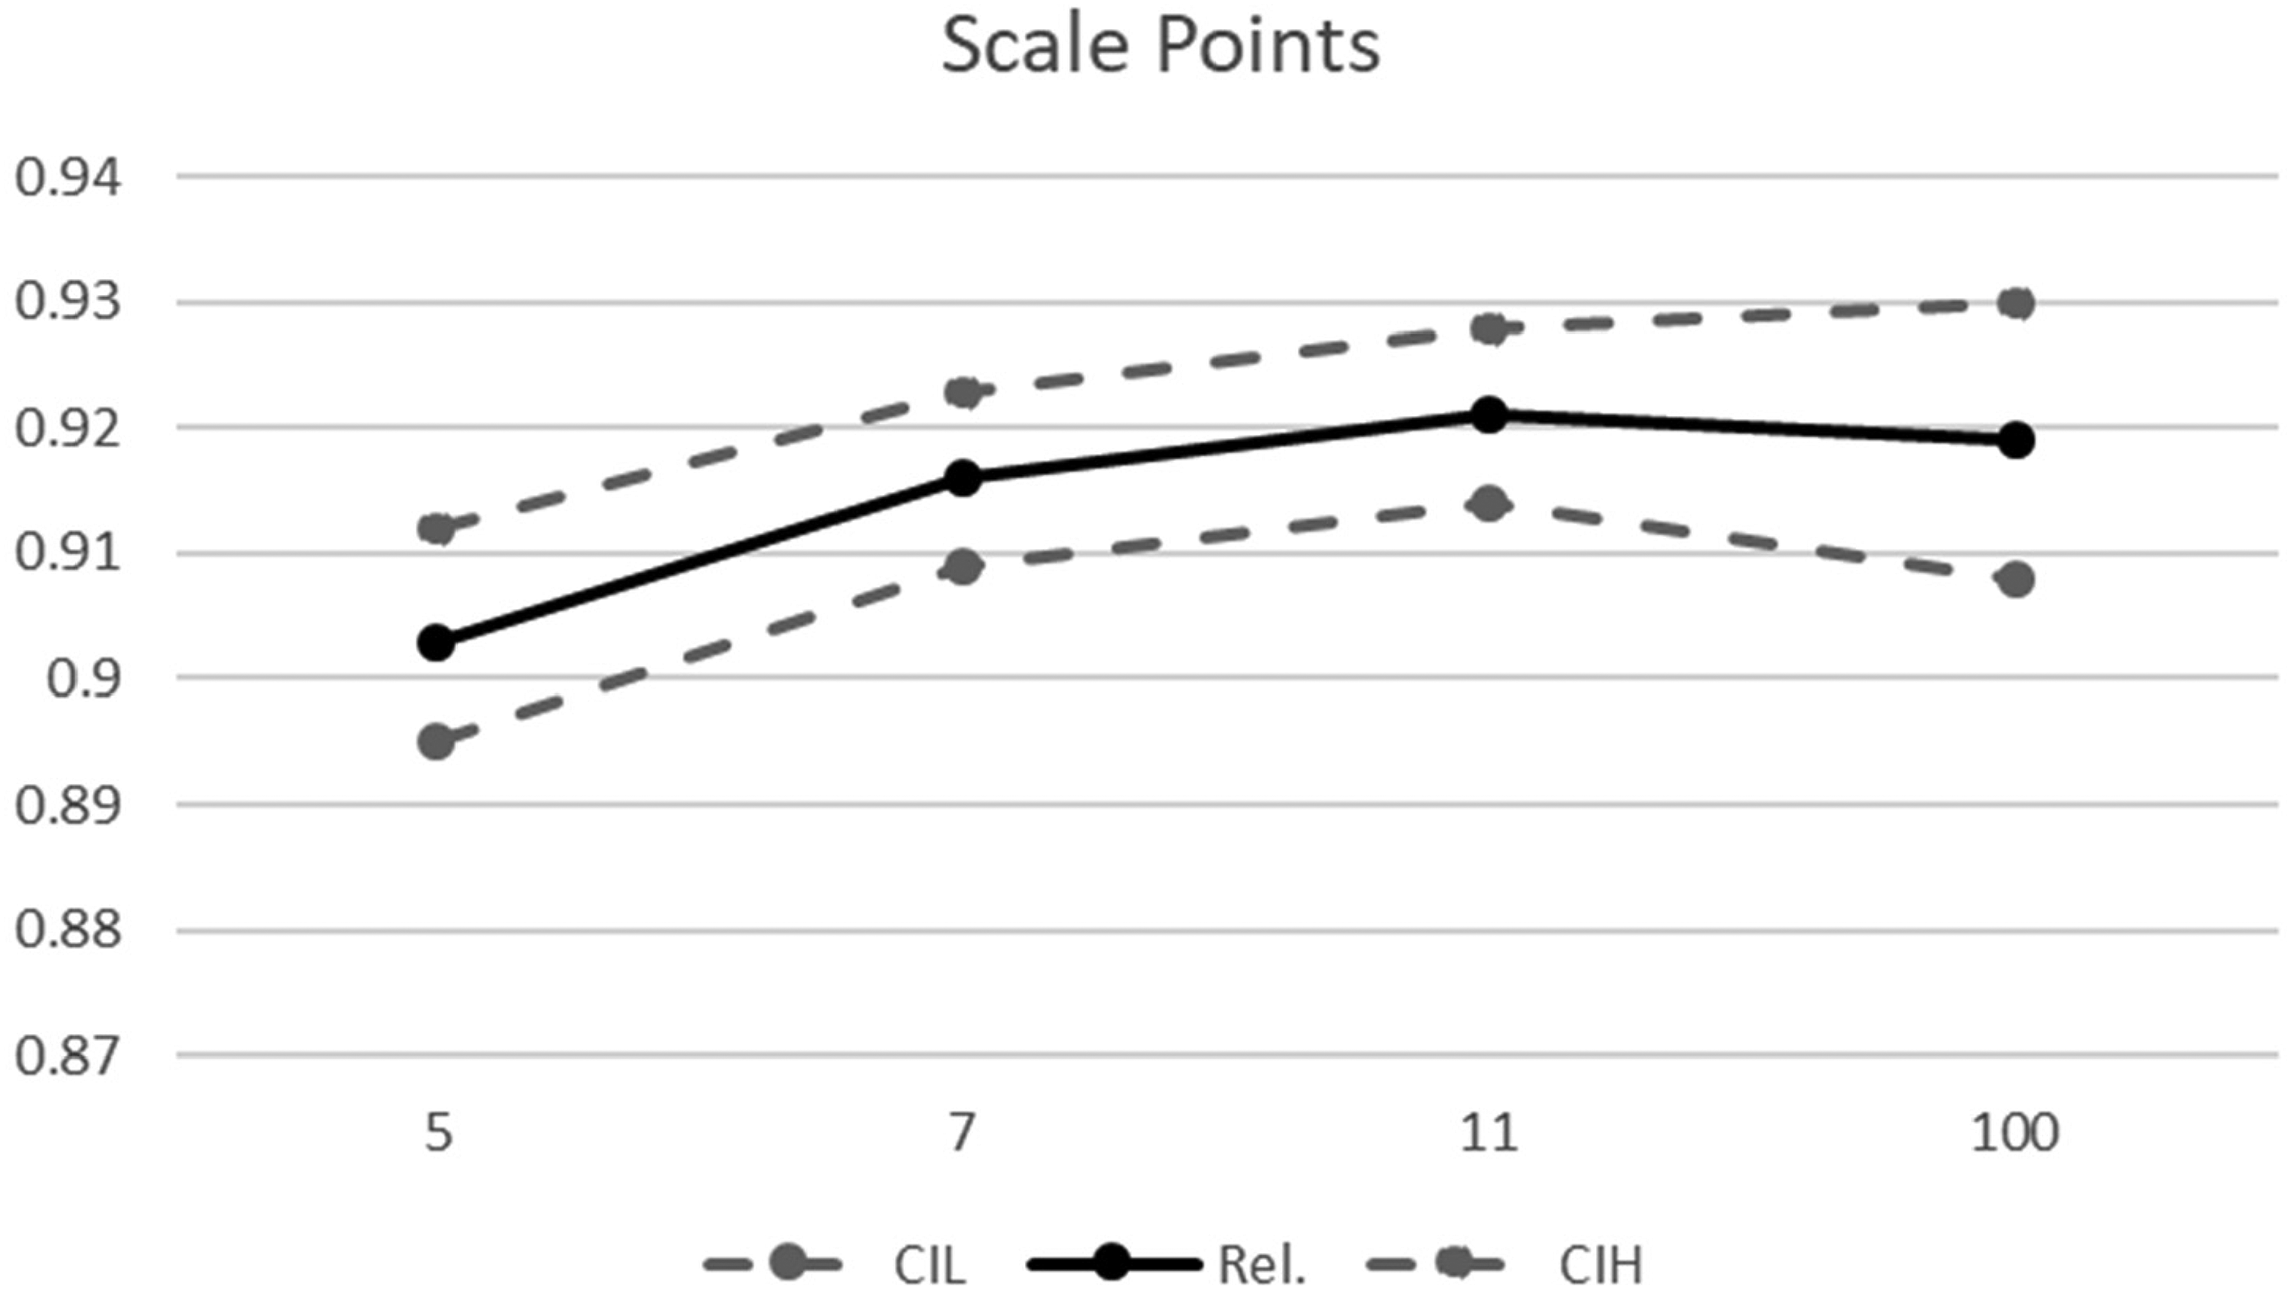
Reliability coefficients by scale points. Note. Rel.: Composite Reliability; CIL and CIH: lower and higher borders of the 95% Confidence Interval.
Bars, implemented as either slider bars that apply the drag-and-drop principle or categorical VAS with a point-and-click mechanism, save space on the screen and may for this reason be preferred to Radio Buttons on mobile devices.
Slider scales can have negative effects on data quality, such as response rate, sample composition, distribution of values, item non-response and response times, as compared to VAS and Radio Buttons (Funke 2016; Toepoel and Funke 2018). The similarity of VAS and Radio Buttons is confirmed in different studies (Funke and Reips 2012; Funke 2016). Further studies are needed to test the differences in response formats between online devices in experimental settings to advance our understanding of why and when differences between online devices in response formats are likely to occur.
The comparability of data between different devices, formats or modes can be assessed by two main methods (Hox et al. 2015): i) comparison of distributions or means and ii) evaluation of the comparability of variance, covariance and mean structures. The second evaluation has been referred to as measurement invariance analysis (Jöreskog 1971; Meredith 1993). Scheuch (1993) refers to it as “functional equivalence”, by which is meant not only comparability of question wording or visual design, but in particular comparable suitability of data for the analysis of interest. Measurement invariance analysis, however, is only applicable to multi-item measures (scalar questions) that have a known one-dimensional or multi-dimensional factor structure. This means that indicators (single items or questions; manifest variables) represent either a single concept (unidimensional case) or a number of related sub-concepts (multidimensional case). The concepts are referred to as latent variables. Using the language of factor analysis, on which the analysis of measurement invariance is based, the items have to represent one factor or multi-factorial structure for a concept. The relationship between an indicator and latent variable can be either linear or non-linear. Assuming a linear case (that is of relevance for our study), this relationship is mainly described by two metrics: the intercept and the slope of the linear function. The latter is referred to as factor loading of an indicator on the latent factor.
Measurement invariance analysis is typically conducted by a sequence of subsequent steps within the frame of Multi-Group Confirmatory Factor Analysis (MGCFA). The following increasing degrees of measurement invariance are differentiated, with each subsequent one including the preceding, as introduced by Meredith (1993; see also Kline 2016; Mayerl 2016).
The first step is to evaluate configural invariance. Configural invariance occurs when the same latent factor structure underlies a given set of manifest variables in each group. Establishing configural invariance, however, does not allow for statistical comparisons of latent variables using structural equation modeling (SEM) or simple sum scores. The second step is to evaluate metric or weak invariance, which implies that the covariances between the manifest and latent variables are comparable among the groups. Metric invariance is evaluated by restricting corresponding factor loadings between the groups to be equal in the configural model. Equality of factor loadings is proven if the introduced restriction does not significantly decrease model fit. If factor loadings are found to be equal between the groups, metric invariance is given. Establishing metric invariance allows for comparison of correlations between the groups (those of latent variables using SEM or simple sum scores). The final step is to test for scalar or strong invariance, which means that the manifest variables have comparable metrics among groups and are tapping comparable parts of the latent means. Scalar invariance is evaluated by restricting the intercepts of the manifest variables to make them equal between the groups. Again, this restriction should not significantly decrease model fit to assume the model to be scalar invariant. Establishing scalar invariance allows for comparisons of either latent mean scores or those of summarized scores. If the scalar invariance is evident in the data, latent means or summarized mean scores can be compared between the groups.
Hox et al. (2015) stress how powerful the testing of measurement invariance is, compared with simple inspections of distributions or means. The analysis of measurement invariance allows for the disentangling of the non-systematic and systematic measurement error associated with group membership (i.e. participation using a certain device, a special format or a certain number of scale points). If configural, metric, or scalar invariance is not given, the implications are severe as this shows that respondents understand questions or response options differently depending on the modes, devices etc. that they use. Consequently, non-systematic measurement error is evident and a given set of indicators cannot be assumed to measure a concept in a comparable manner in each of the groups. If scalar invariance is established, latent means or summarized mean scores (step iv) can be compared. In the case of a randomized experiment, however, the difference of latent means demonstrates an effect of experimental manipulation on the measurement, which is associated with a systematic measurement error. For the comparison of modes, Hox et al. (2015:3) stipulate: “This fourth step tests if the latent mean or sum scores in different modes are equal. If not, we may have measurement equivalence, but the different modes still result in a response shift, with some modes reporting higher scores than other modes. This response shift points toward either a systematic bias in one of the modes or different systematic biases across modes.”
Hox et al. (2015) provide an overview of past research that evaluates mode effects when using measurement invariance tests. Considering their results as well, previous research provides a mixed picture, as some researchers have found scalar invariance for modes with and without the interviewer (e.g., Revilla 2013; Heerwegh and Loosveldt 2011), but others did not (Hox et al. 2015; De Leeuw 1992; Klausch, Hox and Schouten 2013). In one study, scalar measurement invariance between self-administered modes, that is mail and web surveys, could be supported (Klausch et al. 2013). While some research is cited in which measurement invariance across different modes is evaluated, the authors are not aware of such research for different devices. Rather, for mixed-device surveys, response behavior and potential mean differences have been addressed. Toepoel and Funkte (2018) found mean differences among different rating scale formats when different devices were used. However, mean differences can only be interpreted as a bias if there has been measurement invariance among the investigated groups, which we will address in the present study.
With regard to the effects of rating scales Menold and Tausch (2016) and Menold and Kemper (2015) compared rating scales that use five and seven categories with different degrees of verbalization using multi-item sets for different concepts (opinions on the European Union, studying effort, affectivity). They employed either university students’ samples and paper-and-pencil mode (Menold and Tausch 2016) or heterogeneous quota samples of adults and web surveys (Menold and Kemper 2015). The generalizable finding was that there was no metric and scalar measurement invariance between different rating scale realizations. Variation in points of rating scales might therefore be a crucial factor that negatively impacts comparability in mixed-device surveys.
Reliability
Besides the comparability of devices when using different formats and numbers of scale points, measurement quality is also an issue. Previous research on survey and questionnaire design has mainly focused on response sets, such as acquiescent, middle or extreme responding, item-non response or on differences in means and distributions (e.g. Toepoel and Funke 2018, see also the research overview by Schaeffer and Dykema 2011). However, analysis of reliability and validity allows more direct metrics of measurement quality than rather indirect evaluations of response sets or distributions. In general, when looking at the research on mode effects and other features of questionnaire design, little is known about how these factors affect the reliability or validity of measurements (Schaeffer and Dykema 2011:912).
In the present study, we focus on reliability scores, as reliability is a prerequisite for valid measures. Reliability means that the variation of data is mainly due to the true variation, and not to non-systematic measurement error (e.g., Raykov and Marcoulides 2011; Rammstedt et al. 2015; Groves et al. 2009). Non-reliable measures make the true relationships between concepts or changes in values difficult to identify, e.g., as a result of interventions.
As the research on mixed-devices is still largely in its infancy, the authors are not aware of studies that compare reliability metrics among different devices. Little is known about the effects of different formats either.
The relationship between the number of scale points and reliability has been an issue for many decades, however (see section 2.2). In general, the research can be divided into i) experimental studies with between-subject-design (for overviews see Krosnick and Fabrigar 1997; Maitland 2009) and ii) nonrandomized quasi-experimental studies (Alwin 2007; Saris and Gallhofer 2007; Churchill and Peter 1984). The implications of these different lines of research differ. Whereas the first show that five to seven categories are associated with the highest level of reliability, the results of the latter are mixed and suggest that there is no relationship between number of categories and reliability (Churchill and Peter 1984), maximum reliability for four (Alwin 2007), seven to nine (Alwin and Krosnick 1991) or eleven categories (Saris and Gallhofer 2007). Cronbach’s Alpha (Cronbach 1951) has been the preferred method for analyzing reliability (cf., Menold and Tausch 2016). Composite reliability is superior to Cronbach’s Alpha in survey setting, because the latter requires indicators with equal loadings on the latent variable and an absence of correlated error terms (see, e.g., Raykov and Marcouldes 2011). Although testable in terms of Confirmatory Factor Analysis (CFA), these prerequisites were not evaluated in previous studies that used Cronbach’s Alpha. The method of Composite Reliability, within the frame of LVM, is based on the sole assumption that manifest variables represent one latent variable and relaxes other requirements for the data. It is also possible to assess a single reliability metric while taking account of multi-factor structure (so called general structure, Raykov 2012). Composite Reliability can also be compared between groups and differences can be tested for significance by means of MGCFA (Menold and Raykov 2016). Menold and colleagues (Menold 2020; Menold and Kemper 2015; Menold and Tausch 2016) compared five and seven point scales with respect to Composite Reliability (e.g., Raykov and Marcoulides 2011). Hence, they emphasized the verbalization of rating scales, in particular, which is not the focus of this paper.
Our analyses investigate the effects of device, scale points and formats on reliability and assess these by applying the Composite Reliability method.
Method
Data were collected in the GfK Online Panel on the Dutch population with regards to age (15 +), gender and education. This panel is ISO certified. The panel is a nonprobability online access panel and recruitment is multi-sourced. Panel members that own a PC, and or tablet, or mobile phone were used as a sampling frame for our study.
The experiment was not pre-registered. The questionnaire consisted of three blocks of questions: three questions about attitudes towards surveys, 16 items about vacation experiences that served as our test items, and seven questionnaire evaluation questions. The 16 vacation items varied in the number of scale points and response format. The 16 items are intended to measure four sub-factors according to Pine and Gillmore’s (2011) book on the Experience Economy. These items are designed to measure the four realms of a vacation experience, which can be sorted into four broad categories: (i) entertaining quality of vacation experience, including having fun and positive emotions from vacation activities; (ii) educational effect of vacation including new experiences and learning new matters; (iii) escapist quality, meaning escaping and recuperating from everyday routines, and (iv) aesthetic quality, meaning enjoying beauty or other similar experiences. The questionnaire took about five minutes to complete (see Appendix B for information on items and their wording).
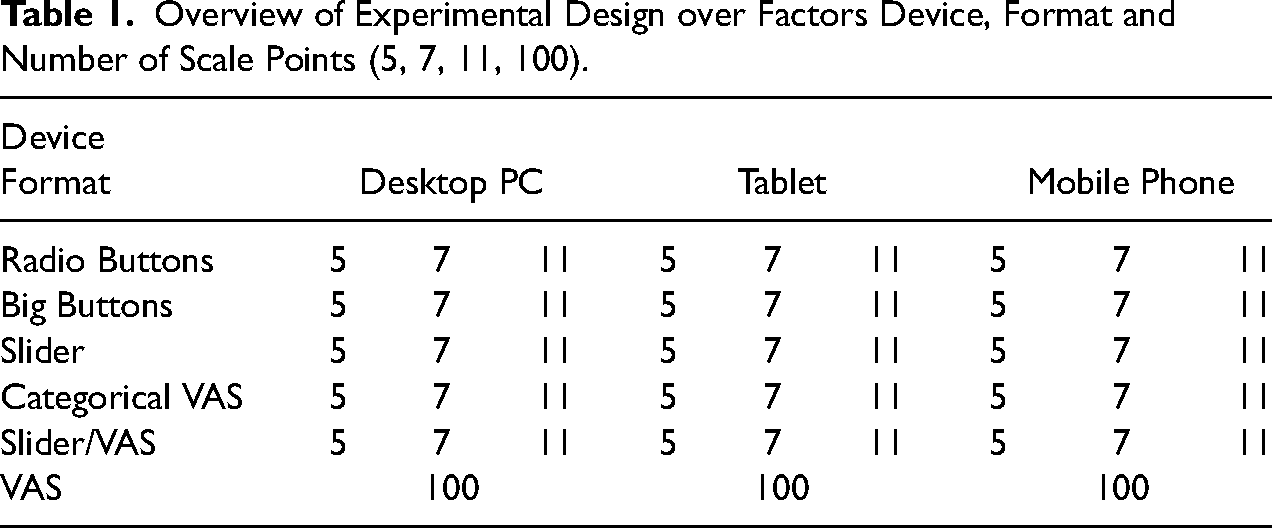
We used a three-factor design with factors Device, Format and Number of Scale Points in which we randomly assigned respondents to the following conditions (Table 1):
Desktop PC vs. tablet vs. mobile phone (Factor Device) Radio Buttons vs. Big Buttons vs. Slider vs. categorical VAS vs. a combination of Slider/VAS vs. continuous VAS (Factor Formats) 5- vs. 7- vs. 11- vs. 100 (continuous VAS) point scale (Factor Scale Points)
Overview of Experimental Design over Factors Device, Format and Number of Scale Points (5, 7, 11, 100).
Overview of Experimental Design over Factors Device, Format and Number of Scale Points (5, 7, 11, 100).
Every format was made identical (e.g., length, color) except for functionality (e.g., point-and-click vs. drag-and-drop) and answer type (e.g., bar vs. buttons); see Appendix A. This was done in order to avoid the problem of confounding scale length and the number of scale points. In order to be able to differentiate between nonresponse and responses of a substantial response category the initial place of the handle in the slider scales was placed outside the line with valid ratings, to the left (see Appendix A, Figure 2). In the combination Slider/categorical VAS condition, respondents can use both the drag-and-drop and point-and-click operation. The continuous VAS with 100 points was used to compare it with other formats and with shorter rating scales.
We used a horizontal orientation of rating scales, as response order effects may occur with vertical orientation in web surveys as well (Hu 2020; Toepoel, Das and van Soest 2009). Although verbal over numerical labels have been recommended (e.g., Krosnick and Fabrigar 1997; Menold 2020), their use is restricted by the number of scale points. It is difficult to find an appropriate verbalization for 11 points and not possible to use full verbalization for continuous VAS with 100 scale points. To avoid confounding the number of scale points and verbalization, we implemented all rating scales with numerical labels.
Fieldwork was done on April 8–16, 2014. The response percentage was 30%. Nonresponse was 34%. After the first invitation on April 8, 99.7% of respondents responded, who were assigned to the desktop PC-group, while of the assignments to the mobile phone and tablet 29% and 50% responded respectively. We therefore sent an additional invitation on April 11 for tablet and mobile respondents. We used a quota for the number of respondents on each device; 32% stopped due to quota fulfillment. The dropout rate was 4%. The total number of responses was 1,709 on desktop |PC, 1,702 on tablet, and 1,666 on mobile, with a total of 5,077 responses.
48% of participants were men and 52% women; the mean age was 46 years (SD = 16 years); 28% had higher education, 31% had lower education. The use of quotas to make random assignment to the devices meant that a target person could participate if he/she owned at least the required device. According to the self-reports in our sample, 58% of respondents possessed all three devices and 33% of respondents had access to two devices (11% PC and mobile phone; 9% PC and tablet; 13% tablet and mobile phone). 6% had only a PC and 3.4% one of the mobile devices. We also evaluated respondents’ experience in the use of a device for the surveys. 83% reported having considerable experience in using desktop PC, 50% had experience using tablets and 29% using smartphones.
In terms of browser, Safari was used by the majority of respondents who participated with mobile devices (mobile: 74%, tablet 89%). Desktop PC users used Chrome (34.4%), Mozilla or Netscape (31.3%), or Firefox (15%). Desktop PC participants primarily used Windows (92.3%). iPhones were used by 42% in the mobile phone group and by 72% in the tablet group. Nokia was also used among mobile devices (cell phones: 58%, tablets: 28%).
There were significant differences between three devices with respect to gender (χ2 (2,5077) = 45.17, p < .001), age (F(2, 5074) = 235.44, p < .001), education (χ2 (4,5077) = 102.68, p < .001), device ownership (χ2 (12,5077) = 1227.54, p < .001), and experience in the use of each of the devices for participation in surveys (Cramer’s-V between .14 and .31, p < .001). 58% of those in the tablet group, 52% of those in the mobile phone and 47% of those in the desktop PC group were women. There were fewer people who had not had higher education in the smartphone (22%) than in the tablet (32%) and desktop PC (37%) groups. The respondents in the smartphone group were younger (M = 39; SD = 14) than in the tablet (M = 50, SD = 14) and desktop/PC groups (M = 49; SD = 17). In the mobile phone group, 70% of respondents assessed all three devices, whereas in the tablet group 63% and in the desktop/PC group 41% had access to both other devices. Respondents who participated using a device tended to have experience in the use of the corresponding device for surveys (desktop PC: 98%; tablet: 91% mobile phone: 69%).
As two other experimental factors - format and number of rating scale points - are considered, there were no significant differences in sample composition with respect to gender, age, education, device ownership and device experience between the different formats and scale points groups (p > .08).
MGCFAs to evaluate Measurement Invariance and Composite Reliability were conducted with the software Mplus 8.2. We evaluated differences between the three devices, six formats and four groups with a different number of scale points. We then compared different formats when they were used by a device as well as different number of scale points per device. We waived the use of a full factorial comparison (device by format by scale points) as this would require the comparison of 45 groups.
The model fit of MGCFAs was evaluated using the chi-square (χ2) test, the Root-Mean-Square Error of Approximation (RMSEA), and the Comparative Fit Index (CFI) (Beauducel and Wittmann 2005). The CFI should be 0.95 or higher, while an RMSEA of 0.08 or less indicates an acceptable fit (Hu and Bentler 1999). Robust Maximum Likelihood estimator (MLR) was used due to the non-normality of data in each experimental group (Muthén and Muthén 2014). Concerning the exact measurement invariance, a significant change of chi-square (χ2) (Meredith 1993) or a change of ΔCFI ≥ .01 and ΔRMSEA ≥ .015 indicate significant differences (Chen 2007).
The analyses of measurement invariance were conducted both with and without consideration of socio-demographic variables to control for their individual effect, particularly if device effects were of interest. The socio-demographic variables gender, age, education, possession of a device and experience in the use of a device for surveys were included in the MGCFA by using MGSEM (Multi-Group Structural Equation Modeling).We modelled the regression paths of all socio-demographic variables on every manifest indicator (method suggested by Hox et al. 2015).
The Composite Reliability coefficient (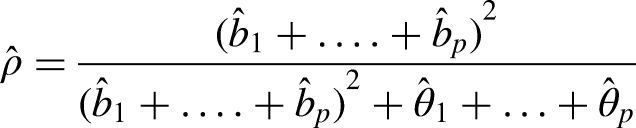
Reliability was high and ranged between .993 to .995 in different sociodemographic groups when looking at gender, age, education, possession of device and device experience. There were no significant differences in reliability across the groups of any variable. The vacation items were found to be equally reliable in all different socio-demographic groups and differences in sample composition between devices reported above can be excluded as a possible alternative explanation for the effects of the experimental manipulation of devices on reliability coefficients.
In order to cross-validate the results for topic sensitivity with respect to the potential effect of a device on Measurement Invariance and reliability, we also conducted some analyses on the items on survey evaluation (QE, see Appendix C for wording). Respondents evaluated the survey using seven items in randomly distributed different device groups. The QE-items were administered on an 11 point Radio Buttons rating scale, so that scale formats and scale points were not experimentally manipulated. Since the factorial structure for the seven QE-items was not known, we conducted a Maximum Likelihood (ML) Exploratory Factor Analysis (EFA) with an oblique (Promax) rotation using SPSS 27 on all data without differentiating between the three device groups. The EFA revealed two factors (Appendix C, Table AC-1). The first factor contained four items on the evaluation of questions and questionnaire and the second factor contained three items on respondents’ motivation. We used the ML-EFA and the oblique rotation, because an MGCFA (that had to be conducted thereafter) also uses a ML estimation and because the factors of QE-items were expected to correlate, which was in fact the case (correlations between the factors was r = .60). The two factors explained 57% of the entire variance. We compared the results obtained for the QE-items with the results of both, 11 rating scale points and 11 points Radio Buttons realizations of the vacation scale. Comparable results provide indications with respect to the stability of results for instruments on different topics.
Measurement Invariance
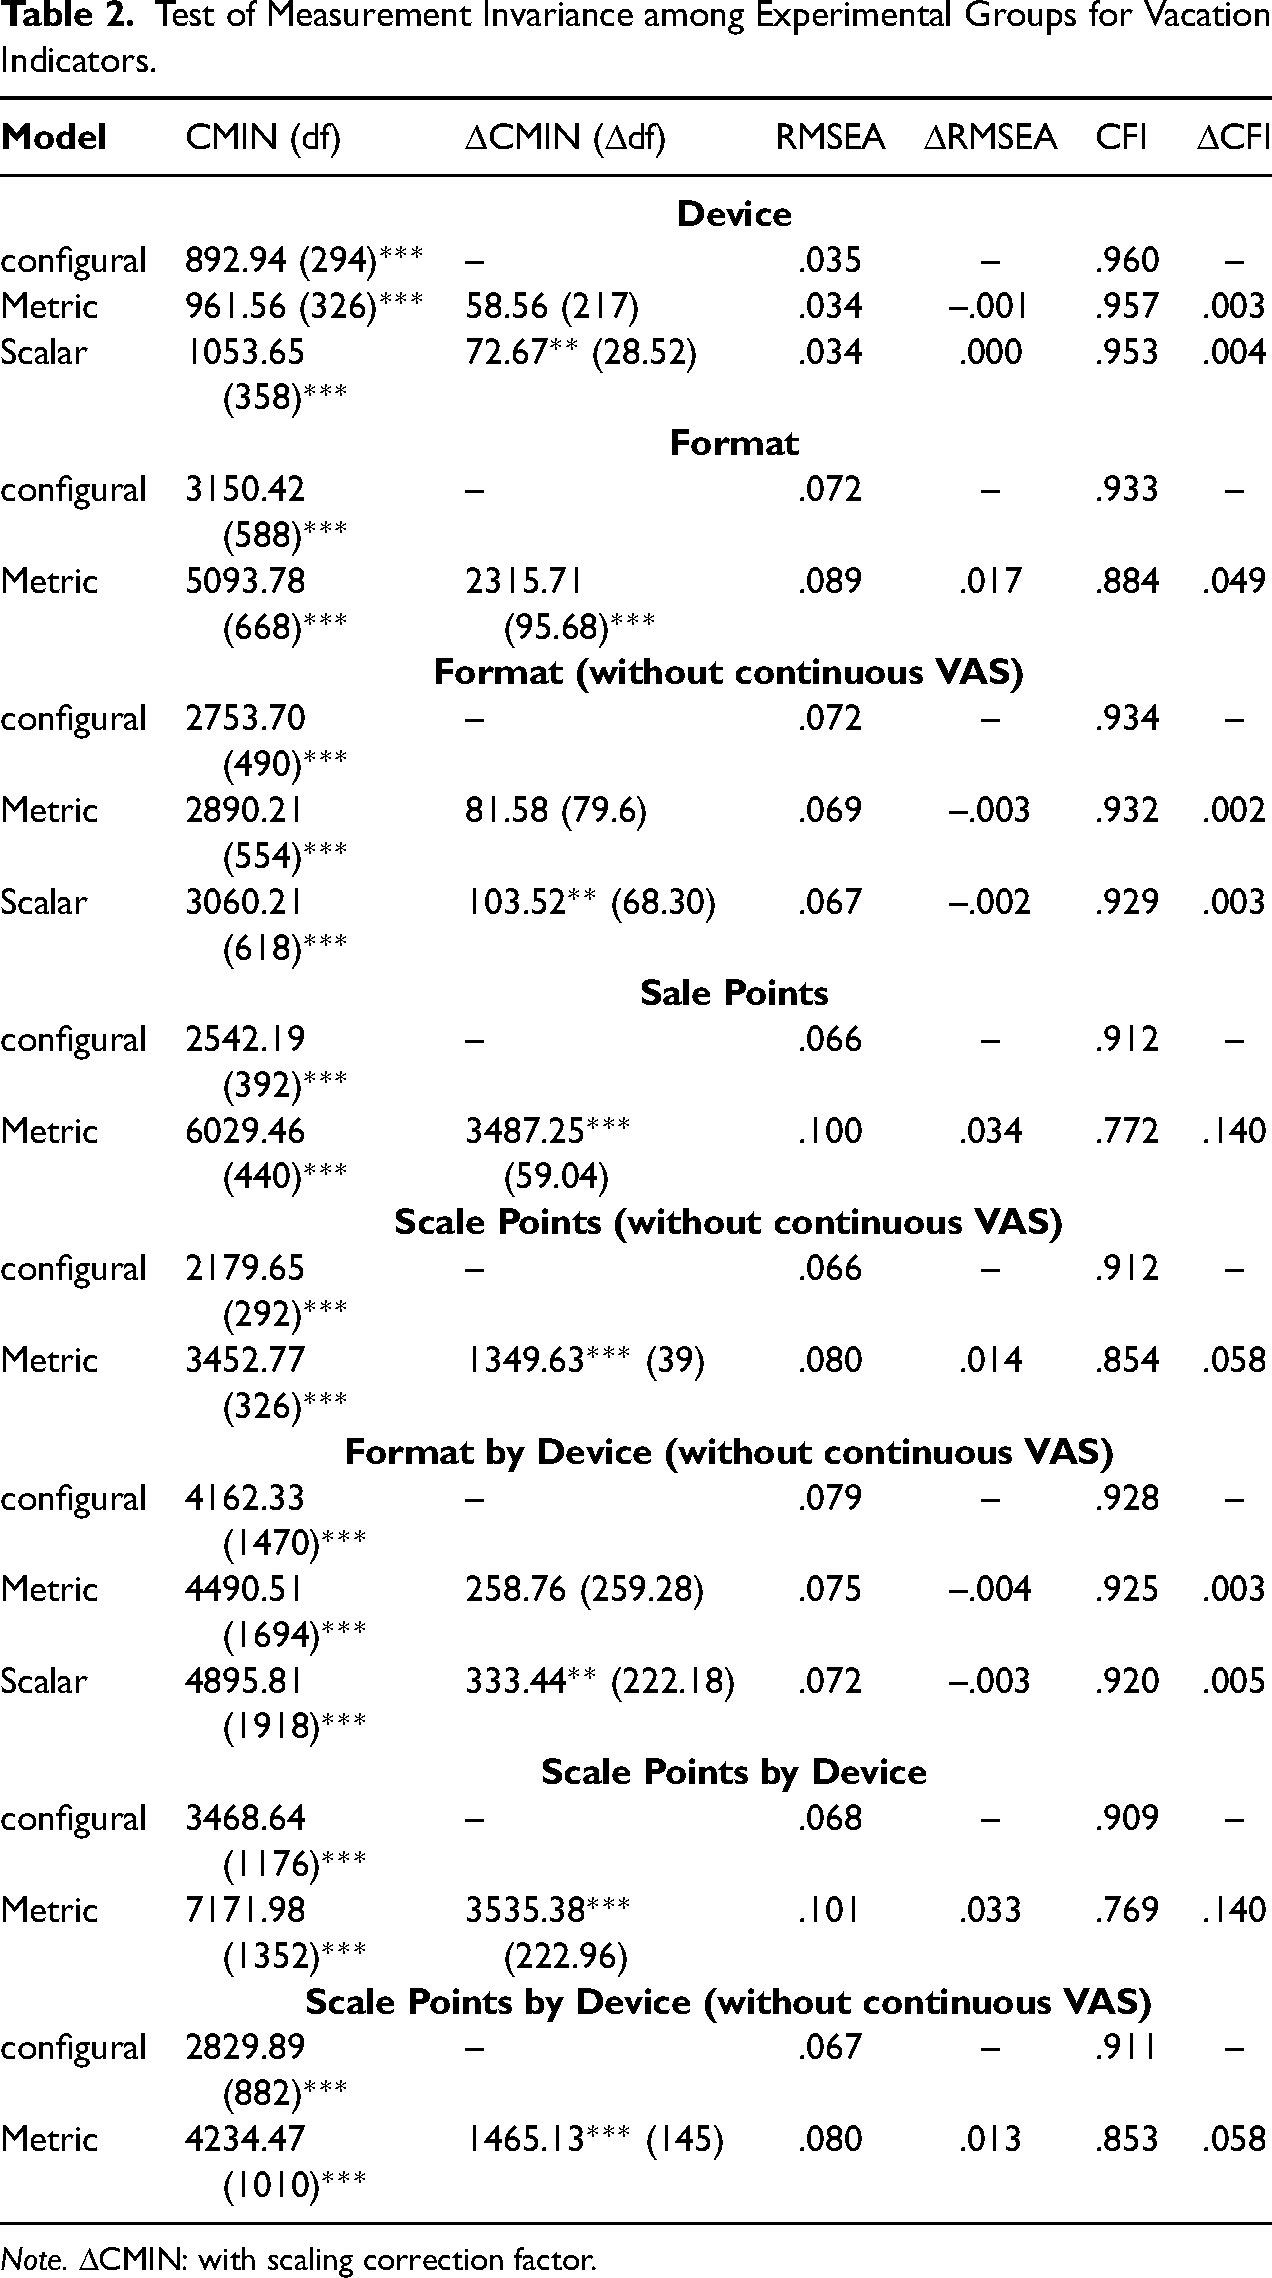
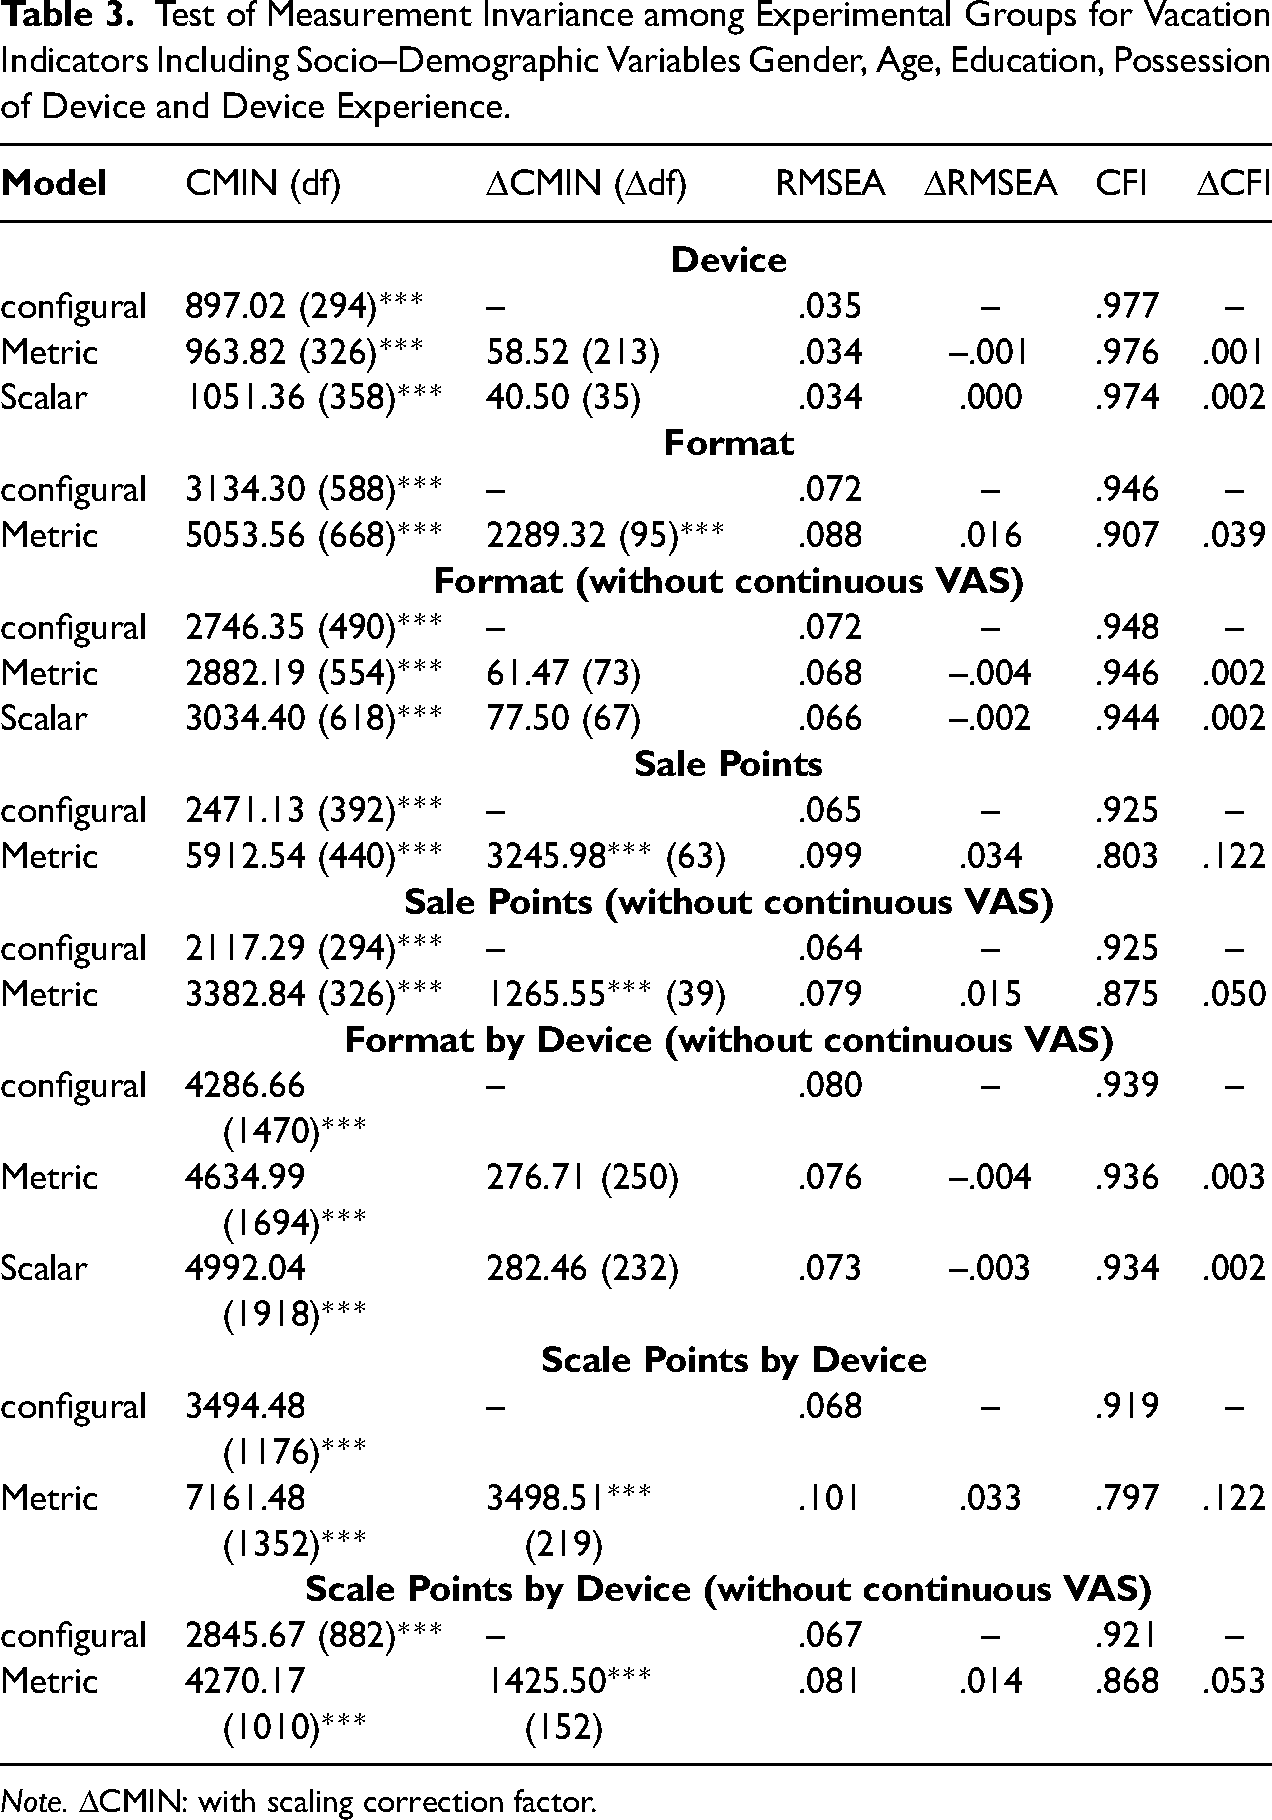
For the three devices, the four factor MGCFA for items on vacation experiences provided an acceptable model fit according to RMSEA and CFI (Table 2). The standardized factor loadings for each factor and each device were high in magnitude (range mobile phone: λ = .67 (item 10) to λ = .97; Tablet: λ = .66 (item 10) to λ = .98; PC: λ = .68 (item 10) to λ = .98). The factor correlations were very high and ranged from r = .92 to r = .97. For the information on estimated parameters in all MGCFAs, including factor loadings, intercepts, residual variances and correlations between the factors see Supplementary Material. This model is also the first, unrestricted baseline configural model for the test of measurement invariance (Table 2). Restricting factor loadings of pertinent items to be equal in each of the device groups did not significantly change the goodness of fit according to the change of chi-square, RMSEA and CFI. Metric invariance therefore applied across devices. This result also emerged for the scalar invariance, as restricting indicators’ intercepts to be equal among devices did not significantly change the goodness of fit of RMSEA and CFI, whereas there was a significant change of chi-square. If the socio-demographic variables of gender, age, education, possession of devices and device experiences are considered in the model, configural, metric and scalar invariance are supported by the results, with the latter two confirmed by the non-significant change in all goodness-of-fit statistics (Table 3). If scalar invariance is supported, latent means can be compared across groups to evaluate systematic shift of means when using one device instead of another. In both models, with and without socio-demographic variables, there were no significant differences of latent variable means across the devices (p > .10).
Test of Measurement Invariance among Experimental Groups for Vacation Indicators.
Test of Measurement Invariance among Experimental Groups for Vacation Indicators.
Note. ΔCMIN: with scaling correction factor.
Test of Measurement Invariance among Experimental Groups for Vacation Indicators Including Socio–Demographic Variables Gender, Age, Education, Possession of Device and Device Experience.
Note. ΔCMIN: with scaling correction factor.
In the model for six formats (disregarding devices), the factor loading of the item 10 decreased to the size of λ = .07/.08 (standardized) and was non-significant for Big Buttons, Slider, and combined Slider/VAS. It was significant (p < .01), but small of λ = .11 for Radio Buttons and of λ = .16 for categorical VAS. For the continuous VAS, the item 10 gained a negative loading of λ = -.35. This item negatively characterizes vacation experiences (it was quite boring there), so that either a low or a negative loading seemed to be plausible. Other standardized factor loadings were of comparably high size in all different formats and ranged from λ = .69 to λ = .95. The factor inter-correlations decreased remarkably and ranged from r = .69 to r = .94. With the continuous VAS, the correlations between the factors were even lower and ranged from r = .37 to r = .59.
With respect to Measurement Invariance among different formats, the configural invariance could be evaluated as given (Table 2), although the CFI was slightly below the benchmark. Metric invariance was violated due to a significant change in RMSEA and also due to significant and remarkable change in chi-square and CFI. (As metric invariance is a prerequisite for scalar invariance, the test results for the latter are not presented if the first is violated.) This result is also supported, if the effect of socio demographic variables is held constant during the analysis (Table 3). However, continuous VAS made the highest contribution to a large chi-square, which suggests that it was less comparable with other formats. There were also estimation problems in all metric models when the continuous VAS was included. If the continuous VAS was excluded from the analysis, the remaining five formats showed configural and metric invariance. Scalar invariance was given due to the non-significant change of CFI and RMSEA, but the change of chi-square was significant again (Table 2). If socio-demographic effects were held constant, full configural, metric and scalar invariance emerged between the formats if the continuous VAS was excluded from the analysis (Table 3). Therefore, with the exception of the continuous VAS, measurements were not only comparable between devices, but also between different formats. However, the latent means of the factors 1, 2 and 4 were significantly lower in the case of Sliders than for other formats (p < .05 and p < .01). Similarly, for the combined Sliders/VAS the mean of the first factor was lower than with other formats (p < .05). Comparing latent means on the basis of the MGSEM with socio-demographic variables did not reveal any latent mean differences among different format groups, showing that potential shift of the means is due to different use of these formats by different groups of respondents. This can be concluded because formats did not differ from each other with respect to socio-demographic sample composition. The results show that continuous VAS was not comparable to other formats due to the differences in measurement error as well as Sliders and Combined Slider/VAS may be associated with a systematic bias (latent mean shift).
For the scale points, the item 10 gained negative loadings and a magnitude of approx. λ = -.40 in all rating scale groups, while remaining positive loadings ranged between λ = .54 and λ = .92. The factor inter-correlations decreased (ranged from r = .32 to r = .61) as compared with the MGCFA models for the effect of a device. The configural invariance of scale points (again regardless of the device used) can be questioned due to little CFI (Table 2). If configural invariance is nevertheless assumed, restricting factor loadings to be equal significantly decreased goodness of fit referring to a significant increase of chi-square and RMSEA and significant decrease of CFI. Metric invariance was therefore strongly violated for a different number of scale points. This result did not change if the continuous VAS (100 points) was excluded from the comparison (Table 2) or socio-demographic variables were considered in the analysis (Table 3). Therefore, metric invariance was systematically violated when a different number of scale points was used for data collection.
Looking at the measurement invariance for formats per device (while the continuous VAS was excluded, see Table 2), configural and metric invariance emerged. However, the model fit of the configural model could be evaluated as just acceptable again, as RMSEA was on the border of benchmark and CFI was slightly below it. Scalar invariance can be assumed according to the change of RMSEA and CFI; however, chi-square significantly worsened again. If socio-demographic variables were included in the analysis, scalar invariance was not violated anymore and was exhibited for different formats when used with different devices (Table 3). For scale points by different devices, neither configural, nor metric invariance appeared again, regardless of whether controls were made for socio-demographic variables (Table 2 and Table 3).
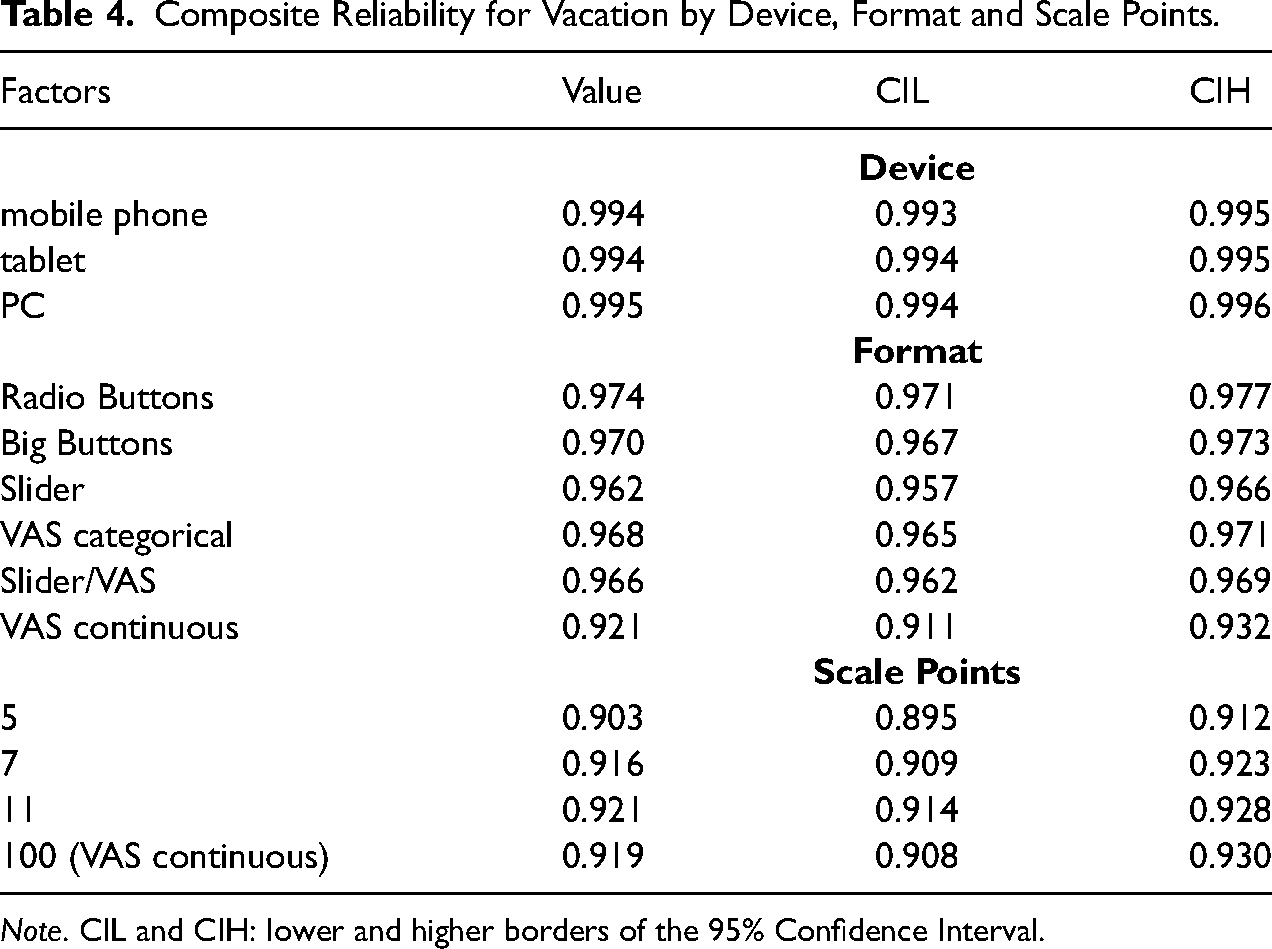
Table 4 and Figures 1 to 3 summarize the scores of Composite Reliability for the general structure and their pertinent 95% Confidence Intervals (CIL for the lower and CIH for the higher border) obtained for the three devices, the six formats and the four groups with a different number of scale points. In terms of devices, perfect reliability (close to 1) resulted for each, without any notable differences (Table 4, Figure 1). This shows that the given instrument on vacation experiences exhibited a very high level of reliability pointing toward high factor loadings and little error terms.
Composite Reliability for Vacation by Device, Format and Scale Points.
Composite Reliability for Vacation by Device, Format and Scale Points.
Note. CIL and CIH: lower and higher borders of the 95% Confidence Interval.
If differentiations were made between the six formats, the absolute size of reliability decreased slightly (Table 4, Figure 2). Hence, the values of reliabilities remained very high (ρ >.95), with the exception of the continuous VAS, where reliability decreased to ρ = .92. Due to non-overlapping 95% CIs (Table 4 and Figure 2), this size of reliability was significantly lower than with other formats. Although the differences in reliability across the remaining formats were not highly pronounced, the 95% CIs were not overlapping (pointing toward significant differences) between Radio Buttons on the one hand and Sliders, categorical VAS and combined Sliders/VAS on the other hand. Therefore, significantly higher reliability coefficients were observed for radio buttons than for most other formats and the continuous VAS exhibited remarkable lower reliability than all other formats.
For the scale points, a slightly lower reliability was given for five points than other number of scale points, while significant differences were observed between five and eleven points (Table 4 and Figure 3). No notable differences were obtained between seven, eleven and 100 points.
For the next results we compare reliability coefficients between different formats implemented for a device. Since 18 groups had to be compared, reliability coefficients and their pertinent 95% CIs are only graphically presented in Figure 4. As Figure 4 shows, there was no device effect on reliability coefficients (meaning no differences between the devices) for Radio Buttons and combined Slider/VAS. Significant differences between the devices were given for other formats. Reliability was slightly lower for mobile phones and tablets than for PCs with Sliders and categorical VAS. For Big Buttons and continuous VAS, reliability was lower with mobile phones than with tablets and PCs. This was a surprising result, since these formats have been thought to be optimizations for mobile phones. For continuous VAS we obtained remarkably lower reliability than for other formats, a result reported on above.
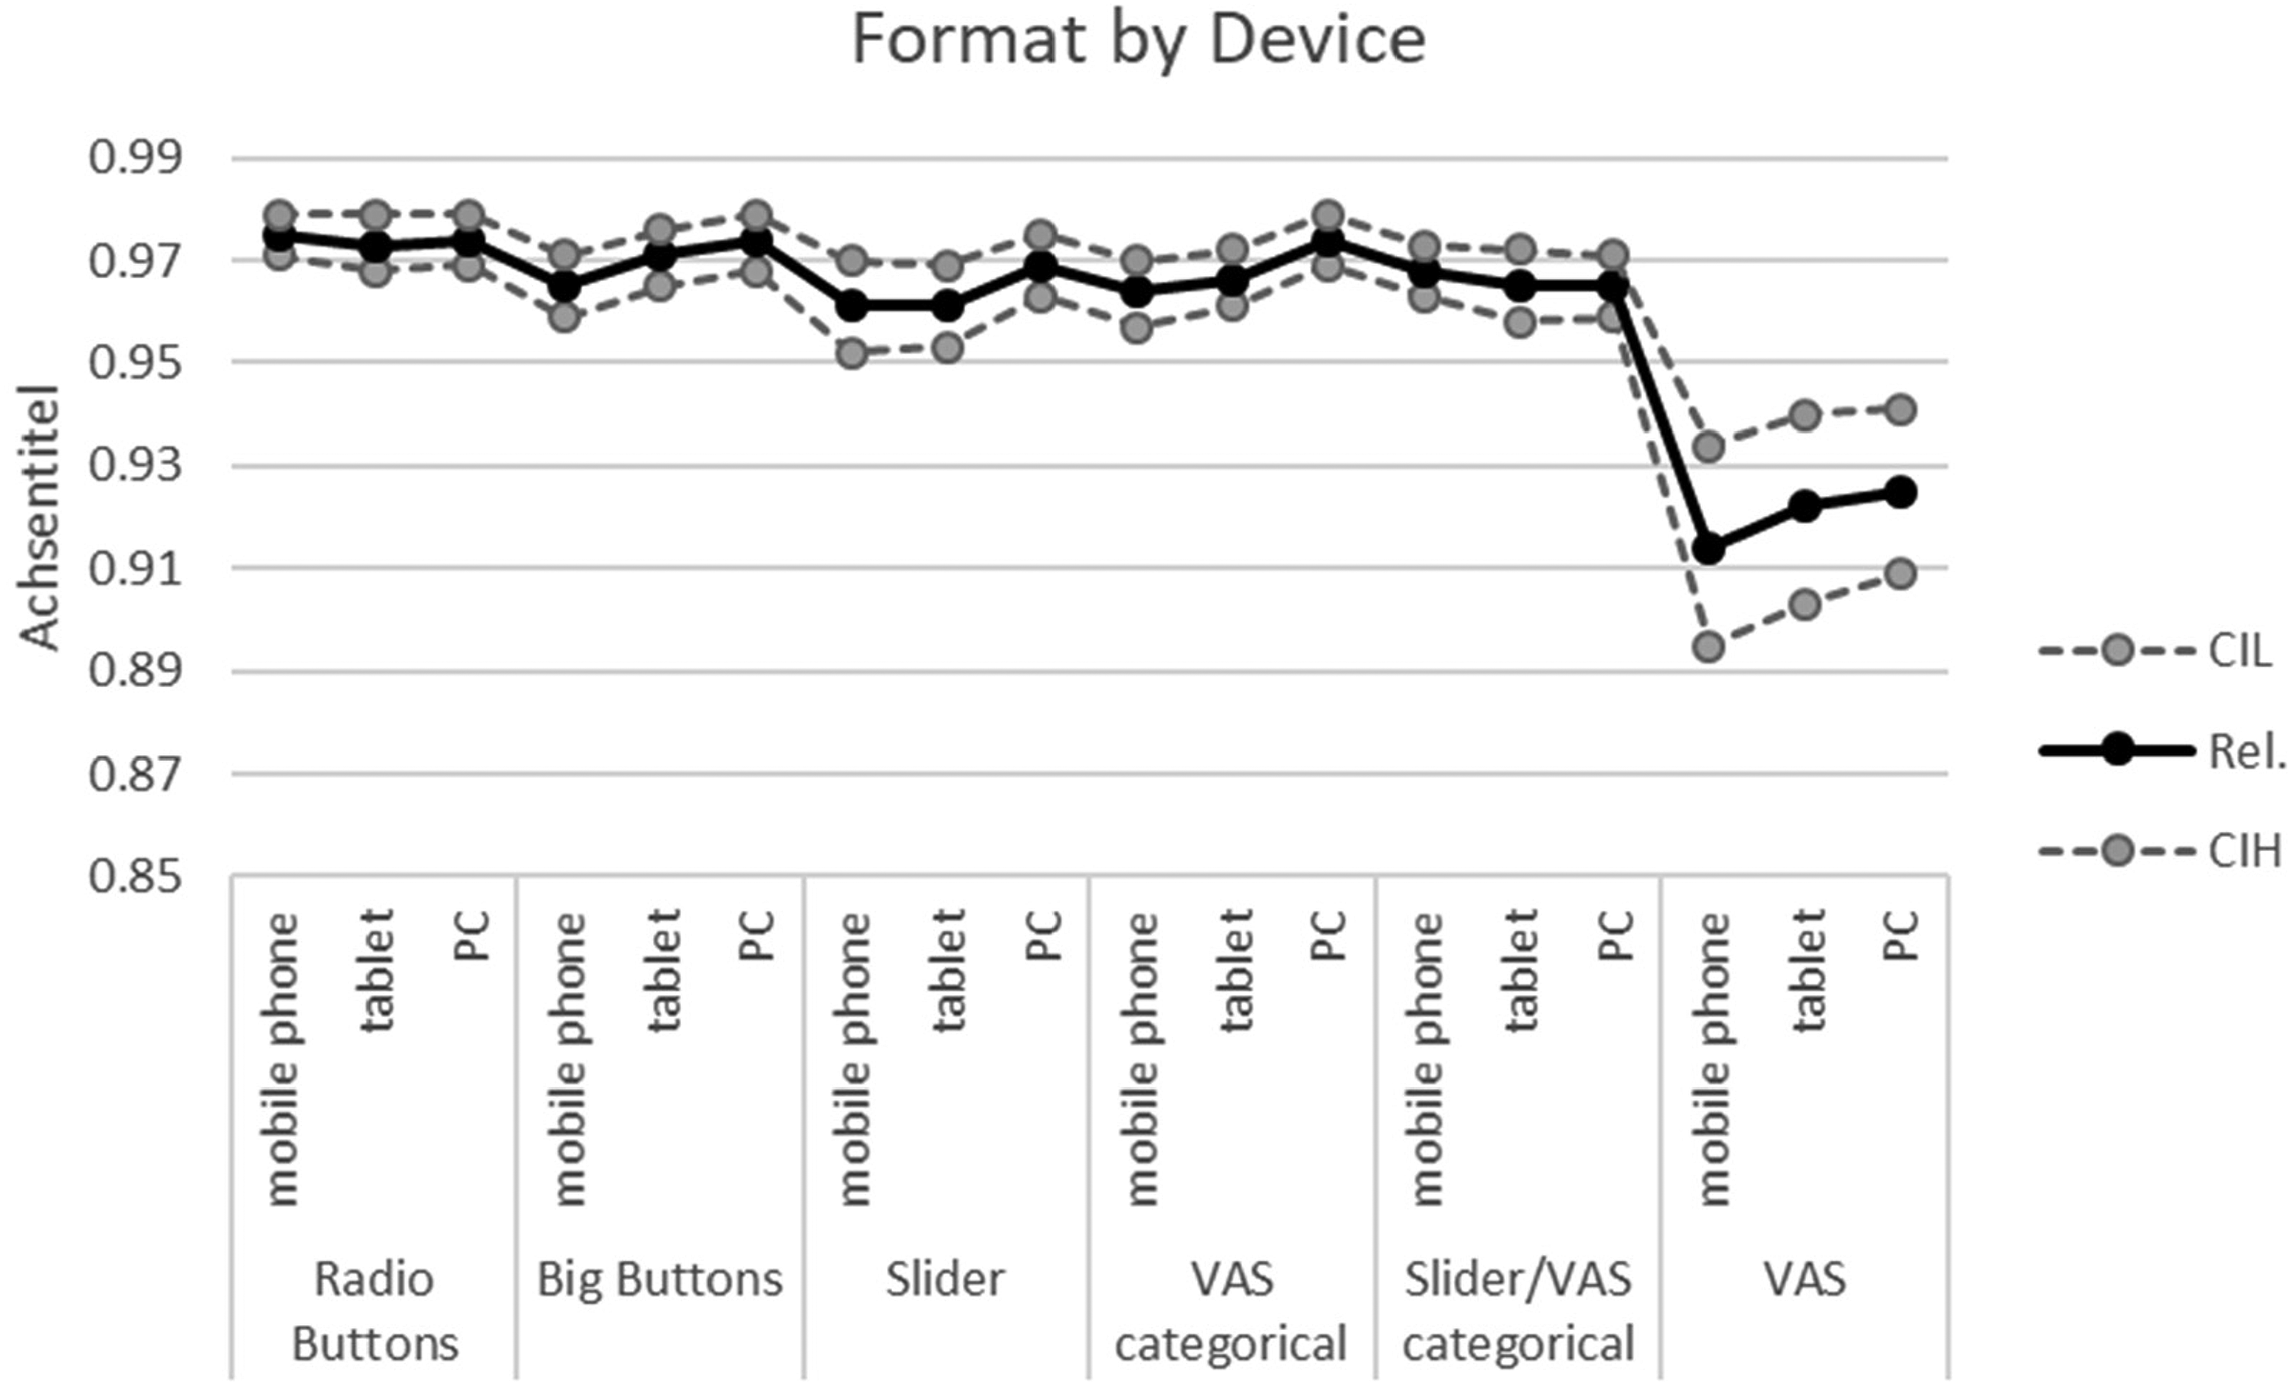
Reliability coefficients by format and device. Note. Rel.: Composite Reliability; CIL and CIH: lower and higher borders of the 95% Confidence Interval.
The reliability coefficients were higher for all number of points, if respondents used desktop PCs (Figure 5). With mobile phones, reliabilities were consistently and (with exception of the continuous VAS, meaning 100 points) significantly lower than with other devices. For tablets, reliability was lower than with PCs in the case of five point scales.
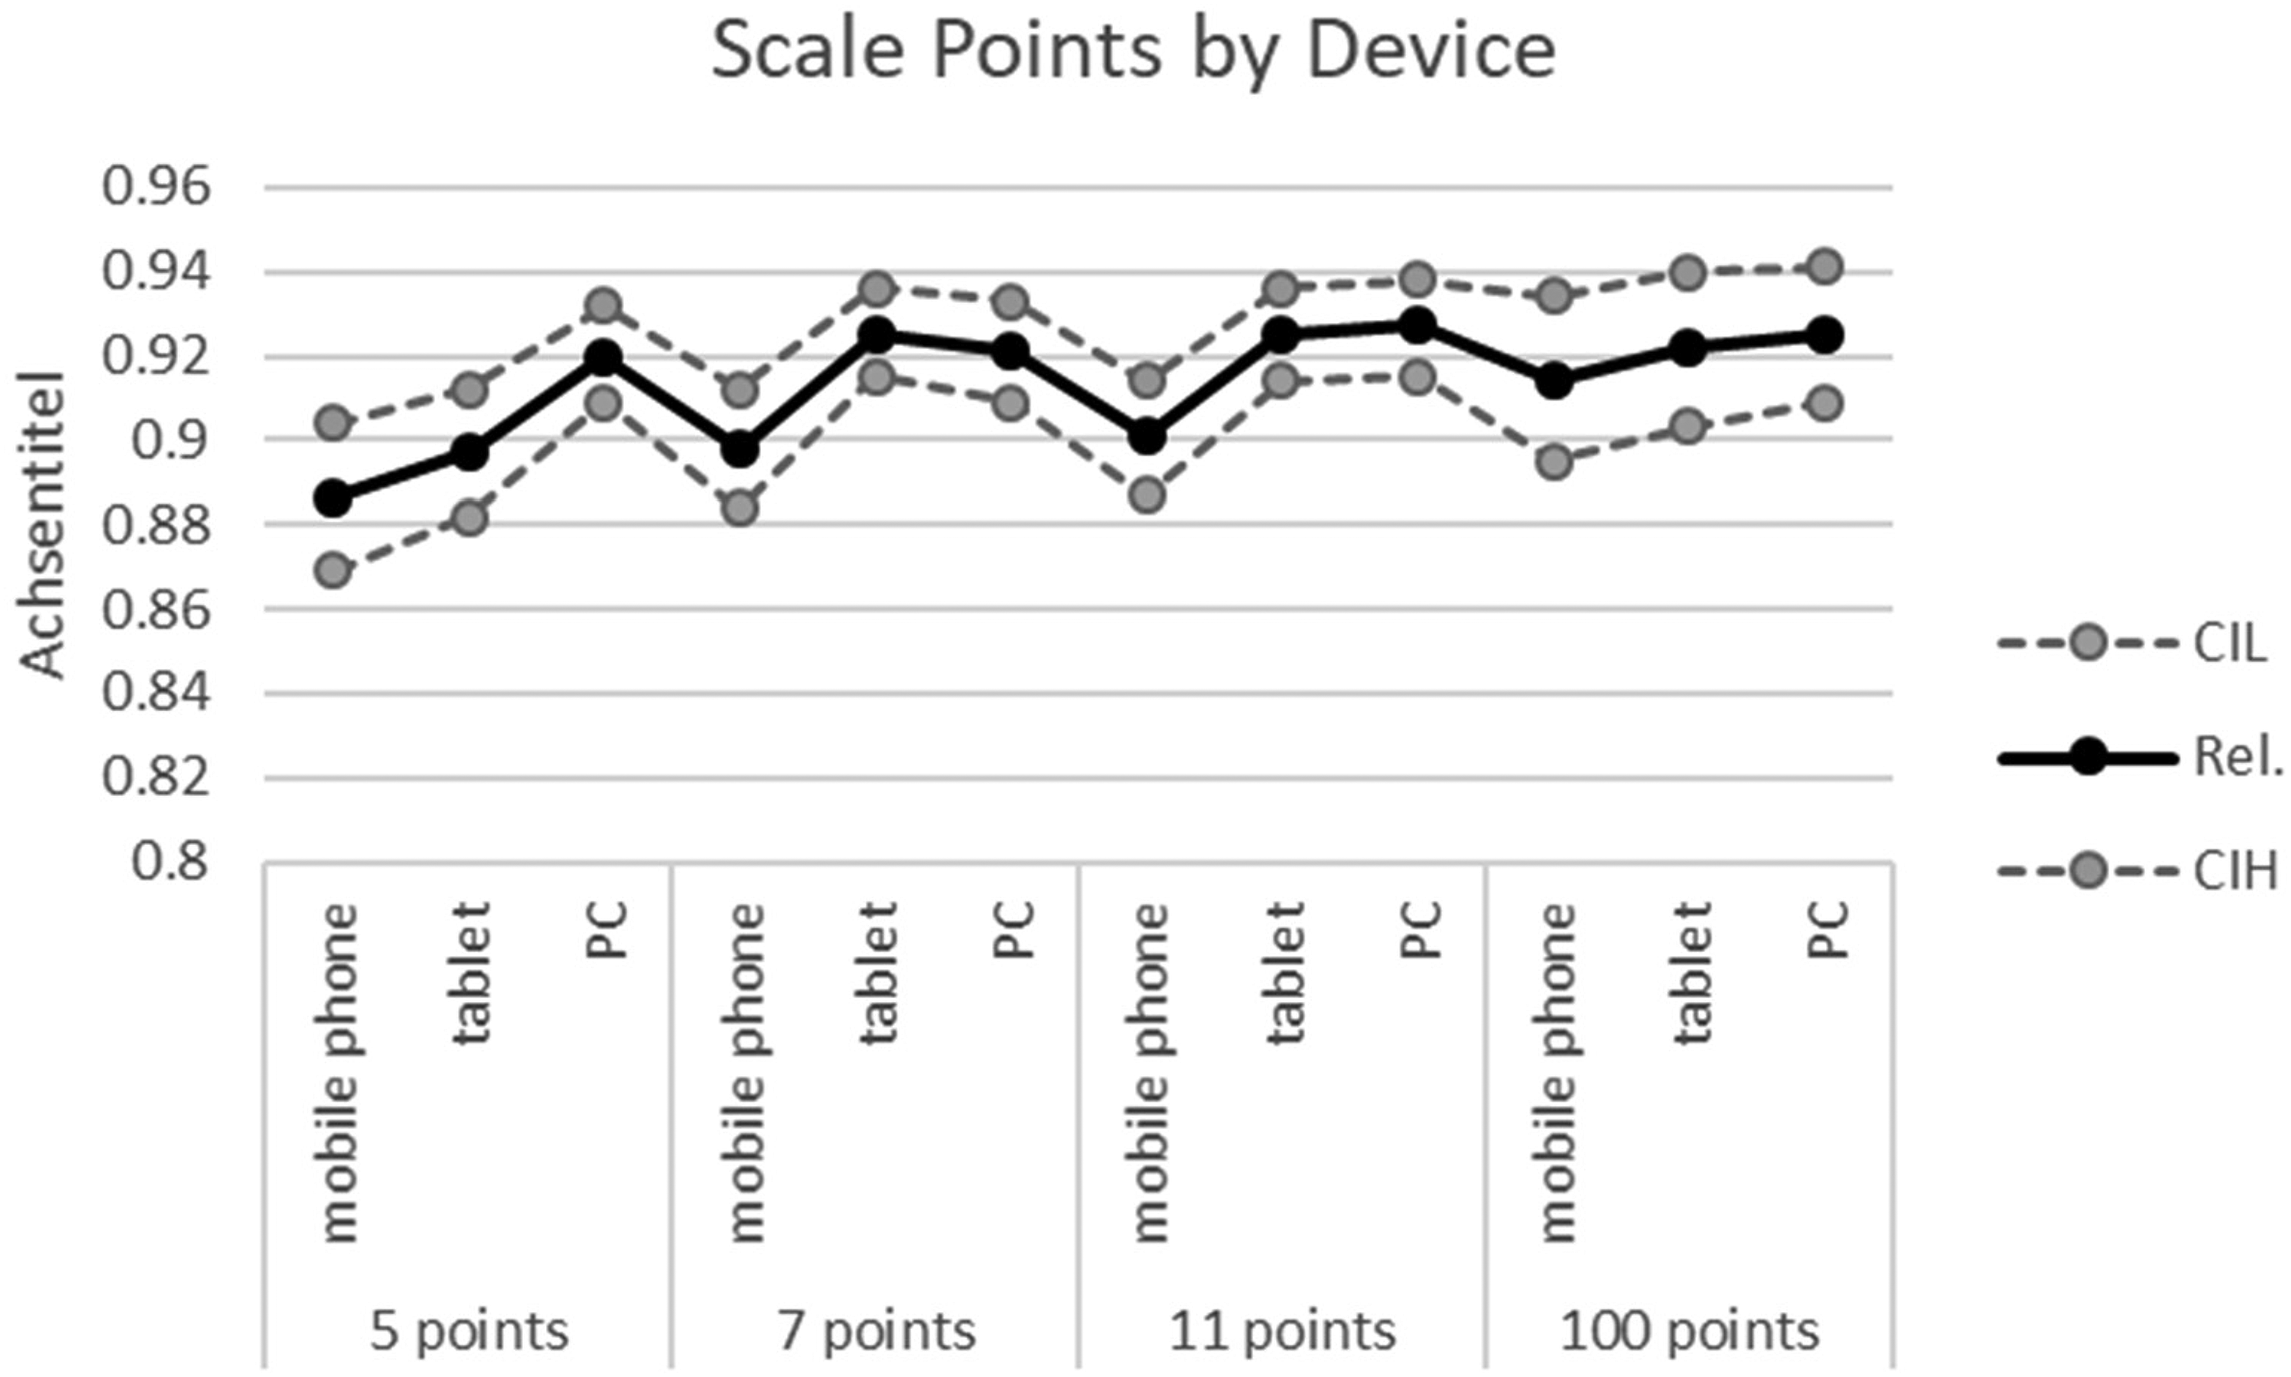
Reliability coefficients by scale points and device. Note. Rel.: Composite Reliability; CIL and CIH: lower and higher borders of the 95% Confidence Interval.
In sum, the results show that reliability was not affected by device per se, but differences arise if devices were used with different formats and different number of scale points. Thereby, reliability coefficients varied within the range from ρ = .91 to ρ = .99, which was a remarkable variability. With the continuous VAS, reliability was notably lower than with other formats. Formats that were expected to improve data quality when using mobile devices, such as Big Buttons, Sliders, or VAS (both, continuous and categorical) performed worse than Radio Buttons in the case of mobile phones. Scale points were relevant in influencing reliability differences for different devices, which demonstrated significantly lower reliabilities for mobile phones than other devices. Scales with five categories produced particularly lower reliabilities for both mobile devices.
We now look at the results for comparison among devices for the QE-items and compare them with the results for the vacation scale. For the latter, we consider mode effects for the 11 points rating scales and for the 11 point Radio Button format (as QE items were presented using this format and this number of categories). To account for the potential sample differences between devices we consider socio-demographic variables and conduct MGSEM, like the former analyses for the vacation items. The results did not markedly differ between the two types of analysis and we present the results if socio-demographic variables are included (Table 5). For the QE-items, configural invariance can be assumed to be given due to the CFI, but RMSEA was slightly too high. If metric invariance was nevertheless analyzed, it emerged across devices. Scalar invariance was given as well. Compared to the vacation items (11 points Radio Buttons), configural invariance was somewhat violated due to the results of chi square, RMSEA and CFI. If configural invariance was nevertheless assumed, metric invariance could be accepted, but scalar invariance was slightly violated due to the significant change of chi-square. These results for the effect of device on Measurement Invariance were strongly comparable between the two different topics pointing to metric and scalar invariance among devices.
Test of Measurement Invariance among Devices for the Cross–Validation.
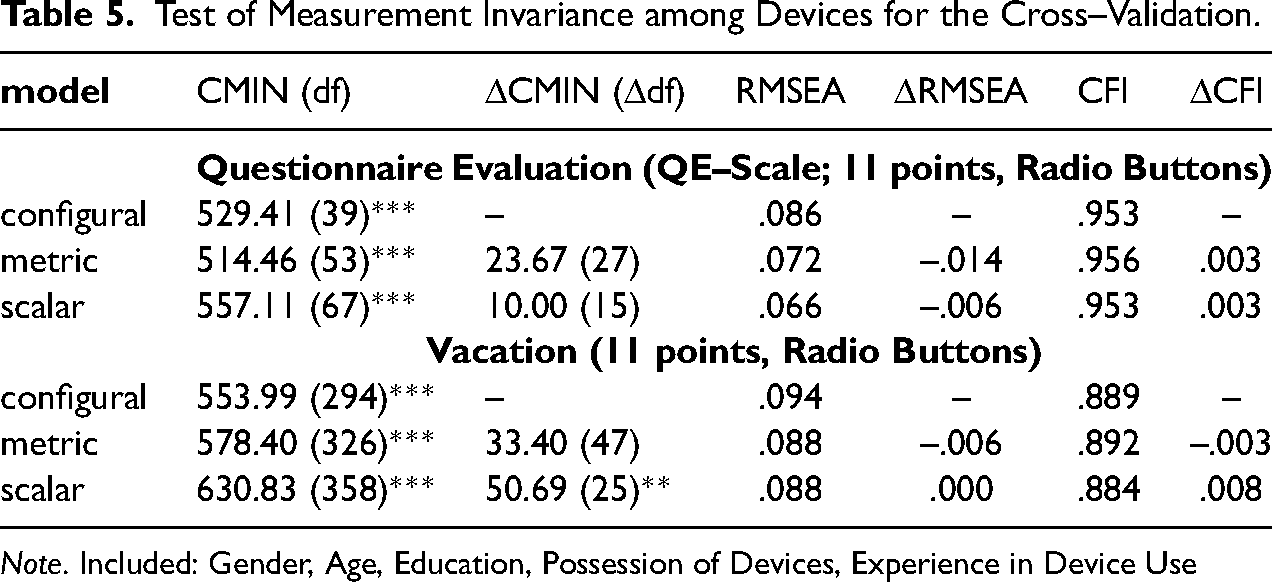
Test of Measurement Invariance among Devices for the Cross–Validation.
Note. Included: Gender, Age, Education, Possession of Devices, Experience in Device Use
The reliability for the general structure of the QE-items was evaluated on the basis of MGCFA without including socio-demographic variables (χ2(3776, 39) = 441.05, p < .001; RMSEA = .091; CFI = .924). Reliability coefficients ranged between ρ = .70 (for tablet) and ρ = .87 (for PC, see Table 6). The loadings were λ ≥ .30 and significant in all groups (see Supplementary Material, Cross-Validation Section, for estimated parameters). Due to the non-overlapping 95% CIs, reliabilities differed significantly between the devices, while the lowest reliability was obtained for tablets, followed by mobile phones, and the highest reliability was observed for PC (Table 6). This result is comparable to the results for 11 points scales of vacation scale, where reliability was slightly, but significantly lower for mobile phones than for PCs (Table 6 and Figure 5). Radio Buttons as a format seemed not to balance the negative mobile device effect for the QE-items evaluated in the 11 point scale, which was the case for the vacation scale in the groups that used Radio Buttons and 11 scale points. In the latter group, reliability differences were not strongly pronounced between different devices, while reliability was high in all three device groups (Table 6). Hence, as comparisons with other formats is not available for the QE-items, we do not know whether the device effect for QE-items would be even stronger with other formats. The difference in the results concerning the potential effects of rating scale format would be due to different reliabilities of the two questionnaires, as the QE-items are associated with a low to medium reliability, but the vacation scale provided medium to high reliability.
Composite Reliability by Topic for the Cross-Validation of the Results.
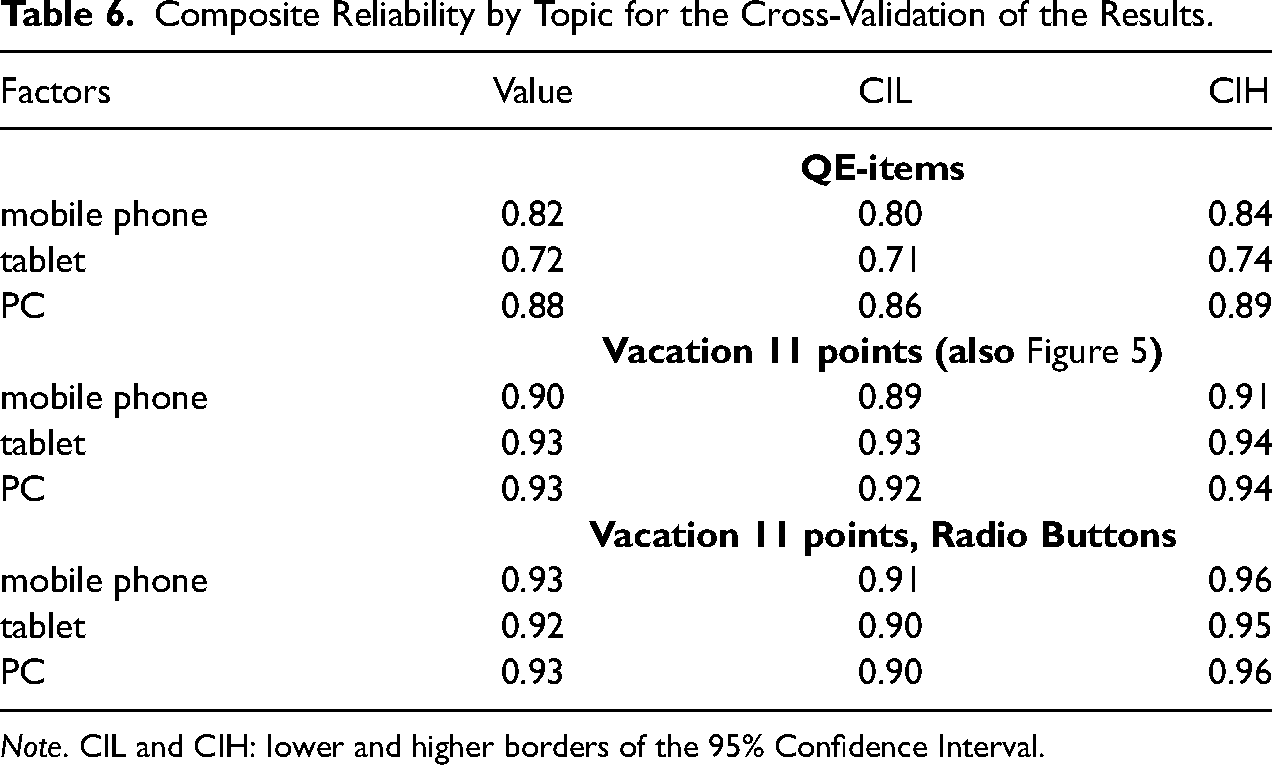
Note. CIL and CIH: lower and higher borders of the 95% Confidence Interval.
One of the aims of this research was to assess the comparability of data between different devices when using different response formats and a different number of points in rating scales. The paper contributes to the literature with respect to the analysis of functional equivalence (Scheuch 1993) between devices, formats and different numbers of scale points. The analysis presented focuses in particular on under researched aspects in sociological, social and behavioral science methodology. We regard devices as an important, but less researched issue, use measurement invariance analysis that allows for separation of systematic and non-systematic measurement error, and evaluate reliability by means of LVM (Raykov and Marcoulides 2011) that is more appropriate for survey data than other reliability assessment methods.
The results show that devices are comparable (in terms of configural, metric and scalar measurement invariance). This result is similar to the results by Klausch et al. (2013), who found scalar invariance between different self-administered modes of data collection. However, some formats differ from others, either in terms of the amount of non-systematic or systematic measurement error that is a systematic artificial shift of results. In the case of the continuous VAS, metric invariance was violated when compared with other formats, which means that respondents used the continuous VAS in a different way than other formats. One reason would be that a too high level of differentiation of the continuous VAS could not be appropriately used by respondents who would have difficulties precisely scoring a point at a VAS by mouse click or using their finger on a touch screen. Continuous VAS seems to be less easy to use than other formats. Therefore, although continuous VASs make very efficient use of space, and space is very important with small screen sizes such as mobile phones, they are not recommended for mixed-device surveys.
With respect to systematic measurement error, the results obtained with Sliders (also combined with VAS) may differ from those obtained with other formats (Radio Buttons, Big Buttons, Categorical VAS). With the latter, vacation experiences were evaluated as being more entertaining, educational or escapist and in sum more positively. It has been established in cognitive psychology that less familiar stimuli are evaluated more negatively than more frequently experienced stimuli (assuming no negative consequences following exposure), which is also applicable to familiar situations (Zajonc 2001). This can explain the more positive evaluations when using Radio Buttons that are usually implemented in online surveys and represent a familiar format for respondents. However, this explanation should be subject to further research. Another explanation would be the ease of use of a format, which can foster positive emotions and evoke more positive opinions (Winkielman and Cacioppo 2001).
While data were comparable between devices and formats (except continuous VAS), there was no comparability of data between different numbers of scale points, which was not limited to the comparison of the continuous VAS (100 Points) with other numbers of scale points. Unlike different formats, considering socio-demographic variables as covariates in the analyses did not allow measurement invariance and therefore comparability of data between different number of scale points to be ensured. Therefore, different numbers of scale points can mean different things to respondents, as rating scales differ in the degree of graduation, which in turn impacts the clarity of response options. The lack of comparability between rating scales with a different number of scale points resembles the findings of previous research that has shown that metric measurement invariance was not given between different realizations of rating scales (e.g., Menold and Kemper 2015; Menold and Tausch 2016). Therefore, this finding can also be evaluated as being generalizable to other contents and measurement instruments.
Whereas the results on comparability provide evidence of how devices, formats or different number of scale points can (or cannot) be mixed, they make no claim as to which design is to be preferred in mixed-device studies. Such a decision is supported by the results on measurement quality, i.e. reliability in our case. The results show that devices had no effect on reliability, and reliabilities of the vacation scale were of a high size, without any notable differences among devices. Comparable high measurement quality was also obtained for different formats with one exception. Continuous VAS revealed remarkably lower reliability than other formats. This supports the above explanation on why the data collected with the continuous VAS would not be comparable with other data, namely due to its only apparent precision and potentially difficult use.
With respect to the reliability of formats implemented with a device, it was shown that there was a small device effect for Big Buttons, Sliders and categorical and continuous VAS, where the reliability was lower with mobile phones and sometimes also with tablets than with desktop PC. However, such an effect was absent for Radio Buttons and the combined Slider/VAS, where reliability scores did not differ remarkably across devices. The results with respect to formats are surprising, because Big Buttons, Sliders and VAS were supposed to be of particular advantage for mobile phones (e.g. Antoun et al. 2018). Nevertheless, these formats could be either less familiar to the respondents or less usable than Radio Buttons.
Some effects on reliability were obtained for different devices when using a different number of scale points. Reliability was particularly lower for mobile devices in the case of five points, which can be explained by a lower differentiation and therefore potentially higher item non-response of five points. The result with respect to a higher reliability of seven category rating scales and lower context effects in that case supports the findings of previous studies (De Beuckelear et al. 2013; Menold and Kemper 2015; Menold and Tausch 2016) and is therefore generalizable over different topics. Since the results did not differ for seven and eleven points, seven categories would be considered a less demanding and reasonable alternative to 11 points (as also de Beuckelaer et al. (2013) have shown).
Altogether, the results show that comparability and measurement quality are less dependent on the device used per se, but much more so on the potential interaction effects of device with response format and with number of scale points. As far as devices are concerned, the results are good news because different devices are used in online surveys and researchers are usually unable to control what device a respondent uses to participate in the survey. Radio Buttons and seven points rating scales allow for low-tech questionnaire design and collection of data that are comparable among devices, free of systematic bias and provide a sufficiently high level of measurement quality (i.e. reliability). Data obtained from continuous VAS are not comparable to the data obtained from other formats and are also less reliable.
Apart from the added value, the limitations of the present study also need to be considered. Our results apply to multi-item scalar questions on opinions only and not to single question measures or measures of behaviors or facts. With respect to opinions, we were able to evaluate only one measurement instrument on vacation experience. The cross-validation using a different topic and comparable multi-factor structure (QE-items) provided comparable results with respect to measurement invariance analyses and showed metric and scalar invariance for devices. With respect to reliabilities, lower reliability for mobile devices could be identified as a stable result. This provides some hints that our results would also be expected to be obtained for scalar questions on other topics. In particular, we assume that results would be generalizable for measurement instruments and questionnaires of a high reliability, as sufficiently high reliability is a prerequisite for the stable results (e.g., Kline 2016). However, because in the cross-validation analysis we could not test the effects for different rating scale formats and different number of scale points, more replicative research when using other concepts and questionnaires is needed to allow for a broader generalization of results. With respect to the scale points, however, it should be mentioned that use of numbers could additionally affect the results. As numbers are used as standard in online surveys, despite their undesirable properties known from the literature (e.g., Krosnick and Fabrigar 1997; Menold 2020), more research on mixed-device surveys is needed when implementing fully verbalized rating scales. Finally, one critical feature was that an online access panel population was used in the study, which is a selective population due to device ownership, interest and experience in doing online surveys.
Nevertheless, the present study has one particular strength which is unusual in methodological research. We used a randomized three-factor design with a systematic variation of devices, formats and numbers of scale points that allows for casual interpretation of the effects (cf., Hox et al. 2015). We also provided a control for potential sample differences between the analyzed groups with respect to the key socio-demographic variables showing stability of the results provided. The added value of this study is also that it is a first evaluation of measurement invariance between devices in dependence on both, the format of rating scales and the number of scale points. Next, it assesses measurement quality in terms of Composite Reliability, which has rarely been done before.
The study provides clear results and therefore has clear implications for the choices made when designing mixed-device surveys. The devices as such would be only a small source of systematic or non-systematic bias, but less so different formats or particularly different number of scale points. Our results therefore support the position that one should use a unified design for different devices, which was also recommended for mixed modes (DeLeeuw 2018; Dillman, Smyth, and Christian 2014). The mixing of formats and different numbers of scale points should be avoided, in particular. If a seven-point rating scale is used for PCs and five points for smartphones (both with Radio Buttons), for example, the data are unlikely to be comparable and usable for the analyses. Radio Buttons with seven categories as a low-tech solution (as compared to the combination of categorical VAS and Slider) were formats with reasonable measurement quality and little device effects and these realizations therefore appear to be preferable over other choices.
Last but not least, we hope that our study will promote further research on this topic using our method of systematic experimental variation and reliance on the LVM approach.
Data Availability
Access data and software sources: doi: 10.6084/m9.figshare.17081921
Supplemental Material
sj-pdf-1-smr-10.1177_00491241221077237 - Supplemental material for Do Different Devices Perform Equally Well with Different Numbers of Scale Points and Response Formats? A test of measurement invariance and reliability
Supplemental material, sj-pdf-1-smr-10.1177_00491241221077237 for Do Different Devices Perform Equally Well with Different Numbers of Scale Points and Response Formats? A test of measurement invariance and reliability by Natalja Menold and Vera Toepoel in Sociological Methods & Research
Supplemental Material
sj-sav-2-smr-10.1177_00491241221077237 - Supplemental material for Do Different Devices Perform Equally Well with Different Numbers of Scale Points and Response Formats? A test of measurement invariance and reliability
Supplemental material, sj-sav-2-smr-10.1177_00491241221077237 for Do Different Devices Perform Equally Well with Different Numbers of Scale Points and Response Formats? A test of measurement invariance and reliability by Natalja Menold and Vera Toepoel in Sociological Methods & Research
Supplemental Material
sj-inp-3-smr-10.1177_00491241221077237 - Supplemental material for Do Different Devices Perform Equally Well with Different Numbers of Scale Points and Response Formats? A test of measurement invariance and reliability
Supplemental material, sj-inp-3-smr-10.1177_00491241221077237 for Do Different Devices Perform Equally Well with Different Numbers of Scale Points and Response Formats? A test of measurement invariance and reliability by Natalja Menold and Vera Toepoel in Sociological Methods & Research
Supplemental Material
sj-inp-4-smr-10.1177_00491241221077237 - Supplemental material for Do Different Devices Perform Equally Well with Different Numbers of Scale Points and Response Formats? A test of measurement invariance and reliability
Supplemental material, sj-inp-4-smr-10.1177_00491241221077237 for Do Different Devices Perform Equally Well with Different Numbers of Scale Points and Response Formats? A test of measurement invariance and reliability by Natalja Menold and Vera Toepoel in Sociological Methods & Research
Footnotes
Supplemental Material
Supplemental material for this article is available online.
Author Biography
References
Supplementary Material
Please find the following supplemental material available below.
For Open Access articles published under a Creative Commons License, all supplemental material carries the same license as the article it is associated with.
For non-Open Access articles published, all supplemental material carries a non-exclusive license, and permission requests for re-use of supplemental material or any part of supplemental material shall be sent directly to the copyright owner as specified in the copyright notice associated with the article.