
Abstract
The traditional paper-based Q method was introduced to the social sciences in the 1930s. However, despite its unique capability for measuring peoples’ subjective opinions, the method has not been broadly employed by researchers. Moreover, despite recent efforts to administer the Q method surveys via the Internet, they have been mostly limited to the usage of textual prompts. Besides, there is no concrete evidence on the usability, reliability, and agreement analysis between the online Q method research tools and the traditional paper-based Q method. Therefore, the visual Q method online research tool was developed to resolve these deficiencies and add new dimensions (audio and video) to the Q method research. The development of the visual Q method platform was a three-stage process that commenced with a usability test on 31 visitors to a local museum. Second, a test–retest reliability analysis with a convenient sample of 37 students resulted in a high reliability coefficient superior to that of the traditional paper-based Q method. Third, the analysis of agreement between the visual Q method and the traditional paper-based Q method on a sample of 10 students revealed substantial similarities between their generated (V)Q sorts. Overall, the study findings provide substantial evidence on the usability and rigor of the visual Q method online research tool.
Introduction
Q methodology was invented by William Stephenson in the mid-1930s to scientifically measure self-referent viewpoints, mindsets, and attitudes (Brown, 1993; Good, 2010). Q methodology is both a constructivist and a social constructionist research approach, whether it focuses on the individual or social construction of beliefs, knowledge, or discourse about a subject (Watts and Stenner, 2005). This method has received increasing attention in the social sciences because of its strong statistical component for the study of human subjectivity (Ellingsen et al., 2010). Further, this method can be used to cluster like-minded people about a non-cognitive topic through by-person factor analysis in contrast with the more commonly used by-variable factor analysis. Each factor represents a unique viewpoint about the subject of investigation.
The conduct of Q method research encapsulates eight stages: design, preparation of survey material, deliverance, data elicitation, data record, analysis, interpretation, and write-up. The design stage entails the formation of universe of opinions surrounding the topic, that is, concourse of communication (COC), reducing the COC to a representative sample (Q sample), selecting the research participants (P set), designing a graded spectrum of cells (grid) on top of which Q sample items (henceforth Q items) are sorted (Q sorting), and outlining the condition of instruction. The preparation stage entails printing the grid, condition of instruction, score sheet, and the Q items on pieces of paper. The deliverance stage encompasses the arrangement of the survey material on a table, in a convenient time and place to both researcher and participants.
In the Q method, securing the diversity of perspectives among population of interest is more relevant than the recruitment of a large and representative sample prevalent in quantitative research methods (Gabor, 2013;Watts and Stenner, 2005). However, in the traditional paper-based Q method (TPQM) the face-to-face interactions with participants and usage of paper-based tools intensify its operational difficulties and resource intensiveness. Even alternative methods such as mail deliverance of the Q survey materials have been unwieldy and confusing for participants (Klooster et al., 2008).
Nonetheless, some researchers believe that interaction of researcher and participant is advantageous to comprehending the participants’ perspectives. In other words, the researcher promotes a “feeling for organism” with participants, which is only attainable through the researcher’s interaction and accumulative acquaintance with participants (Brown, 1989; Previte et al., 2007). Moreover, in contrast to Internet-based surveys, in TPQM, researchers can augment participants’ involvement, commitment, and contemplativeness through one-to-one interactions. In this vein, some studies reflect on the resultant low intellectual commitment, cognitive engagement, and resultant data quality with online surveys (Couper et al., 2001).
While this interaction may assist the researcher in interpretation and analysis of findings, it also reinforces the researcher’s influence on the participants (Cross, 2005; Scott et al., 2014). Simply put, the researchers’ close interactions with participants forge a sense of being observed among participants, leading to their “satisficing” responses and “failing to differentiate among a set of diverse objects in ratings” (Cross, 2005; Krosnick, 1991: 213). Also, in sensitive topics such as sexual abuse, crime, or political views, participants might believe that disclosing their true perspectives would potentially threaten their status or image, and thereby, attempt to impress the researcher by complying with well-accepted notions and satisficing behavior (Scott et al., 2014).
Moreover, the influence of the researcher may undermine the reproducibility of findings, such that other researchers may not reach the same conclusions if follow the same procedures (Goodman et al., 2016; Guillemin and Gillam, 2004). Although reproducibility is the degree of measurement variation in unstable conditions such as change of researchers, reliability is the capacity of a measurement tool to differentiate between respondents under controlled conditions (Berchtold, 2016). Nonetheless, Watts and Stenner (2005) assert that the reliability in TPQM reflects more of the stability of opinions over time rather than the stability of the instrument itself.
Scholars assert that the range of perspectives on any topic is stable (Brown, 1971; Nicholas, 2011). Therefore, the range of perspectives can be used as a benchmark for testing the reliability of an instrument by assessing its stability over repeated measures (taking a Q survey twice). Nonetheless, no scholar has examined if the individuals who hold certain viewpoints (henceforth view-holders) would continue over repeated measures. In other words, will they share the same viewpoints with the same people about a topic over repeated measures? This understanding is fundamental, as in Q methodology the determination of viewholders is as crucial as identification of the viewpoints.
The agreement between two methods (methods agreement) is the extent to which identical findings can be obtained using two different measurement tools (Bland and Altman, 2010). In contrast to reliability, methods agreement intends to identify systematic errors rather than random errors. In this vein, the perfect agreement means similar results, whereas perfect reliability means high correlation (Thomas, 2017). The methods agreement is mainly conducted to reveal whether a new method can replace an old and gold-standard method and if a single method is rigorous enough to detect changes in participants’ opinions over time (Berchtold, 2016). However, if random error is larger than the change over time, the measurement tool would be unable to detect longitudinal changes (Berchtold, 2016). Hence, reliability underpins and should antecede the methods agreement analysis.
Several new tools have been recently developed to assist researchers in standardizing the research process and overcoming previous limitations such as the Q-assessor (Reber et al., 2000), FlashQ (Hackert and Braehler, 2007), and the Q-sortouch (Pruneddu, 2018). Nonetheless, none of them have undergone methods agreement analysis with the TPQM, nor does there exist any identified robust evaluation of their reliability.
The visual Q method (VQMethod) online research tool was developed to diminish the resource-ladenness of TPQM and to enhance its reliability and parsimony (Nazariadli, 2017). Moreover, the VQMethod has made the Q method research accessible and usable to a broad spectrum of researchers, due to the addition of new dimensions in the world of Q methodology research: video and audio (as Q items). For this, the purpose of this study is set out to evaluate the usability and psychometric properties of the VQMethod research tool in contrast to the TPQM.
Therefore, in a first stage, the usability (ease of use without need for any technical guidance/training) of VQ method survey (henceforth VQ survey) interface was tested on real users, with indicators of efficiency, effectiveness, and user satisfaction. Furthermore, in a second stage, the VQ survey interface underwent a test–retest reliability analysis with two measurement criteria: perspective overlaps, viewpoint stability and viewholder stability. Also, in this stage, the effect of time in taking VQ surveys on the reliability of VQ sorts was investigated. In a third stage, the methods agreement analysis was performed between the VQMethod and the TPQM to determine if there is any systematic bias (difference) between the two methods.
Hence, the following research questions and hypotheses guided this study:
Stage one
Q1: To what extent is the VQ survey interface usable for average users?
Stage two
H1. In VQMethod, the viewpoints remain stable at repeated measures.
H2. In VQMethod, the viewholders remain stable after repeated measures.
H3. In VQMethod, the time taken for completing a VQ survey significantly predicts the reliability of VQ sorts.
Stage three
Q2: To what extent do the TPQM and the VQMethod generate identical (V)Q sorts?
Stage one: examining the usability of the VQMethod research tool
Usability studies are mainly conducted to assess how well a new method or system can be used by people with no formal training (Holzinger, 2005). Usability measures the effectiveness and efficiency (overall performance) of a product, and the degree of end-user satisfaction (ISO 9241-11). Effectiveness addresses the complete accomplishment of the given tasks, efficiency is the needed time and resources, and satisfaction refers to both the overall and task-specific ease of use.
Usability laboratory tests and post-test questionnaire on the VQMethod
In the usability laboratory test, the potential end-users are invited to a laboratory wherein they perform specific tasks without realizing that they are being observed. The method can be conducted through one-way mirror unobtrusive observation, that is, the observation room is divided from the experiment room (Kaikkonen et al., 2005). This strategy keeps the researcher from influencing experimenters’ performances (Lin et al., 1997). Post-test questionnaires or interviews can complement the usability tests of a new system by directly inquiring users about their trouble with the system and potential resolution.
Sample and data collection
The usability laboratory and questionnaire tests were conducted at the Visual Investigate Lab, in the Museum of Natural Sciences in Raleigh, North Carolina. It was intended to observe how potential survey-takers operate on the VQ survey interface, thereby, finding the problems firsthand. This test was then followed by a post-test questionnaire to measure the participants’ task-specific level of satisfaction, uncover their difficulties, and apprehend how they prefer to solve their potential problems.
The museum visitors were intercepted in front of Visual Investigate Lab and informed about the research topic, estimated time of completion, required tasks, and the incentive (US$15 Amazon gift certificate). Among 35 people who were approached, 31 agreed to participate. The participants were purposefully selected to represent different age groups (21–73) and races (African American, Asian, Hispanic, and Caucasian). Nonetheless, the sample resulted in a somewhat unbalanced gender split (64.3% female and 35.7% male).
The usability tests at the museum were conducted in five sessions each lasting between 3 and 6 hours. A VQ survey was set up on a desktop computer connected to the Internet (with i3 Intel processor, Microsoft Windows 10 Professional, 4 GB memory RAM, GeForceGTX1050graphic card). The computer was equipped with two vertically cascaded 19 in. monitors that enabled the researcher to witness the experimenters’ interact with the VQ survey via the upper monitor. Resembling a one-way mirror, the experiment room was set up in a fishbowl laboratory setting surrounded by glass walls (Kaikkonen et al., 2005).
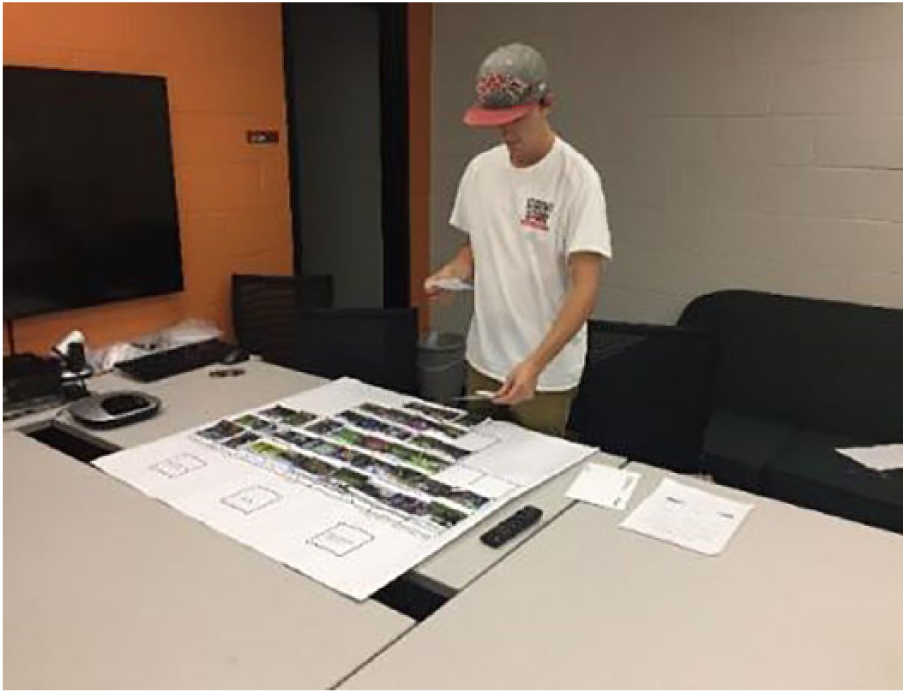
Next, participants were directed to the lab, sat behind the monitors, instructed about the study, and briefed about the post-test questionnaire. The researcher stood behind the glass wall to unobtrusively monitor the participants’ operations and to promote a normal working condition. For this, he oftentimes swapped his position between inside and outside of the lab to make his presence unobtrusive to participants (Figure 1) (Holzinger, 2005). The researcher instructed the participants to wave their hands if they were puzzled or faced any errors anytime during the test.
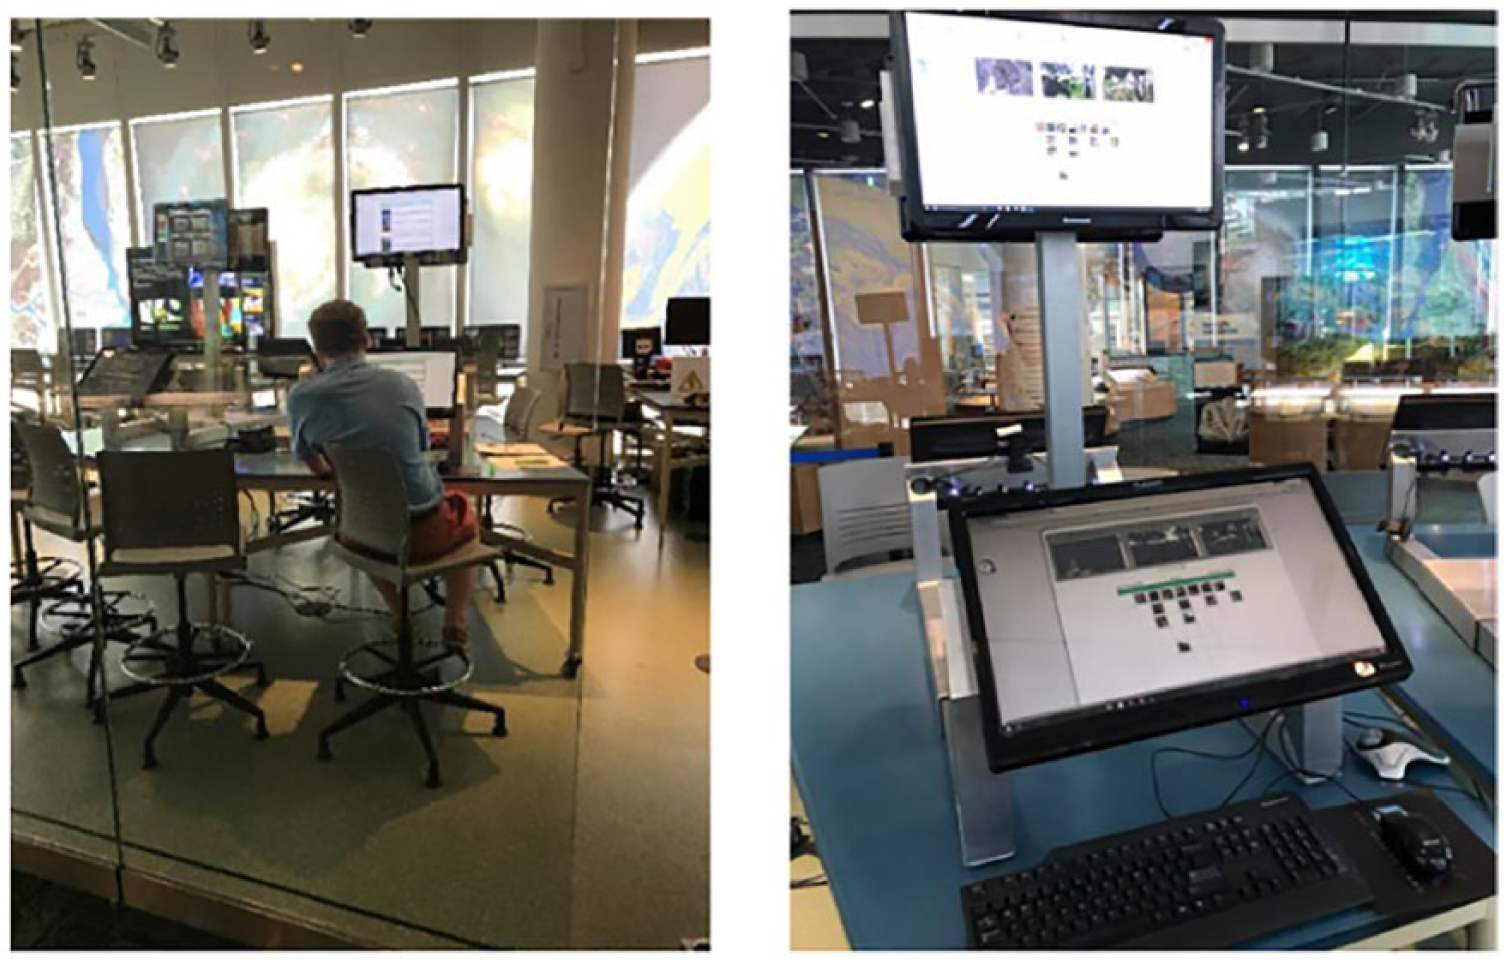
The unobtrusive observation in a fishbowl laboratory setting.
In the body of the VQ survey, first, the participants affirmed their consent in taking the survey. Second, they sorted a stack of 40 images into three boxes, that is, most like, neutral, and most unlike their views about rural life. Third, they dragged and dropped the images from the three boxes into a graded grid with a forced distribution of −4(3), −3(3), −2 (5), −1(6), 0(6),+1(6),+2(5),+3(3), and +4(3) 1 from most like to most unlike their expectations from rural life. Fourth, they reasoned about their placements of images in the −4 and+4 columns, and fifth, they responded to some general demographic questions.
After completing the online survey, each participant was handed the post-test questionnaire. The post-test questionnaire contained printed screenshots of five steps of the VQ survey. It inquired how difficult/easy it was to accomplish each task, through a five-point Likert-type scale Single Ease Question (SEQ) (Sauro and Dumas, 2009). The participants were then asked to draw or write on the screenshots and propose their solution to the encountered problems, if any. The solutions further fostered the participatory design of the final product (Spinuzzi, 2005), that is, the VQ survey interface. In addition, the success rate in completing the survey (measure of effectiveness) was recorded, system errors were captured, and field notes were taken.
Data analysis and findings
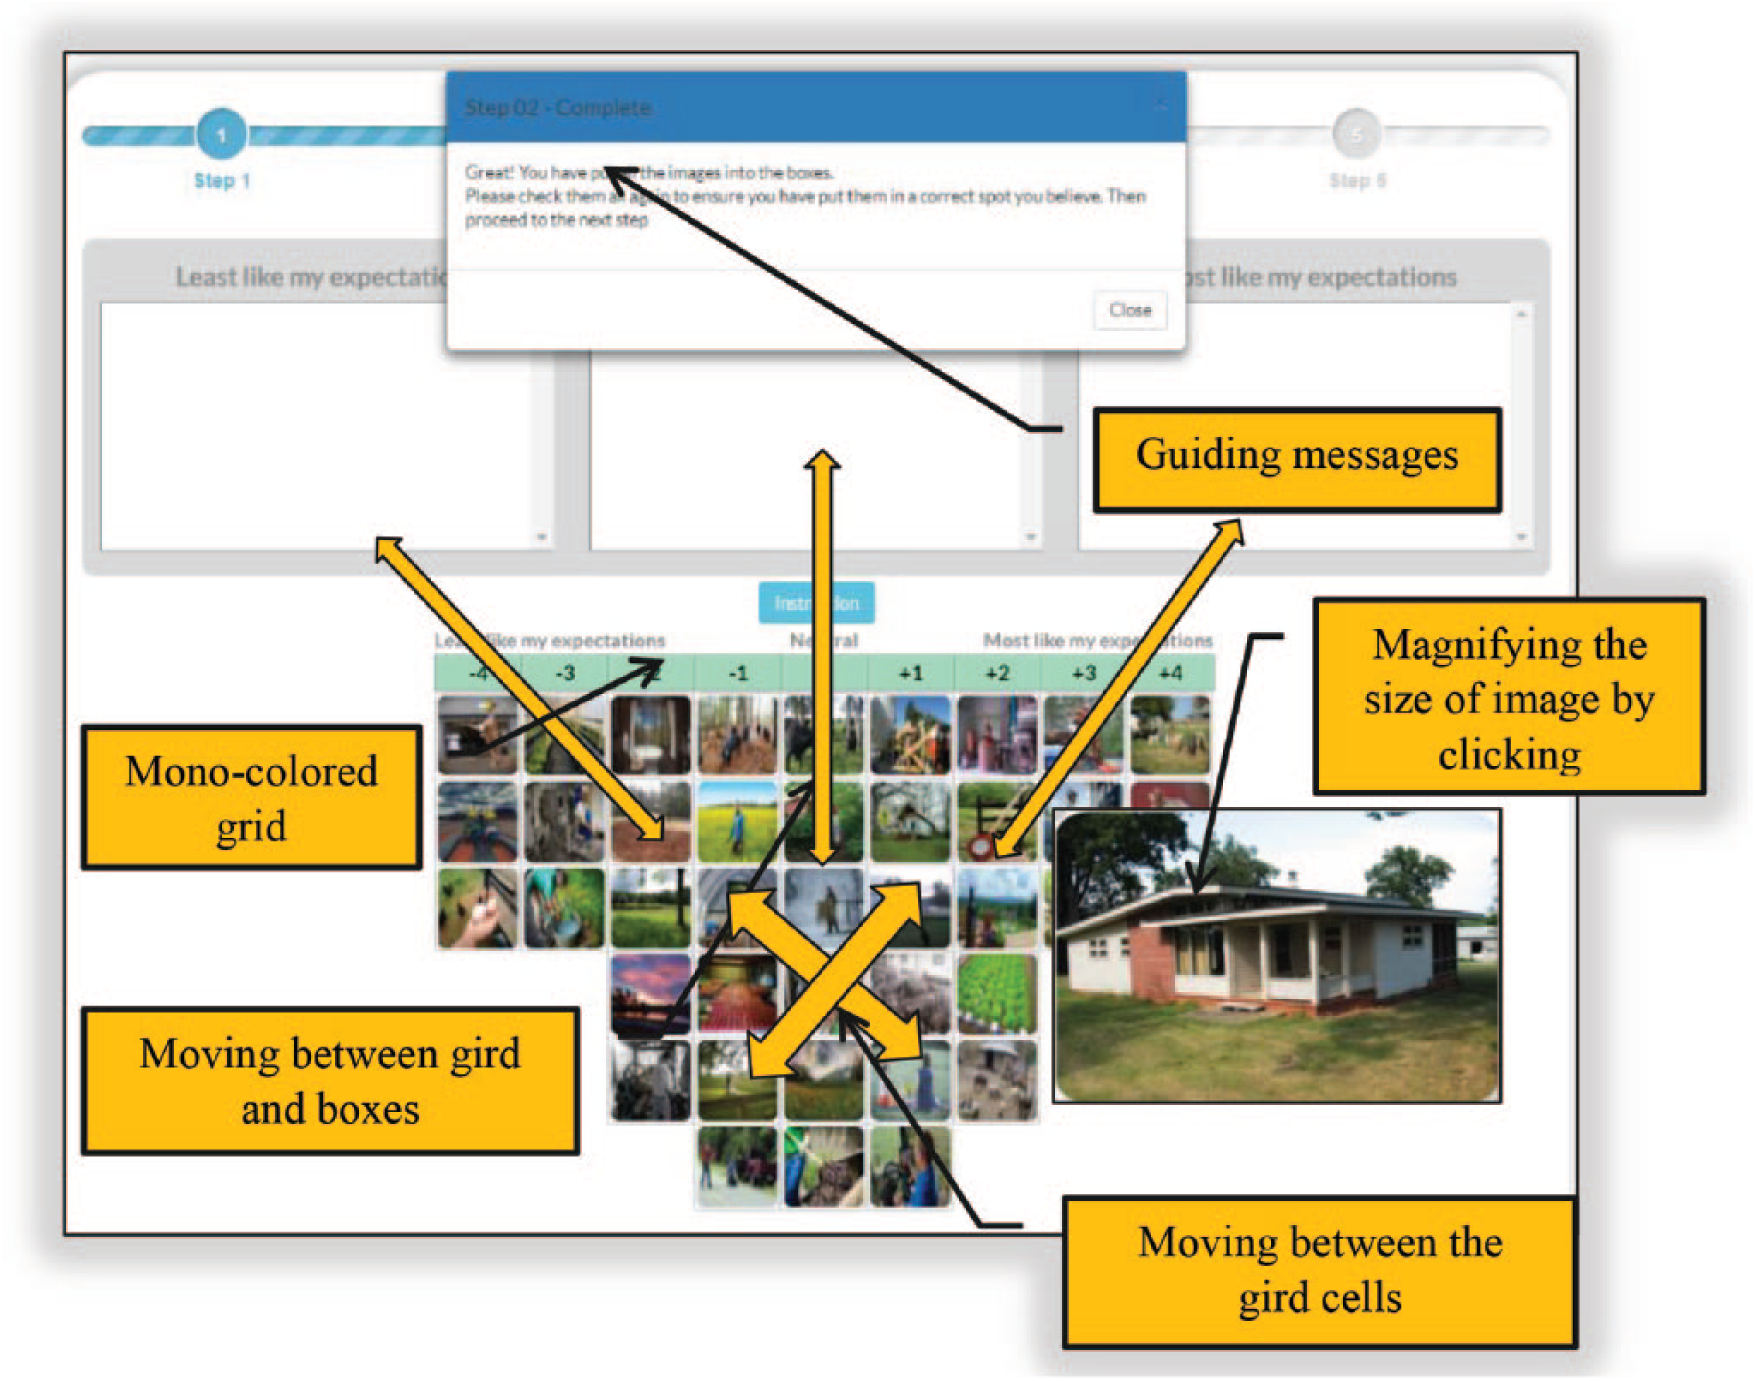
Participants mostly expressed their uneasiness with the forced distribution grid, the small font size, and the lack of initial familiarity with the Q items (images) before Q sorting. They also expressed their uneasiness with the inability to move the images between the grid and the three boxes in addition to the researcher’s sole interest in questioning about specific images placed at the edges of the grid. In addition, they both illustrated and stated that usage of thumbnails makes image recalls easier, saves space, and enhances faster comparisons between images (Figure 2). Last but not least, they requested a status tracker, to display their progress in taking the survey.
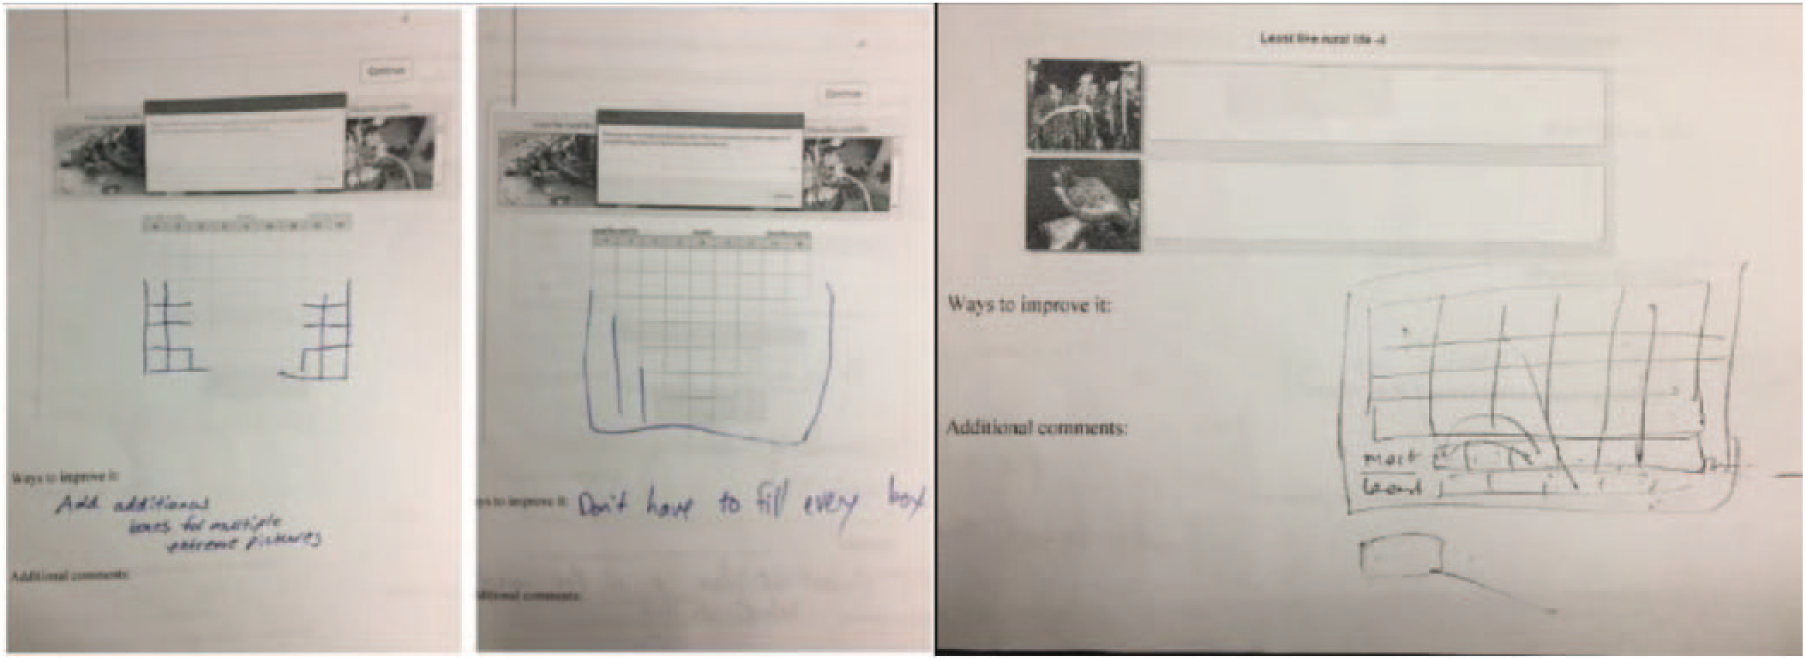
Participants’ drawings on the post-test questionnaire.
Furthermore, the post-test questionnaire also revealed that on a scale of one (easy) to five (difficult) the participants found Q sorting more difficult (M = 2.05, SD = .99) than pre-sorting (M = 1.47, SD = .69), reflecting about images (M = 1.35, SD = .83), and answering the complementary questionnaire (M = 1.05, SD = .12).
VQ survey interface improvements
Overall, the findings were weighed against the Q methodology rules and logics and accordingly the most feasible solutions were schemed and implemented before the reliability and methods agreement analysis in stage 2. Figures 3 to 5 showcase some main improvements on the VQ survey interface.
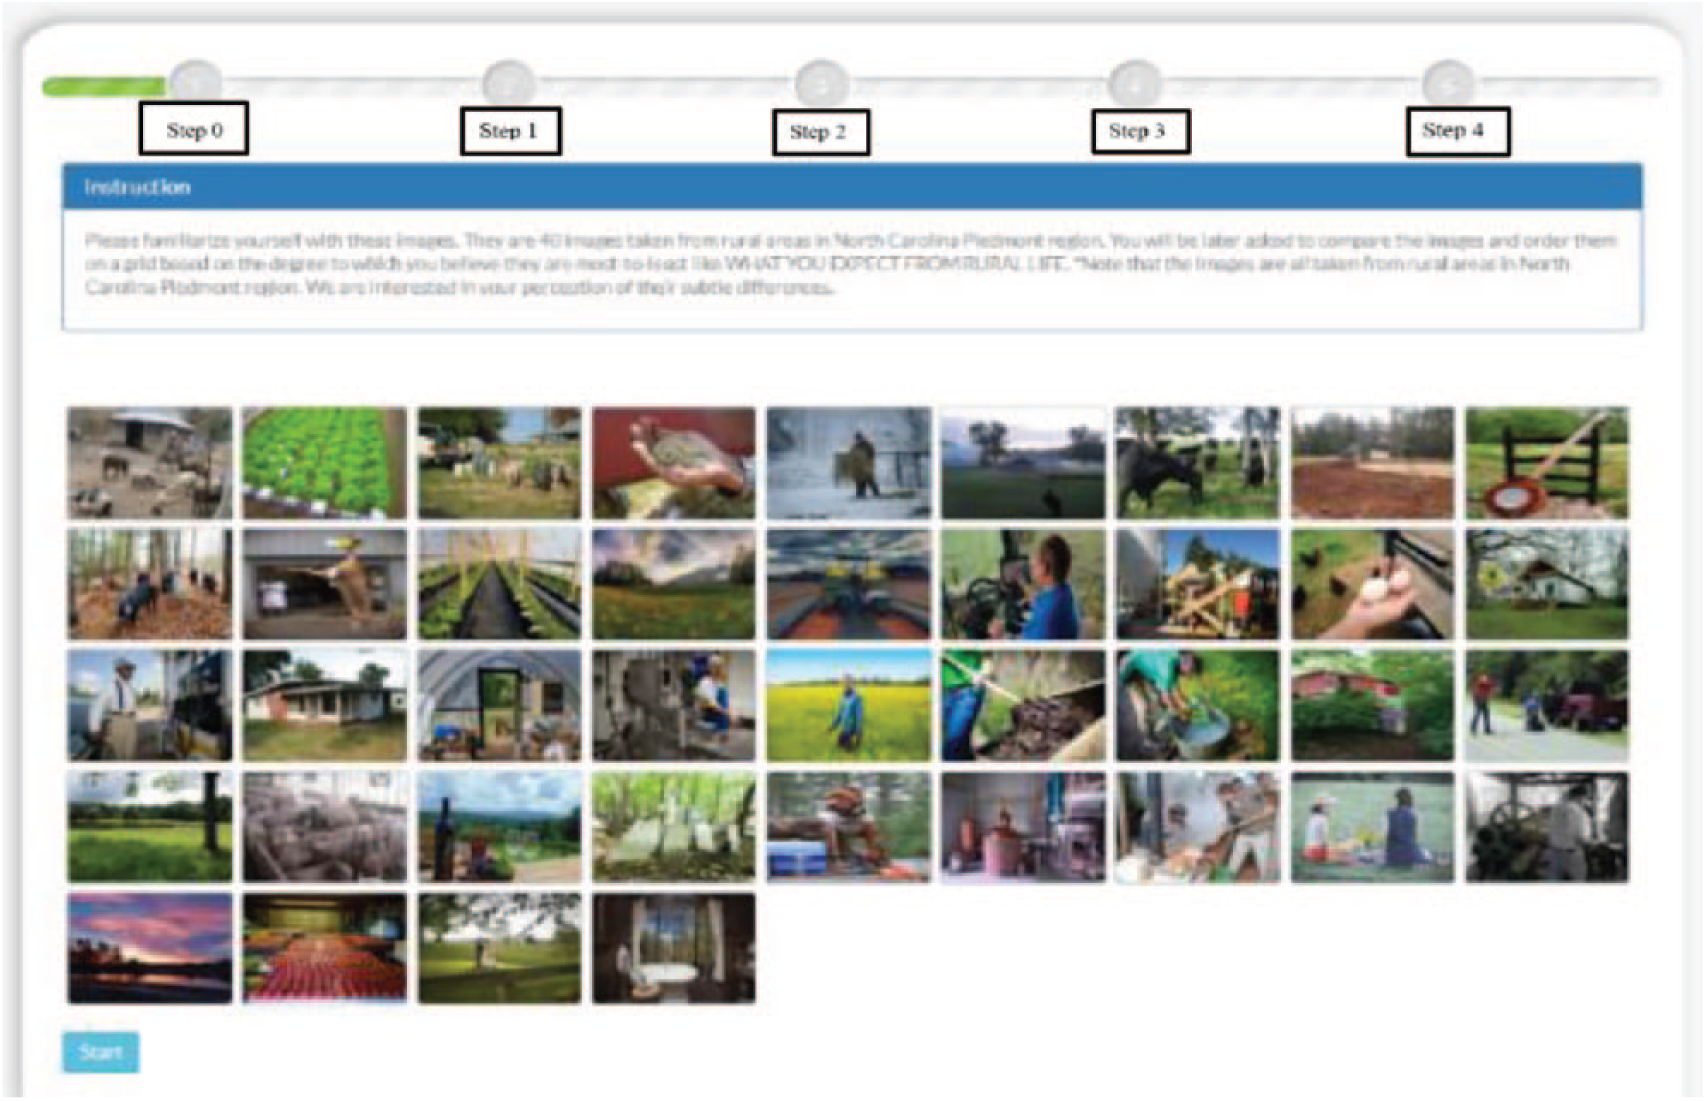
Familiarization with Q items and the topic.
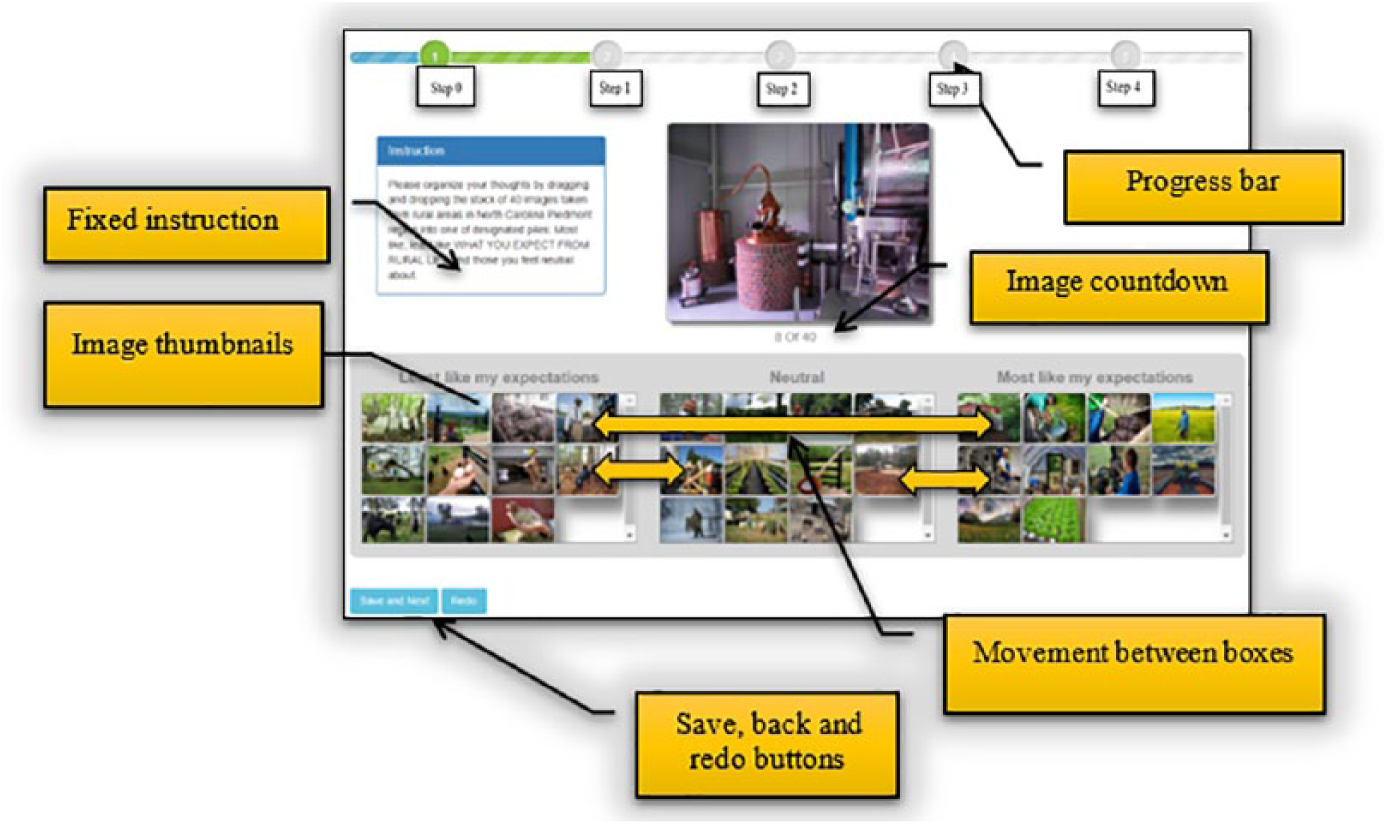
Dragging and dropping images into the three boxes.
Q sorting.
Among other improvements, a familiarization step was added right after the initial consent to help the participants develop an overall understanding of the topic and the Q items. Progress bar, image countdown, and some guiding messages were added to the body of the survey to highlight the survey status and prevent the disorientation of participants. Clickable thumbnails substituted big pictures, to demonstrate more pictures together and make their comparative judgment easier. The drag and drop of Q items between and within the three boxes and grid cells were improved in a fashion to simulate sorting on a sheet of paper. The option of including video instead of textual instructions to the body of the survey was to moderate the pure detachment of researcher, giving him or her an opportunity to convey the expected duties better.
Stage two: reliability analysis
The purpose of this stage was to examine the reliability of the VQMethod online research tool through a test–retest analysis. The Q method research seeks to identify and distinguish between extant viewpoints surrounding a topic. Nonetheless, this recognition will be invalidated if the individual Q sorts are unreliable.
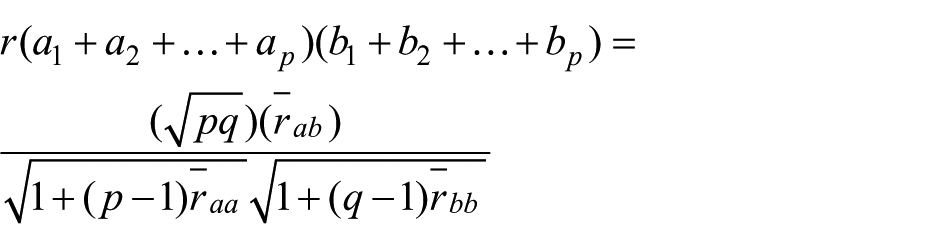
The composite reliability of Q sort items (K) affects the factor reliability (rxx) (P = number of Q sorts significantly loaded under factor), which in turn sets a basis for the calculation of the standard error of factor scores (SEfs) (S x = standard deviation (SD) of Q sorts). Next, the SEfs of each factor is used in the calculation of standard error of the differences (SED x–y ) between two factors. The SED x–y multiplied by significance level, that is, 1.96 (p < .05) or 2.58 (p < .01) and rounded to the nearest whole number will determine the Q items which distinguish one viewpoint from others (Figure 6) (McKeown and Thomas, 2013).

A series of dependent formulas to identify distinguishing Q items.
Sample and data collection
To evaluate the reliability of the VQMethod online research tool, a convenient sample of 37 undergraduate students were recruited for their voluntary participation in the study. It was stressed that the research would be anonymous and voluntary and would not affect their grades and/or student–professor relationship. They were aged between 18 and 24, comprised 19 females and 16 males, and two students who did not specify their gender. It constituted 3 African-Americans, 1 Asian, 30 Caucasians, 2 Hispanics, and 1 Palestinian. They took two similar VQ surveys in two phases 1 week apart (Times A and B) in a classroom setting. They either used their own laptops (mostly MacBook) or their university laptops (Hp 14″ Chromebook).
The VQMethod automatically saved the total and stepwise time for each survey. The relative efficiency of the VQ survey was calculated through the ratio of the time taken by the users who completed the task over the total time taken by all the users (Seffah et al., 2006). The effectiveness of the VQMethod was measured by computing the ratio of completed surveys over the total number of surveys multiplied by 100 (success rate).
The participants’ overall satisfaction with the VQ survey interface was measured with the 10-item, 5-point Likert-type System Usability Scale (SUS), including 10-item, 5-point Likert-type scale questions adapted from the US Patent and Trademark Office to be distributed to the students after completing the VQ survey. The SUS developed by Brooke (1996) is a reliable and valid measure of user satisfaction (Kortum and Bangor, 2013), which promotes the comparison of the usability of different systems by generating a 0–100 score (Kortum and Bangor, 2013).
Data analysis
Three measures were considered for assessing the reliability of the VQMethod: the composite reliability of the VQ sorts, stability of participants’ viewpoints, and stability of number of factors (viewpoints).
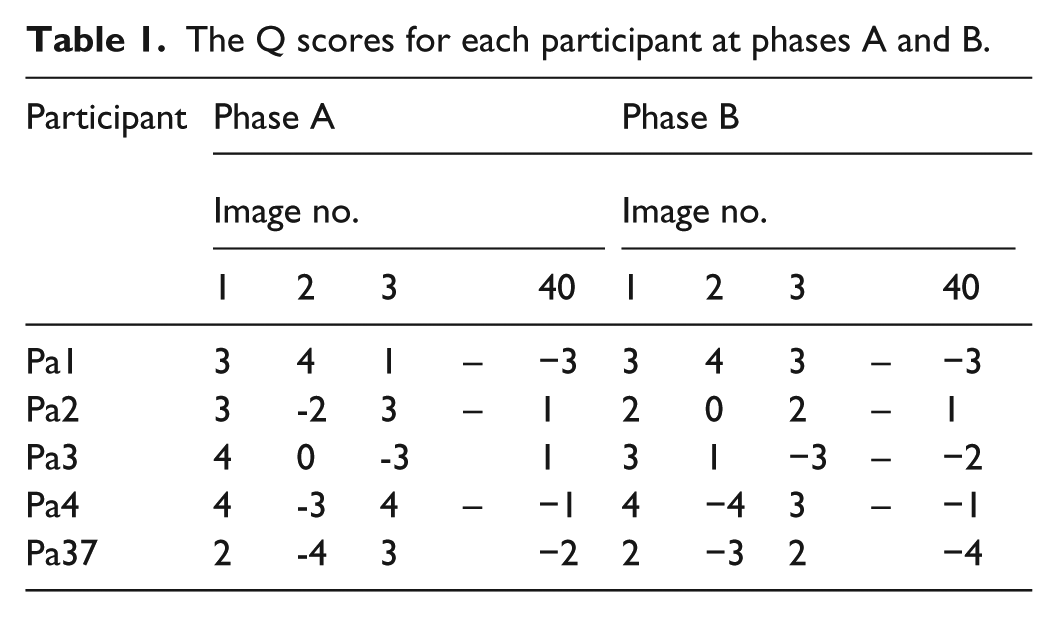
Each Q item having an identification number, their placements in the grid at Times A and B for each participant were recorded and exported into an Excel sheet by the VQMethod platform (Table 1). Next, all the VQ sort data at Times A and B were combined and entered in the KenQ online data analysis software. A series of Pearson product–moment correlations were performed, and a matrix of inter- and intra-participant correlations was created, cross-tabulating the data from Times of A and B.
The Q scores for each participant at phases A and B.
Subsequently, they formed a matrix sized 74 × 74: (total number of VQ sorts at Times A and B) × (total number of VQ sorts at Times A and B). Next, the mean correlation between all different pairs at Time A (
The test–retest correlation matrix.
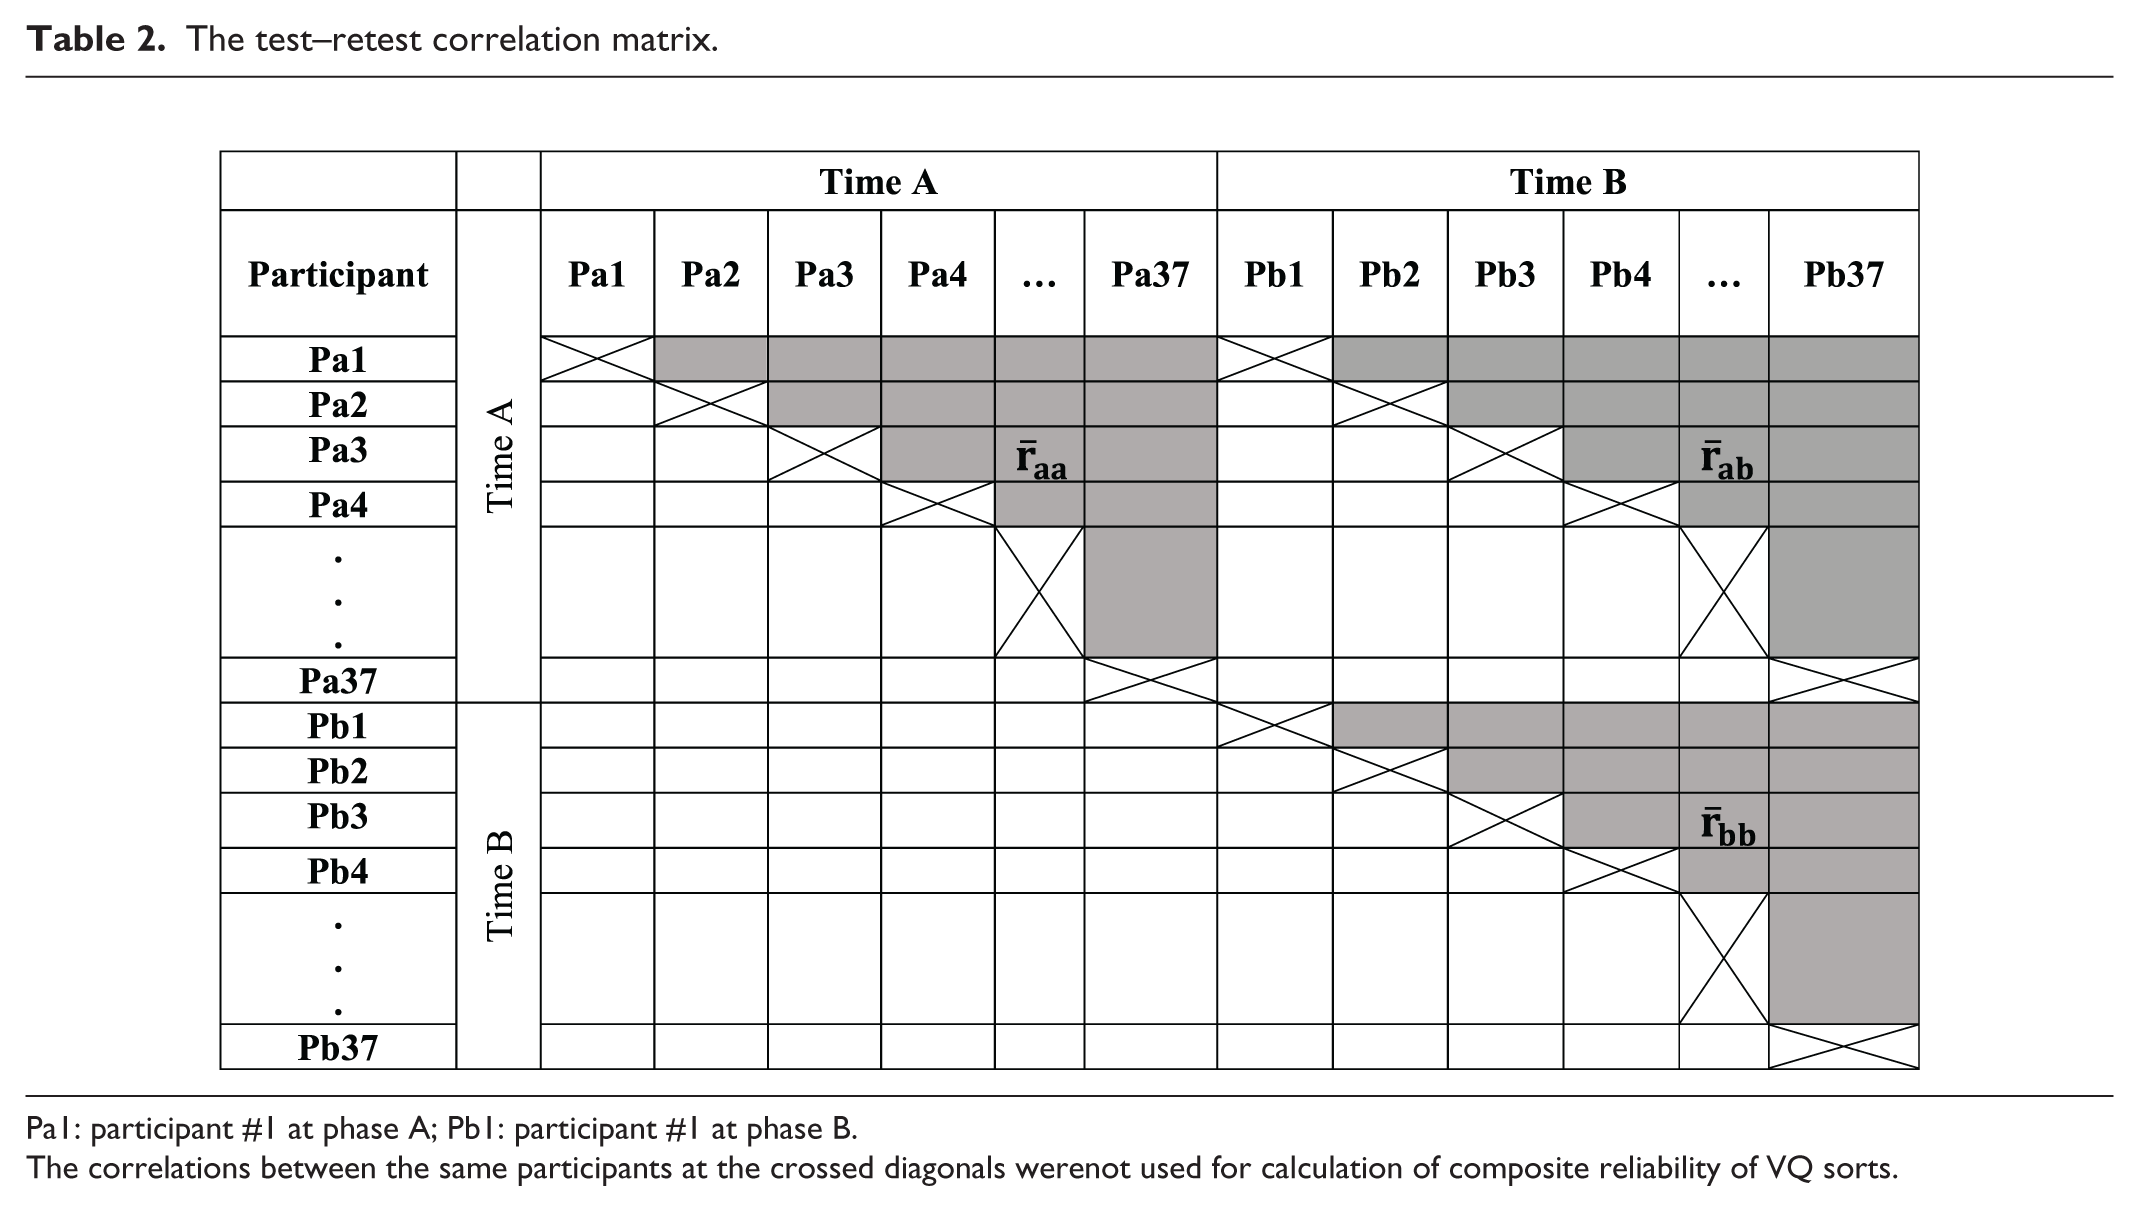
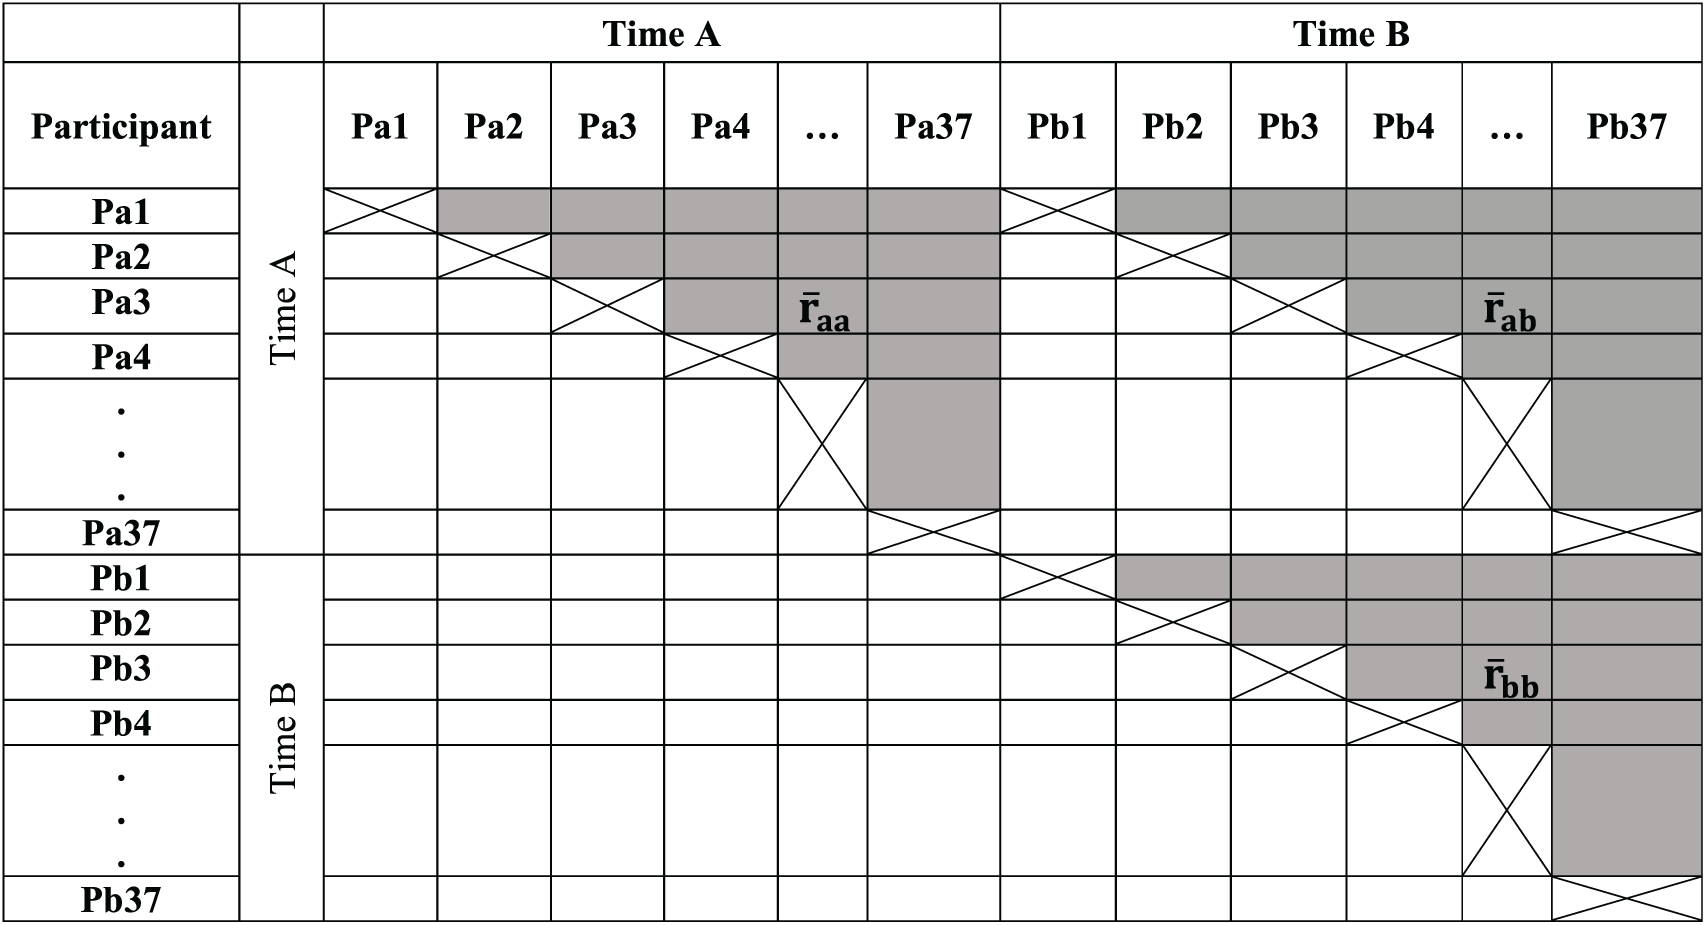
Pa1: participant #1 at phase A; Pb1: participant #1 at phase B.
The correlations between the same participants at the crossed diagonals werenot used for calculation of composite reliability of VQ sorts.
In testing hypothesis one, the factor stability was measured by comparing the number of factors (viewpoints) extracted from factor analysis of VQ sorts. For this, both combining and separating the VQ sort data at Times A and B were examined. In testing hypothesis two, the patterns of defining sorts (participants’ VQ sorts significantly correlating with a factor) at Times A and B were compared using the McNemar’s test of significance. Finally, in testing hypothesis three, a linear regression analysis was conducted to examine if the time spent on VQ surveys predicts the reliability of the resultant VQ sorts.
Hence, two separate factor analyses were performed at Times A and B, via principal component analysis as a method of factor extraction and varimax rotation (Stephenson, 1935). Eight factors with eigenvalues above one were kept for further consideration (Shinebourne, 2009). If the number of defining sorts per factor was equal to or above 2, they were kept for further analysis (Brown, 1980).
Findings
Composite reliability of VQ sorts
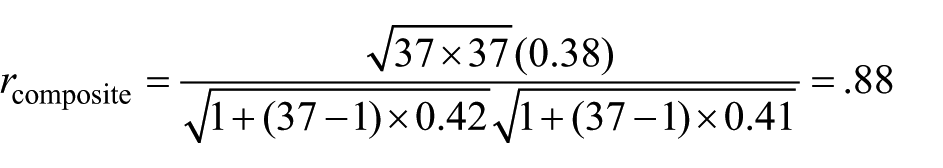
The composite reliability of the VQ sorts was calculated via Spearman’s (1913) formula for the correlation of sums or differences (p = number of sorts at Time A, q = number of sorts at Time B) (Brown, 1971). The correlations between all different pairs averaged at .42, .41, and .38 at Times A (
Factor stability
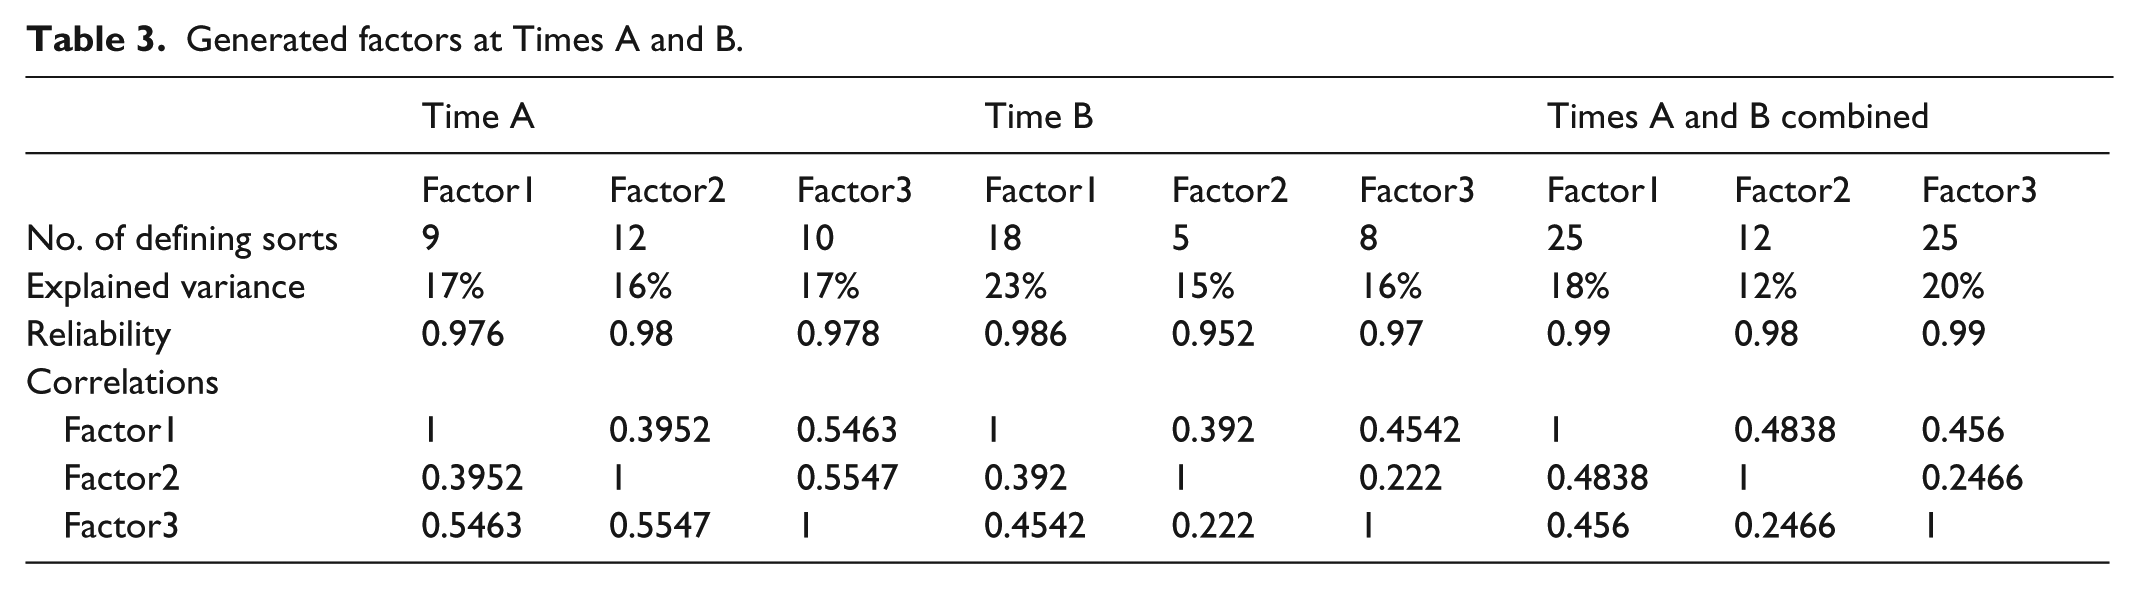
Both the combined and the separate factor analysis of the VQ sorts at Times A and B generated a similar number of factors (three) with composite factor reliabilities of over 95%. A factor should have at least five defining sorts, eigenvalue above one, and seem theoretically sound (Brown, 2002). The VQ sort factor loadings that exceeded
Generated factors at Times A and B.
Comparing the pattern of defining sorts, separate and combined.
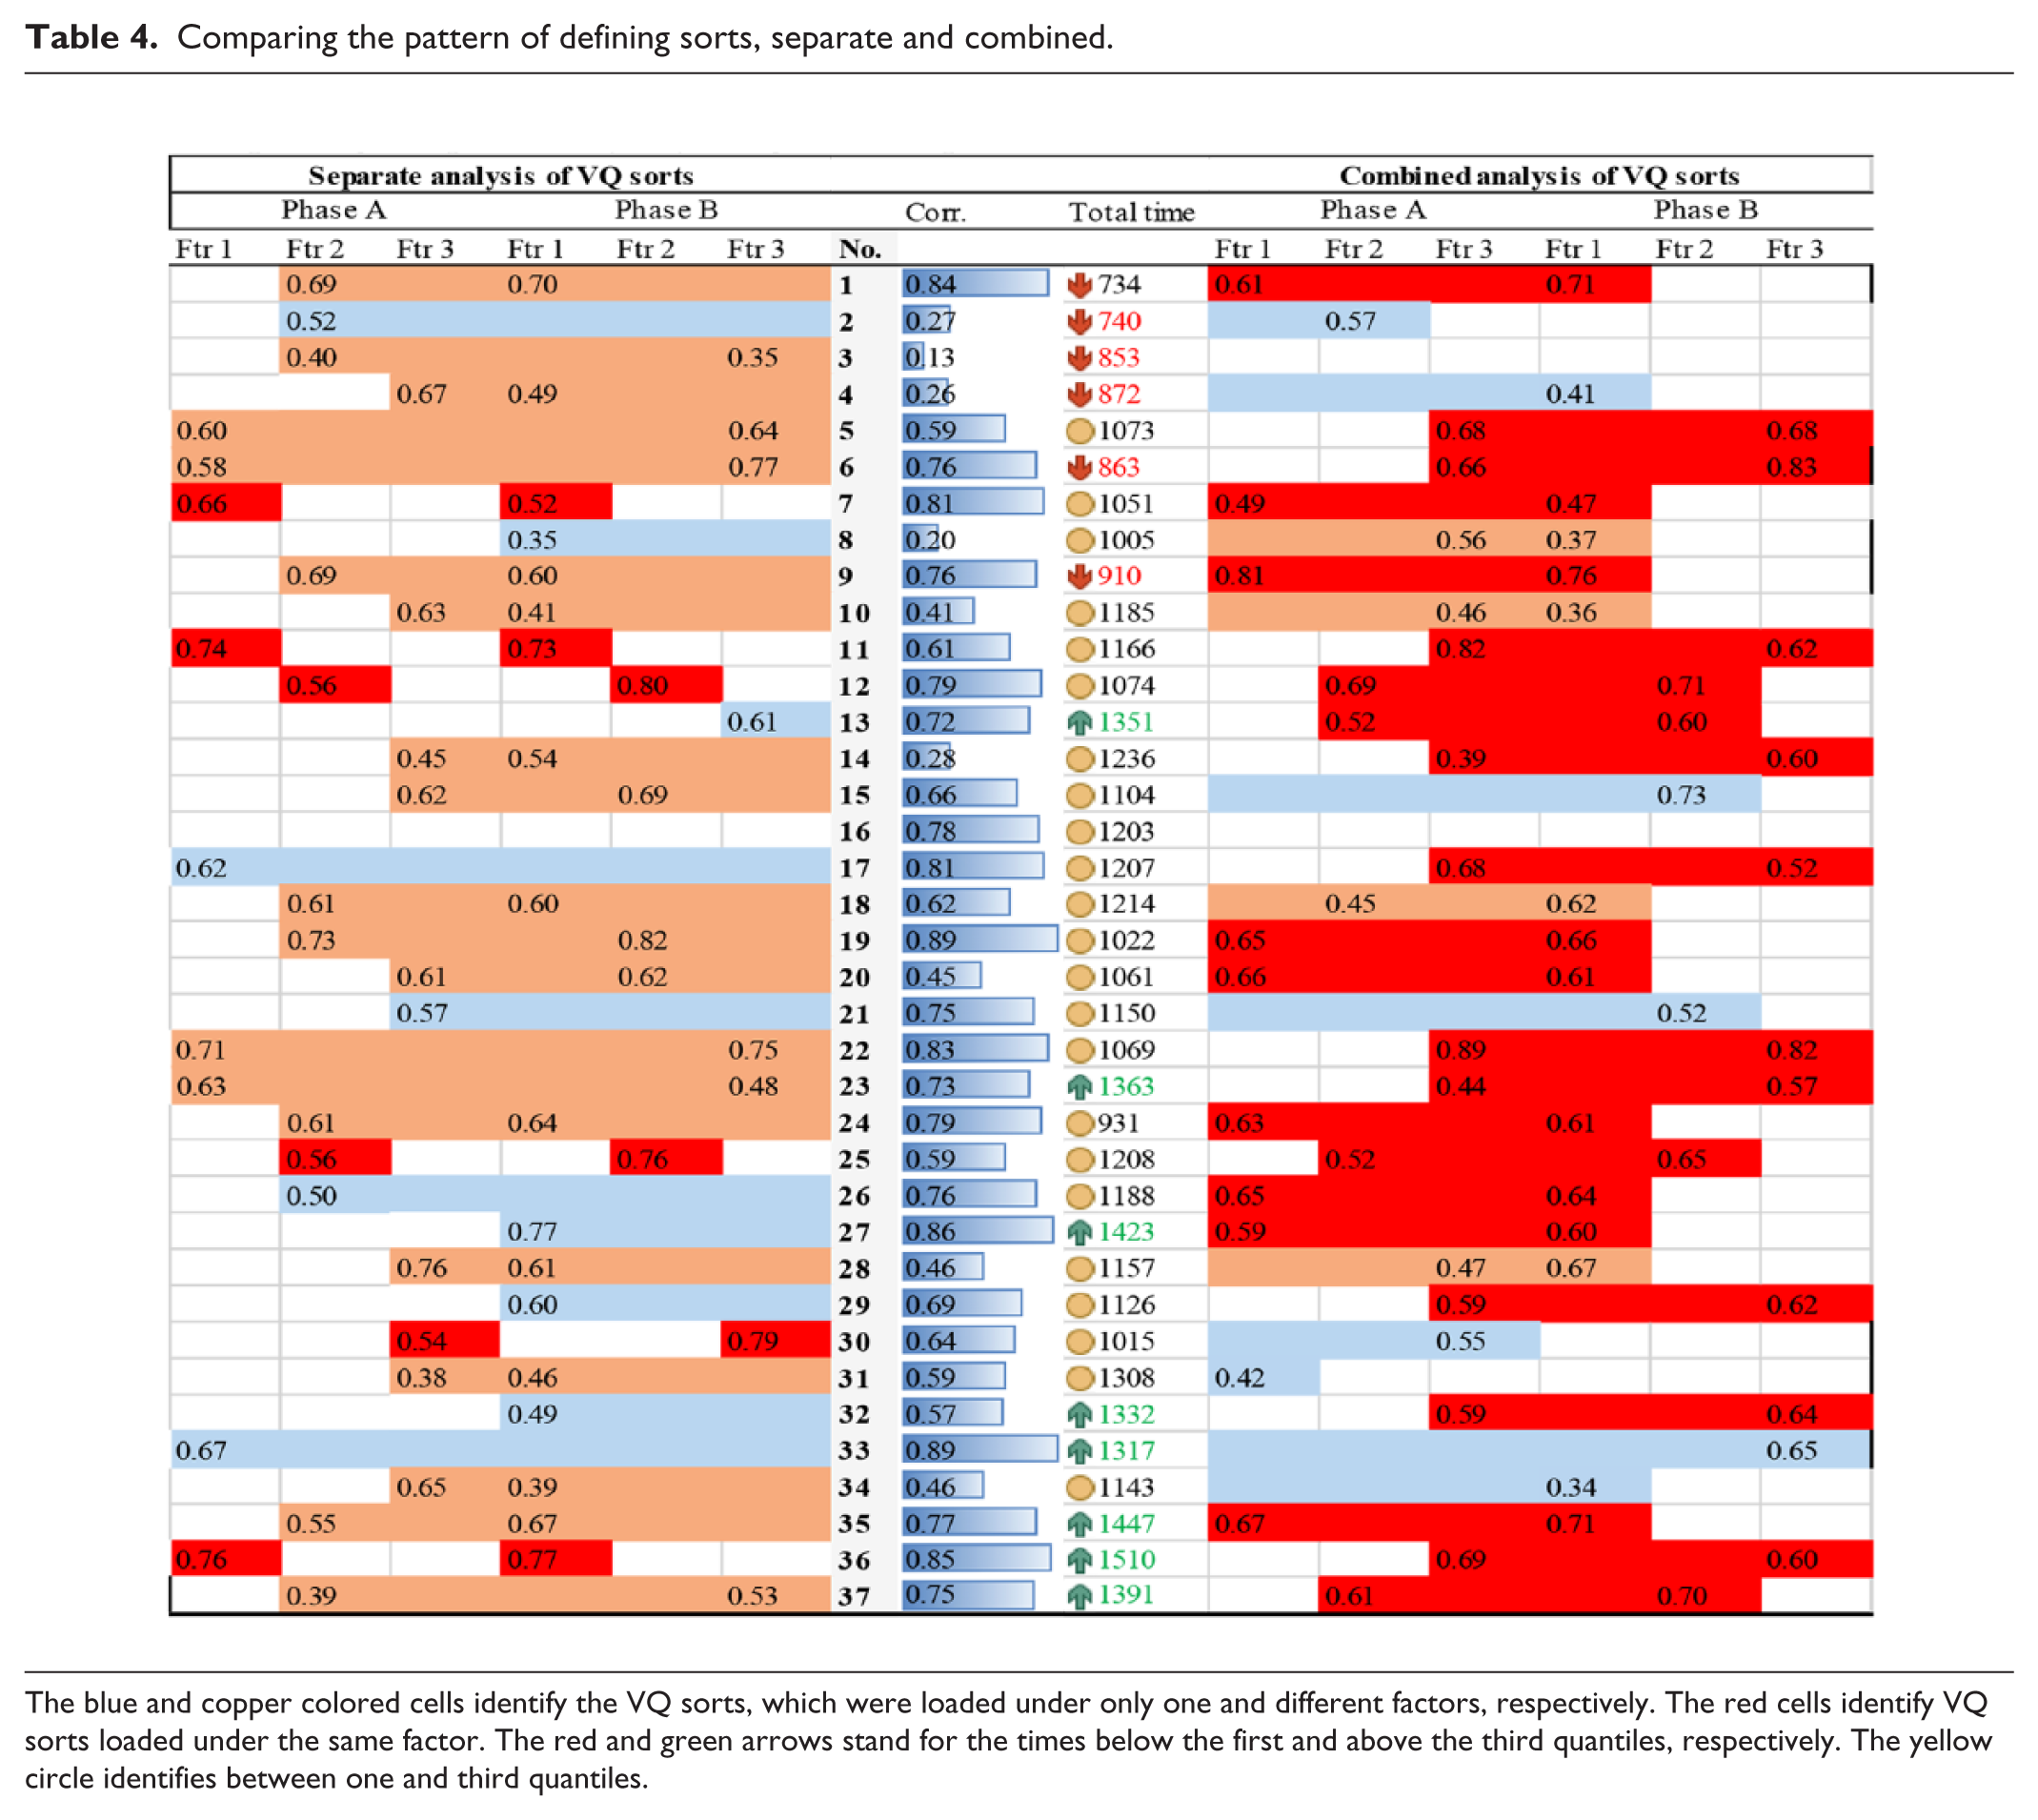
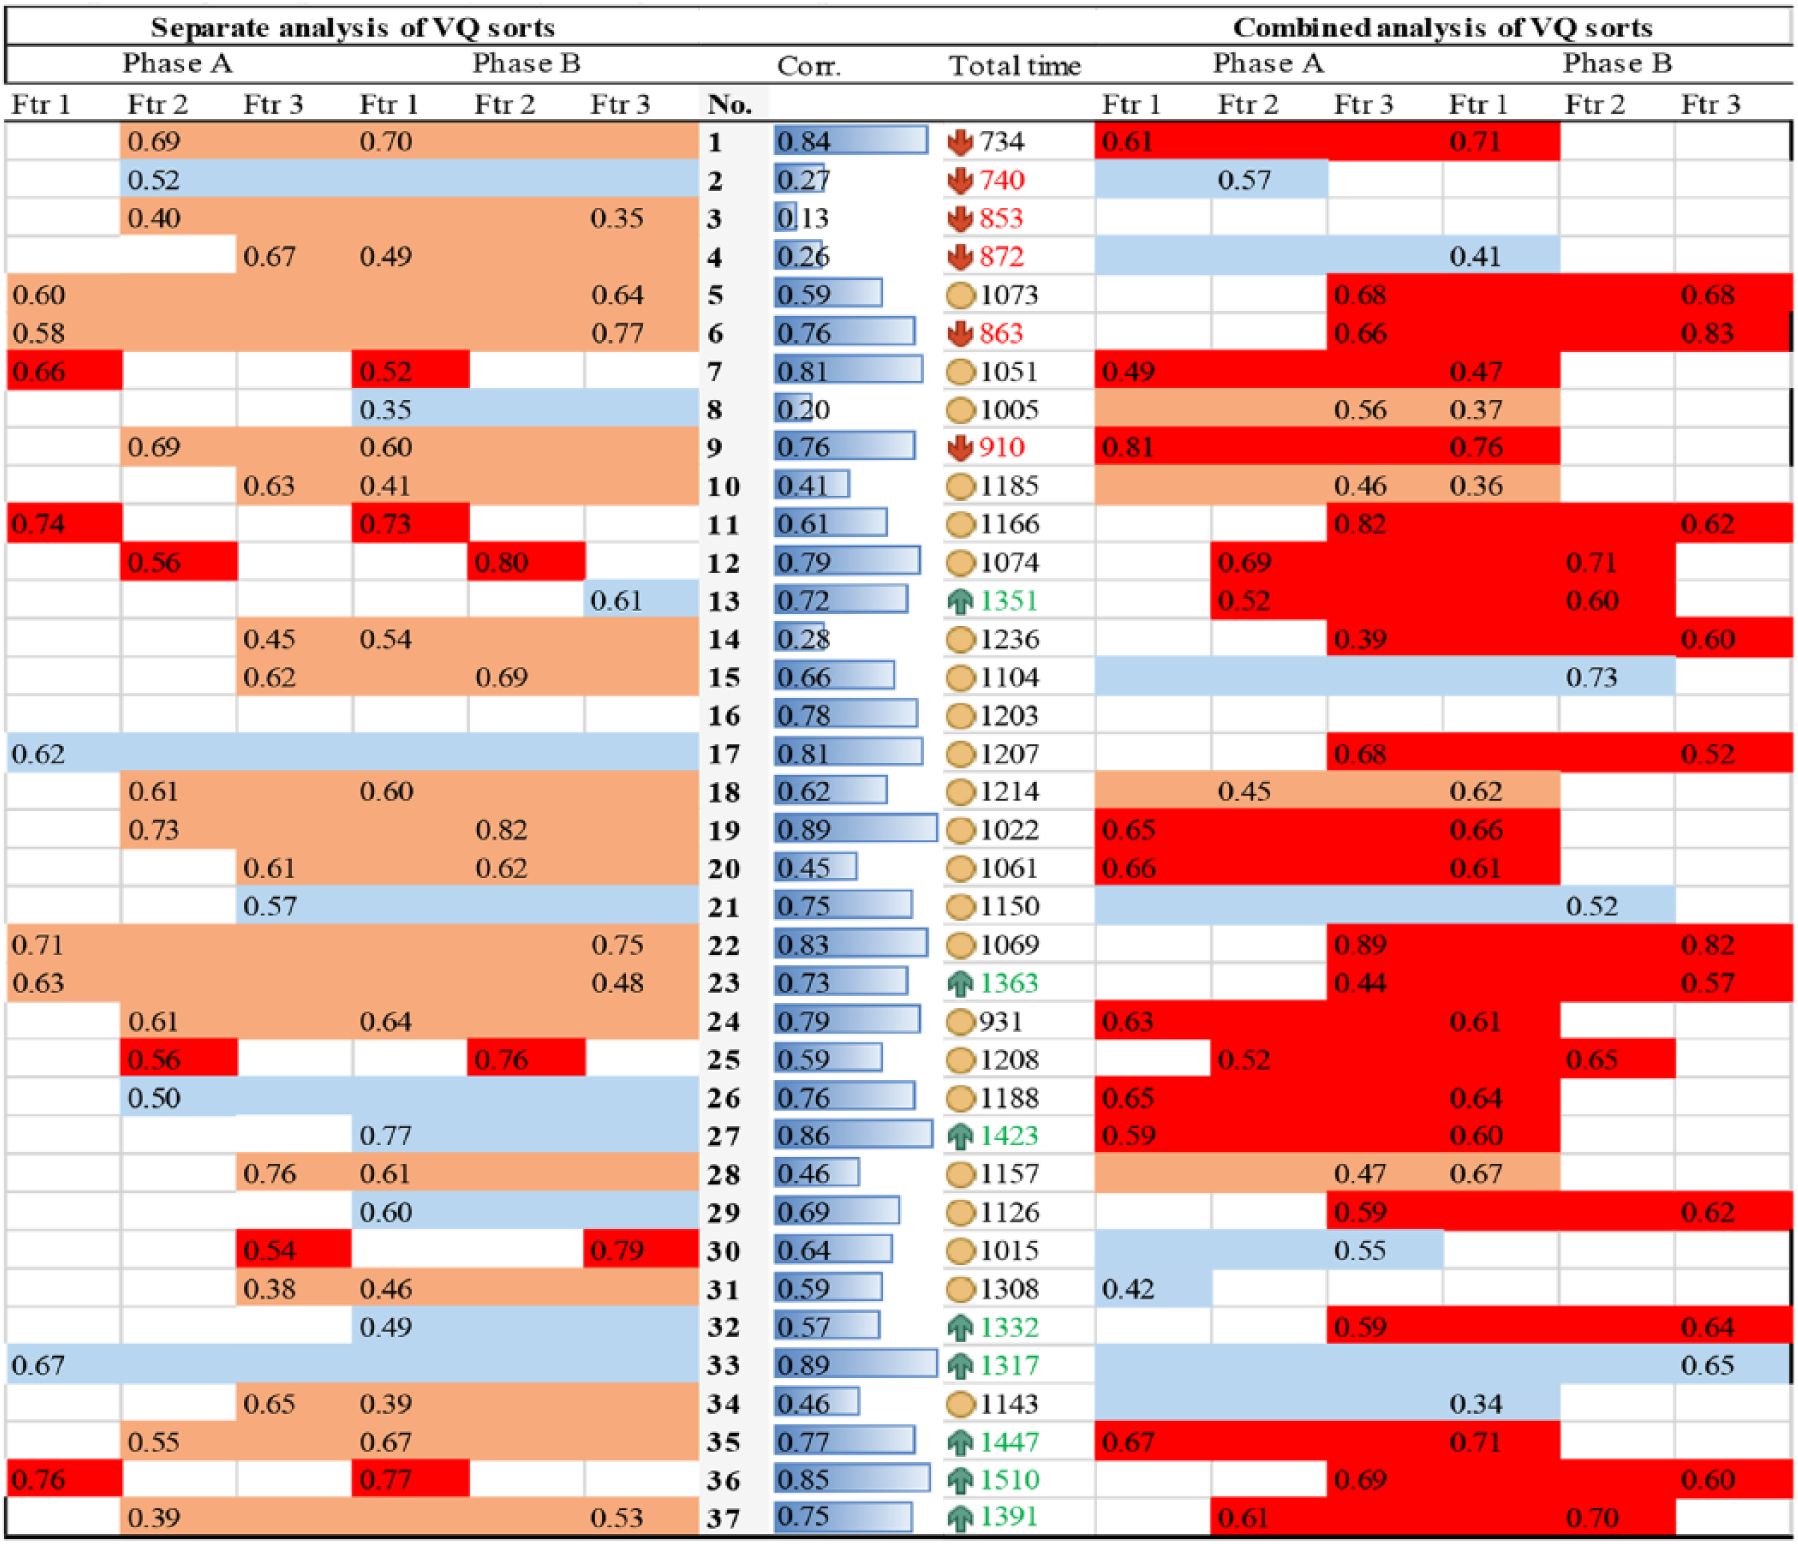
The blue and copper colored cells identify the VQ sorts, which were loaded under only one and different factors, respectively. The red cells identify VQ sorts loaded under the same factor. The red and green arrows stand for the times below the first and above the third quantiles, respectively. The yellow circle identifies between one and third quantiles.
In analyzing the pattern of defining VQ sorts, the extracted factors and constituent defining sorts were positioned side by side at Times A and B. Each row represented a person’s correlation with the factor (factor loading). The visual comparison of the pattern of defining sorts (highlighted by red cells) revealed marked discrepancies between Times A and B when VQ sorts were separately analyzed. However, the pattern of defining VQ sorts after the factor analysis of combined VQ sorts revealed high similarity (Table 4).
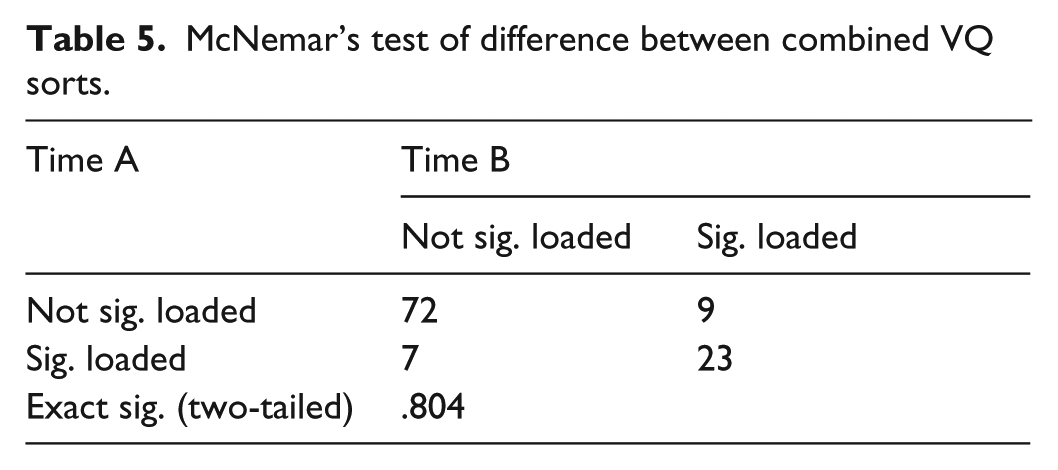
For the combined model, McNemar’s test of significance for the within-subject binary dependent variable (1 = loaded under the same factor and 0 = loaded under a different factor) was used to examine the difference in the pattern of participants’ factor membership (Table 5). The results indicate that the participants’ factor membership did not change significantly over the period of 1 week between two tests (p = .80). Hence hypothesis two was conditionally accepted that the viewholders remain alike, only if the VQ sorts are combined, and factor analyzed.
McNemar’s test of difference between combined VQ sorts.
Effect of time on reliability of VQ sorts
In testing hypothesis three, a linear regression was run to recognize the effect of the average time taking the surveys (independent variable) on the correlation of VQ sorts at Times A and B (dependent variable) as a measure of reliability. On average, participants needed twice as much time (in seconds) to accomplish the VQ survey at Time A (M = 779.78, SD = 158.45) than Time B (M = 412.19, SD = 78.47). Participants on average spent more time on Step2 (M = 160.22, SD = 47.36), then on Step 3 (M = 222.95, SD = 83.34), then on Step 4 (M = 149.87, SD = 138.28), and on Step 5 (M = 47.41, SD = 20.21). Time for Step 1was not recorded.
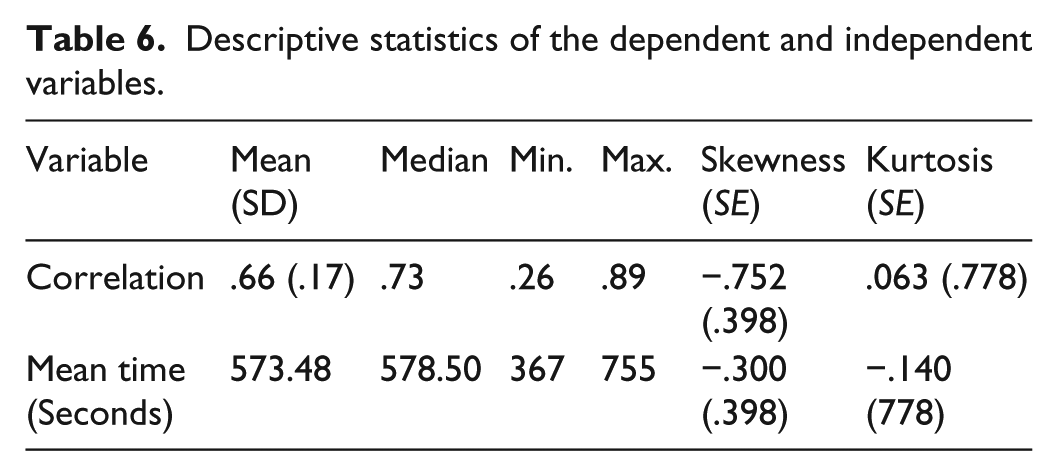
To assess linearity, some preconditions were met. The scatterplot of the average total time taking the surveys against the correlation of VQ sorts with superimposed regression line indicated a positive linear relationship. Also, there was no observable correlation in the residual-by-predicted plot—the spread of residuals around zero was balanced (Figure 7). Dividing skewness by standard error of correlations (−.752/.398 = 1.89) and mean time (−.300/.398 = .75) being less than ±1.96 (p < .05) indicated an acceptable normal distribution (Table 6) (Mertler and Reinhart, 2016). The box plot inspection of the correlation (dependent variable) showed the presence of two outliers (rp1 = .13 and rp8 = .20) which were removed from the analysis. Furthermore, the box plot inspection of mean time (independent variable) suggested the removal of P36 for being an outlier in Steps 1 and 2 (Figure 8).
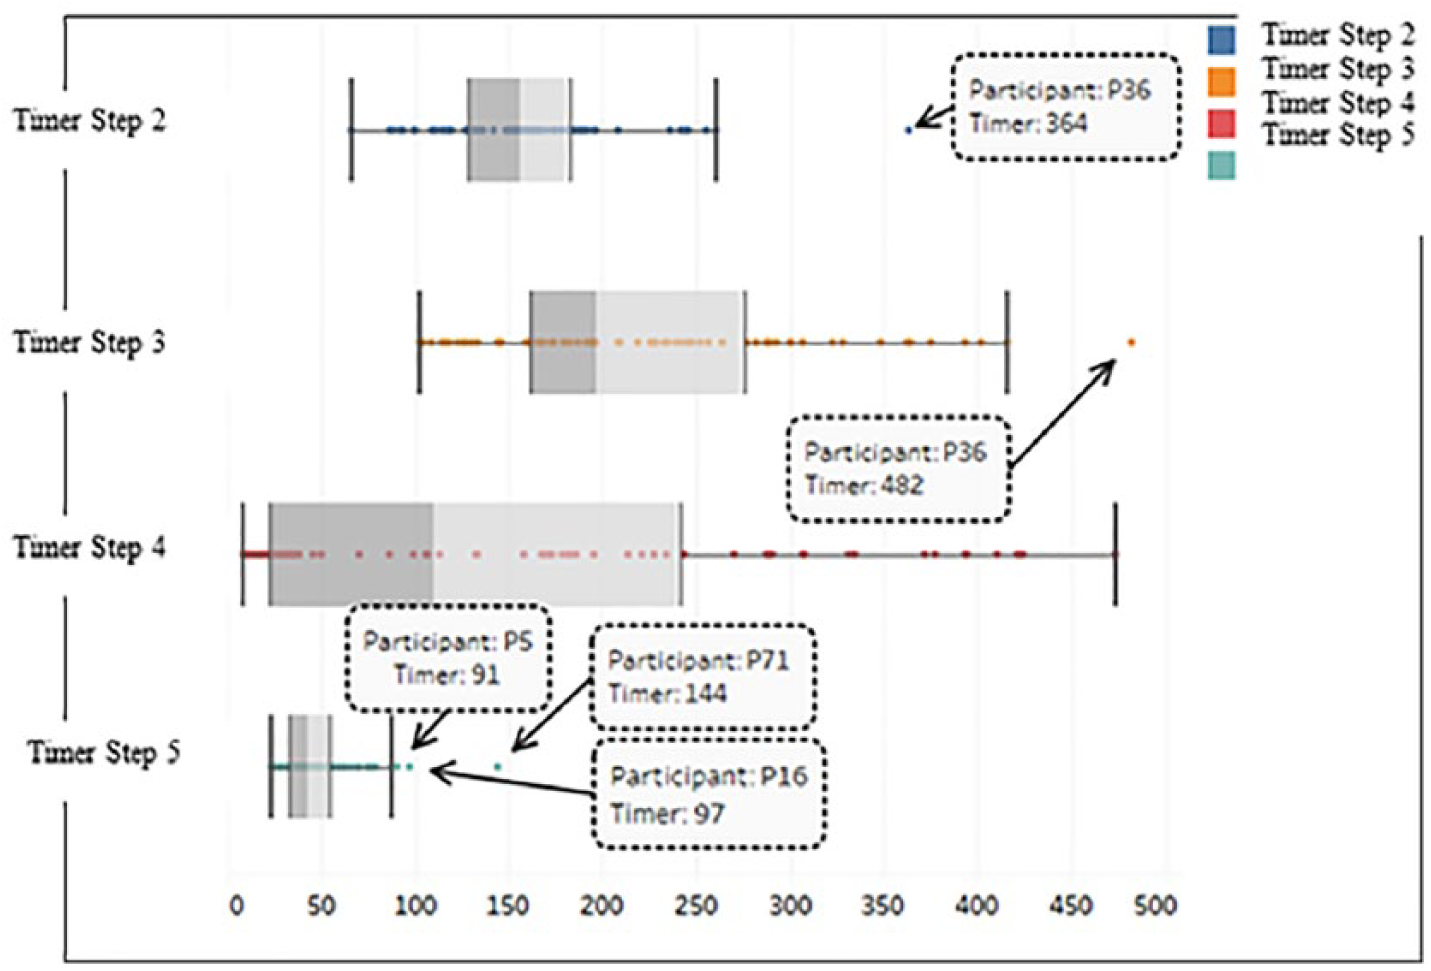
The identification of outliers.
Descriptive statistics of the dependent and independent variables.
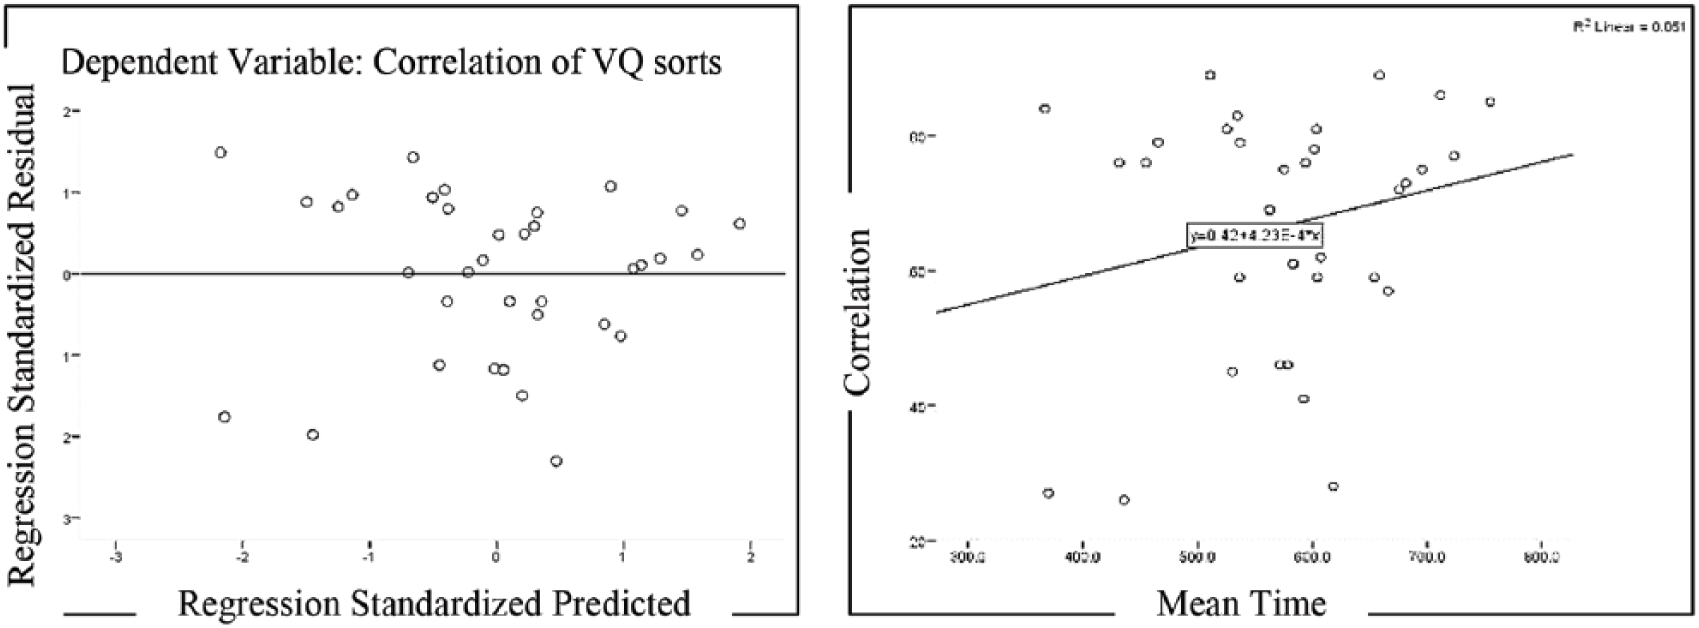
Residual by predicted plot (left). Average time–correlation scatterplot (right).
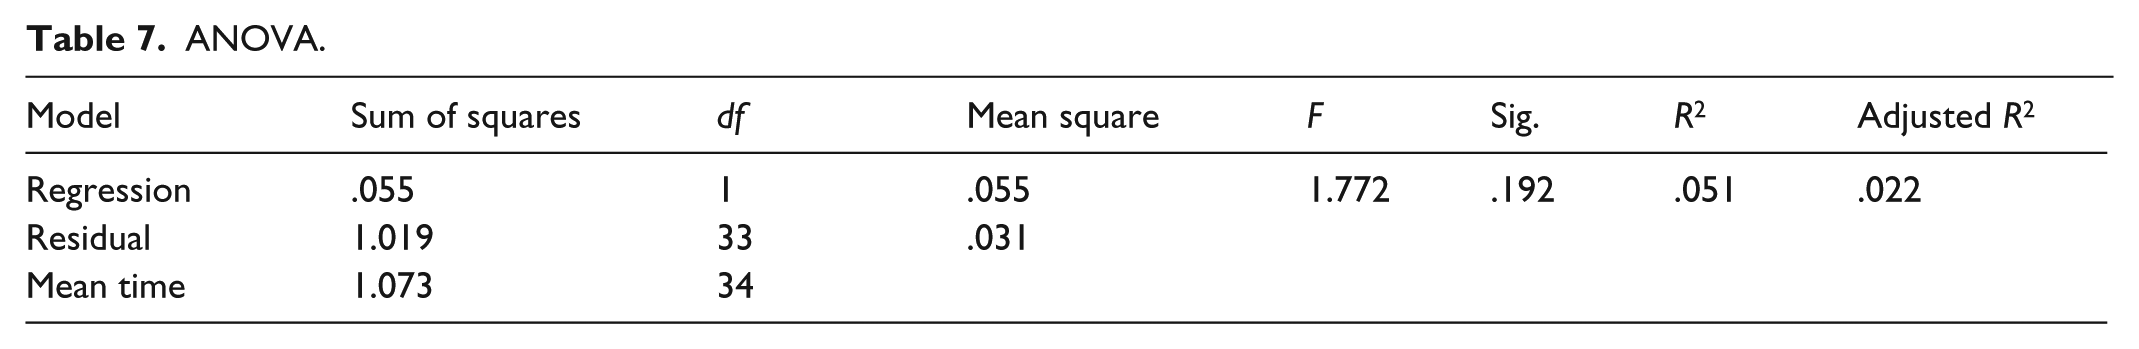
The results show that the average total time taking two surveys did not significantly predict the correlation of VQ sorts (reliability estimate), F(1, 35) = 1.772, p < .05. The average time accounted for 5.1% of the variation in VQ sorts’ correlations with adjusted R2 = 2.2% (Tables 7 and 8, which according to Cohen (1988) is a small effect size (hypothesis three rejected).
ANOVA.
Simple regression model for correlation coefficient of VQ sorts (n = 37).
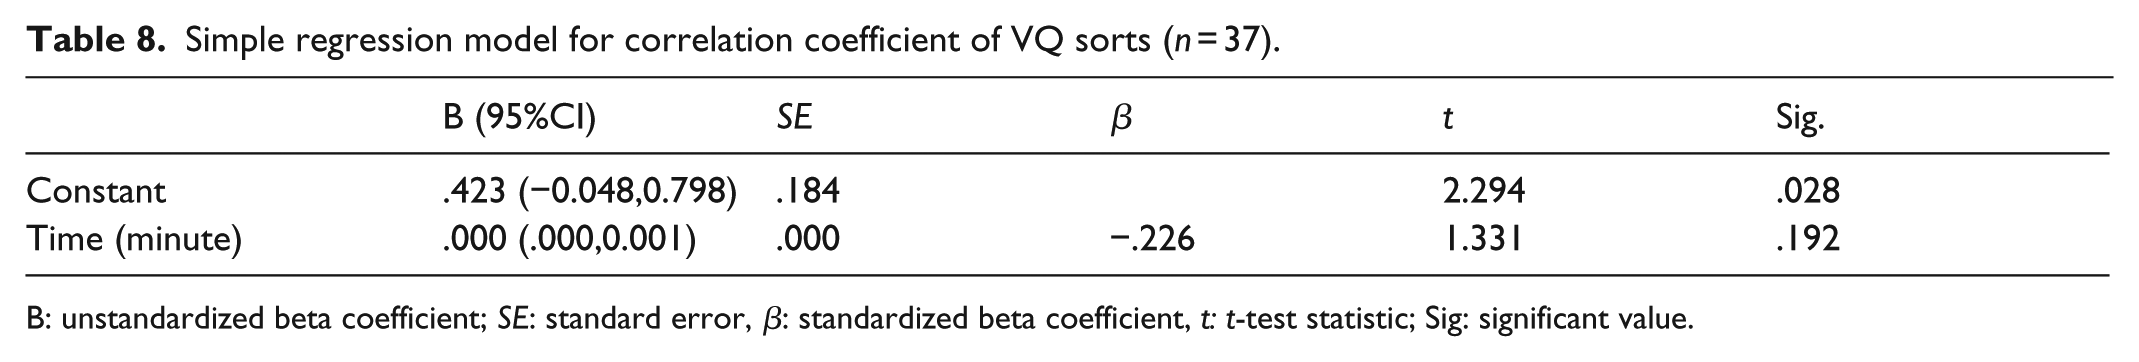
B: unstandardized beta coefficient; SE: standard error, β: standardized beta coefficient, t: t-test statistic; Sig: significant value.
Overall satisfaction, effectiveness, and relative efficiency
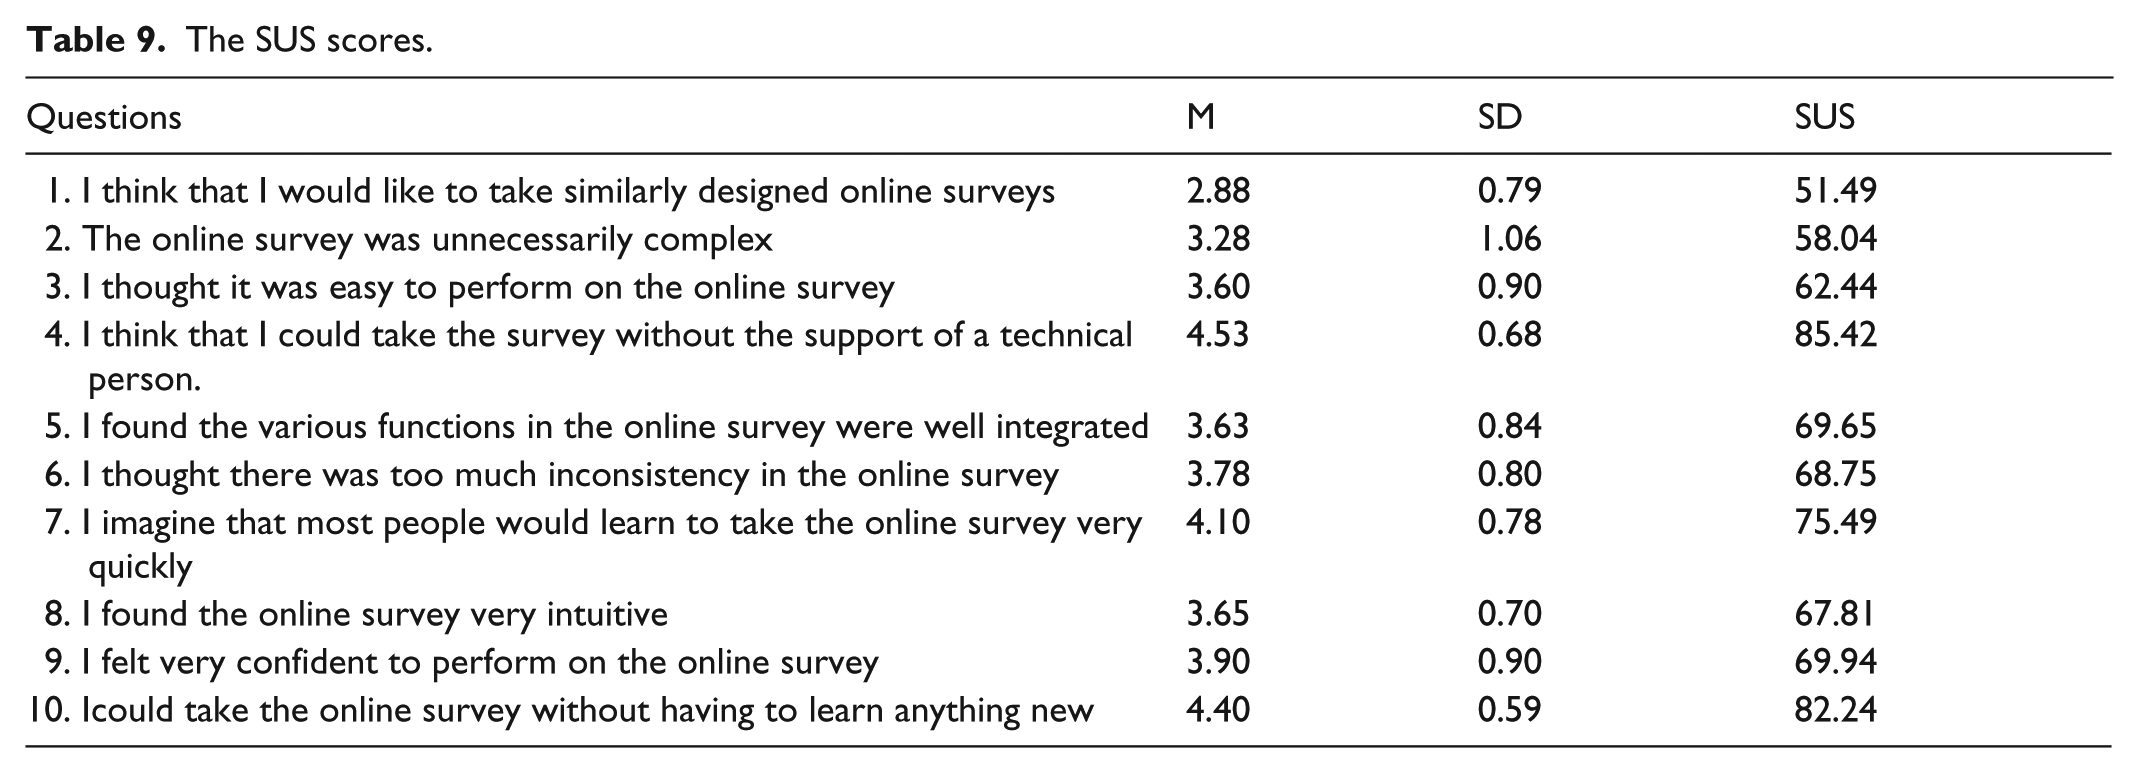
In this test, all the students were able to finish the survey. Therefore, 100% relative efficiency and effectiveness were recorded for the VQ survey. The results of the SUS questionnaire on the VQ survey interface uncovered its above-the-average score (above 68%)—a cutoff score for comparing the usability of different systems (M = 69.31, SD = 10.65) (Alomar et al., 2016). This finding was notable, provided that Kortum and Bangor (2013) in their evaluation of 14 everyday products reported an average SUS score of 56.5% for Excel, 74.6% for PowerPoint, 78.5% for iPhone, and 81.8% for Amazon.
The most impactful item in improving the participants’ overall satisfaction was their sufficiency in completing the VQ survey (4th question) (M = 4.53, SD = .68). Indeed, this finding is highly promising for an online research tool whose survey-takers cannot interact with the researcher or technician for assistance. In contrast, they gave the lowest scores to the first question (M = 2.88, SD = .79), which can be potentially attributed to their disinterestedness and/or sense of burden in retaking a survey in a short period (Table 9).
The SUS scores.
Stage three: methods agreement analysis
The purpose of this section was to uncover if the VQMethod can substitute the TPQM, that is, to provide identical results to the ones from TPQM. For this, a methods agreement analysis was performed to contrast the patterns of Q sorts and VQ sorts of 10 participants over two identical surveys and within a time frame of 1 week.
The methods agreement analysis sheds light on the extent to which one method systematically overestimates or underestimates the results of another method. Although the accuracy of beliefs (validity) is irrelevant to the Q method research (Kampen and Tamás, 2014), the agreement between the methods elucidates that Q method researchers can alternate between the VQMethod and the TPQM by knowing possible differences in their Q sort patterns (Berchtold, 2016).
Sample and data collection
A convenient sample of 10 students aged 18–24 was recruited to take a Q survey and a VQ survey in two phases. Five participants randomly started from the Q survey and five participants from the VQ survey. The Q survey was completed in a controlled private room on a rectangular table (Figure 9) and the VQ survey at their preferred location with access to the Internet. For each participant, the two rounds were completed within a 1-week to 10-day time frame. The participants taking the Q surveys were given a printed step-by-step instruction and consent form, identical to that of the VQ survey. The printed grid with a distribution of −4(3), −3(3), −2 (5), −1(6), 0(6), +1(6), +2(5), +3(3), +4(3) and three above-positioned boxes, sized a paper sheet of 28 × 32 in. The Q items were evenly sized at 4 × 4 in.
Student taking the paper-based survey.
Data analysis
The Bland–Altman (BA) diagram has been extensively used for analysis of the agreement between two measurement methods (Bunce, 2009). The resulting graph is a scatterplot, in which the Y-axis shows the difference and the X-axis represents the average of paired measurements. The BA diagram suggests that the 95% of differences should lie within ±2 SD of the mean differences. However, the BA diagram does not determine whether the agreement is sufficient or not. Nonetheless, it is possible to say that the difference is significant if the line of equality (Y = 0) does not lie between the confidence interval of mean differences.
Findings
The positioning of Q items in the grid (henceforth Q score) was recorded, and the differences and the mean Q scores were computed (Table 10). As a foundational prerequisite for the methods agreement analysis, for each method, the scatterplot of the mean and SD of Q scores at repeated measures were visually checked. The inspection did not demonstrate any pattern of relationship (Figure 10).
The schematic data entry for the Bland–Altman diagram.
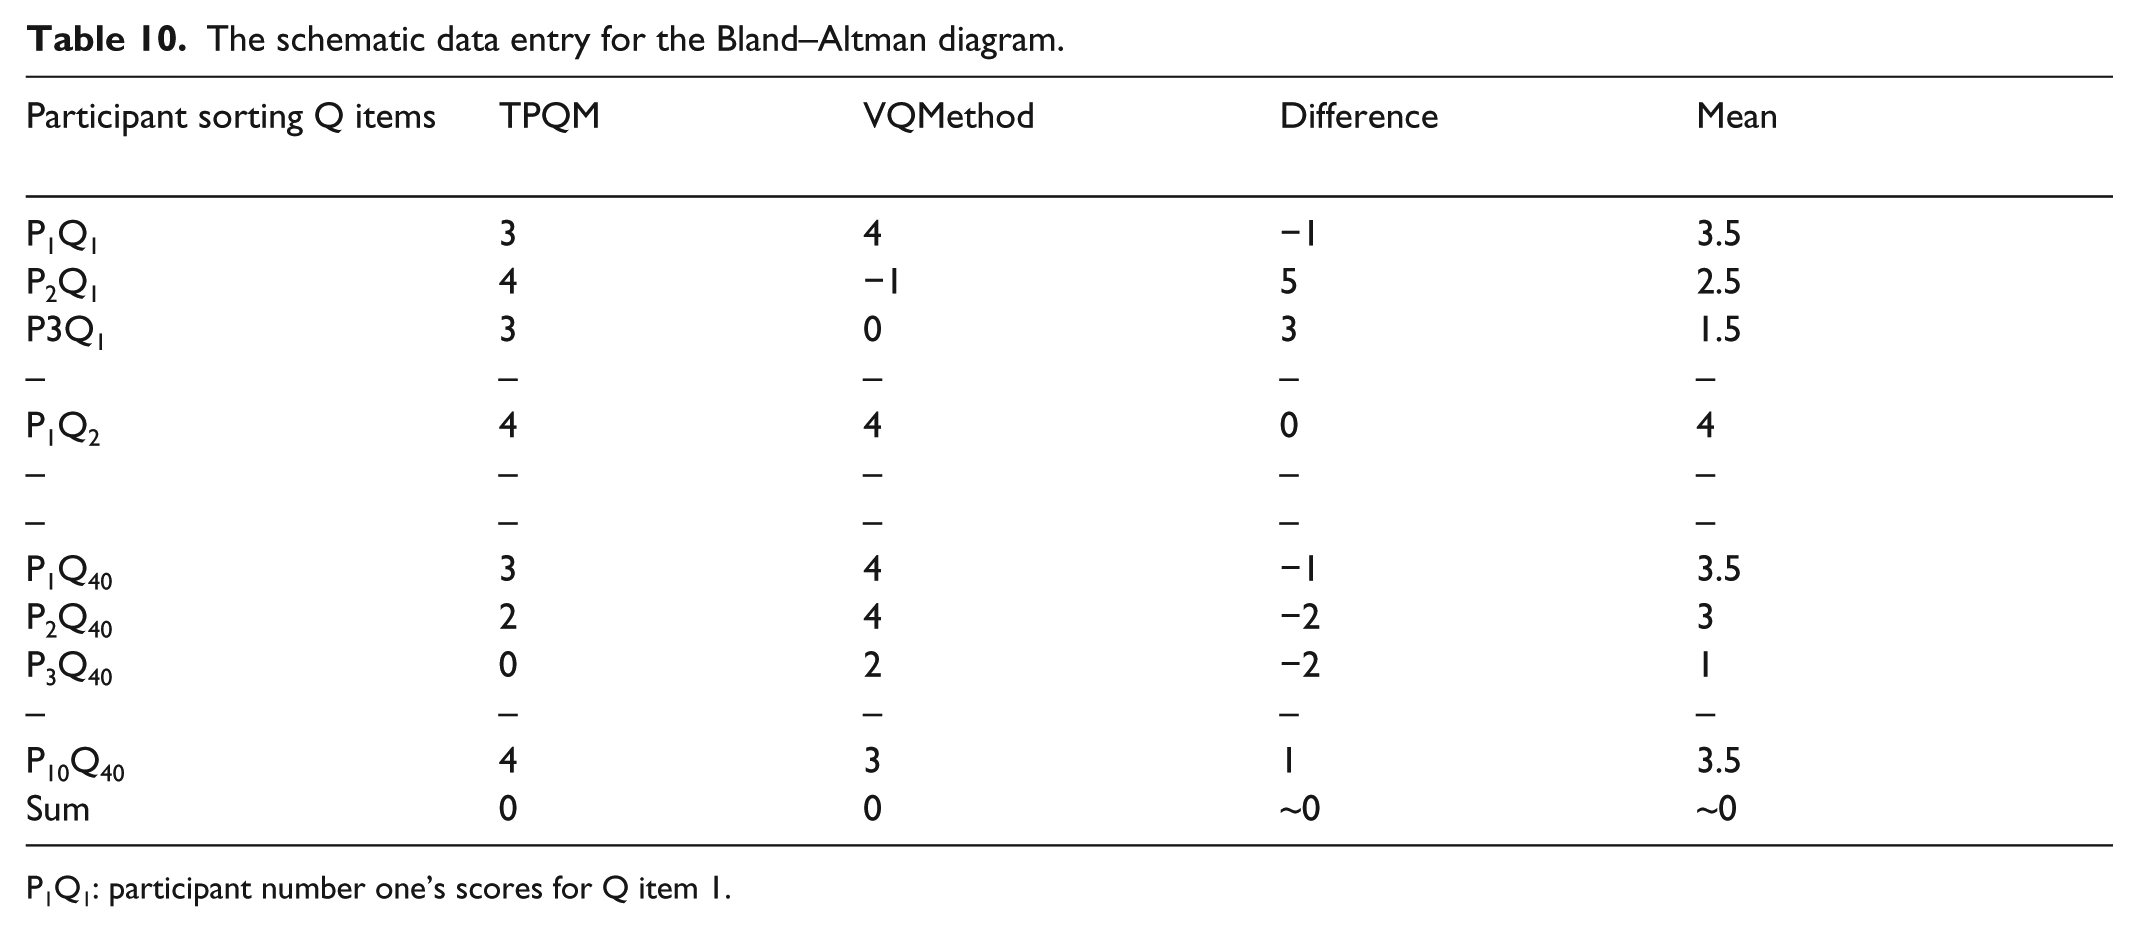
P1Q1: participant number one’s scores for Q item 1.
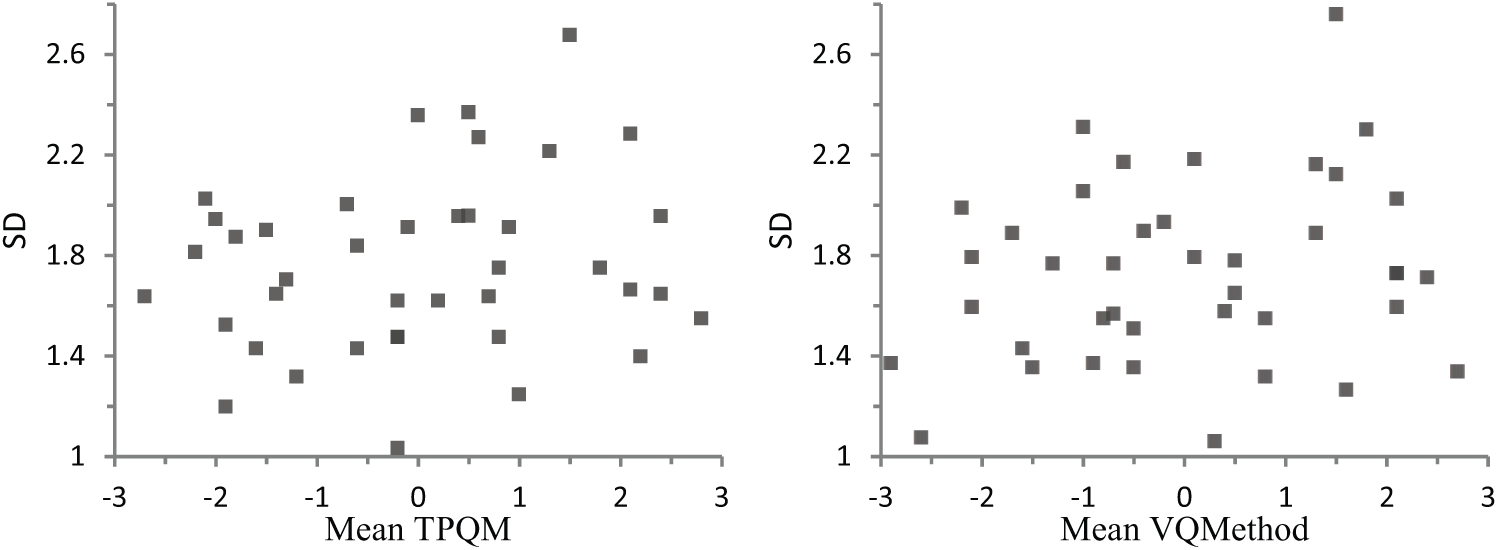
The mean-SD plot for TPQM (left) and VQMethod (right).
Next, the mean of the mean, and the mean of differences of Q scores were, respectively, plotted on the X and Y axes, shaping the BA diagram (Figure 11). The diagram shows that the distribution of mean differences between the Q scores of TPQM and VQMethod is normal. Nonetheless, given that the sum of Q scores in a symmetrical distribution is always zero, both the sum of differences (M = −.0025, SD = 2.17) and the means approximated to zero (M = .01, SD = 1.97).
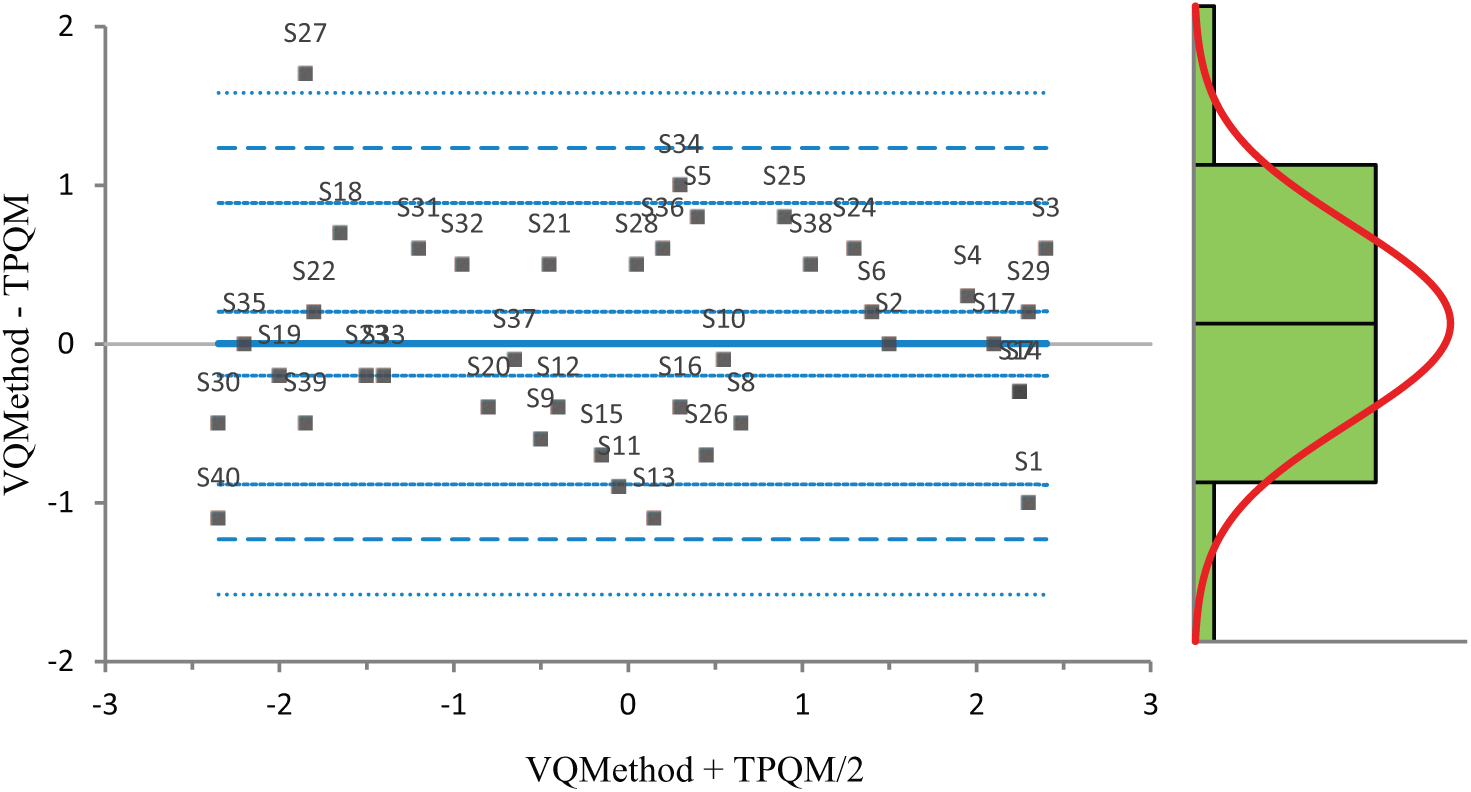
The Bland–Altman diagram.
The SD of differences was computed to generate the 95% limits of agreement between two methods: mean difference ±1.96 × (SD of differences) = 0 ± 1.96 × .6 = ± 1.18. This means that, on average, 95% of Q score differences between the two methods reside between ±1.18; 95% confidence interval (CI) [1.58, 0.88] lower limit and 95% CI [.89, 1.58] higher limit. The apparent trend in the diagram with more data points in the middle than on the sides is affected by the symmetrical bell-shaped distribution of the grid, and is not an indicator of a systematic bias.
Nonetheless, as the Q score ranges are restricted between −4 and +4, it would be almost impossible that correlation between the Q scores of two methods is affected by the data range. Hence, we performed a least linear regression to identify convergence of (V)Q scores between the two methods. The 45° diagonal line in Figure 12 is the signage of a perfect equality between the two variables. The closeness of this line with the regression line (red line) suggests a significant linear relationship between the TPQM and the VQMethod. The analysis showed that the correlation coefficient is significantly different from zero (β = −.0.9287, t (399) = −1.06, p = .29). Equation: VQMethod = 0.00357 + 0.9287 TPQM (Table 11).
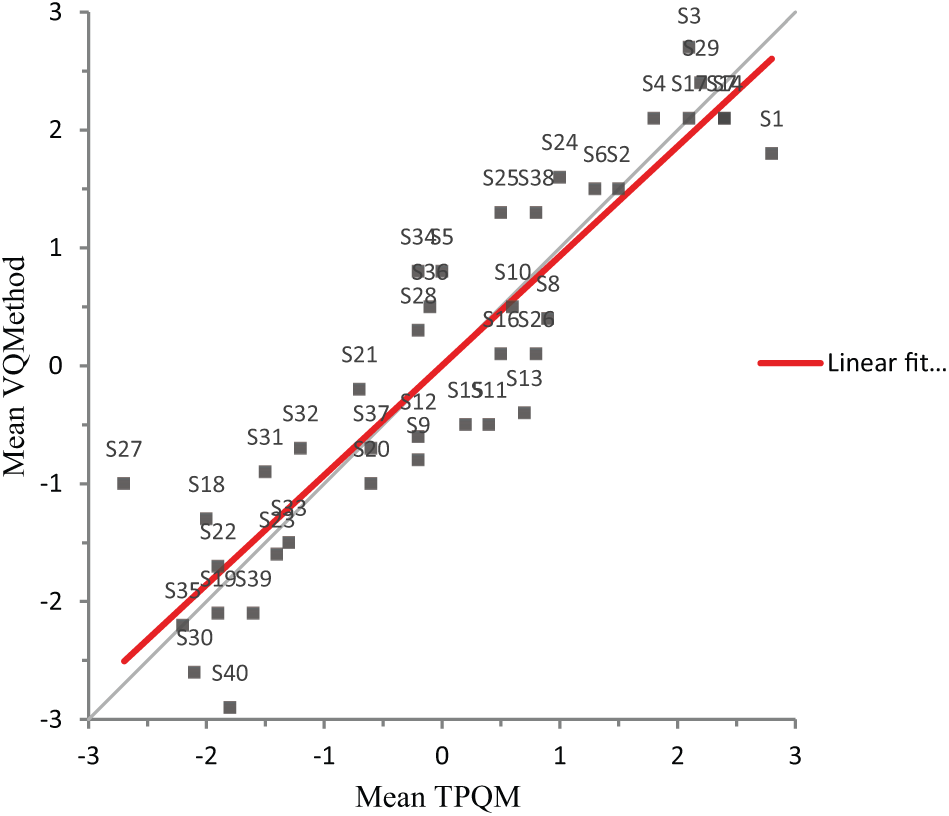
The line of equality between two methods.
Ordinary least-squares fit.
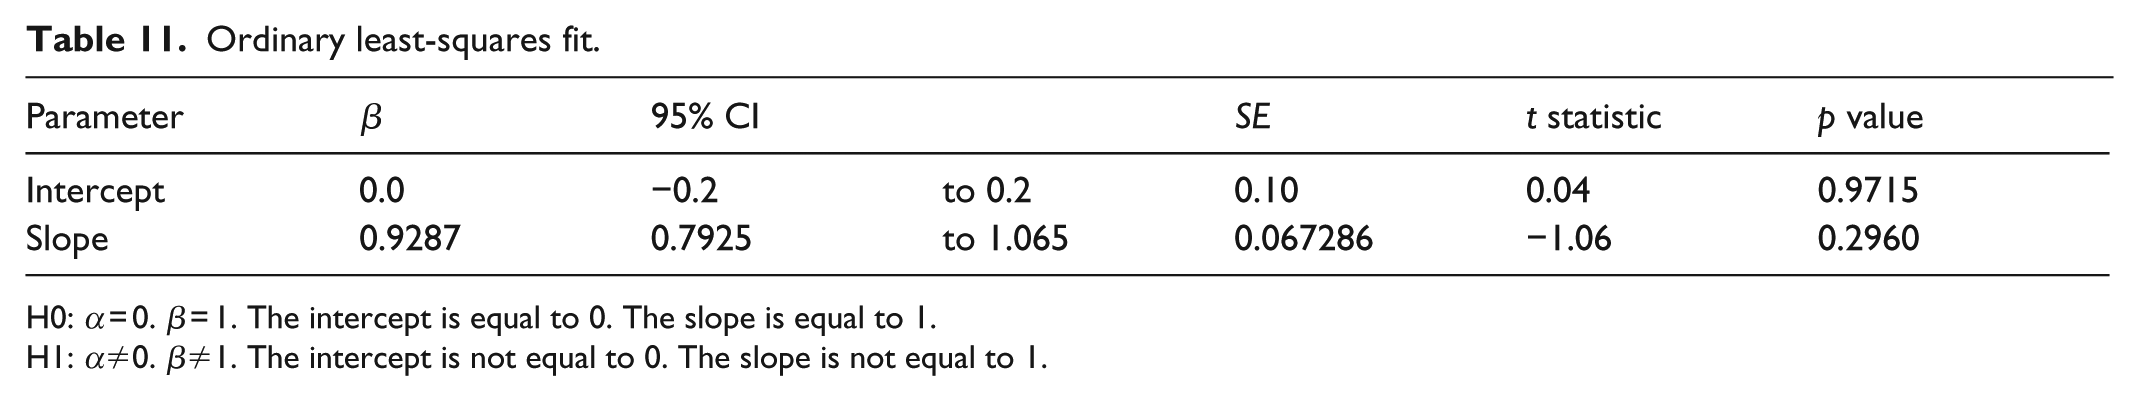
H0: α = 0. β = 1. The intercept is equal to 0. The slope is equal to 1.
H1: α≠0. β≠1. The intercept is not equal to 0. The slope is not equal to 1.
Discussion and conclusion
The purpose of this study was to evaluate the usability and psychometric properties of the VQMethod research tool in contrast with the TPQM. This study was conducted in three stages:(1) a usability test informing the improvement of VQMethod’s survey interface, (2) test–retest reliability analysis, and (3) methods agreement analysis.
In stage one, via observation of 31 potential survey-takers at a local museum of natural sciences, several problems were identified. Moreover, the participants sketched their several design ideas and explained the degree of difficulty they experienced at each stage. While the survey-takers’ high level of satisfaction was substantial, the authors at some point attributed it to the game-like and visual elements, and to the lively and interactive nature of VQ surveys (Sleep and Puleston, 2011). Likewise, some participants even compared it with solitaire games that are built upon the drag and drop features. This finding is similar to that of Guin, Baker, Mechling, and Ruyle (2012) that the functionally visual and gamified treatments produce more satisfaction among research participants. However, it should be noted that an overly rich media design may in turn increase respondent’s confusion and lead them to opt out (Malinoff, 2010).
The traditional surveys reminded the participants about a series of repetitious questions leading to their boredom, sense of burden, and their impatience (Crawford et al., 2001). However, the participants were surprised to see how a survey can request minimal information from the participants and even engage them in a fun and game-like manner. After the usability tests were conducted, participants’ opinions on how to improve the interface reached a level of saturation. Subsequently, the VQ survey interface was improved, and the reliability and methods agreement tests were put forward.
In stage two, the test–retest analysis of the VQ surveys revealed that the composite reliability estimate of VQ sorts is higher than that of TPQM. Simply put, the participants tend to generate VQ sort patterns with VQMethod more precisely than with TPQM. Moreover, the number of viewpoints and the pattern of defining sorts in repeated measures as indicators of reliability remained stable. Nonetheless, the latter only was approved when the VQ sort data at Times A and B were blended rather than separately analyzed (hypothesis one entirely and hypothesis two partially accepted). This blending method of analysis would be highly suitable when contrasting the viewpoints of two populations are at play, that is, to blend the Q sort data of two samples, rather than juxtaposing them. Otherwise, the interpretations of differences and similarities will be arbitrary and even faulty.
Nonetheless, some scholars have proposed second-order factor analysis as a method of comparison between two groups (Dennis, 1990; Rhoads and Brown, 2002). For example, the factor arrays from group A (constituting factors 1, 2, and 3) and group B (constituting factors 4, 5, and 6), are combined, and factor analyzed (refactored) to determine if the factors within the two separate groups are comparable. That is, if second-order factor K contains 1 and 4, second-order factor L contains factors 2 and 5, and second-factor M contains factors 3 and 6. However, as it is evident, this method then gets us back to the first-order factor analysis and side-by-side interpretation of the data, which is cautioned by this study.
The average time spent taking the VQ survey did not significantly predict the reliability of VQ sorts (hypothesis three was rejected). This finding is substantial given that online surveys have a high potential to decrease respondents’ cognitive engagement, and increase their boredom and random responding (Guin et al., 2012). In stage three, the methods agreement analysis showed that on average the maximum difference between the VQ scores and the Q scores is 1.18, that is, somewhat larger than a one-column difference. However, it remains unclear how significantly this difference would affect data analysis and interpretations in Q method research. Nonetheless, the close match of the regression line with the 45° line of equality demonstrates the high correlation between the VQ scores and Q scores.
Furthermore, the visual analysis of the BA diagram illuminated its potential for diagnosing the Q items (image in this study). For example, the reliability of the Q items can be investigated by asking a number of participants to take a Q survey twice, then calculating the mean and SD of the Q scores to inform the BA diagram. If any of the Q items are placed above the 95% limits of agreement, there would be something spoiling the Q item, such as bad wording, unclear or confusing image, and so on. Then the Q items can be revised or replaced. Moreover, the BA diagram can be potentially used in longitudinal research, in discovering participants’ changing attitudes over the Q items. For this, unimodal distribution of the grid can better visually demonstrate the increase/decrease in the participants’ Q scores over time, since the BA diagram’s shape is reasonably influenced by the shape of the grid.
In sum, the VQMethod online research tool proved to be highly usable and rigorous in the conduct of the visual Q method research, by providing reliable data which highly converges with the TPQM.
Footnotes
Declaration of conflicting interests
The author(s) declared no potential conflicts of interest with respect to the research, authorship, and/or publication of this article.
Funding
The author(s) received no financial support for the research, authorship, and/or publication of this article.