
Abstract
Research on gender disparities in STEM (Science, Technology, Engineering, and Mathematics) has paid little attention to the fact that not all STEM disciplines experience the same degree of gender imbalance. Previous research has primarily examined a single STEM discipline or combined STEM disciplines in their analyses. This study addressed some of the limitations of previous research using an innovative statistical approach, Q factor analysis (QFA). QFA is used to explore multifaceted human perceptions, behaviors, and experiences. It enables researchers to categorize people based on their pattern of responses and opinions on a certain topic, in contrast to the more commonly used R factor analysis that categorizes variables. QFA was applied to a sample of 98 female undergraduate students who were enrolled in introductory STEM courses. Participants competed a survey that assessed their attitudes, experiences and beliefs about math, science, and computers. Questions tapped into constructs typically used in social cognitive models of academic and career choices. Two typologies emerged from the analyses. The math-computer group had favorable attitudes and beliefs toward math and computers and less interest in science; whereas the science group had more favorable attitudes and beliefs towards science. Participants’ major choice and self-reported academic support aligned with the two groups in ways that were consistent with the groups’ interests. The study demonstrates the potential for QFA to be applied with various types of data on a wide range of topics and to address questions that are not easily answered using traditional statistical approaches.
Introduction
Although women receive university degrees and are entering the work force in greater numbers than ever, they remain significantly underrepresented in most STEM (Science, Technology, Engineering, and Mathematics) majors or careers (National Science Foundation (NSF), National Center for Science and Engineering Statistics, 2015). Because there are labor supply shortages in these fields, there have been calls from the US government (US Department of Commerce, Economics and Statistics Administration, 2011), as well as from organizations in Europe (Mind the Gap, n.d.) and Asia (UNESCO, 2016), to increase efforts to encourage women and other underrepresented groups to enter into these fields. Often ignored in research on gender disparities in STEM is the fact that not all STEM disciplines experience the same degree of gender imbalance. Recent data from the United States on bachelor degrees in STEM reveals that women are on parity with men for degrees in the biosciences, approaching parity in mathematics, but are still grossly underrepresented in computer science and engineering degrees (NSF, National Center for Science and Engineering Statistics, 2015). This variability might be explained by women having different experiences and/or perceptions across different STEM fields. Understanding variability in women’s perceptions across STEM fields might lead to more refined explanations for the pattern of shortages of women in STEM and further aid in the recruitment of women to these fields. In this research, we utilized a unique statistical approach, Q factor analysis (QFA), to explore variability in women’s perceptions of different STEM fields and how that variability aligns with women’s major choices in college and social support for pursuing STEM.
The purpose of this study was to demonstrate how QFA can be applied to examine female undergraduate students’ attitudes toward and experiences with multiple STEM subjects and how QFA might address some of the limitations of the predominant social cognitive models. Female students enrolled in entry-level STEM courses were selected for this study because they were more likely to have the mathematics and science background to enter into any number of STEM fields than a general female college student population. By way of introduction, we first describe the unique approach of QFA and the rationale for using QFA to address this particular topic, then we review key constructs from the social cognitive theories used to explain individuals’ academic and career choices, and we end with a review on the empirical studies that have used QFA to address similar topics.
QFA as a unique statistical approach
QFA is a statistical approach most used to examine individuals’ subjective experiences and identify typologies of individuals who share similar experiences or perceptions on a given topic (Brown, 1971). Q as a factor analysis approach is in contrast to R factor analysis, which is more commonly used in social science fields to examine behaviors, traits, and psychological constructs, and so on. In applying the R statistical analysis, researchers seek to determine the relationship among variables represented by instrument items, typically using a generalization of Pearson’s r (McKeown and Thomas, 1988). Consequently, R factor analysis generates patterns or underlying constructs across particular variables (Addams and Proops, 2000).
By contrast, QFA establishes patterns across individuals; that is, the patterns are generated from people’s similar responses on a given issue (Galayda, 2006). QFA attempts to reveal a person’s responses or opinions on a given topic and the extent to which that person’s responses are shared by other individuals (McKeown and Thomas, 1988). These individuals could therefore be considered as a typical group with a similar pattern of behaviors or responses on the issue, also known as a typology of subjects (Newman and Ramlo, 2010; Yang, 2016). Equipped with Q analysis, researchers are able to further compare various typologies of individuals in order to find out the similarities and differences among behavior patterns held by these groups of people.
It should be noted that QFA is often mentioned along with another research methodology, namely Q methodology. In the Handbook of Mixed Methods in Social and Behavioral Research, Second Edition, Newman and Ramlo (2010) introduced Q methodology and QFA as distinct mixed-methods approaches. Q methodology requires the participants to rank-order a set of statements on the topic of interest according to their perceptions and beliefs; a process known as Q-sorting (Stephenson, 1975). QFA is the statistical technique that is applied to analyze Q-sort data. However, applications of QFA need not involve data collected through Q-sorting. Instead, in QFA, data can be collected through various sources such as interviews and surveys (Malo-Juvera, 2015; Yang and Bliss, 2014) with the goal in all cases being to identify typologies of people.
QFA, the statistical approach of this study, enables researchers to understand individuals’ subjective opinions on a certain topic and to group individuals based on the similarities of their response patterns to a given set of measures (Brown, 1993; McKeown and Thomas, 1988). Data collected through either approach (interview and survey instrument) are subjected to sophisticated statistical analyses. Unlike other factor analytical approaches (e.g. R factor analysis), QFA generates patterns/factors across people rather than instrument items. Participants who responded to the topic in a similar way are identified and grouped through QFA. Simply put, QFA groups people rather than items (Newman and Ramlo, 2010). Each group of participants share a common pattern of responses on a given topic and is considered to belong to one typology or Q factor (Ramlo, 2016; Yang, 2016).
QFA can identify multiple typologies and provides representative statements of each typology, distinguishing statements that differentiate typologies, and consensus statements similar across typologies. Interpreting and comparing various typologies/profiles allow researchers to have a more in-depth understanding of the distinctions, as well as commonalities, among the response patterns of distinct groups of individuals (McKeown and Thomas, 1988). This acutely reflects the qualitative side of QFA as it ultimately aims to understand human subjectivity (Ramlo, 2016).
The QFA approach arguably offers several advantages over the more common social cognitive research paradigms that focus on career decisions (e.g. Lent et al., 2000) and academic outcomes (e.g. Bandura et al., 2001; Eccles et al., 1984). First, research using social cognitive theories has typically identified multiple common processes and/or factors employed in making these career choices and examined them sequentially based on the theory’s model of decision making. Instead, QFA allows the researchers to examine multiple social cognitive factors simultaneously, and its goal was to identify typologies of people, rather than a decision-making process. Furthermore, research using social cognitive models often focuses on a single STEM field (e.g. Fredricks and Eccles, 2002; Lent et al., 2008; Wilkins and Ma, 2003) or collapses all STEM fields into one category (Chachashvili-Bolotin et al., 2016; Ferry et al., 2000; Fouad and Smith, 1996; Sahin et al., 2014) perhaps due to either accessibility or convenience. While valuable in their own right, such approaches are limited in their ability to understand why women are better represented in some STEM fields than others. Using QFA, we were able to simultaneously explore patterns of individuals’ perceptions and experiences across multiple STEM disciplines that might potentially identify distinct academic and career interests. Thus, as a complementary approach to more traditional research in this area, QFA is more suitable when the goal is to provide a nuanced understanding about women’s perceptions of different STEM fields. In the current study, constructs that are typically assessed in the study of social cognitive models are incorporated in the QFA, providing a link between the two approaches.
Social cognitive theories of career choices
Social Cognitive Theory was first proposed by Bandura (1977). Self-efficacy, learners’ beliefs concerning their capabilities to accomplish academic-related tasks and activities, lies at the center of the Social Cognitive Theory as it affects how individuals behave and their perceptions of the environment (Schraw et al., 2006). Social cognitive models of academic outcomes and career choice (e.g. Bandura et al., 2001; Fredricks and Eccles, 2002; Lent et al., 2000) propose that demographic characteristics (e.g. gender and age) and social environmental factors (e.g. social support) influence learning and achievement in school, which in turn affect a number of social cognitive factors such as self-efficacy, perceived ability, and outcome expectations (Bandura et al., 2001; Eccles et al., 1984; Lent et al., 2000). These factors are proposed to be causally related to both academic behaviors (Bandura et al., 2001; Fredricks and Eccles, 2002), and interest in and intention to pursue specific careers (Lent et al., 2000). Research has shown that self-efficacy beliefs largely influence individuals’ attitudes, interests and various behaviors such as goal setting, strategy execution, and persistence in academic or career pursuits (Pajares, 2008; Pintrich and Zusho, 2007; Schraw et al., 2006; Schunk and Zimmerman, 2006). Furthermore, academic pursuits and occupation interest are often found to be better predicted by self-perceptions of abilities than previous achievement (Bandura et al., 2001; Ferry et al., 2000; Frome and Eccles, 1998; Lent et al., 2000; Zimmerman, 2000).
Social cognitive models also suggest that social environmental factors such as support from agents including parents, peers, and teachers influence how students shape their self-perceptions of abilities, beliefs, and interest, which in turn affects students’ academic performance (Lent et al., 2000). Previous research has primarily focused on parent support (e.g. Frome and Eccles, 1998), but some research suggests that teachers and friends also have an impact on students’ attitudes toward academic subjects (Bokhorst et al., 2010; Rice et al., 2012; Wilkins and Ma, 2003) and career aspirations (Wang and Staver, 2001). For example, students’ perceptions of positive instructional approaches including teacher support and use of engaging instruction were found to be associated with better attitudes and higher self-efficacy for mathematics and science during the transition to middle school and high school (Barth et al., 2011). More recently, Rice et al. (2012) found that social support from parents, teachers, and friends was positively related to mathematics and science efficacy and interest. Given the limited literature so far, the current study examined the influence of social support from parents, teachers, and peers on women’s perceptions and interests toward various STEM disciplines.
Treatment of STEM disciplines in social cognitive models
Although there is a good deal of social cognitive research on students’ attitudes and perceptions of their abilities in STEM areas, most have focused on a single STEM field (e.g. Fredricks and Eccles, 2002; Lent et al., 2008; Wilkins and Ma, 2003) or collapsed all STEM fields into one category (Ferry et al., 2000; Fouad and Smith, 1996). Very few have examined mathematics, science, and computer interests separately. Even among the studies that have investigated these subjects within the same study, the results have been mixed as to how similar students react to the subjects (Bandura et al., 2001; Barth et al., 2011). For example, Barth et al. (2011) found that girls’ self-efficacy beliefs in mathematics and science showed different trajectories over adolescent school transitions. Yet, different patterns in students’ experiences were not found in other studies (Bandura et al., 2001; Simpkins et al., 2006).
Additional considerations, however, suggest that it is worthwhile pulling apart science, mathematics, and computers as distinct interest fields. First, as described earlier, not all STEM fields experience a shortage of women suggesting that women’s efficacy, interest, and motivation vary among STEM fields. Second, STEM disciplines differ in the degree to which they require mathematics, advanced science, and computer science courses. For example, although engineering and computer science majors require several advanced courses in mathematics, a mathematics major might not be required to take any courses in either of these fields. Similarly, a computer science major might need to take very few science courses in other disciplines. Due to these differences, it is necessary to separate disciplines and examine women’s perceptions toward each one of them. Thus, in this study, we investigated women’s perceptions of mathematics, science, and computers and explored whether the typologies that emerge from QFA were associated with distinct patterns of reactions to the different fields. We further examined whether the typologies of women were aligned with social support they received in the different fields and with their chosen majors.
QFA applied to understand STEM experiences
In this study we examined several factors that have been identified in social cognitive models as important for career and academic decisions. A few studies have previously used Q method to investigate topics in STEM-related disciplines. For example, Ramlo (2008) has used Q technique to determine physics students’ epistemologies and their learning in a first semester college physics course. Similarly, Sparks (2011) explored student conceptions of learning in an undergraduate physical geography course through Q method. Arter (2012) used the Q method to examine the beliefs, opinions, and attitudes that typically affect engineering technology students’ willingness to learn. Finally, Q methodology was also used as part of a program evaluation plan to determine students’ views about a newly developed bioinformatics course (Ramlo et al., 2008). To our knowledge, no research has used the QFA to simultaneously explore students’ views and attitudes on multiple STEM subjects, in this case, mathematics, science, and computers. Furthermore, no research has focused on female students exclusively to understand their experiences and attitudes toward mathematics, science, and computer subjects. This study fills the gap by utilizing a unique analytical approach, QFA, to gain a more nuanced understanding of women’s perceptions of multiple STEM disciplines.
Purpose of the study
Using QFA, this study examined whether women’s perceptions and attitudes across mathematics, science, and computers are similar, or if women systematically vary in their perceptions of different subject areas. That is, are there typologies based on women’s perceptions and attitudes toward science, mathematics, and computers? Second, given that social support has been repeatedly identified as an important factor affecting choice of STEM academic interest and career pursuits (e.g. Ahmed et al., 2010; Barth et al., 2011; Rice et al., 2012), we further compared the relations between the typologies that emerged from the first research question and social support provided by teachers, parents, and peers. Importantly, we utilized measures of social support for each academic area separately, so we can evaluate the importance of making distinctions among different STEM fields. Third, as the aforementioned literature indicated that perceptions of and attitudes toward a discipline is at the center of one’s major and career choices, we further compared the major choices of women in the different typologies that emerged from the first research question. As noted earlier, female college students enrolled in entry-level STEM courses were targeted for this study because they were more likely to have the mathematics and science background to enter into any number of STEM fields compared with a general female college student population. Thus, the women who have low perceived abilities, background, or interest in STEM were not the focus of this study.
Method
Participants
A large sample size is not necessary in QFA because QFA generates factors across people rather than instrument items (McKeown and Thomas, 1988; Yang, 2016). A sample of 30 to 50 participants is considered psychometrically sufficient (McKeown and Thomas, 1988). Additionally, Q often uses purposive sampling or even a single-case rather than random sampling, which is driven by theoretical considerations or interests (Brown, 1993).
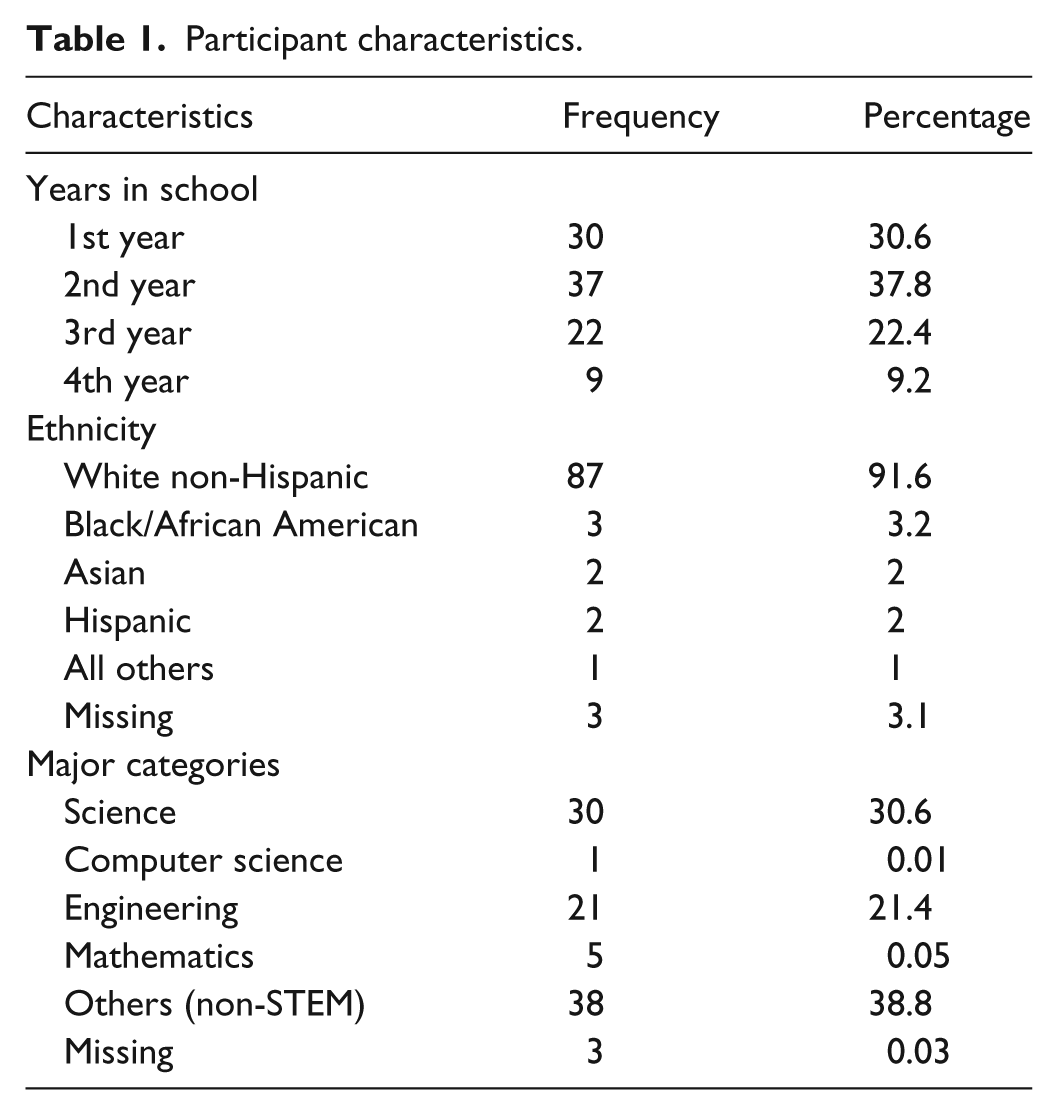
The sample in this study was a subsample from a longitudinal research project funded by the NSF awarded to the second author that examined factors related to students’ perceptions of and interest in STEM academic topics and careers. All participants were undergraduate students at a large Southeastern public university in the United States and were enrolled in entry-level STEM-related courses. These courses were selected to represent a wide range of STEM fields, including engineering, calculus, physics, chemistry, and geology and were each required for majors in these fields. The broad sampling of STEM courses is the strength of this study. Potential male and female participants were approached on the first day of classes in the fall term and asked to complete a questionnaire on their perceptions of mathematics, science, and technology and their career interest in each. Approximately 60% of students attending class agreed to participate (N = 994; 294 women). Although the sample was not randomly selected, the participation rate and sample size (especially for women) compares favorably with similar studies using a survey methodology (e.g. Chachashvili-Bolotin et al., 2016; Ferry et al., 2000; Lent et al., 2008). The results reported here are based on a subsample of 98 female undergraduate students (mean age = 19.65 years, SD = 1.06) from the entire group of participants who had complete data for the measures described below. Table 1 presented the descriptive characteristics of the sample used in the analyses.
Participant characteristics.
Procedure
After obtaining the approval from the University Institutional Review Board and the permission of course instructors, a member of the research team went to each class and explained the purpose of the study and each student read a written consent statement. Students wishing to participate stayed after class to complete a survey. This questionnaire included 338 items designed to assess several factors related to STEM classes and careers. The measures used in this study are described below. Participants generally were able to complete the survey in about 15 minutes.
Measures
Perceptions and attitudes toward science, mathematics, and computers
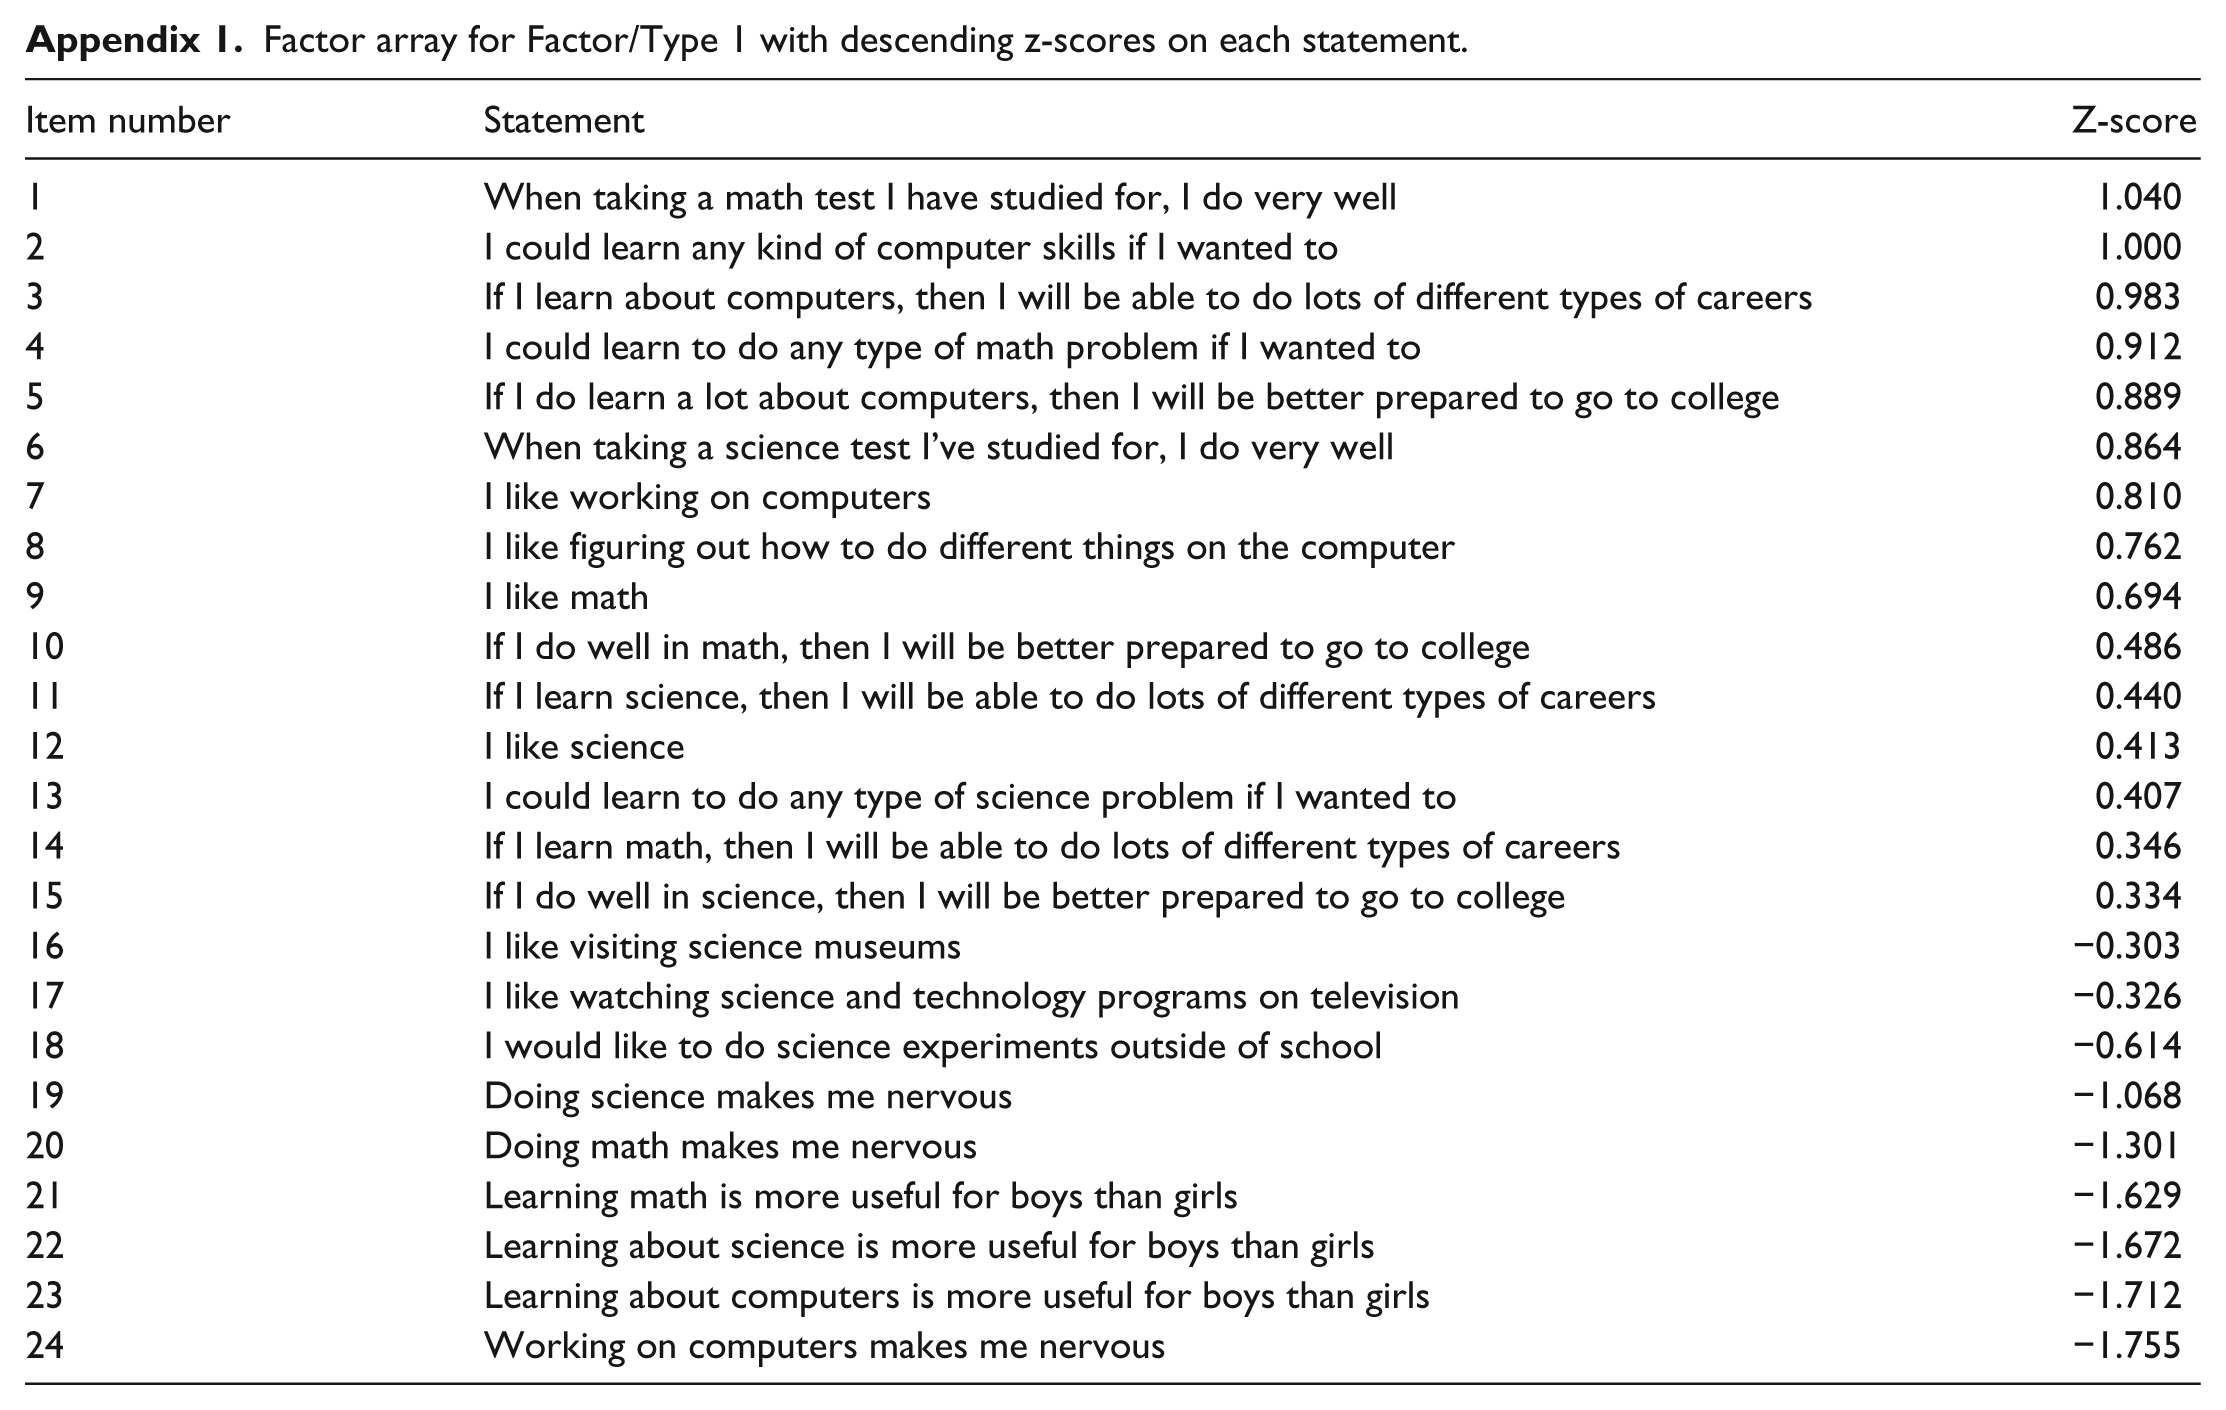
Questions were drawn from the Michigan Study of Adolescent and Adult Life Transitions (MSALT, 2006). The MSALT instrument has been widely used among adolescents in many studies, and the reliability and validity of the measures have been well established (see MSALT, 2006). A total of 24 statements regarding perceptions and attitudes toward relevant subjects were included (Appendix 1). Each item was rated on a 5-point scale (1 = Strongly disagree to 5 = Strongly agree). Seven mathematics-related items asked students to rate their own abilities in mathematics (self-efficacy), how much they like to engage in different mathematics activities, and how studying mathematics is related to educational or career goals. Ten science-related items and seven computers-related items were added for this study that assessed comparable topics related to their own science and computer abilities, how much they like to engage in science and computer activities, and how studying science and computers are related to educational or career goals. In contrast to mathematics and science courses, computer courses are not universally common to college students, although attitudes and interest toward computers could still be measured. As a result, questions related to performance in a course were not included for computers. Because of our focus on women, a question related to the usefulness of each subject for boys and girls was included (i.e. Learning about science is more useful for boys than girls).
Social support
The measure of social support was adapted from the Longitudinal Study of American Youth (Miller et al., 2000; Wilkins and Ma, 2003). Social support was measured through three sets of questions that related to teacher, parent, and peer support for mathematics, science, and computers, all on a 5-point scale (1 = Strongly disagree to 5 = Strongly agree). For teacher support, there were six items devoted to mathematics (α = .89), seven items focused on science (α = .87), and one item on computers. Example items include the following: “My science teacher cares how we feel,” “My math teacher expects me to do well in math,” and “My teacher cares if I like doing work on the computer.” Parent support was assessed similarly with seven items focused on mathematics (α = .79), eight items on science (α = .85), and two items focused on computers (α = .79). Example items include the following: “My parents have always encouraged me to work hard on math,” “My parents care if I like science,” and “My parents care if I like working on computers.” Finally, peer support consisted of five items for mathematics (α = .70), five items for science (α = .73), and two items on computers (α = .43). Example items include the following: “My friends encourage me to take all the math I can get in school.” Included in the peer support items were measures that assessed the norms in the peer group for performance in mathematics, science, and computers: “Most of my friends are good at science” and “Most of my friends have good computer skills.” Scale scores were calculated as averages over the items and thus had a possible range of 1 to 5.
Majors
Participants were also asked to specify their majors or the majors they would have chosen on that day if they did not have a major at the time of the survey. This was an open-ended question and responses were categorized into five broad areas to address the research questions in this study: science, computer science, engineering, mathematics, and other non-STEM majors (business, psychology, accounting, etc.).
Data analysis
The PQMethod program (Schmolck, 2014b) was utilized to perform the statistical analyses. Following general procedures of the PQMethod program (Schmolck, 2014a), we included only the 98 cases with complete responses to all 24 items. The PQMethod program performed a sequence of statistical procedures: correlation between students’ scores, factor analysis, and computation of Q factor scores (Schmolck, 2014a).
Correlations
The completed individual survey responses are first correlated with one another to calculate the degree to which these responses are similar or different. In PQMethod, a Q data matrix will be first produced with columns being persons and rows being statement items. Given N persons in a Q data set, an N × N correlation matrix with all possible pairwise correlation coefficients between participants was calculated. A high positive correlation means the two participants rated the items in a similar way and thus shared a similar pattern on the issue. For the current study, since there were 98 participants, the correlation matrix consisted of 9604 (98 × 98) correlation coefficients. Determining correlations between participants was not the principal purpose of the data analysis, but it served to prepare the data for factor analysis.
QFA
We then conducted principal components factor analyses with varimax rotation in the PQMethod. It should be noted that often times Q methodologists (Brown, 1993; Stephenson, 1975) favor centroid extraction with hand rotation rather than principal components extraction with varimax rotation, which is more commonly used (see Cattell, 1978). But several Q methodologists have pointed out that such preference is for theoretical purposes, whereas the statistical difference between using centroid and principal components method is minimal (Brown, 1980; McKeown and Thomas, 1988). In the current study, varimax rotation was used in order to maximize the loadings of as many items as possible on one or more of the factors (McKeown and Thomas, 1988).
Computation of Q factor scores
In the PQMethod program, each participant is assigned a factor loading value on each factor ranging from −1 to 1, which indicates the magnitude of association between a person’s response and the underlying factor. Based upon the participant factor loadings, “defining respondents” can be identified, who are respondents that load strongly on a factor and thus characterize that factor. These defining subjects are the key to understanding the factors because their shared attitudes and perceptions are the primary representation of the underlying patterns of the group. The defining participants’ scores across different items in the measurement instrument are averaged to create a factor score for each item.
PQMethod automatically normalizes factor scores, which are essentially weighted z-scores for each item on the instrument. A z-score represents the average score of an item based on the responses from all definers of a factor type. The z-scores are mainly used to understand and compare the characteristics of different profile types. Graphing the z-scores across the items for each profile reveals different shapes of responses, which represent different types of participants. An exemplary shape from the results of this study is shown in Figure 1 and will be discussed in the “Results” section.
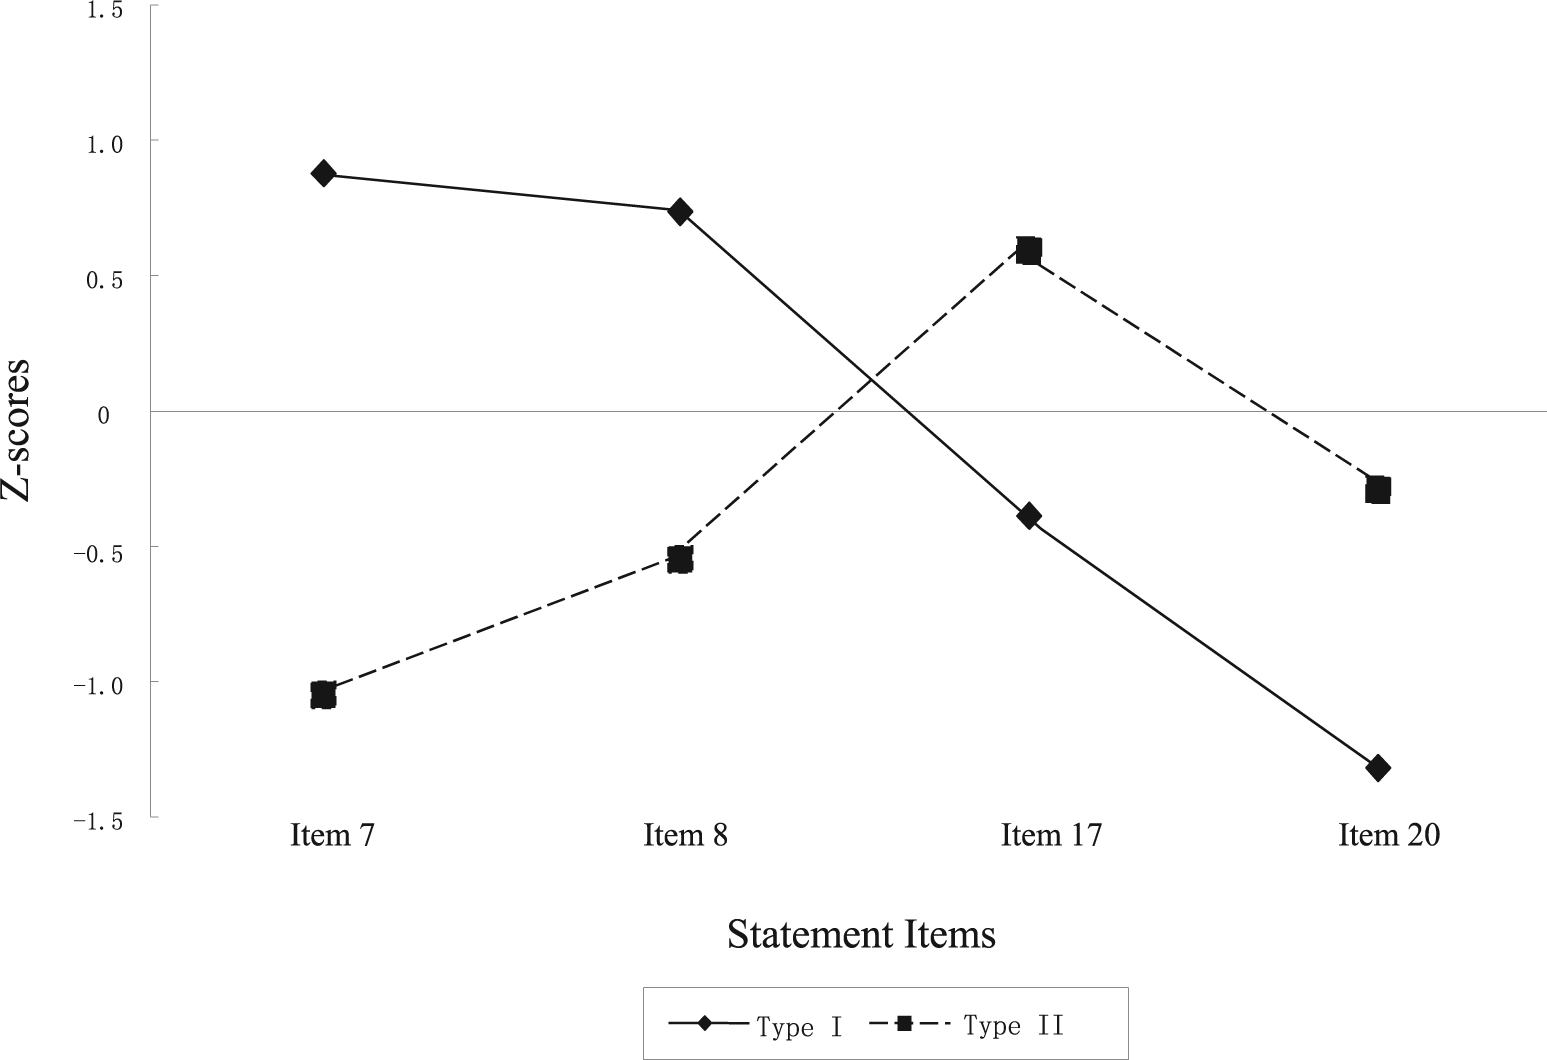
Profiles of two participant typologies based on their z-scores of four exemplary statement items. Item 7 reads, “I like working on computers.” Item 8 reads, “I like figuring out how to do different things on the computer.” Item 17 reads, “I like watching science and technology programs on television.” Item 20 reads, “Doing math makes me nervous.”
Results
The QFA yielded a two-factor structure representing two distinctive female student types regarding their self-perceived abilities and attitudes in mathematics and science (Table 2). Two factors combined explained 62% of the variance in the sample, with Factor 1 explaining 34%. Among 98 participants, 55 were grouped in Factor 1 and 38 were grouped in Factor 2. (Five participants did not load on either factor, thus their data were not further used to interpret each student type.) In order to understand and interpret each factor type, we examined the factor scores of each instrument item for each factor type. Here we focus on the representative items with high absolute values on z-scores in each factor as they demonstrate the significant patterns embodied in that factor type.
Two-factor solution with number of defining respondents (N = 98).
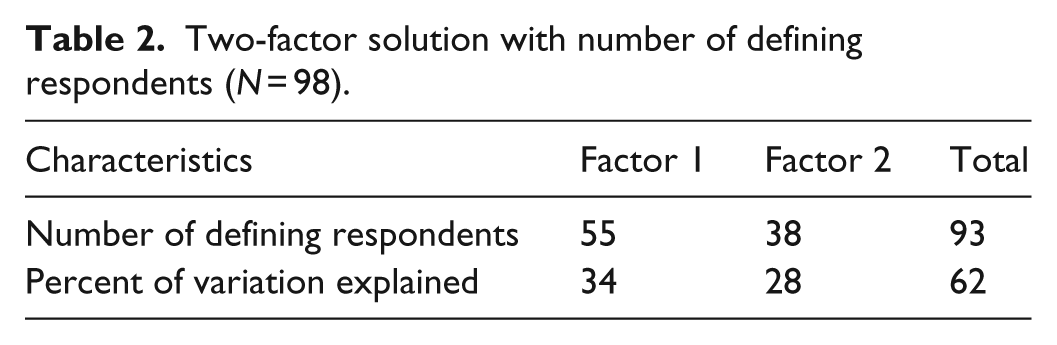
Table 3 lists the representative statement items with highest and lowest z-scores for Factor 1. This first group of women (Type 1) expressed preferences for computers and mathematics (agreement with Items 7, 8, 9) as well as strong beliefs of their own abilities in learning both (agreement with Items 1, 2, 4). Also based on the z-scores, Type 1 women strongly disagreed that learning mathematics and computers made them nervous (disagreement with Items 24, 20), which supported their high level of perceived abilities in learning mathematics and computers. However, this group was not fond of doing any extracurricular activities related to science (disagreement with Item 18), although they were not nervous working on science (disagreement with Item 19). That being said, these women did strongly believe that learning mathematics, science, and computers is equally useful for both genders (disagreement with Items 23, 22, 21).
Factor 1 statements with high and low z-scores.
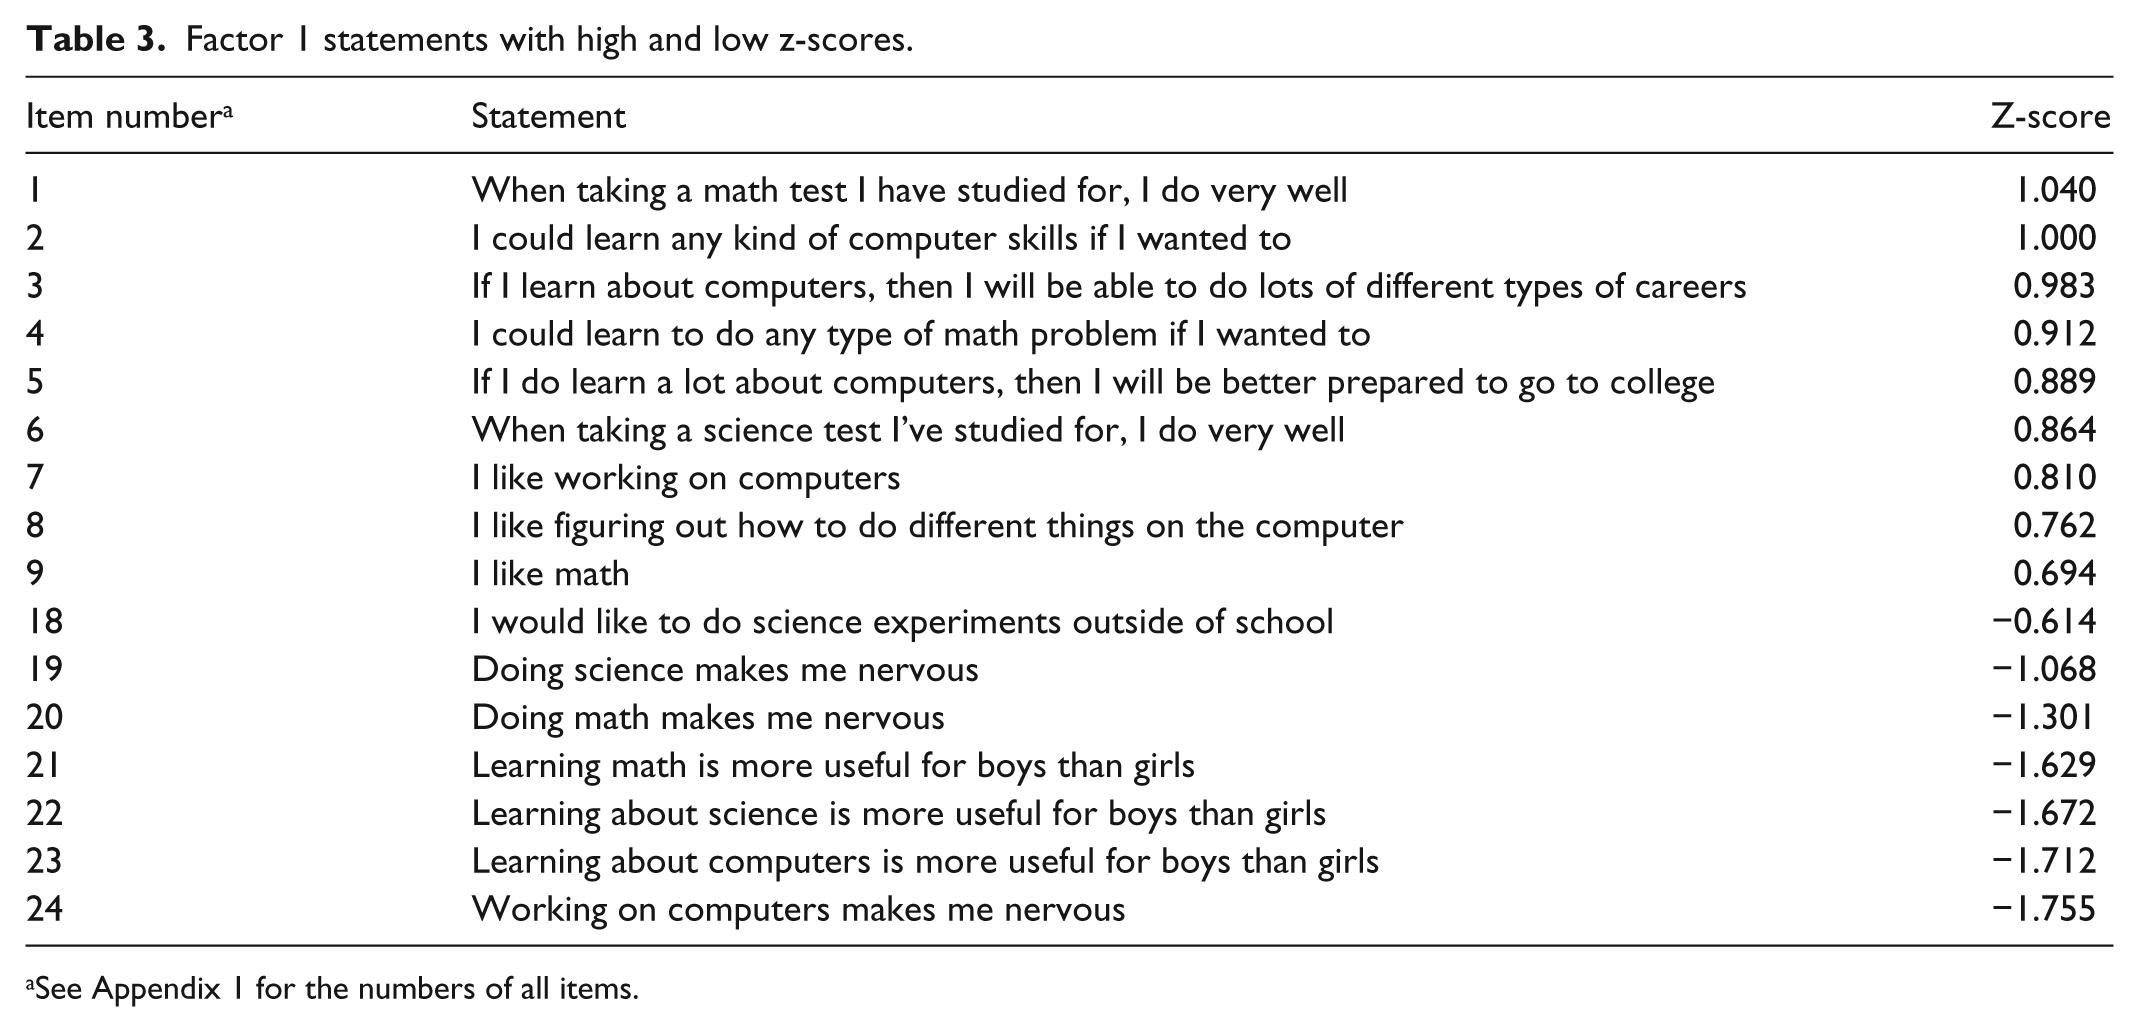
See Appendix 1 for the numbers of all items.
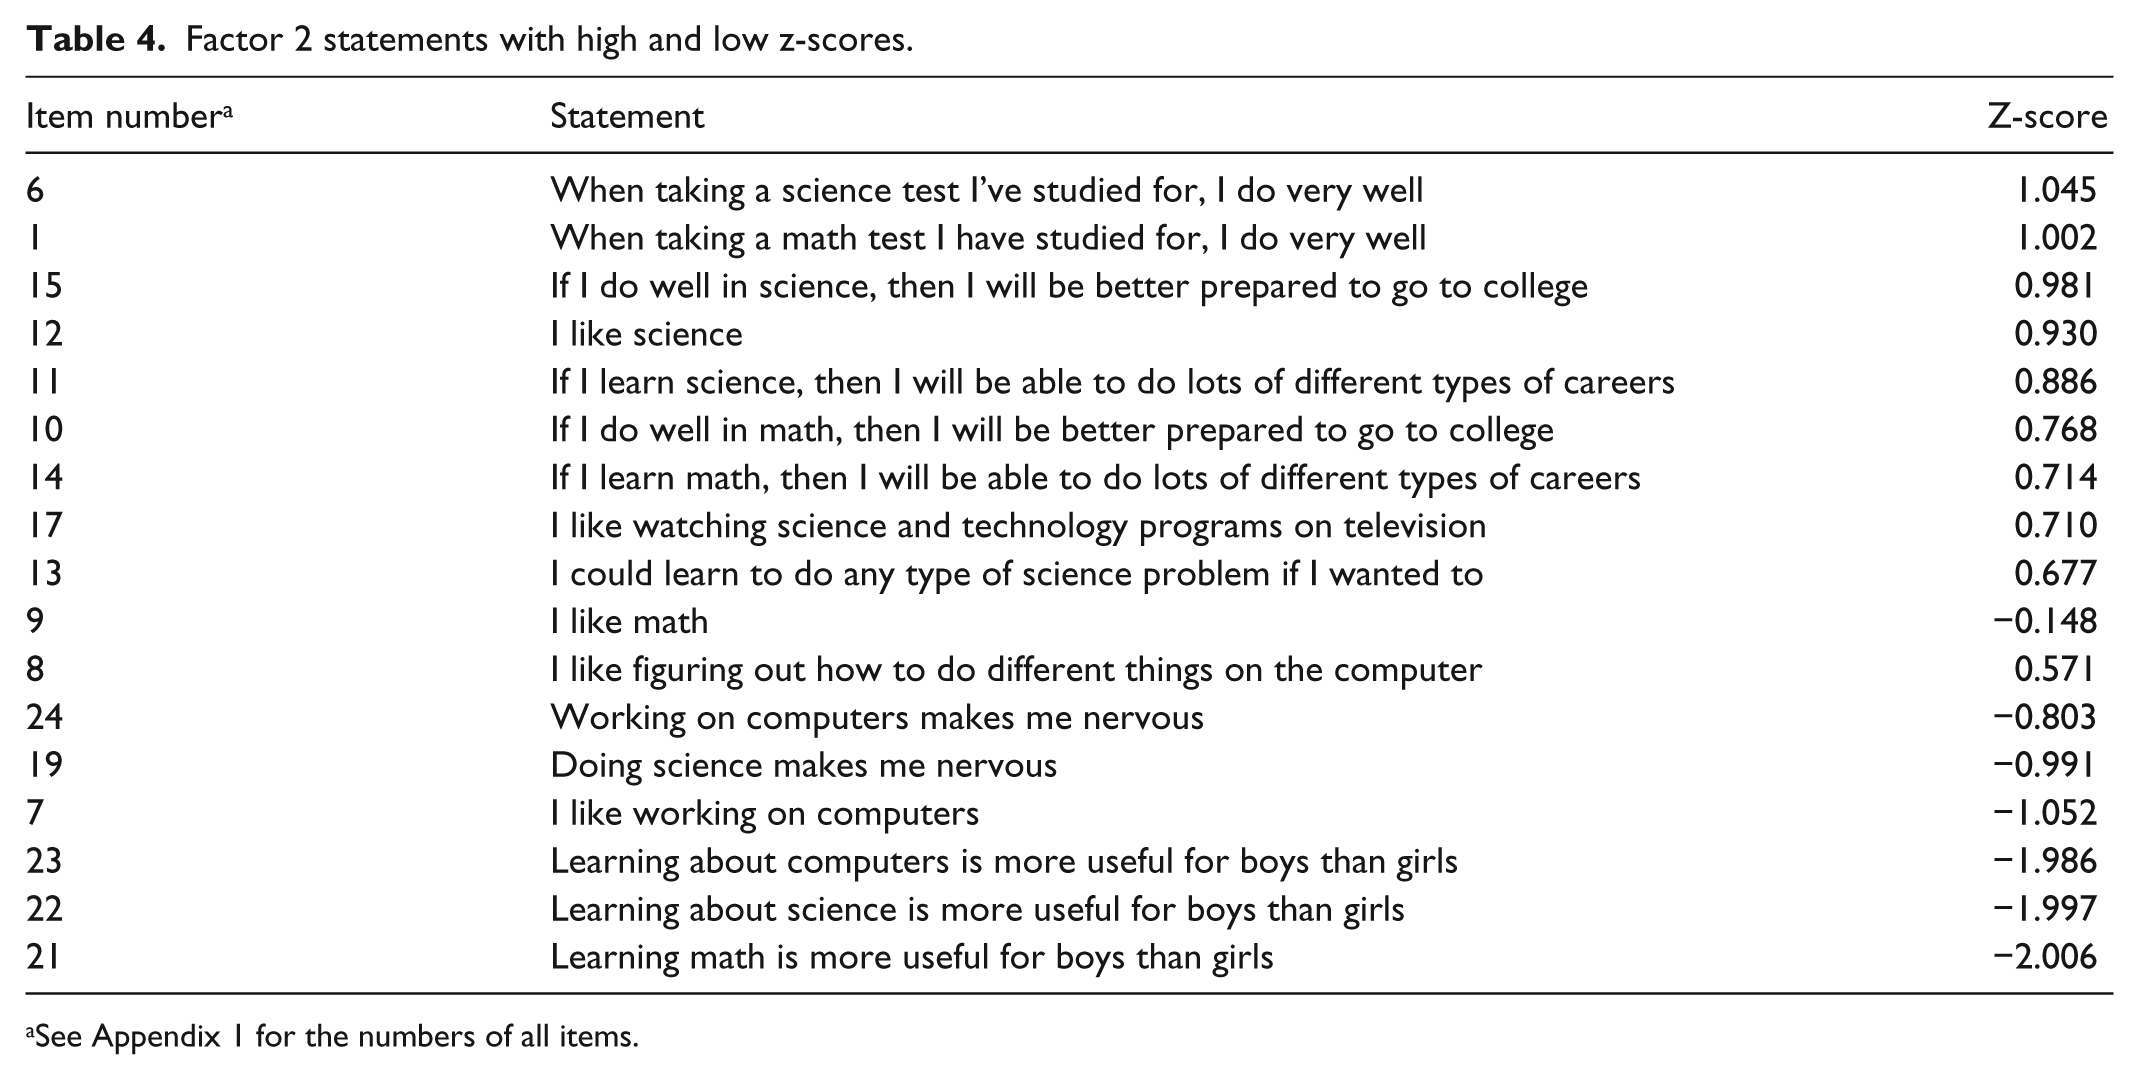
Regarding the second group of female students (Type 2), some of the extreme z-scores, as illustrated in Table 4, suggested this group held strong confidence in their abilities to learn science (agreement with Items 6, 13) as well as liking science (agreement with Items 12, 17). When it comes to computers, Type 2 women strongly disliked working with computers (disagreement with Items 7, 8) and they were uncertain about their own abilities of learning about computers. Additionally, the self-perceived abilities and attitudes toward mathematics in this group were neutral as indicated by z-scores on related items near zero (Items 9, 20). Similar to Type 1 group, the Type 2 group strongly believed learning mathematics, science, and computers was equally useful for both genders (disagreement with Items 23, 22, 21).
Factor 2 statements with high and low z-scores.
See Appendix 1 for the numbers of all items.
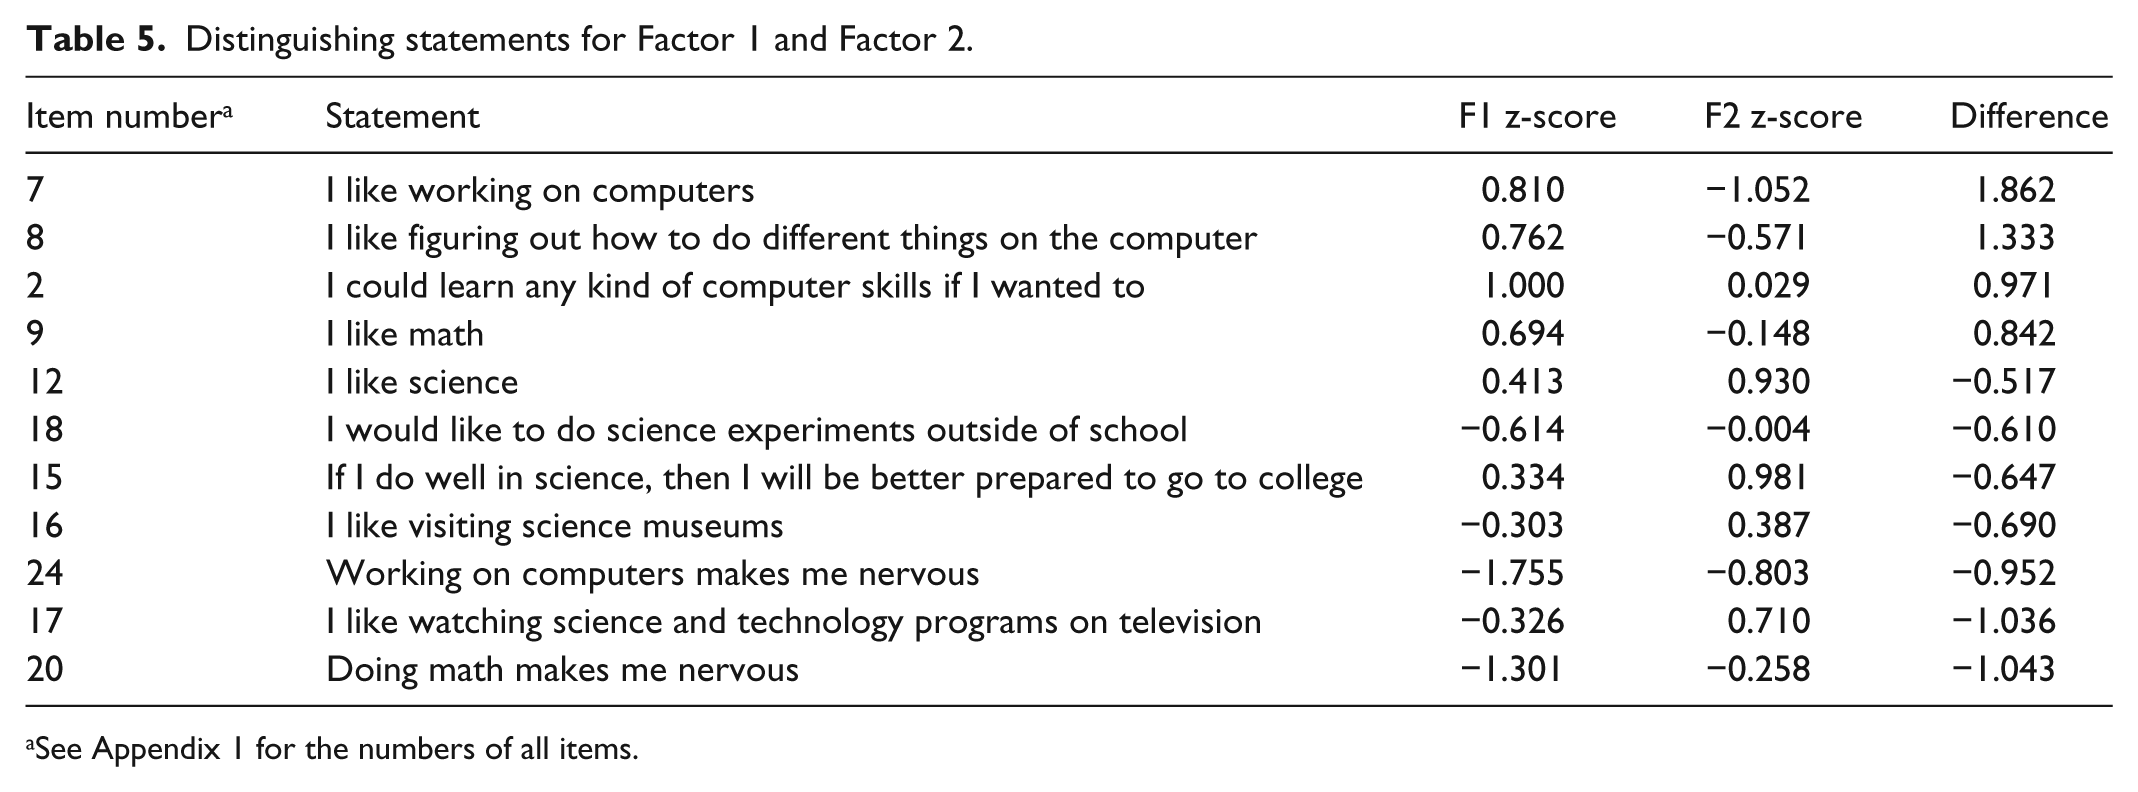
So far, the representative statements with extreme ranked z-scores for each type/factor has shown both groups of women are characterized by some perceptions and attitudes toward mathematics, science, and computers that are unique to their own group, whereas they also shared similar views on certain topics. We further looked at the statements with large z-score differences from the PQMethod output, known as “distinguishing statements.” Distinguishing statements are the statements with great difference/distance of the z-scores between factors and thus differentiate one type/factor the most from the other type(s). Table 5 shows the distinguishing statements based on the z-score differences between Factor 1 and Factor 2. Figure 1 represents exemplary shapes for the two types of participants, based on four items with the greatest z-score differences in the results (i.e. Items 7, 8, 17, 20). From Figure 1, we could identify two different shapes, thus two distinct typologies (of people) that exist in the study. Clearly, distinguishing statements reinforced the interpretation of extreme ranked statements. Specifically, women of the first factor (Type 1) showed great interests as well as strong beliefs of their abilities in working with computers, whereas those from Type 2 group had very negative feelings and lack of perceived abilities on this very subject. The first type of women indicated similar interests and perceived abilities in mathematics, whereas Type 2 group expressed neutral feelings toward it. On the other hand, women of the second typology expressed great enthusiasm and confidence in dealing with science, while Type 1 women as a group showed some negativity and less interests toward it.
Distinguishing statements for Factor 1 and Factor 2.
See Appendix 1 for the numbers of all items.
In summary, two contrasting types of female STEM undergraduates emerged from QFA regarding their perceptions and attitudes toward mathematics, science, and computers. Type 1 women had both strong positive attitudes toward and high-level self-perceived abilities in learning computers as well as mathematics, whereas Type 2 women held similarly favorable attitudes and perceptions toward learning science. In addition, Type 1 women not only liked mathematics to a greater degree than Type 2 group, they also indicated much more confidence of their own abilities in learning mathematics than Type 2 women. Meanwhile, both Type 1 and Type 2 women held strong beliefs in the equal usefulness of mathematics and science for both sexes. For the purposes of the analyses below, we labeled Type 1 the Mathematics and Computer (MC) group and Type 2 the Science (SC) group.
Relationship between student types and social support
To address the second question on the relationships between the typologies that emerged from the first research question and social support provided by different sources, we further tested whether there were differences in perceived support from teachers, parents, and peers for mathematics, science, and computer topics by the two typologies. A 2 (Q-Typology) × 3 (Source of support: teachers, parents, peers) × 3 (Topic: mathematics, science, computers) multivariate analysis of variance (MANOVA) was conducted. For the purposes of this research, the most relevant effects are those that interact with the Q-Typology. We found that the Typology × Topic interaction was statistically significant, F(2, 88) = 17.89, p < .001,
Relationship between types and major choice
We further compared the major choices between two types of women to address the third research question. Women in the MC group were more likely to choose Engineering major than those in SC group. Out of 21 women who chose Engineering major, 15 (71.4%) were from MC group and 5 (23.8%) from SC group. By contrast, women in the SC group selected a science major, such as biology, more often than those in MC group. Among 30 women in a science major, 21 (70%) were from SC group and 8 (26.7%) from MC group. Yet, more interestingly, MC group members are much more likely to have chosen a major unrelated to STEM (Business, Finance, Psychology, etc.) than the SC type. A total of 38 women indicated to have selected a non-STEM major, among which 27 (71.1%) were in the MC group and 9 (23.7%) were in SC group. Few women in either group indicated their major as mathematics (3 and 2, respectively, in MC and SC types) and as computers (1 in MC type, none in SC type). A chi-square analysis was conducted examining the relationship between three major groups (Engineering, Science, and non-STEM) and the two typologies (MC and SC) and was statistically significant χ2 (2) = 17.73, p < .001.
Discussion
This study demonstrated that QFA can be used as a stand-alone statistical procedure without involving Q-sorting. QFA is a flexible and powerful tool to explore multifaceted human perceptions, behaviors, and experiences. It allows researchers to detect distinct viewpoints, behavioral patterns, or preferences through people typologies. Furthermore, comparing across typologies enables us to better understand the differences and commonalities in viewpoints, behavioral patterns, or preferences on a given topic.
A goal of this study was to introduce and demonstrate the utility of QFA as a tool for understanding the experiences that contribute to women’s pursuit of STEM fields. Developing typologies of women based on their own subjective experiences provides a powerful device for understanding the factors that underlie academic and career choices. QFA led to the discovery that mathematics was viewed as important for STEM and non-STEM majors alike, and to our knowledge this has not been recognized as an issue in the gender and STEM literature. By basing the typologies on measures of several social cognitive attributes, our findings also inform research based on social cognitive models of academic and career decisions. Specifically, these findings suggest that it is useful to treat the STEM fields as distinct entities in these models.
Prior research has often examined STEM as a single entity, without consideration of whether women could be interested in some STEM fields, but not necessarily all. QFA allowed us to examine if unique profiles of women could be extracted based on responses to questions about perceived abilities, attitudes, outcome expectations, and gender-based beliefs about science, mathematics, and computers. Two unique typologies of college women emerged with distinct patterns of perceptions and attitudes toward mathematics, science, and computers. Women from the MC group (Type 1) held positive views of mathematics and computers as they not only indicated strong perceived abilities in these areas, they also enjoyed working in them. However, they were not especially positive about science. Unlike the MC typology, women in the SC typology (Type 2) clearly favored science over mathematics and computers. They not only preferred science over mathematics, but also expressed much more confidence of their own abilities in learning science than mathematics.
The meaningfulness of these typologies is bolstered by the analyses that indicated that women associated with the MC typology were most likely to select a non–STEM-related major (54%) or engineering (30%). In contrast, the women associated with the SC typology were predominantly science majors (60%). Furthermore, consistent with predictions from social cognitive models (e.g. Bandura et al., 2001; Lent et al., 2000), perceptions of support from parents, teachers, and friends for mathematics and computers were higher for the MC group compared to the SC group; however, support for science was higher for the SC group compared to the MC group. Thus, women in the different typologies appear to behave in ways that are consistent with the characteristics of their profile (major choice), and their perceptions of support also appeared to be aligned with the profile characteristics.
It is interesting that women in the MC group were much more likely to choose a major unrelated to STEM fields. One possible explanation is that mathematics (and increasingly computer skills) is widely used in many non-STEM fields such as finance, economics, business, and many behavioral sciences. Women who are good at mathematics and enjoy it can readily apply their skills to a variety of fields rather than only STEM. Therefore, women who have good mathematics skills would have greater career choices. This is consistent with the previous literature that for women who have greater choices of professions, their preference of a field significantly explains whether or not they would stay in STEM (Ceci et al., 2009).
Although the SC women were not strongly oriented toward mathematics per se, they did not express strong negative beliefs about their own competence or attitudes toward mathematics either. Rather, their science experiences were what made them distinct from the MC group. Together this suggests that narrowly focusing on mathematics academic skills might not be sufficient to promote interest in many STEM disciplines among women. In future studies, it would be very informative to examine what career paths the two types of women eventually pursue. We expect that women in the MC group may very well choose a career outside of traditional STEM fields.
It is important to recognize that the typologies in this study were developed on a sample of women who, by virtue of being enrolled in introductory STEM courses (ones that were required for a STEM major), must have already had considerable mathematics and science background. This sample seemed appropriate to us because college students with little or no STEM aptitude or experiences had likely ruled out STEM careers at an earlier point in time. It would be valuable to utilize QFA on a sample of female high school or middle school students because course selection during these years often sets a pathway toward or away from the possibility of a STEM major. Understanding profiles of girls at these ages might lead to better interventions to encourage STEM careers.
A limitation of the study is that there were relatively few women who had chosen computer science as a major, despite targeting computer science classes in our sampling. Unfortunately, this reflects a nationwide demographic of very few women being in computer science fields in the United States. Related, the findings may be more applicable to the context of the United States given that gender inequity is particularly salient in the United States. Nevertheless, some reports do suggest a similar concern in many Western European countries as well as several Asian countries (Mind the Gap, n.d.; UNESCO, 2016). While we included women participants from a wide range of STEM courses typically offered among most universities, it is still a convenience sample, thus one should be cautious in generalizing the findings. In addition, the women in this sample were largely first- and second-year college students, and different typologies might have emerged if we had sampled women in their final year of college with a firmly dedicated major and a clearer career path. The younger sample seemed more appropriate to us because of our interest in understanding factors that affect early academic decisions in college. Another limitation of the study is that only questions related to mathematics, science, or computer areas were asked. Had we asked about other subject areas such as language arts and social sciences, different typologies might have emerged.
In conclusion, using QFA, this study provided some new evidence that STEM research should examine mathematics, science, and computer subjects independently, especially for female students. We believe that the QFA approach would be useful for understanding academic and career decisions for girls and women at different stages of the lifespan.
Footnotes
Appendix
Factor array for Factor/Type 1 with descending z-scores on each statement.
| Item number | Statement | Z-score |
|---|---|---|
| 1 | When taking a math test I have studied for, I do very well | 1.040 |
| 2 | I could learn any kind of computer skills if I wanted to | 1.000 |
| 3 | If I learn about computers, then I will be able to do lots of different types of careers | 0.983 |
| 4 | I could learn to do any type of math problem if I wanted to | 0.912 |
| 5 | If I do learn a lot about computers, then I will be better prepared to go to college | 0.889 |
| 6 | When taking a science test I’ve studied for, I do very well | 0.864 |
| 7 | I like working on computers | 0.810 |
| 8 | I like figuring out how to do different things on the computer | 0.762 |
| 9 | I like math | 0.694 |
| 10 | If I do well in math, then I will be better prepared to go to college | 0.486 |
| 11 | If I learn science, then I will be able to do lots of different types of careers | 0.440 |
| 12 | I like science | 0.413 |
| 13 | I could learn to do any type of science problem if I wanted to | 0.407 |
| 14 | If I learn math, then I will be able to do lots of different types of careers | 0.346 |
| 15 | If I do well in science, then I will be better prepared to go to college | 0.334 |
| 16 | I like visiting science museums | −0.303 |
| 17 | I like watching science and technology programs on television | −0.326 |
| 18 | I would like to do science experiments outside of school | −0.614 |
| 19 | Doing science makes me nervous | −1.068 |
| 20 | Doing math makes me nervous | −1.301 |
| 21 | Learning math is more useful for boys than girls | −1.629 |
| 22 | Learning about science is more useful for boys than girls | −1.672 |
| 23 | Learning about computers is more useful for boys than girls | −1.712 |
| 24 | Working on computers makes me nervous | −1.755 |
Declaration of conflicting interests
The author(s) declared no potential conflicts of interest with respect to the research, authorship, and/or publication of this article.
Funding
This research was supported by a grant awarded to the second author from the National Science Foundation No. 0734074.