
Abstract
Numerous systems of musical notation have been developed to address some of the complexities associated with conventional Staff notation, such as translating it into physical movements and memorizing the meaning of its symbols. Surprisingly, there has been little empirical research assessing and comparing the comprehensibility of conventional versus alternative notation methods. In this study, three main features were assessed for 10 different musical notation systems: discriminability (the ease of visually distinguishing pitch or duration changes in notation), iconicity (extent of resemblance between melodies and notation), and complexity. A total of 213 valid responses were collected in an online experiment. Participants completed two tasks, visual discriminability and melody-notation matching. They also provided complexity ratings for different notational systems. Multilevel Bayesian regression models show strong evidence that Figurenotes, Numbered notation, and Piano Roll notation have a relatively high level of discriminability, while Figurenotes, Proportional notation, Staff notation, and Piano Roll notation have a relatively high level of iconicity. Piano Roll notation was rated the least complex musical notation system. Differences in the results across pitch and duration dimensions, age, and musical sophistication were also found. Importantly, we also examined the effects of the different visual variables used by the notational systems (color, position, shape): changes in position have the highest discriminability, iconicity, and the lowest complexity. Qualitative analysis for some open questions also supported Piano Roll notation as being the most favorable musical notation, especially among novices.
Introduction
Musical Notation
Adults’ interest in performing music is increasing, both professionally and as a hobby (Folkestad, 2006; Sobol, 2019). Musical notation allows pieces of music to be written down and transmitted from composers to performers. Although not every musician needs to learn to read music, many music students must still do so, and find it helpful for multisensory (i.e., visual, auditory, and motor) experience of music and group music making (Arthurs & Petrini, 2024). The process of learning to read musical notation can be cognitively demanding for adult novices (i.e., beginners with minimal musical background; Roulston et al., 2015). However, very few studies have investigated the challenges associated with learning to read such notation. One recent pertinent study revealed from interviews with 58 music students aged 15 to 20 that memorizing and identifying the notated positions of pitches on instruments, as well as calculating and playing notated durations accurately were difficult (Kuo & Chuang, 2013).
Many alternatives to traditional Staff notation have been developed to provide users with purportedly more accessible ways of studying and playing musical compositions, or as a form of scaffolding to help students learn to read Staff notation. Students need to understand the meaning of the symbols used in a particular type of notation before memorizing and performing them, but little is known about the comprehensibility of different types of notation. Therefore, the choice of notational systems in the current study was broad to fully investigate how users, especially beginning learners, perceive different types of musical notation. An assessment and comparison of their comprehensibility could help to increase the number of adults able to engage successfully with music and enhance the quality of their engagement. In the current study, we define comprehensibility as participants’ accuracy in differentiating notation excerpts (discriminability), matching them with melodies (iconicity), and their perceived complexity of different notational systems (complexity).
Different types of notation use images, symbols, and/or codes to represent musical sounds and instructions for their performance (Bouchard & Browne, 2019). Pitch is conventionally represented by the vertical position of symbols, illustrated in Figure 1 (left: Staff notation), but it can also be represented by numbers, as illustrated in Figure 1 (right: Numbered notation). It has been suggested that novices find the latter, with its simple, space-constrained presentation, easier to use (Jiang et al., 2006; Min, 2011). Notational systems using colors to denote pitches have also been developed, as illustrated in Figure 2, and have been reported to appeal to beginners learning to read music (Rogers, 1991; Rogers, 1996). Similarly, the representation of duration is diverse.
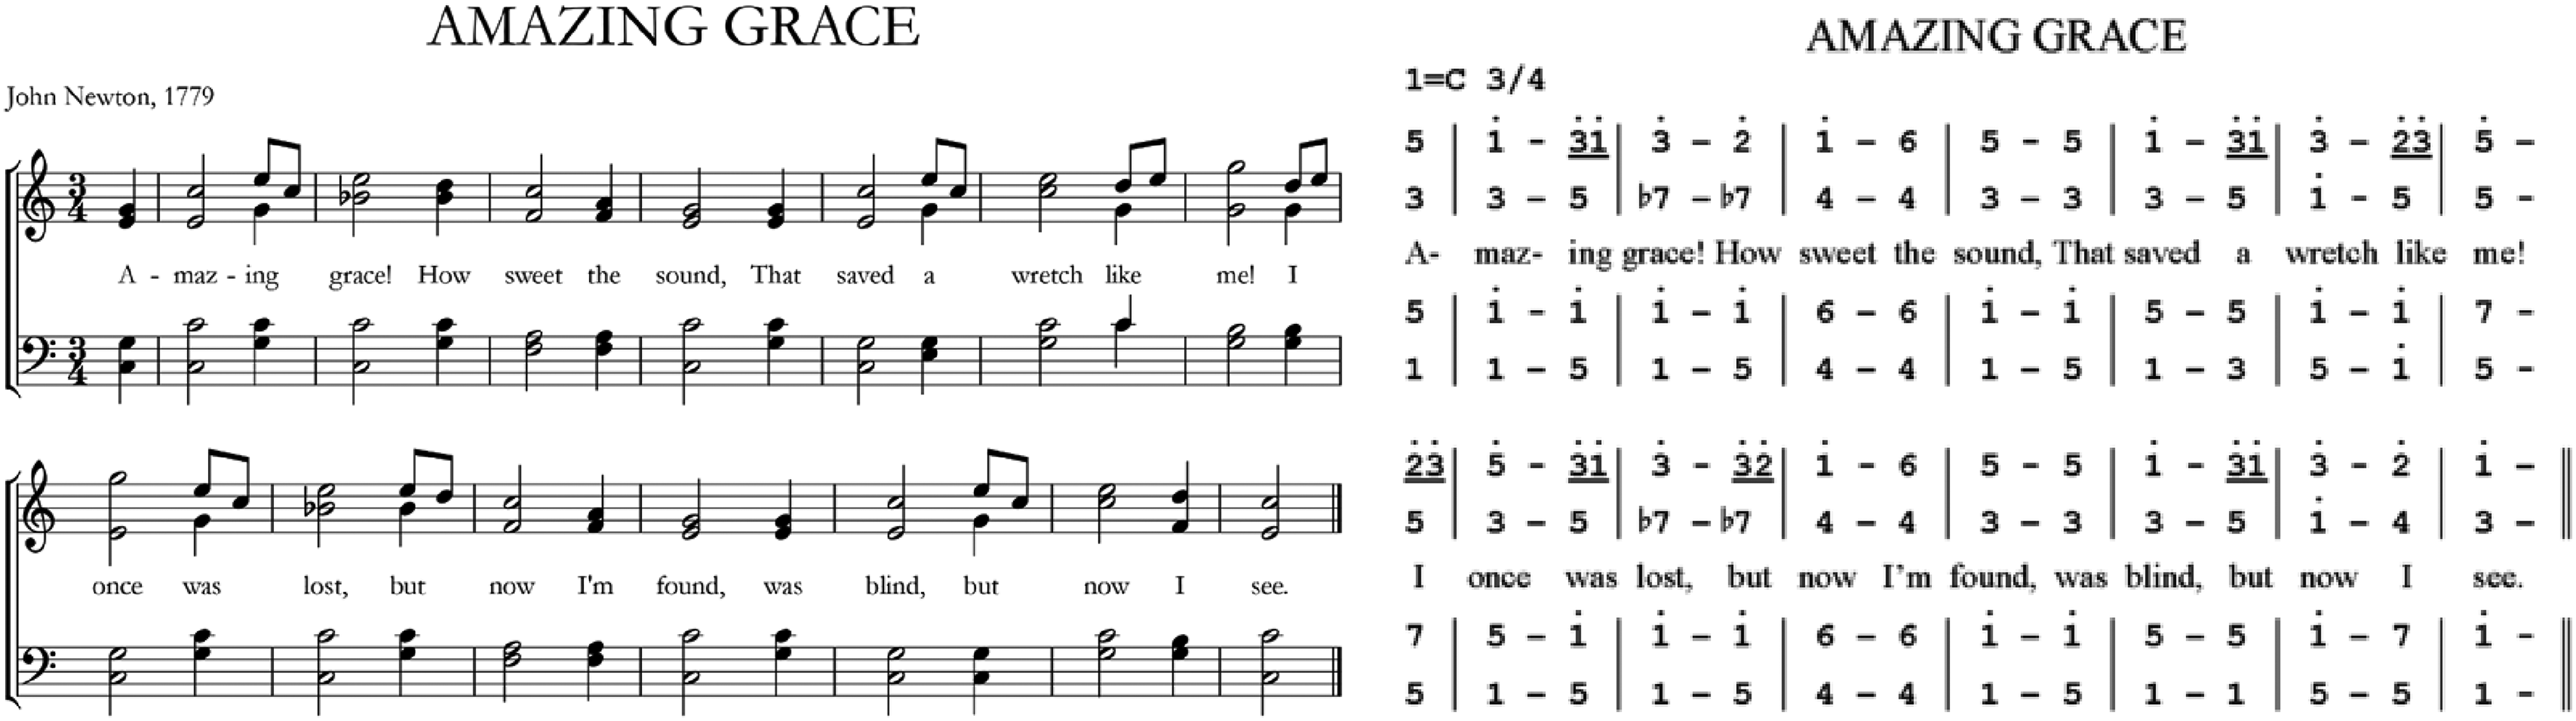
Examples of staff notation (left) and numbered notation (right).

Example of colored notation: Figurenotes (hues represent pitches, subdivisions of lattices represent durations).
Visual Variables
Musical notation can be seen as a way of visualizing sound (Halpern & Bower, 1982). According to the French cartographer Jacques Bertin (1918–2010), information can be visualized using seven variables: position, size, shape, value, hue, orientation, and texture, as illustrated in Figure 3 (Bertin, 1983). These can be used to translate information from one domain into another, therefore musical notation can be categorized into the visual variable(s) they use to represent pitch and duration. For example, Staff notation and Numbered notation use shape to represent duration, and Figurenotes uses color hue to illustrate pitch.
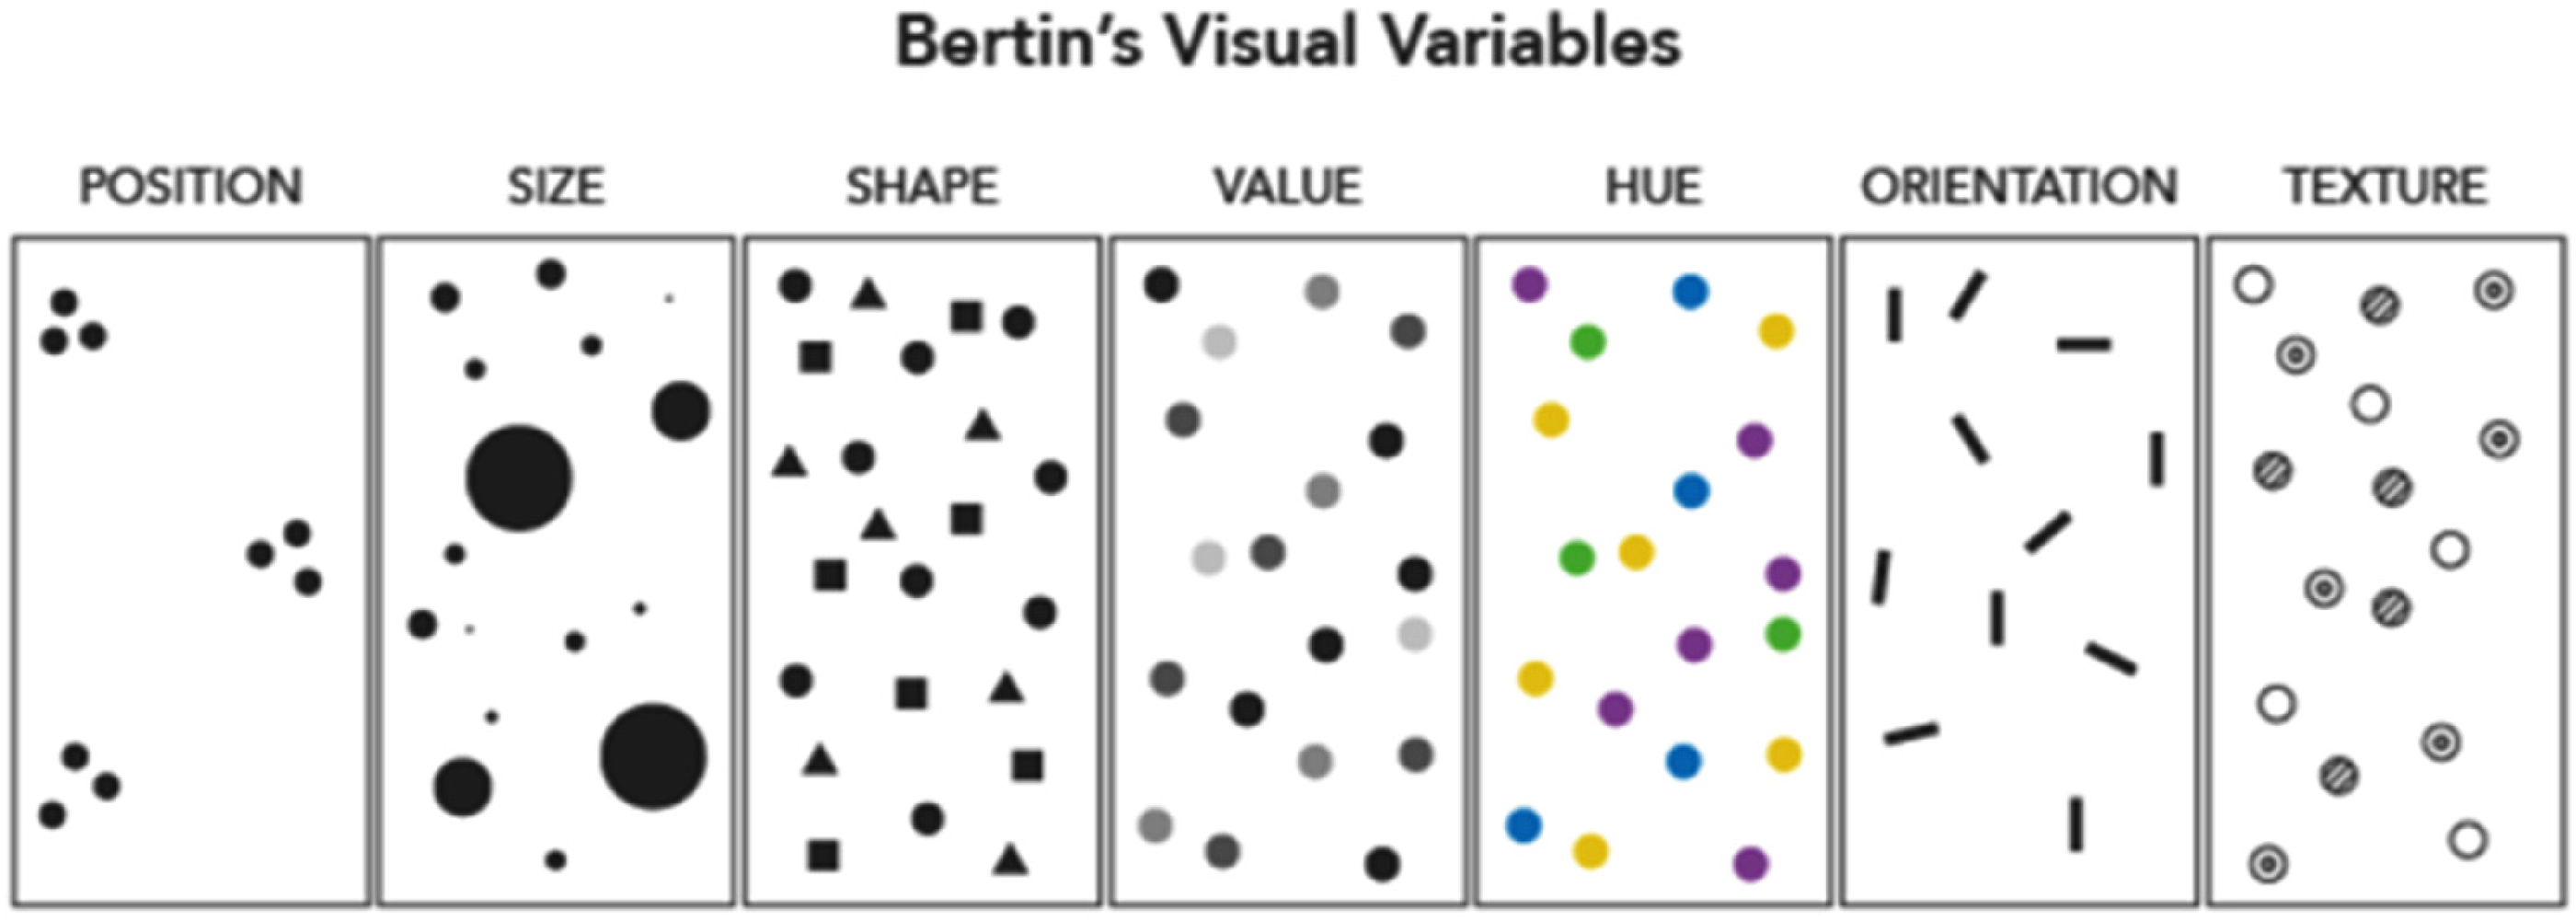
Bertin's visual variables (Axis Maps, n.d.).
Each visual variable has five characteristics used for conveying different kinds of information: selective, associative, ordered, quantitative, and length. The selective characteristic of a variable refers to variations that make discrimination easier (e.g., it is easy to distinguish symbols of different sizes). The associative characteristic permits symbols to be categorized according to variations in the presentation of the variable (e.g., symbols with the same hue or orientation can be grouped together). The ordered characteristic supports an ordered reading of variations (e.g., from small to large in size, and/or light to dark in value). The quantitative characteristic allows variations to be interpreted numerically (e.g., one symbol can be twice the size of another). Thus, different systems of musical notation use different visual variables to represent different musical dimensions, and characteristics of the adopted visual variables could be directly tied to their ability to represent different data. For instance, ordered visual variables are perfect for representing ordinal or interval properties. In musical notation, pitch and duration are interval data, therefore a quantitative representation may facilitate learners’ comprehension.
Comprehensibility: Discriminability, Iconicity, and Complexity
In the current experiment, we focused on the two main dimensions of note-based music: pitch and duration (Schön & Besson, 2002). We assessed the discriminability, iconicity, and complexity (all explained later) of the symbols representing pitch and duration in different notational systems to assess how well adult novices understood them. In signal detection theory, discriminability (also known as d-prime or sensitivity) is the extent to which a signal can be detected or distinguished from noise (Green & Swets, 1966). We defined it for the purposes of the present study as the extent to which participants could visually discriminate between pitches (e.g., C and C sharp) and durations (e.g., a quaver [eighth note] and crotchet [quarter-note]) in each of the notational systems. We tested discriminability in a visual discriminability task in which participants made same–different judgments modeled on pattern-matching tasks (e.g., Hak & Dul, 2009), such as those used in research on expertise (Busey et al., 2017; Waters et al., 1997) and cognitive musicology (Calvo-Zaragoza et al., 2020; Homenda, 2005). A notational system rated high for discriminability would be one in which users can easily see and distinguish the symbols, making it easier to understand and learn. The level of discriminability may relate to the extent to which the visual variables used in the notational system have selective characteristics.
Musicians are good at audiation, and notational audiation is the process of translating visual information in the form of notation into auditory information (Brodsky et al., 2008; Drai-Zerbib & Baccino, 2014; Drai-Zerbib et al., 2012; Wong & Gauthier, 2012). The easier it is to translate visual information into auditory information and vice versa, the simpler it is likely to be to read and learn music. We assessed this by reference to iconicity. We defined it for the purposes of the present study as the extent to which participants perceived a resemblance between (1) symbol and pitch (e.g., in traditional Staff notation, the note's spatial height indicates its pitch), and (2) symbol and duration (e.g., in Piano Roll notation, a note's spatial length indicates its duration). We tested iconicity in a matching task in which participants were played a short melody with two notation excerpts, and asked to choose the excerpt that matched the melody. The results of research on recognition for American Sign Language (ASL) suggest that only beginner learners benefit from sign iconicity. In a study by Baus et al. (2013), adult participants recognized iconic translations faster and more accurately than noniconic signs. It is possible that high iconicity may also help adult novices to learn musical notation systems. Notational systems using visual variables with ordered and/or quantitative characteristics, such as in the preceding examples, are likely to be more iconic than others.
Visual recognition, memory, learning, and task performance are all affected by complexity (Tuch et al., 2009). The complexity of a visual stimulus can be measured by counting its elements, gauging the (dis)similarity between them and the extent to which they are perceived as a unit (Berlyne, 1960); the size of its computational representation (e.g., of a jpeg or other digital image) (Donderi, 2000, 2006); or spatial frequency (Campbell & Robson, 1968; Glezer et al., 1973). Since there is no agreement of the measurement of the object complexity, we decided to gather complexity ratings from participants in the present study.
The Present Study
Few empirical investigations of the relative comprehensibility of different musical notation systems have been conducted. Different music genres or even cultural contexts often have distinct notational requirements that reflect the unique characteristics, practices, and performance. While classical music emphasizes precision and detail, genres such as jazz and popular music prioritize flexibility and improvisation, often using more simplified or symbolic forms of notation. The focus of the current study is to investigate the notation of short monophonic melodies as the foundational step for beginning learners in their journey to read music. As exploratory research, the aim is to understand how learners interact with different notational systems by examining both the accuracy and the speed with which they discriminate and interpret familiar and unfamiliar notation. By analyzing these interactions, the study seeks to identify specific features within these notational systems that either facilitate or hinder the learning process.
Eight existing musical notation systems were chosen to cover a broad range of notational systems: ABC notation, Figurenotes, FigureStaff, Numbered notation, Piano Roll notation, Proportional notation, Staff notation, and Piano Tablature. ABC notation uses note names (C D E F G A B) to represent pitches and numbers to represent durations, which is designed for transcribing and sharing music online, as well as adding a new and simple language for software developers, not unlike other notation designed for ease. ABC and Numbered notation (exemplified and explained in Figure 1) are both text-based notational systems. Figurenotes is exemplified and explained in Figure 2. A combination of the pitch dimension from Figurenotes and the duration dimension from Staff notation (see Figure 1) constitutes FigureStaff notation. This notation was suggested as a progression from Figurenotes to Staff notation on the Figurenotes website, which is worth further investigation in future research. Piano Roll notation symbolizes pitch using vertical position and duration with the length of grids, which could be helpful performing keyboard instruments as the setup closely mirrors the layout of those instruments. Proportional notation (as we define it here) uses proportional spacing for note duration on the time-axis of the staff to indicate rhythm but is otherwise identical to Staff notation. The comparison of Staff notation and Proportional notation may indicate the effect of proportional layout of duration symbols. Piano Tablature applies colored lines to match black keys on the keyboard to represent pitch, and the duration symbols are the same with those in Staff notation. Therefore, it serves as a hybrid system that combines instrument-centered pitch representation with the conventional style of duration notation. Figure 4 demonstrates an example of all the notational systems representing the same musical excerpt.

Eight existing systems of musical notation represent the same musical excerpt (and the application used to make notation excerpts).
Prior to running the experiment, guided by Bertin's theory of visual variables, we categorized musical notation systems into the visual variable(s) they use to represent pitch and duration (Table 1). Three visual variables were considered: Shape, Color, and Position. As shown in the table, some systems apply two visual variables to indicate pitch or duration. For example, Figurenotes uses colors to represent pitches in one octave and shapes to represent octaves.
Visual variable(s) used in different musical notation systems.

We also anticipated the discriminability and iconicity separately for pitch and duration, as shown in Table 2. Since no previous research was found investigating the relationship between the characteristics of visual variables and their comprehensibility in musical notation field, we proposed a general principle applied in the present study as detailed in the previous subsection (selective visual variable may facilitate a high level of discriminability, and ordered and/or quantitative visual variable may lead to high iconicity). For example, ABC notation uses the visual variable shape to represent pitch and duration; shape does not possess the selective characteristic, so we expected it to have a low level of discriminability. Notational systems that adopt the visual variable Position to represent duration may lead to a high level of iconicity because Position is ordered and selective. Since we collected subjective ratings of complexity, there were no prior assumptions about the complexities of the different systems.
Eight existing musical notation systems and their anticipated discriminability and iconicity in pitch and duration dimensions.

Our fundamental aims are to assess the comprehensibility of 10 notational systems and how that comprehensibility is influenced by the visual variables (position, shape, and color) used to represent musical pitch and duration. To do this, we conducted an experiment to measure the discriminability, iconicity, and complexity of 10 notational systems, most of which were unfamiliar to the participants. Besides the eight existing systems, two additional systems were created to cover a full combination of the levels of anticipated discriminability and iconicity (details are presented in the Material subsection of the Methods section). For discriminability and iconicity, we measured the accuracy and the speed of responses; for complexity, we collected subjective ratings. These dependent variables serve as indicators of comprehensibility. Complexity and its correlations with discriminability and iconicity were analyzed as well. We also analyzed the comprehensibility of the visual variables applied in the notational systems we examined. Moreover, participants’ prior familiarity with each notational system, their musical sophistication levels (using Gold-MSI score), and their age were modeled to examine how these factors modified the comprehensibility of the different notational systems. We asked participants after each task whether they developed any strategy to complete the task in two open questions, meanwhile their favorite and/or least favorite notational systems were collected in an individual open question at the end of the experiment.
To the best of our knowledge, none of these questions have been addressed in previous empirical research. Therefore, we believe that we can provide some useful preliminary evidence for the following three research questions in this study: RQ1. What is the comprehensibility (discriminability, iconicity, complexity) of 10 different notational systems? RQ2. How is the comprehensibility influenced by the underlying visual variables? RQ3. How do other factors (familiarity, age, musical sophistication, task strategies, and liking) modify the above effects?
Method
Participants
Adults (n = 213) without visual and hearing impairments were recruited. The study was approved by the ethics committee of Western Sydney University (REC number: H14499). All participants provided written consent for their participation, the collection of the data, and any further publication. There were 61 males, 149 females, and 3 people who were nonbinary, with an age range from 18 to 81 years (M = 33.54, SD = 16.50). Perception is influenced by expertise, therefore the Goldsmith musical sophistication index (GMSI) was included in the demographic section to account for a possible influence of musical sophistication (Müllensiefen et al., 2013). The GMSI is derived from subscales measuring active musical engagement, music perceptual abilities, musical training, emotional engagement to music, and singing abilities (Müllensiefen et al., 2014). The present sample showed a mean GMSI of 73.94 with a standard deviation of 18.95, ranging from 30 to 117, and thus slightly lower than the original GMSI sample (M = 81.58, SD = 20.62, range 18–126). A total of 102 participants claimed no familiarity with any form of musical notation. Among those who were familiar with various notational systems, 76 participants were familiar with Staff notation, 25 with Piano Roll notation, 14 with Numbered notation, 9 with Figurenotes, 8 with Proportional notation and Piano Tab, respectively, and 5 with ABC notation. Recruitment advertisements were placed on social media (Facebook, Instagram) and online study websites (“Survey Circle,” “Online Psych Research,” and “Psychology Research on the Net”). In addition, emails were sent through the social networks of the researchers.
Materials
Apart from the eight existing notational systems (Figure 4), we also created two notational systems to ensure a broad range of discriminability and iconicity combinations: one was designed to be low in discriminability and iconicity for both pitch and duration dimensions (ColorShape); the other was designed to have high discriminability and high iconicity in the pitch dimension but low in the duration dimension (OrientColor). ColorShape notation uses 12 hues to represent 12 chromatic pitches and five shapes to represent durations (semibreve/whole note, minim/half note, crotchet/fourth note, quaver/eighth note, semiquaver/sixteenth note). The hues and shapes chosen were deliberately similar to each other so that they were hard to discriminate (Figure 5). OrientColor notation adopts a clockface design so 12 different orientations describe 12 chromatic pitches, and we selected five similar colors to present durations (Figure 5).

Two novel systems of musical notation represent the same musical excerpt (and the application used to make notation excerpts).
In the experiment, a rolling design was adopted where each participant experienced four notational systems out of the 10. Melodies from the Melodic Discrimination Test were used, and notation excerpts were transcribed from the melodies (Harrison et al., 2017). The four notational systems that each participant experienced were in four blocks respectively, and each block had 20 trials.
Procedure
An online experiment was designed and conducted via Qualtrics and PsychoPy/Pavlovia. Participants’ demographic data were collected first, which included age, gender, education, familiarity with notational systems, and musical sophistication (Gold-MSI). The familiarity was measured by a multiple-choice question asking “Are you familiar with any of the musical notation systems (mentioned) below?” and the names of the eight existing musical notation systems used in the experiment were listed. In the statistical analysis, we also grouped the participants who were familiar with Staff notation as being also familiar with Proportional notation due to their similarity (if you understand the former you will also understand the latter).
In the following experimental tasks, participants were instructed to respond as quickly as possible. There were two tasks: visual discriminability task (discriminability), and melody and notation matching task (iconicity). In each task, participants were given four trials without feedback to practice and familiarize themselves with the procedure.
In the discriminability task, participants were given two notation excerpts from the same notational system and responded depending on whether these two excerpts were the same or different (Figure 6). Each pair of note sequences was presented on the screen for 750 ms (this time was established in a pilot study in order to avoid ceiling and floor effects, which became evident at 500 ms and 1000 ms, respectively). If participants thought the excerpts were the same, they were instructed to press the “S” key on the keyboard; otherwise they were instructed to press the “D” key. There were 80 trials for each participant in this task (20 trials×4 notational systems). Among all the 80 trials, 40 trials were the same, the others differed in either pitch (16 trials) or duration (16 trials) or both pitch and duration (8 trials).

An example of notation excerpts (staff notation) in the discriminability task (in the iconicity task, visual stimuli were presented in the same way except auditory stimuli were also presented).
In the iconicity task, participants listened to a melody and then made a forced choice between two notation excerpts from the same notational system, only one of which matched the auditory stimulus (Figure 6). They were told to make choices according to their intuition. If participants thought the left one matched the melody, they were instructed to press the “F” key on the keyboard; otherwise to press the “J” key. There were 80 trials for each participant in this task (20 trials×4 notational systems). Together each participant went through 160 trials in the experiment (80 trials×2 tasks).
Participants were able to take a break between each block. The orders of trials and blocks were randomized, but the order of the tasks was not randomized. Participants completed the discriminability task first and then the iconicity task. Tasks were presented in this order because the presentation time of the visual stimuli was not limited in the iconicity task, so participants might gain familiarity with the notation excerpts, thereby interfering with their performance in any subsequent task. Both reaction times and accuracy were recorded for the two tasks. After completing each task, there was an open question asking whether they developed any strategy to complete the task.
After finishing the experimental tasks, participants were then given an example picture of each notational system that they went through in the previous tasks and were asked for ratings of complexity on a 5-point Likert scale (1 = not complex, 5 = extremely complex, no description for the other three points). One final set of questions was asked at the end, including open questions inviting further comment (“Which musical notation system is your favorite, and which one is your least favorite? Why? Do you have any other comments?”). The whole experiment took around 30 min to complete.
Data Analyses
The quantitative data were modeled and analyzed in R Studio (version 2022.02.0) and R (version 4.1.2) with the brms package (version 2.16.3, Bürkner, 2017a, 2017b) using Stan (Carpenter et al., 2017). The scripts and data are available at https://osf.io/32zra/?view_only=964d6050d4a94a1fa3387bf6d93f8c06. In contrast to the classical (frequentist) paradigm, the Bayesian paradigm interprets probability as a level of uncertainty (De Finetti, 2017; Van de Schoot & Depaoli, 2014). Multilevel Bayesian regression models were used to evaluate the effects of the independent variables (IVs; Task, NotationSystem, Dimension, Familiarity, GMSI, and Age) on the dependent variables (DVs; Accuracy, Reaction times, Complexity ratings). Accuracy models are Bernoulli (logistic) regression, whereas Reaction times and Complexity models are cumulative normal (ordinal) regression. Accuracy was coded as 0 for incorrect answers and 1 for correct answers, and the chance level was 0.50. The task was coded as a factor TaskFct with two levels: discriminability or iconicity. NotationSystem was coded as the names of the 10 notational systems: ABC, ColorShape, Figurenotes, FigureStaff, Numbered, OrientColor, Proportional, PianoRoll, Staff, and Tablature. Dimension measured whether the notation excerpts differed in pitch or duration or both dimensions, and was coded as pitch, duration, or both. Familiarity measured whether participants were familiar with that or a similar notational system, and was coded as 0 for unfamiliar and 1 for familiar. GMSI and Age were scaled as they were continuous variables. When analyzing the main effect of each predictor across musical notation systems, NotationSystem was sum coded as NotationSystem_sum. The interactions between each predictor were examined as well.
Before analyzing data in Bayesian analyses, a prior distribution needs to be chosen to reflect the amount of (un)certainty in a parameter (Van de Schoot & Depaoli, 2014). Because there was little knowledge about the impacts of the parameters included, the priors applied in all our models are what are known as weakly informative priors (Carpenter et al., 2017; Gelman et al., 2014). Our nonbinary predictors were all standardized (they then have a mean of 0 and a standard deviation of 1, indicating that effect sizes with large magnitudes are implausible). Intercept and Task were group-level effects varying by participant in all the models.
We used a prior with a student's t-distribution with three degrees of freedom, a mean of 0, and a scale of 2.5 for all population-level effects except the intercept. The zero mean implies that our prior beliefs weakly favor the null hypothesis of zero effect size, and in comparison to a flat uninformative prior, help to regularize estimates, reducing overfitting. All reported models fitted without divergences and had Rhat values below 1.05. Posterior predictive checks confirmed that appropriate distributional families had been chosen (plots for posterior predictive checks are available at https://osf.io/32zra/?view_only=964d6050d4a94a1fa3387bf6d93f8c06).
Given the Bayesian framework, we do not report p-values. Instead, we present the evidence ratios and posterior probabilities that each coefficient, or sums of coefficients defining a contrast of interest, is greater than (or less than) zero. Evidence ratios are calculated from the entire posterior distribution. We employed the following principles to qualify the weight of evidence for or against any given hypothesis: evidence ratios greater than 19 for a single-sided test and 39 for a double-sided test constitute strong evidence, and these are somewhat analogous to single- and double-sided p-values of <0.05 (Makowski et al., 2019).
Qualitative statements were integrated from three open questions: the strategy question after each task, and one final open question (described in the Procedure section). It was optional to answer each open question, and we obtained 127 answers for the discriminability strategy question, 100 for the iconicity strategy question, and 122 for the liking question.
Results
Notational Systems
In Figure 7, we present the accuracy of responses for the 10 NotationSystem in the two tasks (Accuracy ∼ TaskFct * NotationSystem + (TaskFct | participant)). It is clear that Figurenotes, Numbered notation, and Piano Roll notation had a high level of discriminability, whereas OrientColor and Piano Tablature had a low level of discriminability. For the iconicity task, Figurenotes, Piano Roll notation, Proportional notation, Staff notation, and Piano Tablature showed high accuracies, whereas ABC notation had the lowest accuracy. Reaction time results (RT) also indicated that Figurenotes and Piano Roll notation had the quickest performance in the iconicity task (Figure 8). As commonly observed, there was a negative correlation between task accuracy and RT (r = -0.35).
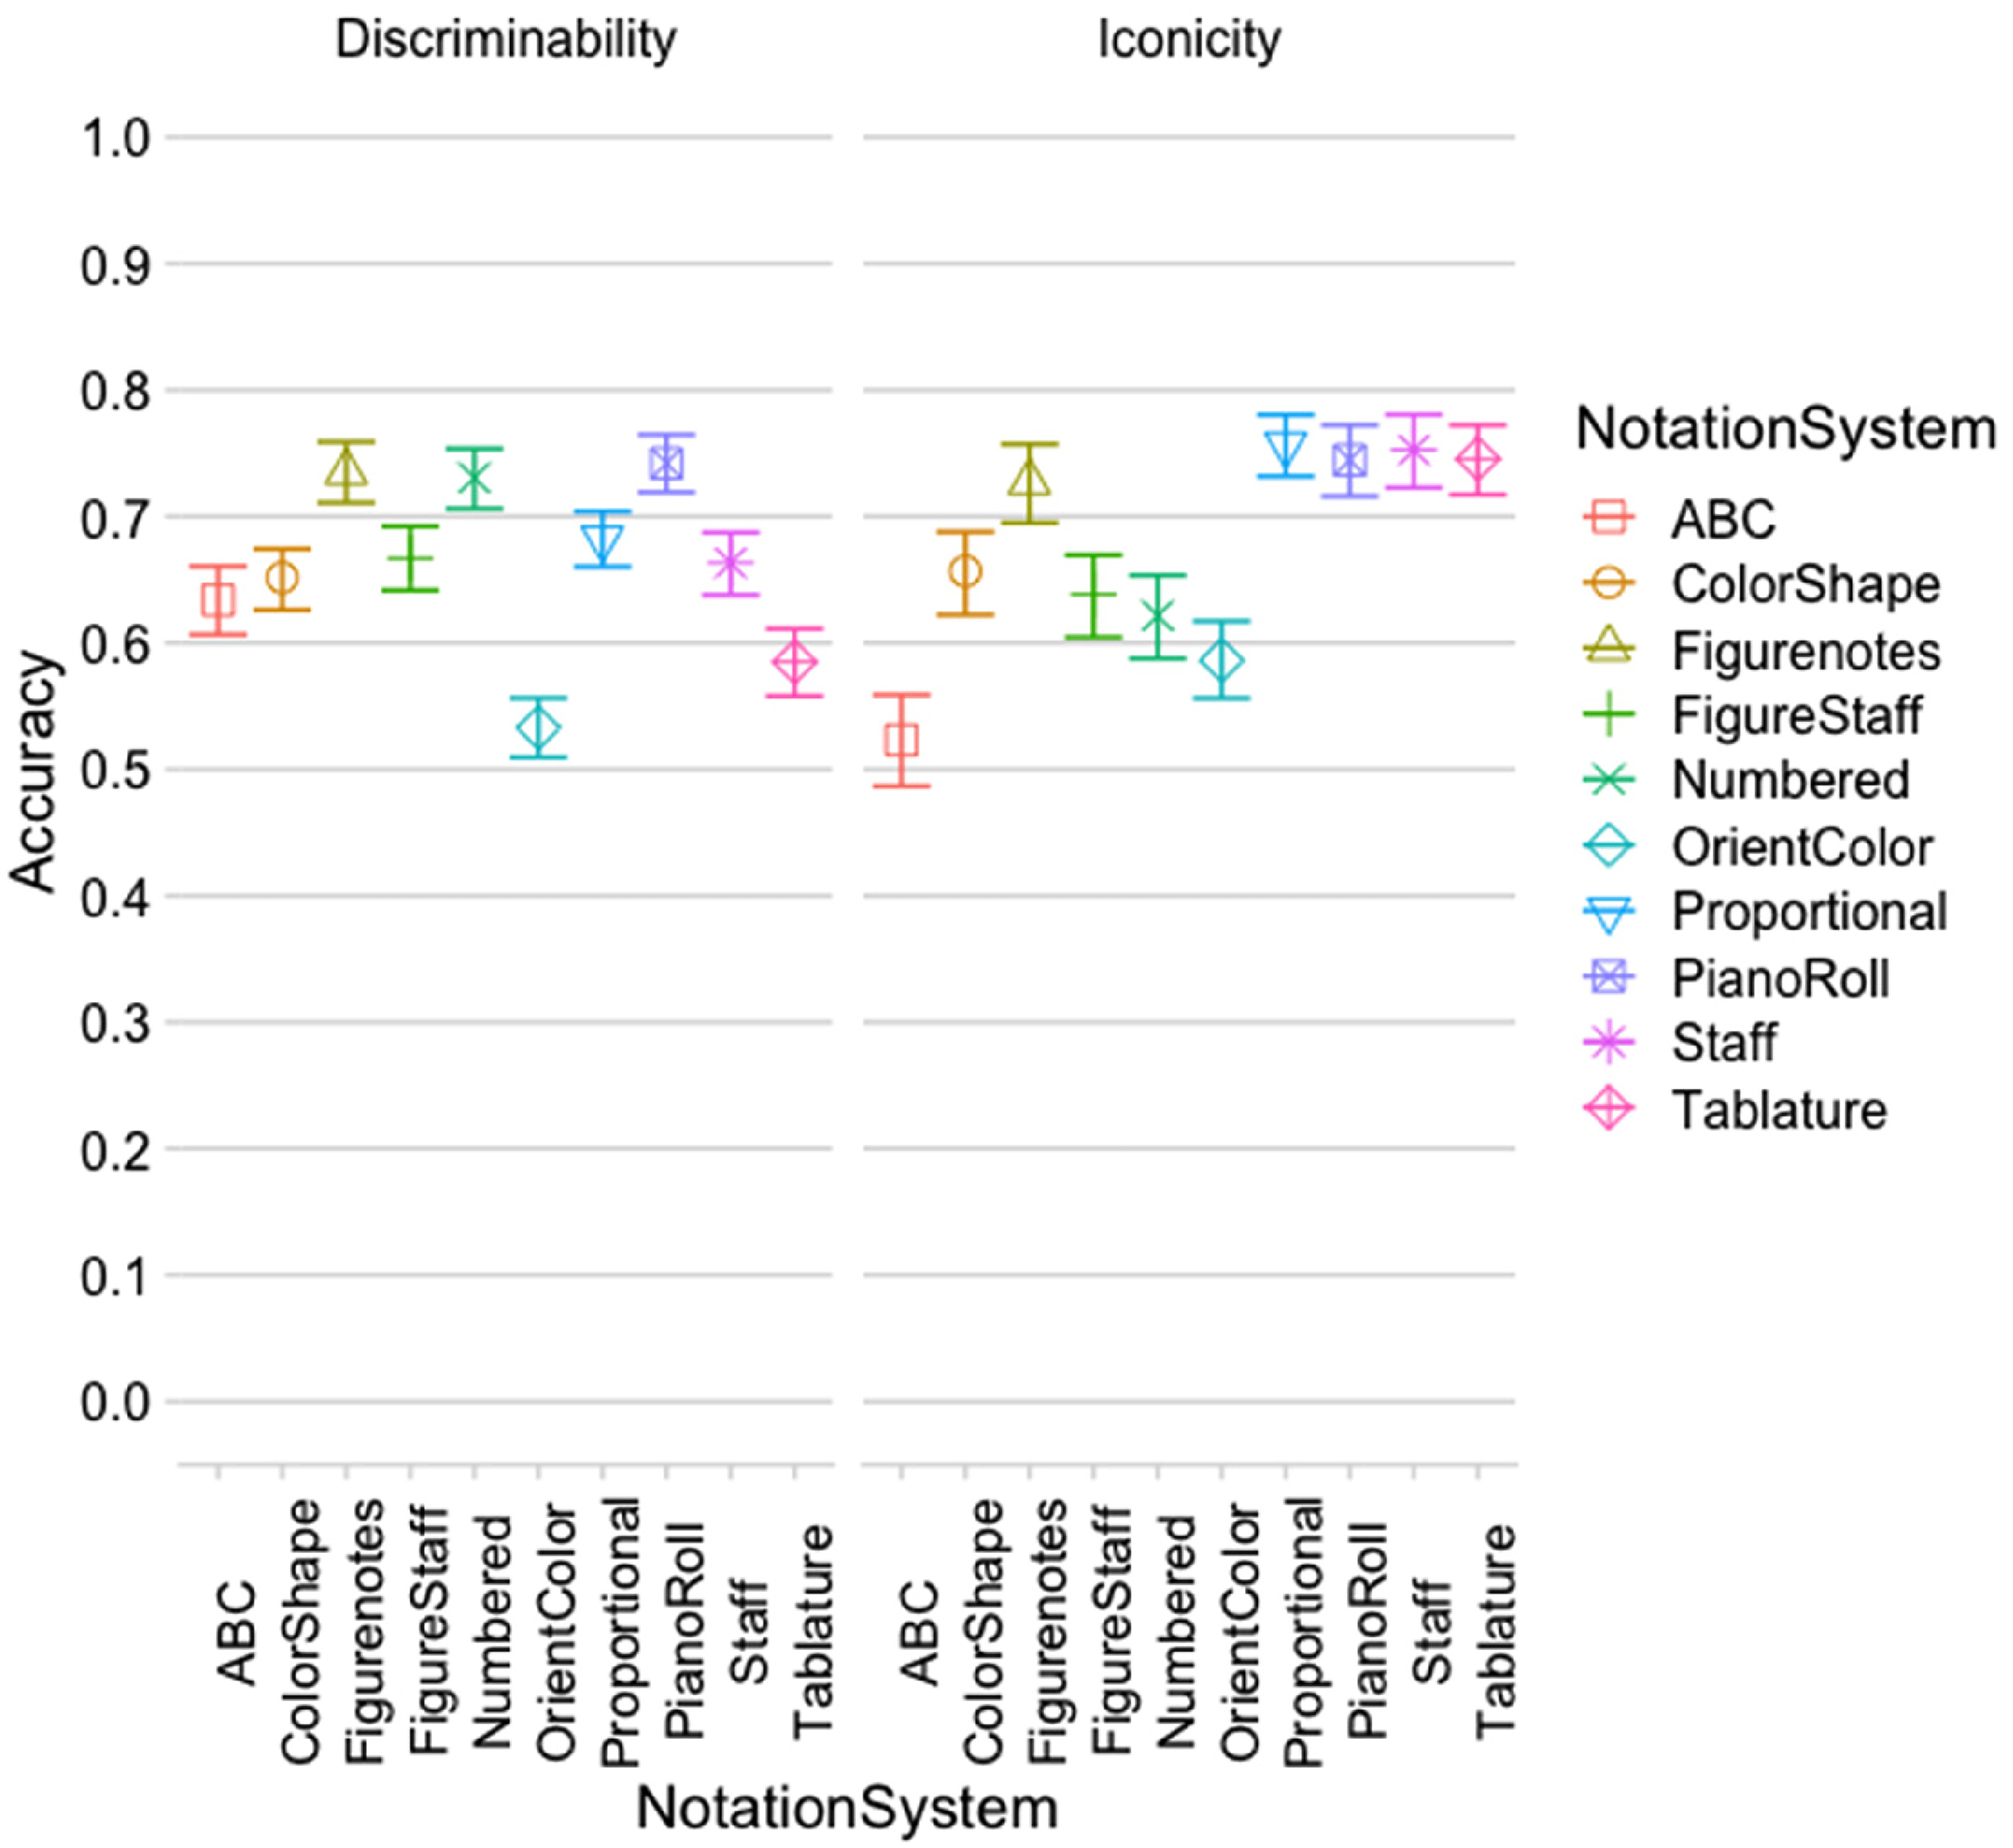
Mean accuracy with 95% credibility intervals in two tasks with 10 notational systems.

Mean reaction times (RT) with 95% credibility intervals in two tasks with 10 notational systems.
As for the overall complexity ratings, Piano Roll notation (2.02) was rated as the least complex notational system, followed by Proportional (2.53), Piano Tablature (2.56), Staff (2.71), Figurenotes (2.86), FigureStaff (3.15), ColorShape (3.22), Numbered (3.38), OrientColor (3.88), and ABC (4.26) as the most complex (Complexity ∼ 1 + NotationSystem + (1 | participant)). The correlation between the complexity ratings and the task accuracy was strongly negative (r = -0.73). The correlation between the complexity ratings and the task RT was positive (r = 0.34).
Dimension
Since notation excerpts varied in pitch, or duration, or both pitch and duration, we analyzed the predictor “Dimension,” a factor with three levels both, duration, and pitch. The posterior effects of Dimension provide very strong evidence that discriminability accuracy was better when only duration or both pitch and duration were manipulated in notation excerpts, compared with when only pitch changed. Iconicity accuracy was better when notation excerpts differed in both dimensions than in duration or pitch alone (Accuracy ∼ TaskFct * NotationSystem_sum * Dimension + (TaskFct | participant), Figure 9, Table 3 for hypothesis test).

The main effect of dimension across notational systems on two tasks.
Hypothesis tests of the main effect of dimension.

CI (Confidence Interval): 90%-CI for one-sided and 95%-CI for two-sided hypotheses.
: For one-sided hypotheses, the posterior probability exceeds 95%.
Posterior probabilities of point hypotheses assume equal prior probabilities.
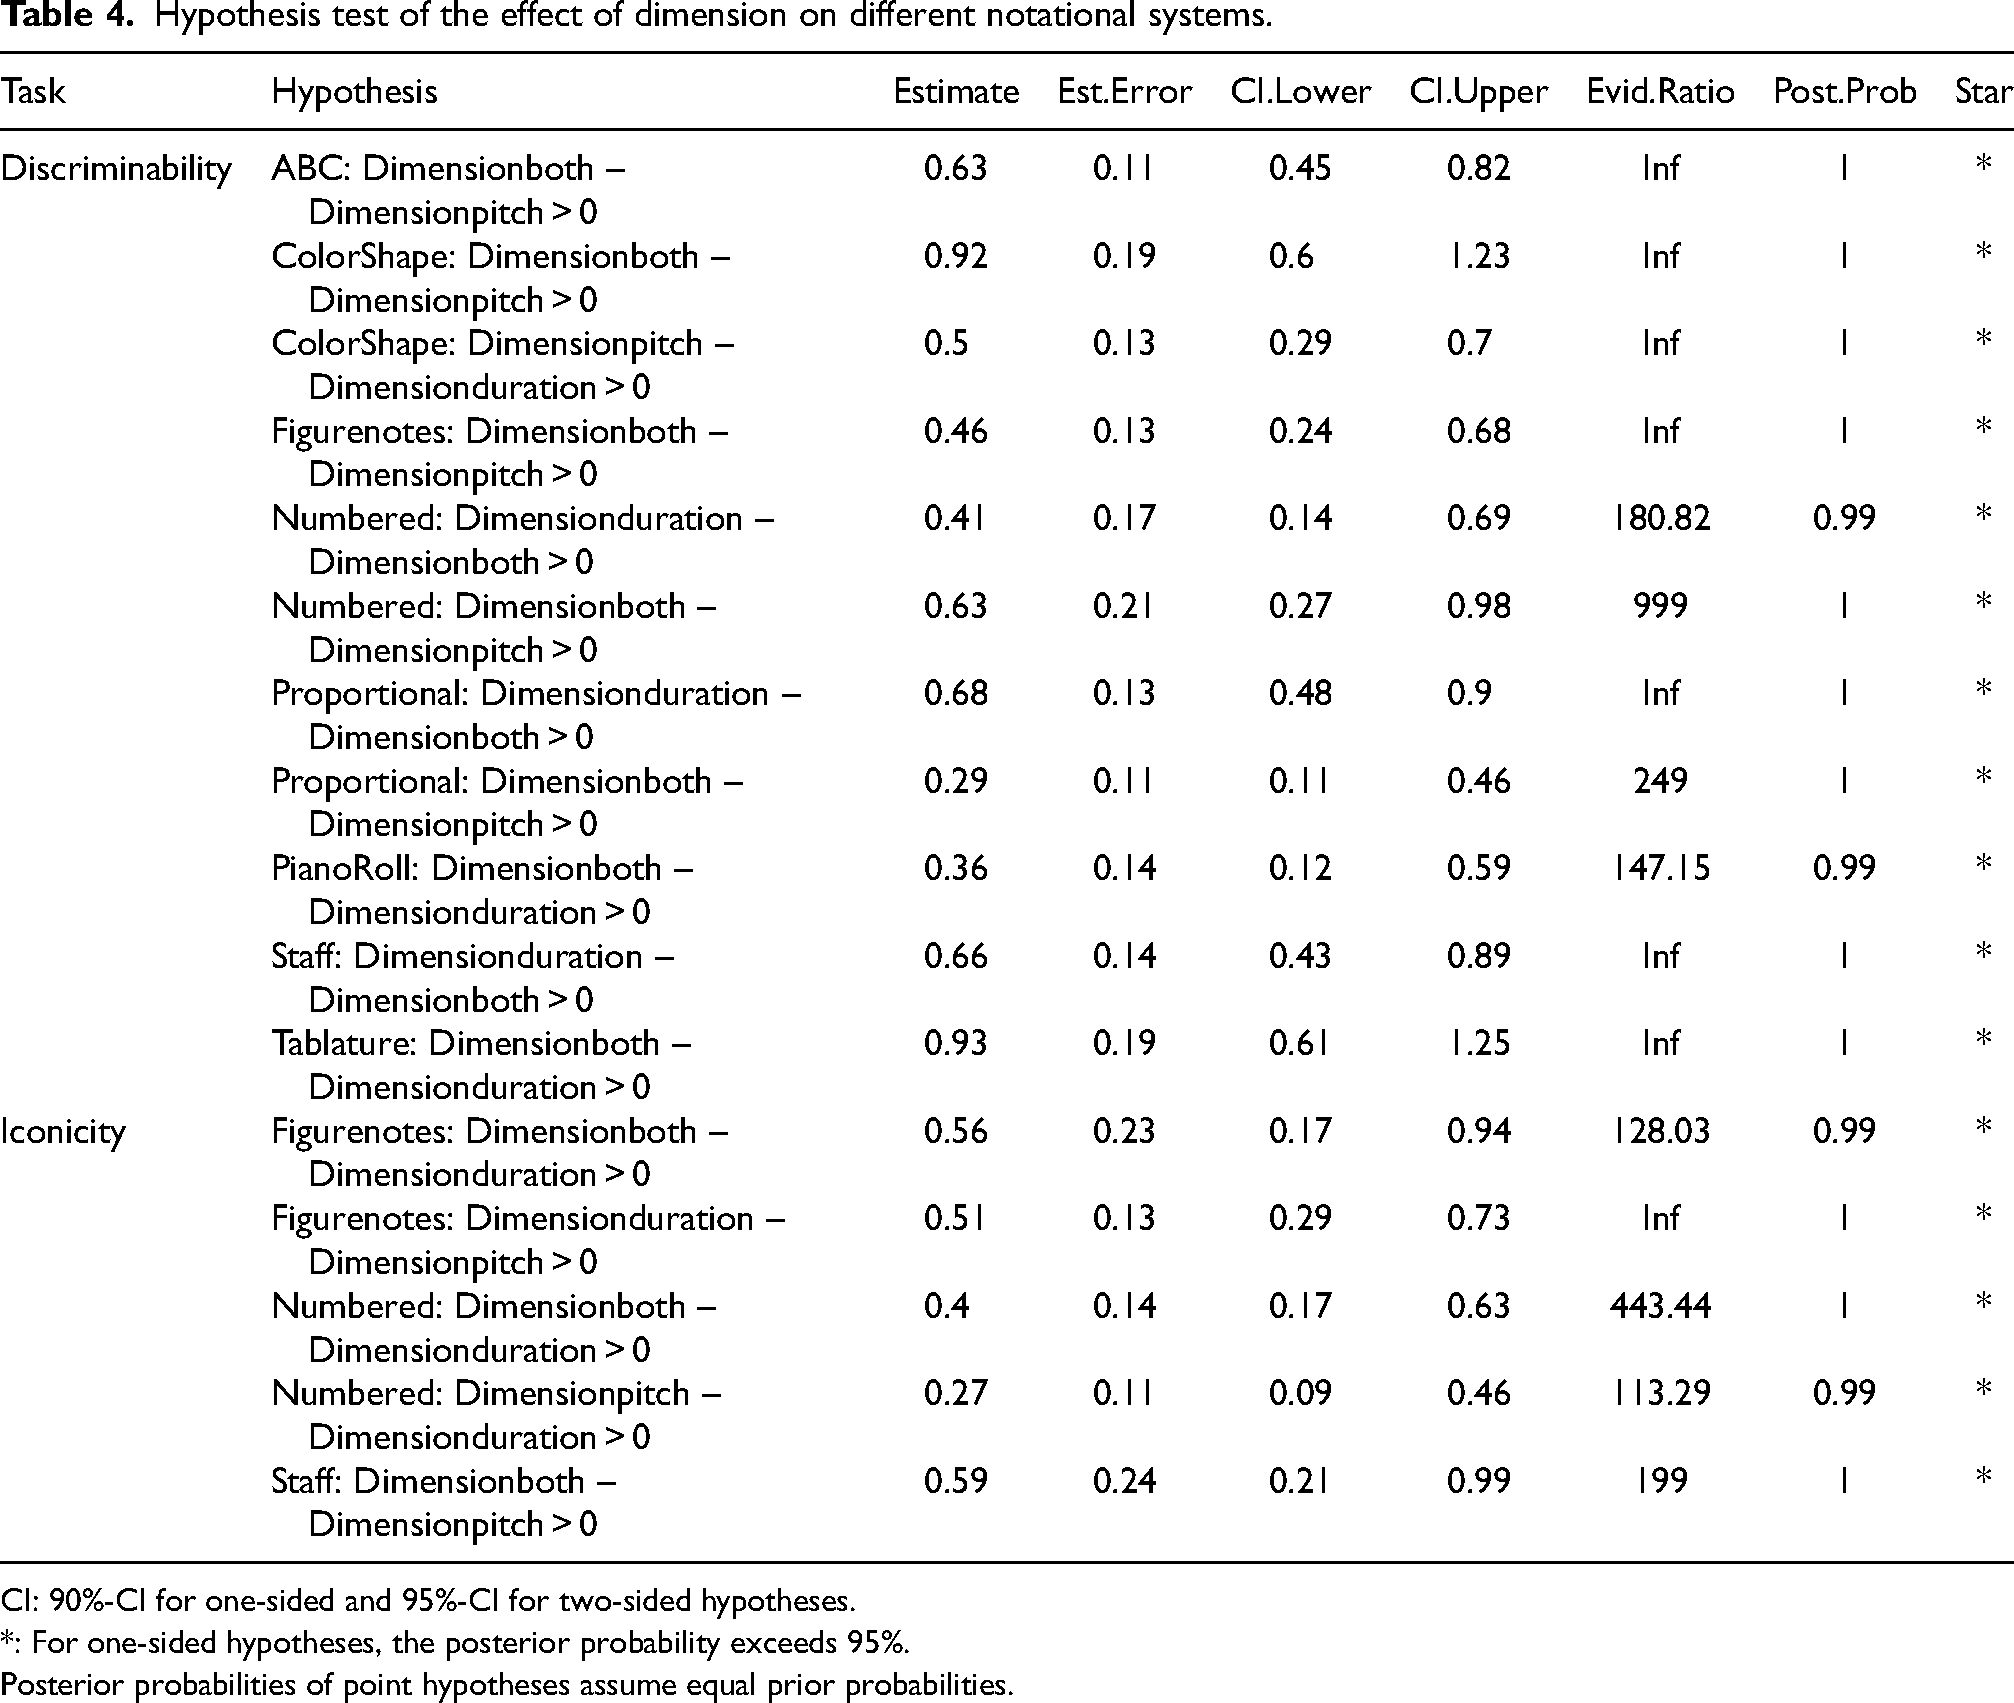
When we examined the effects of Dimension in each notational system, the outcomes were distinct from each other (Accuracy ∼ TaskFct * NotationSystem * Dimension + (TaskFct | participant); Figure 10). In ABC notation, we found very strong evidence that pitch dimension had the worst discriminability performance. In ColorShape notation, discriminability was the best when notation excerpts differed in both dimensions, followed by just pitch, and was the worst when only duration changed. In Numbered notation, Proportional notation, and Staff notation, participants performed the best in discriminability when notation excerpts differed in the duration dimension compared with the pitch or both dimensions. In Piano Roll notation and Piano Tablature, very strong evidence was revealed that participants discriminated notation excerpts manipulated in both dimensions better than just duration or pitch dimension. As for the iconicity accuracy, most of the notational systems did not show strong differences across dimensions. However, in Figurenotes, participants performed better when excerpts differed in both dimensions compared with just the duration dimension or the pitch dimension. In Numbered and Staff notation, participants performed better with strong evidence when excerpts differed in both dimensions compared with just the duration dimension (Table 4).
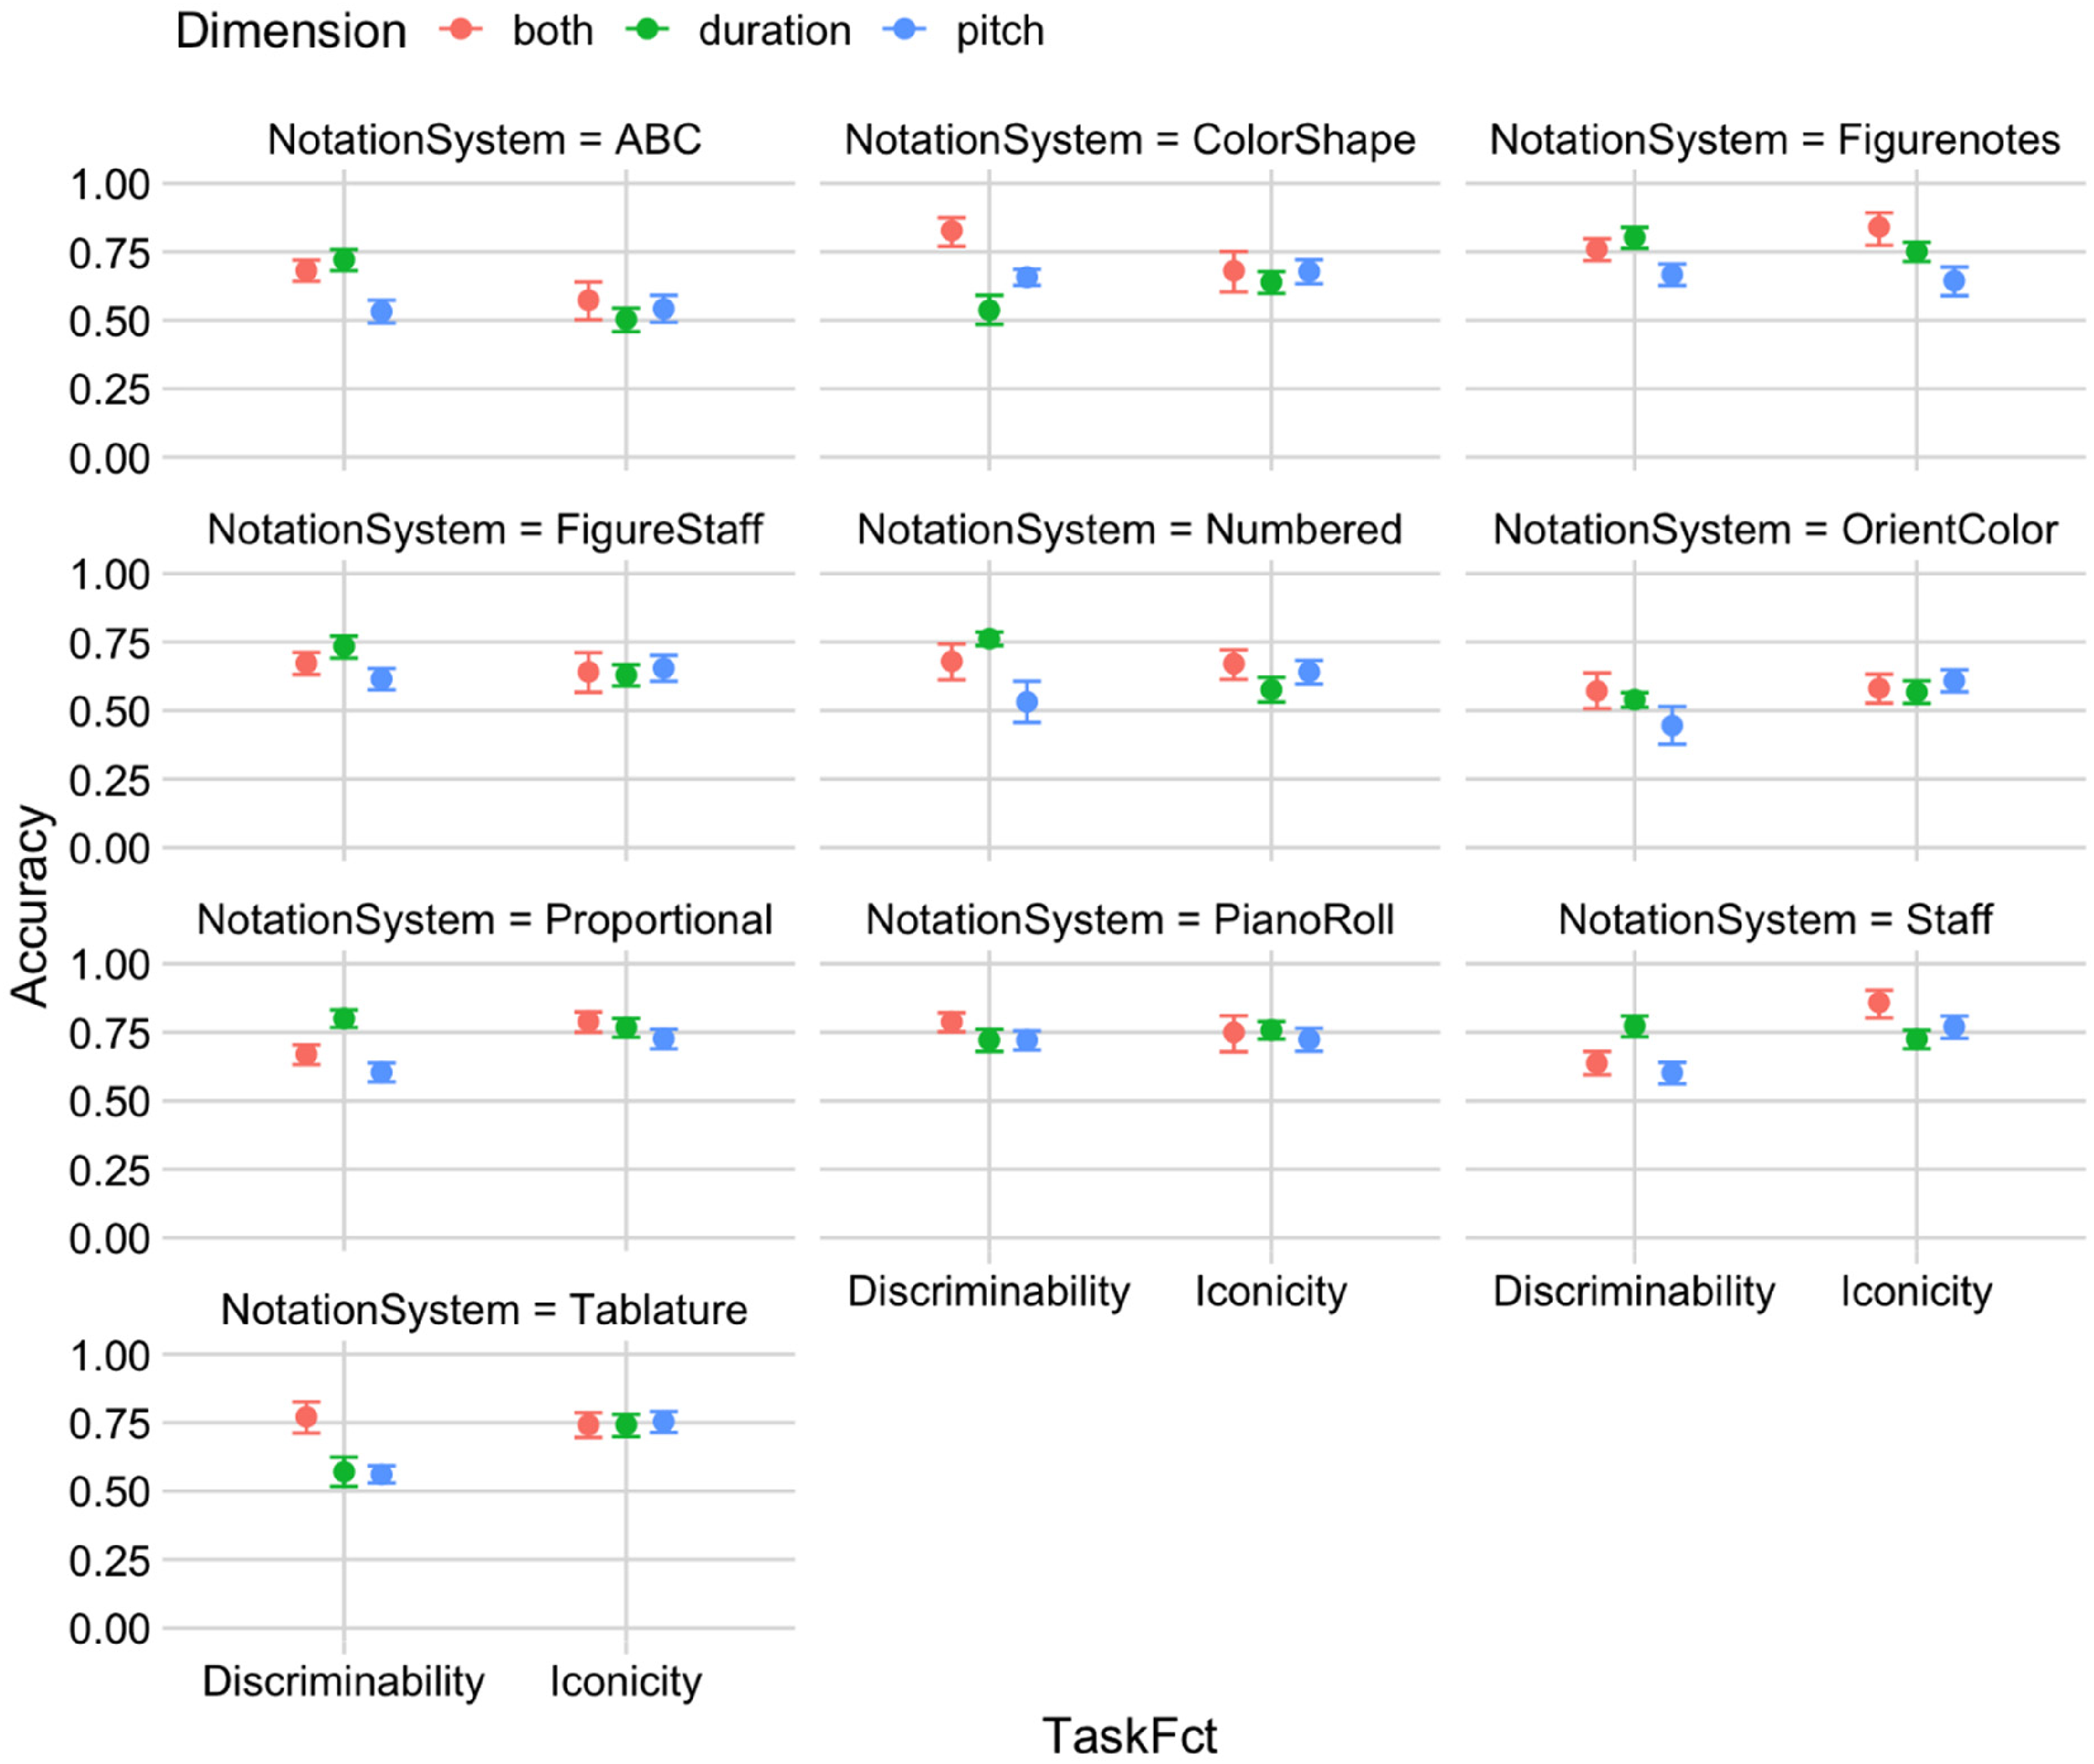
The effect of dimension on 10 notational systems in two tasks.
Hypothesis test of the effect of dimension on different notational systems.
CI: 90%-CI for one-sided and 95%-CI for two-sided hypotheses.
: For one-sided hypotheses, the posterior probability exceeds 95%.
Posterior probabilities of point hypotheses assume equal prior probabilities.
Visual Variables
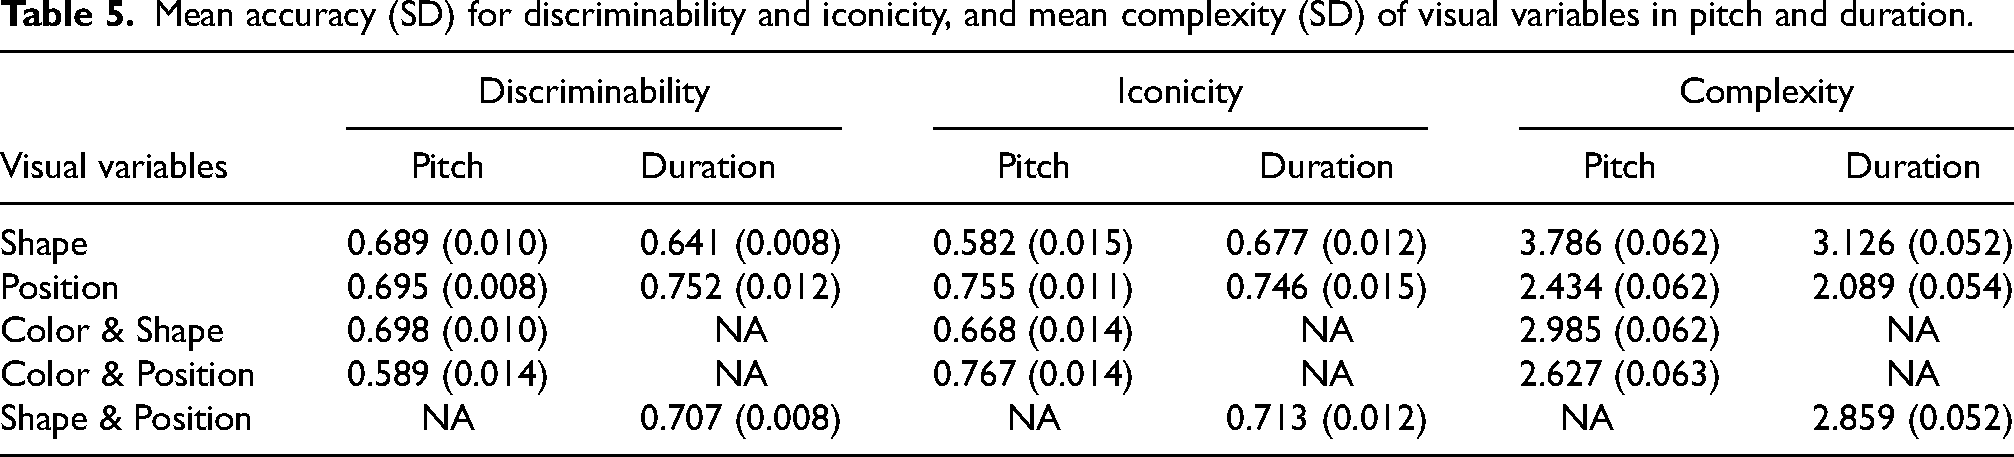
To find more fundamental aspects of the way notational systems affect responses, as well as linking back to Bertin's theory (1983) about visual variables, we analyzed how different visual variables affect participants’ comprehensibility of pitch and duration. We separated pitch and duration dimensions into two models and coded six factors: Pitch_Color, Pitch_Shape, Pitch_Position, Duration_Color, Duration_Shape, and Duration_Position, which are all binary indicators of whether that visual variable is used. The results of task accuracy and complexity ratings for each Visual variable in each task are presented in Table 5. When comparing the Visual variables that represent pitch, notational systems that use Color and Shape, or Position, or Shape have the best discriminability whereas Color and Position, or Position have the best iconicity (Accuracy ∼ TaskFct * Pitch_Color * Pitch_Shape * Pitch_Position + (TaskFct | participant)). Visual variable Position has the least complexity ratings in the pitch dimension. In the duration dimension, visual variable Position is the most discriminate, the most iconic, and the least complex visual variable (Accuracy ∼ TaskFct * Duration_Shape * Duration_Position + (TaskFct | participant)). In sum, visual variable Position was one of the most effective visual variables in the pitch dimension, and the most effective in the duration dimension. It was also the least complex visual variable in both dimensions.
Mean accuracy (SD) for discriminability and iconicity, and mean complexity (SD) of visual variables in pitch and duration.
Familiarity
Familiarity is important in perception and cognition. It is demonstrated that Familiarity is not associated with the overall performance of task accuracy (Accuracy ∼ TaskFct * NotationSystem_sum * Familiarity + (TaskFct | participant)) (Figure 11, Table 6).

The main effect of familiarity on two tasks.
Hypothesis test of the main effect of familiarity on two tasks.

CI: 90%-CI for one-sided and 95%-CI for two-sided hypotheses.
*: For one-sided hypotheses, the posterior probability exceeds 95%.
Posterior probabilities of point hypotheses assume equal prior probabilities.
Figure 12 shows the effects of Familiarity in each NotationSystem (Accuracy ∼ TaskFct * NotationSystem * Familiarity + (TaskFct | participant)). There is strong evidence that Familiarity was positively associated with discriminability in Staff notation, as well as positively associated with iconicity in Staff notation, Proportional notation, and Piano Roll notation (see Table 7 for hypothesis tests).

The effect of familiarity (0 = unfamiliar, 1 = familiar) on discriminability and iconicity in the different notational systems (since no one was familiar with the two musical notations that we created and FigureStaff notation, the values had large CIs).
Hypothesis test of the effect of familiarity on different notational systems.

CI: 90%-CI for one-sided and 95%-CI for two-sided hypotheses.
: For one-sided hypotheses, the posterior probability exceeds 95%; for two-sided hypotheses, the value tested against lies outside the 95%-CI.
Posterior probabilities of point hypotheses assume equal prior probabilities.
To further control for any impact of familiarity, an analysis was conducted solely on data with a familiarity score of zero. This subset analysis revealed that the overall trend remained consistent with the results from the entire dataset (Figure 13). For example, even among participants who were not familiar with the notation systems, Staff notation, Proportional notation, and Piano Roll notation exhibited the highest levels of iconicity accuracy.

Mean accuracy with 95% credibility intervals in two tasks with 10 notational systems (familiarity = 0).
We also compared complexity ratings between participants who were familiar and unfamiliar with each notational system (Complexity ∼ 1 + NotationSystem * Familiarity + (1 | participant), Figure 14). In general, participants who were familiar with one notational system rated it less complex than participants who were not familiar with it. Numbered notation and Staff notation had the strongest impacts by Familiarity. Piano Roll notation was rated the least complex system by both familiar and unfamiliar participants.

The complexity ratings of the 10 notational systems in unfamiliar (0) and familiar (1) conditions (the missing points are for when there were no observations, e.g., nobody was familiar with FigureStaff).
Musical Sophistication and Age
Since familiarity affects task performance and complexity ratings in some notational systems, it was controlled for when analyzing the effects of musical sophistication (GMSI scores) and age. Musical sophistication is positively associated with the iconicity accuracy with very strong evidence but did not show association with discriminability. This finding is reasonable because the discriminability task only focused on the visual aspect of musical notation instead of the auditory property. On the contrary, age showed negative association with the discriminability accuracy but did not associate with iconicity (see Figure 15 and Table 8 for hypothesis test).

Hypothesis test of the main effect of GMSI and age on two tasks.
Hypothesis test of the main effect of GMSI and age on two tasks.

Task Strategies
Participants were asked after each task whether they developed any strategy to complete the task, and we collected 127 answers for the discriminability task. The responses showed that participants either tried to scan both notation excerpts or chose one or a few parts to observe within the short timeframe. To scan both excerpts, some participants would “sit back further to get a better overall view,” and some people mentioned they “looked at the middle of the two excerpts to use peripheral version to observe.” However, the participants who only chose one or a few parts to look at usually chose the beginning or the last part of the notation excerpt.
One hundred participants explained their strategies for completing the iconicity task, and there were two main strategies applied. One was to focus on the melody when the music was playing and then try to audit it while comparing the two notation excerpts. The other strategy was to choose one excerpt to focus on when the music was playing, and then compare it with the other excerpt. Interestingly, there were lots of comments relating to the pitch and duration dimensions. It seems that participants either focused on the pitch (rise/fall, up/down, contour) or duration (note length) to match with the melody, rather than both dimensions at the same time. Surprisingly, many participants could figure out the meaning of notation symbols after they finished the iconicity task: “I sort of worked out the other two as I went. The letter one [ABC notation] used numbers to determine length next to the notes. The colors of the wheels [OrientColor] determined length as well, lighter being shorter”; “after a few attempts I began to think that the same color indicated the same note and the different shape indicated the value of the note [Figurenotes].”
Liking
A total of 122 participants answered the final set of questions which asked participants to nominate their favorite and least favorite notational system and to elaborate further on their reasons for these choices. The numbers of statements for likes and dislikes are summarized in Table 9. Piano Roll notation was the most popular system among both familiar and unfamiliar participants. It was described as “easier to understand,” “extremely intuitive,” “made the most sense when trying to interpret the musical tones,” “logical,” and “straightforward.” In the liking-related comments of Staff notation, 44 out of 49 participants mentioned that they liked Staff notation because they were familiar with it, although it was “more complex” and “visually more cluttered” than some other notational systems presented in the experiment. As for the other notational systems, people had different opinions about them. For example, some participants said Numbered notation was “interesting,” “generating music notes the best,” and “easy to pick up and read clearly”; while other participants thought it was “confusing,” “hard to understand,” and “difficult to follow.”
The number of statements of likes and dislikes for different musical notational systems.

Discussion
In this study, we examined the impact of pitch and duration symbols in 10 different musical notation systems on discriminability, iconicity, and complexity. Accuracy and reaction times on the two tasks, as well as the complexity ratings were the dependent variables. The visual discriminability task required participants to decide whether the two given excerpts from the same notational system were the same or different; this measured the discriminability of the symbols used in that musical notation. The melody and notation matching task required participants to choose which of two notation excerpts matched an audio presentation of a melody; this measured the iconicity of musical notation symbols.
From the results of 213 participants, we can conclude that different musical notation systems vary in discriminability and iconicity. Figurenotes, Numbered notation, and Piano Roll notation facilitate better discrimination than the other notational systems, whereas OrientColor and Piano Tablature are the least discriminable systems. Figurenotes, Piano Roll notation, Proportional notation, Staff notation, and Piano Tablature are the most iconic notation systems, while ABC notation is the least iconic. As to the participants’ complexity ratings collected at the end of the experiment, Piano Roll notation was rated as the least complex musical notational system, and ABC notation was rated as the most complex. There was a negative correlation between task accuracy and complexity: the higher the perceived complexity level of a musical notation system, the lower the task accuracy. Table 10 summarizes the discriminability and iconicity levels in the pitch and duration dimensions, as well as the rated complexity of the 10 notational systems we examined.
The discriminability and iconicity in pitch and duration, and complexity in 10 notational systems (values anticipated before the experiment, from Table 1, are in the brackets).

Figurenotes, Proportional notation, Piano Roll notation, and Staff notation showed the highest comprehensibility. ABC notation was expected to have high iconicity in the duration dimension but was rated as the least iconic. We suspect that this finding occurred because participants perceived the letters and numbers as both presenting pitches, as people tend to organize objects close to each other into a perceptual group and interpret them as a single entity according to gestalt principles of organization (Todorovic, 2008). ColorShape showed a high level of discriminability in pitch, and it might be due to the relatively large size of the symbols. As in Figurenotes and FigureStaff, the only difference of the pitch symbol is the size, and Figurenotes (larger symbols) had a higher discriminability level than FigureStaff (smaller symbols). Previous empirical research suggested that under flicker conditions, changes can be detected faster and more accurately using the visual variable size rather than color value (Garlandini & Fabrikant, 2009). Similar reasoning could be applied to explain why Piano Roll notation has a high discriminability in the pitch dimension because the size of the symbols makes them quite discriminable. The pitch dimension of OrientColor is low in both discriminability and iconicity, possibly because the orientation is hard to discriminate under time pressure, and it requires sufficient musical knowledge to know that there are 12 chromatic pitches in each octave. Surprisingly, Staff notation achieved a high iconicity in the duration dimension, even among unfamiliar participants for whom there is no strong evidence of a difference between the iconicities of Staff and Piano Roll (the system with the highest estimated mean iconicity; evidence ratio is 14.81), which indicates some iconic components of duration symbols. Piano Tablature has a low discriminability in duration, possibly because colors on the stave lines and note heads cause a distraction, and high iconicity in duration because the representation is the same with that in Staff notation.
Since the visual variables generalize beyond specific musical notation systems, and they help to explain the underlying reasons for why the tested notational systems perform as they do, we also analyzed how they influenced discriminability, iconicity, and complexity. The results suggested that the visual variable Position is one of the most discriminable, the most iconic, and the least complex visual variable in both pitch and duration dimensions. We proposed in the Introduction that the selective characteristic might relate to discriminability, while ordered and quantitative characteristics might relate to iconicity. Position is selective, ordered, and quantitative, which could account for why Position is the most discriminable and iconic visual variable. Piano Roll notation is the only musical notation system that only uses Position to represent both pitch and duration, which may explain why Piano Roll was among the most discriminable and iconic. The thematic analysis indicates that Piano Roll notation is the most popular system, regardless of participants’ familiarity with it. The preference for Piano Roll mirrors its good discriminability and iconicity task performance. Further research could provide a more systematic evaluation to assess the characteristics of different visual variables to represent more musical information and more complex musical excerpts. This analysis could help us understand which visual variables communicate comprehensively when representing different musical features, which may also guide us in future music education activities.
Given that we collected responses from a cohort with a broad range of familiarity, musical sophistication, and age, we also analyzed the effects of these three predictors. Familiar symbols objects are easier to recognize than less familiar symbols (Appelman & Mayzner, 1981). Staff notation might be familiar to most people since it is taught in schools across many countries (García & Dogani, 2011; Pascoe et al., 2005; Quesada & Volk, 1997; Reimer, 1989). Our results showed very strong evidence that participants who were familiar with Staff notation performed better in both discriminability and iconicity tasks than participants who were not familiar with them. In other musical notation systems, we only found strong evidence that Familiarity was associated with better performance in the iconicity task in Proportional notation and Piano Roll notation, which may be due to the insufficient sample size of familiar participants in the other notational systems. Furthermore, familiarity with a musical notation system also diminished perceived complexity and increased liking, as shown in the results of complexity ratings and the qualitative analysis. Previous studies have supported that familiarity or “mere exposure” increases preference and hedonic responses in the brain (Bornstein, 1989; Pereira et al., 2011; Zajonc, 1968), which is consistent with our results. For the current study, the depth of the analysis of the effect of familiarity is limited due to the dichotomous responses collected.
Results demonstrated a very strongly evidenced positive association between musical sophistication (GMSI) and the iconicity task performance, and there was very strong evidence that Age had a negative association with the discriminability task. In other words, musically sophisticated participants performed better when matching notation excerpts with melodies than musically unsophisticated participants, and older participants were less accurate in discriminating notation excerpts than younger adults. Owing to convenience sampling of participants by age and GMSI, and the likely presence of causal relationships between them, we do not focus on their analysis in the main text, although we report results of models with these two predictors across each notational system in the Supplementary materials.
In sum, the results suggest some advantages of Piano Roll notation for novices: it is easy to follow, and participants find it intuitive to comprehend. However, this finding may be because the current study only included short monophonic notation excerpts and only focused on the pitch and duration dimensions; outside these constraints, it is possible that other notational systems will perform comparatively better (e.g., a space efficient notational system such as Staff notation). Further research with more musical features and longer or more complex notation excerpts is needed to comprehensively understand the strengths and limitations of different musical notation systems. We also found that the visual variable Position was the best facilitator of discriminability and iconicity, and the least complex visual variable. This finding suggests that humans are adept at mapping pitch and duration to space (e.g., SMARC effect, Rusconi et al., 2006). This study provides insights into how discriminability, iconicity, and complexity differ between the notational systems and to what extent these differences can be explained by the visual variables used in those notational systems, which may be beneficial for designing new music educational tools.
Supplemental Material
sj-docx-1-mns-10.1177_20592043241292952 - Supplemental material for Exploring the Comprehensibility of Ten Different Musical Notation Systems and Underlying Factors
Supplemental material, sj-docx-1-mns-10.1177_20592043241292952 for Exploring the Comprehensibility of Ten Different Musical Notation Systems and Underlying Factors by Siyao Cheng, Andrew J. Milne, Roger T. Dean, José Hanham and Jennifer MacRitchie in Music & Science
Footnotes
Acknowledgments
We would like to thank Dr. Peter Harrison for sharing with us all the MIDI files of the Melodic Discrimination Test.
Action Editor
Isabel Martinez, Universidad Nacional de La Plata, Facultad de Bellas Artes
Peer Review
Alan Blackwell, University of Cambridge, Computer Laboratory
One anonymous reviewer
Contributorship
Siyao Cheng: experiment design, data collection, data analysis and interpretation, paper writing and revision. Andrew J. Milne: experiment design, data interpretation, and paper revision. Roger T. Dean: experiment design, data interpretation, and paper revision. Jennifer MacRitchie: experiment design, data interpretation, and paper revision. José Hanham: paper revision.
Declaration of Conflicting Interests
The authors declared no potential conflicts of interest with respect to the research, authorship, and/or publication of this article.
Ethical Approval
The study was approved by the ethics committee of Western Sydney University (REC number: H14499).
Funding
The authors received no financial support for the research, authorship, and/or publication of this article.
Data Availability Statement
Data collected for this research project is available upon reasonable request. The corresponding author reserves the right to deny access to the data under certain conditions. Data sharing may be considered for legitimate research inquiries or further project development.
Supplemental Material
Supplemental material for this article is available online.
References
Supplementary Material
Please find the following supplemental material available below.
For Open Access articles published under a Creative Commons License, all supplemental material carries the same license as the article it is associated with.
For non-Open Access articles published, all supplemental material carries a non-exclusive license, and permission requests for re-use of supplemental material or any part of supplemental material shall be sent directly to the copyright owner as specified in the copyright notice associated with the article.