
Abstract
People across cultures often use music to evoke positive emotions and moods. Yet, some people tend to employ maladaptive strategies such as rumination, avoidant coping, or social isolation when they listen to music. The present research investigated how strongly maladaptive musical engagement is linked with depression and trait affect in a sample of 1415 Indians (17–65 years) across four cities and two countries. Participants completed a battery of assessments on trait affect, depression, adaptive and maladaptive musical engagement strategies, music preferences, and music skills. 1329 participants were included for analysis. All nine symptoms (r = .16, to .30) and the sum score of depression (r = .39), as well as trait negative affect (r = .36) were correlated with maladaptive music engagement. Six of the symptoms of depression were significant predictors of maladaptive music engagement. Among those, suicidal ideation, worthlessness, and fatigue were the most important. Maladaptive music engagement increased the odds of experiencing all the depression symptoms (OR = 1.04 to 1.14). Trait positive affect (r = .29) and having music as a hobby (r = .22) correlated with adaptive music engagement. Musicians who had been playing an instrument for six years and above had lower levels of maladaptive music engagement (d = .84). Furthermore, the results show that depression symptoms might have a bidirectional relationship with maladaptive music engagement, with suicidal thoughts being the most important symptom. The current study also validated the Healthy-Unhealthy Music Scale (HUMS; Saarikallio et al., 2015) in India and provides a cut-off score based on the sensitivity (.86) and specificity (.66) in identifying people at risk for depression. Overall, the results reveal that socio-demographic factors (age, gender, relationship status, occupation status, geographical location), psychological factors (trait affect, depressive symptoms), and music skills play an important role in engaging with music.
Introduction
People use music to regulate their mood, emotions, and to cope with the issues of everyday life (Juslin & Laukka, 2004; Lonsdale & North, 2011; Sloboda, 2010; Tarrant et al., 2000; van Goethem & Sloboda, 2011). Affect regulation typically is the most important reason for listening to music when people are directly asked (Saarikallio, 2011; Saarikallio & Erkkilä, 2007; Schäfer et al., 2013). Similarly, listening to music for affect regulation purposes was consistently found being the primary reason for listening to music across cultures (Boer & Fischer, 2012; Juslin et al., 2016; Rana & North, 2007; Schäfer et al., 2012). The term affect is used as an umbrella term in the current study to denote emotions, moods, and sometimes feelings of stress in a musical context (Juslin & Sloboda, 2010). The process of affect regulation can be conscious or unconscious but is always directed at achieving specific goals (Mauss & Tamir, 2014). Affect regulation is achieved by using music to change, maintain, or enhance positive and negative affective states (Baltazar & Saarikallio, 2016).
Music engagement and affect regulation
Theories such as mood management theory (Zillmann, 1988b) or the uses-and-gratifications approach (e.g., Arnett, 1995) state that music is used to give positive and hedonic outcomes. Listening to music for affect regulation can be a considered a form of self-therapy when people pass through troubles or encounter problematic events in their lives and music help them address their mental health issues (Skånland, 2012). However, research into music use and health outcomes has shown that people also sometimes engage with music in ways that can be maladaptive (Carlson et al., 2015; Garrido & Schubert, 2013a; Thomson et al., 2014) and result in harmful consequences (McFerran & Saarikallio, 2014; Miranda et al., 2012) or are associated with mental illness such as depression, as recently found in western adolescents and adults (Garrido et al., 2017; Garrido & Schubert, 2013a; Leipold & Loepthien, 2015; Miranda & Claes, 2009; Saarikallio et al., 2015).
Maladaptive strategies are those that are not apt to the situation or context, resulting in reinforcement or a maladaptive increase in the negative mood state with an ultimate decline in overall wellbeing (Aldao et al., 2010). In musical contexts, maladaptive use refers to employing music-specific regulation strategies that involve ruminating, avoidant coping, or perpetuating social isolation (McFerran & Saarikallio, 2014; Miranda et al., 2012; Miranda & Claes, 2009; Saarikallio, 2011; Saarikallio & Erkkilä, 2007). In contrast, adaptive strategies such as reappraisal, problem solving, and distraction in music engagement (see Gustavson et al., 2021, for a detailed review on music engagement and mental health) are positively related to wellbeing and negatively associated with depression and anxiety (Chin & Rickard, 2014; Miranda & Claes, 2009; Van den Tol & Edwards, 2015).
Individual differences exist in the affect regulation strategies people deploy. The regulation strategies are driven by ones goals and subsequently leading to different behavioural and mental health outcomes (Berking et al., 2019; Coulacoglou & Saklofske, 2017; Kobylińska & Kusev, 2019). This is consistent with prior evidence that people engage with music to reach specific goals that serve their needs (Randall et al., 2014; Schäfer, 2016; Sloboda et al., 2001; van Goethem & Sloboda, 2011).
Specific affect regulation strategies through musical engagement might reflect potential underlying emotion regulation disturbances (Garrido & Schubert, 2011, 2013a; Leipold & Loepthien, 2015; Thomson et al., 2014). Emotion regulation problems are also commonly observed in mood disorders such as depression and anxiety, and these mental health disorders play a crucial role in the decline of an individual's psychological wellbeing (Campbell-Sills & Barlow, 2007).
Emotion regulation abilities are crucial for a stable and healthy psychological life (Gross, 1998). These abilities are shown to be impaired in depressed individuals who are more prone to employ maladaptive strategies such as suppression and rumination over adaptive strategies such as reappraisal and acceptance (Aldao et al., 2010; Garnefski et al., 2004; Joormann & Stanton, 2016). The evidence indicates that employing maladaptive strategies such as suppression and rumination for affect regulation in general (Aldao et al., 2010; John & Gross, 2004) or specifically through musical engagement (Saarikallio et al., 2015) is associated with depression.
Music and depression
Could listening to music that makes people sad or the engagement in maladaptive listening strategies result in, or at least be a mirror of, clinical symptoms of depression? Depression is a mental disorder that affects the regulation of mood and emotion, i.e., affect (Davidson et al., 2002). According to the World Health Organization; (2020) International classification of diseases for mortality and morbidity statistics (11th revision.; ICD-11), depression is part of mood disorders (Reed et al., 2019).
The symptoms of depression are composed of three clusters. The affective cluster (AC) is marked by emotional and mood related symptoms that include feelings of worthlessness, excessive or inappropriate guilt, and recurrent thoughts of death or suicide. It also includes primary symptoms, such as depressive mood and diminished interest in activities or loss of pleasure. The somatic cluster (SC) is marked by somatic symptoms such as reduced energy or fatigue and changes in appetite or sleep. The cognitive cluster (CC) comprises cognitive symptoms such as difficulty in concentrating or indecisiveness, hopelessness, psychomotor agitation or retardation (Gaebel et al., 2017; Malhi & Mann, 2018; Reed et al., 2019; Stein et al., 2020).
To identify depression in individuals, five out of nine symptoms must be present, including the compulsory presence of one or two primary symptoms, present over two weeks (11th ed.; ICD-11). The prevalence of symptoms of depression varies between cultures. In Indians, somatic symptoms such as feeling tired, fatigue, physical pain, and anhedonia are the most commonly reported symptoms of depression (Grover et al., 2013; Poongothai et al., 2009).
In experimental studies in music and RCT trials where music therapy is used as an intervention to treat depression, sum scores of depression scales are used to compare scores of pre and post-intervention as a yardstick to evaluate the efficacy of music therapy and also to assess the outcome from experiments (Aalbers et al., 2017; Tang et al., 2020). The decrease in sum score after an intervention is measured to judge whether the treatment or the experiment was successful or not. In addition, severity of depression is assessed according to threshold values created from the sum score in music research (Leubner & Hinterberger, 2017). Similar practices are observed in non-experimental music psychology research, where the correlation between depression sum score, variables of wellbeing and mental health, and specific musical variables is assessed. The current study will depart from the established practice of using sum scores of depression scales. Instead, we will examine the individual depressive symptoms’ relationship with music variables. Using only sum scores of depression is not thoroughly supported by evidence due to methodological and theoretical problems in understanding depression. The reasons are discussed in the following sections.
Longitudinal studies that used different scales such as BDI, MADRS, QUIDS-C, HRSD, IDS-SR found a decrease of sum scores and an increase in reliability, simultaneously sum score variance at the exit time point of the study is observed. However, there is a violation of strict temporal and scalar measurement invariance, and a decrease in dimensionality was also observed (Fokkema et al., 2013; Quilty et al., 2013). The dimensionality (reliability) of the depression scales changes according to the depression severity of the samples used in the studies (Fried et al., 2016).
The gold standard tools such as HRSD that are used in RCT trials and as outcome measures for therapeutic interventions to measure the efficacy of anti-depressants reveal low retest and poor inter-rater reliability, weak content validity, and specific items in the scale show poor performance in psychometric properties (Bagby et al., 2004; Gullion & Rush, 1998). Violation of temporal measurement invariance is observed in widely used scales of depression. Depression scales are not limited to lacking in unidimensionality, but they also have low reliability (i.e., all the items in the test measure the same construct) while maintaining good face validity (i.e., all the items in the test measure what it is supposed to measure) (Fried, 2020).
The studies conducted to date, which include systematic reviews examined using latent class analyses and factor analysis, did not reveal any definitive evidence for the number of symptom subtypes and the nature of depression subtypes (Baumeister et al., 2011; Harald & Gordon, 2012; Lichtenberg & Belmaker, 2010; van Loo et al., 2012). The findings from depression subtypes reveal that treatment strategies for each subtype should be different (Calati et al., 2013).
Apart from depressive or sad mood in symptom criteria for depression in ICD-11, remaining are compound symptoms such as worthlessness or guilt, fatigue or reduced energy (WHO, 2020) that could lead us to qualify for depression criteria in different ways. A recent study examining unique symptom patterns in 3703 patients diagnosed with depression identified 1030 distinctive ways to qualify for major depressive disorder (Fried & Nesse, 2015). The common symptom profile was found in less than 2 percent of participants (Fried & Nesse, 2015).
However, the evidence suggests that people who do not meet 5 out of 9 symptom criteria in the last two weeks might suffer from subthreshold depression. Impairment and mortality evidenced in subthreshold or subclinical major depression cases are eligible for clinical diagnosis (Cuijpers & Smit, 2002; Wakefield & Schmitz, 2017; Wanders et al., 2016).
The sum score of a depression scale obscures the information on the symptom level (Fried & Nesse, 2015). Hence, there is a need for analyses on the symptom level to gain more clarity on the strength of the association between depressive symptoms and music engagement.
Trait affect and music engagement
Positive trait affect is defined as the predisposition to experience positive affect or feelings such as enthusiasm, joy, or contentment (Gray & Watson 2001). Negative trait affect is defined as the predisposition to experience negative feelings or affect such as worry, nervousness, sadness, anger, or distress (Watson & Clark, 1984). Positive and negative affect is employed as indicators of mental health outcomes and overall wellbeing. Depression, for instance, is characterised by recurrent, persistent, or excessive negative affect (Rottenberg & Bylsma, 2014). People with depression may have a higher threshold for activation of positive affect for less duration and intensity. They may also have a lower threshold for activation of negative affect that can sustain longer durations in a more intense manner (Joormann & Gotlib, 2010). Individuals with low positive affect and higher negative affect have a higher risk of experiencing depression (Stanton & Watson, 2014).
Trait negative affect is strongly connected to neuroticism trait in personality (Stanton & Watson, 2014). The presence of neuroticism is noted across different mental disorders from the internalising to externalising spectrum (Kotov et al., 2010). However, higher levels of negative affect are observed more robustly in mood disorders such as depression and anxiety, as both disorders share similar comorbid symptoms. Longitudinal studies had consistently found that lower levels of positive affect are only associated with depressive symptoms and depression than with anxiety (Dejonckheere et al., 2018; Watson & Walker, 1996). Higher levels of negative affect are connected to depression because the core symptom, such as the feeling of sadness for a prolonged period or depressed mood, is regarded as a manifestation of negative affect (Watson & Clark, 1984). The secondary core symptom anhedonia (reduced interest in activities or loss of pleasure) is considered as a lack of positive affect (Watson , Clark, & Carey, 1988a). In other words, the two core symptoms, anhedonia and depressed mood, show association with diminished positive affect and elevated negative affect.
Previous studies have occasionally examined the role of mood states and emotions in musical engagement, but not the role of trait affect. For example, Chin and Rickard (2014) showed that employing adaptive affect regulation strategies while listening to music helps predict positive mental health outcomes even after controlling for negative and positive trait affect. In a sense, outcomes of music listening are determined by the affect regulation strategies rather than the predisposition of trait affect. However, measuring trait affect is advantageous because it is a time-stable construct not susceptible to situational or contextual changes, and it is easier to record through self-report methods (Watson & Tellegen, 2002). Trait affect mainly represents the stable predisposition to affective states, either positive or negative, and might determine an individual's music engagement style (adaptive or maladaptive). We hypothesise that higher levels of trait positive affect may associate with adaptive music engagement and higher levels of negative trait affect and lower levels of positive affect might be linked to maladaptive musical engagement.
Music skills and affect
Active participation in musical activities or acquiring musical skills such as learning a musical instrument through receiving formal music lessons has a significant role in affect regulation and is associated with wellbeing (Hallam, Creech, et al., 2012a; Saarikallio, 2011). The amount of practice engaged in musical activities is used as criteria to identify someone as a musician. Musical expertise criteria is used to categorise musicians and non-musicians. Musical expertise is measured through the number of years a person received formal training in music (Rickard & Chin, 2017). The duration of practice engaged in musical activities is a predictor of the level of expertise attained and indicative of performance (Hambrick et al., 2014). In a sense, expertise in musical skills relies on acquiring skills and also to develop expertise requires considerable time and effort. In addition, the individual needs to be highly motivated to learn or play a musical instrument (Hallam, Rinta, et al., 2012b).
The length of practice is connected monotonically to the level of expertise attained in music (Ericsson et al., 1993; Sloboda et al., 1996). The practice accumulated over a lifetime is predictive of the level of music expertise (Ericsson et al., 1993; Jørgensen, 2001; Sloboda et al., 1996), supported by evidence that musicians with a high level of expertise have accumulated considerably more time in practice than their less successful peers (Jørgensen, 2002; Sloboda et al., 1996). Contrary to the findings discussed above, Hallam (1998) found a strong relationship between the number of years spent learning music skills and musical achievement. However, they found weaker evidence between achievement and amount of practice. Recent evidence also confirms that the duration of learning or acquiring music skills is a strong predictor of musical expertise compared to the time spent practising music skills (Hallam, Rinta, et al., 2012b).
A recent review by Zhang et al. (2018) suggested a cut-off value to define a musician as someone with at least six years of experience in learning and acquiring music skills through formal training. Musicians’ affective responses to music are different from those of non-musicians, as indicated in behavioural and experimental settings (Getz, Marks, et al., 2012b; Mikutta et al., 2014; Park et al., 2014). However, the role of music-based affect regulation strategies between non-musicians and musicians have not been investigated in Non-Western population.
Music genres and music engagement
Music listening cannot be assumed as unrestrictedly to be beneficial in promoting wellbeing. For example, some individuals prefer to listen to music that makes them feel sad (van Goethem & Sloboda, 2011), and the preference for sad music is stronger in listeners who score high in rumination (Chen et al., 2007; Garrido & Schubert, 2015).
Research has shown that adolescents with mental health problems were more likely to listen to specific genres that would intensify their negative moods and enhance their rumination, suggesting that music preferences have an important association with the overall health of the individual (Baker & Bor, 2008; Miranda & Claes, 2008). However, few studies in Non-Western contexts have examined this issue (Getz, Chamorro-Premuzic, et al., 2012a). A recent study by Chakraborty et al. (2017) examined the association between music preferences (genres) and values in India. However, they did not examine the role of music-based affect regulation strategies or coping methods in music preferences. The current study is an initial attempt to examine the association between music preferences and adaptive or maladaptive music engagement.
Rationale of the present study
Saarikallio et al. (2015) examined the association between music engagement and depression and found that unhealthy music use (maladaptive music engagement) is associated with depression while healthy music use (adaptive music engagement) is associated with mental wellbeing. They developed a self-report scale (Healthy-Unhealthy music scale; HUMS) and validated the scale on adolescents and young students from Finland and Australia to measure healthy (HM) and unhealthy music (UHM) use.
Further, the scale was widely used in several studies using ESM, longitudinal, online survey methods, and RCT trials as an intervention or outcome tool. These studies recruited diverse samples from the cohorts in clinical settings such as primary care centres, acute care mental health centres on the patients diagnosed with affective, bipolar, anxiety, psychotic, addiction disorders, personality disorders and in hospitals with cancer patients and in online survey samples of general (non-clinical) participants. The age (13–74 years) of the participants in the samples varied and they were from different countries such as Australia, United Kingdom, USA, Finland, Germany, India, and representing from Asia, Africa Europe (Agarwal et al. (2019); Garrido et al., 2017; Gold et al., 2017; Haeyen & Noorthoorn, 2021; Hense et al., 2018; Hides et al., 2019; McFerran et al., 2018; Silverman, 2020a, 2020b, 2021).
The exploratory factor analyses in the original study (Saarikallio et al., 2015) and the Indian study (Agarwal et al., 2019) resulted in two factors. The first factor, Healthy music use (HM-adaptive music engagement), is associated with positive mood changes after listening to self-selected music when they are sad, positive group listening, and a wide repertoire of adaptive coping strategies such as active coping, emotional support, instrumental support and positive reframing, humour, acceptance, planning, reflection, happiness. The second factor, unhealthy music use (UHM-maladaptive music engagement) is positively associated with depression, stress, anxiety, rumination and inversely associated with wellbeing, happiness, maladaptive coping strategies denial, behavioural disengagement, humour, self-blame, venting, self-distracting, instrumental support.
The HUMS scale is developed as a screening tool to identify individuals prone to the risk of experiencing depression. The HUMS scale was used in music therapy sessions as an intervention tool in the RCT trials, but these studies did not provide the scale's classification prediction or accuracy. One study by Agarwal et al. (2019) reported the classification accuracy for the HUMS scale to identify people at risk of experiencing depression. They identified that the HUMS scale has 82% accuracy in identifying moderate to high-risk depressed people. However, they did not report the specificity and sensitivity of the HUMS scale.
ROC analysis is used to evaluate and measure classification and prediction models’ performance to separate the two mutually exclusive categories (i.e., normal vs depressed participants) (Tourassi, 2018). Classification accuracy can be indicated by the specificity and sensitivity of the test. The sensitivity indicates the test's capacity to detect cases that have the condition present. Specificity indicates the test's capability to detect cases without the condition (Kumar & Indrayan, 2011).
ROC curve plots depict the relationship between specificity and sensitivity for the full range of thresholds in a graphical way, where a decision should be taken based on the graph. Coordinates of the ROC curve display the trade-off between specificity and sensitivity. In addition, it helps in obtaining the optimal cut-off score to properly detect the misclassification of participants with and without condition as well as discriminating ability to identify the presence and absence of condition (Hajian-Tilaki, 2013). In the current study, we tried to address the limitations of the earlier study by providing the specificity, sensitivity, and ROC curve of the HUMS scale.
We also set out to address some limitations in the Saarikallio et al. (2015) study. First, adults were not studied. Second, depression was measured using a distress scale rather than a specific scale developed exclusively to measure depression. Third, the study used a sum score of depression and did not focus on the association between depression symptoms and the HUMS scale. Fourth, they mentioned that HUMS can be used as a screening tool but did not specify the sensitivity and specificity of the unhealthy subscale in predicting depression. The present research extends prior research in this area by overcoming each of these four limitations.
In sum, the results of previous studies suggest associations between music engagement, depression, trait affect, and music preference. However, since previous research has not yet unravelled the relation between single depression symptoms and music engagement, we primarily focus on these simple correlations. At the same time, we aim at analysing the potential predictive value of the HUMS scale for depression symptoms as a non-clinical issue. Not least, we set out to assess the screening accuracy (specificity and sensitivity) of the HUMS scale in detecting depression episode (i.e., according to symptom criteria for ICD-11). Further, we will investigate the role of non-clinical measures such as trait affect, everyday musical behaviour, music preferences, music skills and socio-demographic factors on adaptive and maladaptive music engagement.
Method
Participants
A total of 1415 participants of Indian origin were enrolled in the study. Some participants had to be excluded because of hearing difficulties or incomplete data, resulting in a total N of 1329 participants. Their age ranged from 18 to 65 years (M = 25.09, Mdn = 22, SD = 8.63). The sample statistics are presented in Table 1. Students were the largest group of participants, pursuing their under-graduation (67%), post-graduation (7.5%), PhD (0.3%), or completed Intermediate equivalent to K12 in England (7.2%). A large group (66.1%) of the students were pursuing stem courses (Architecture, Bio and physical, Math Sciences, Computer science/IT, Engineering, Medicine, Management, Pharmacy, Technical diplomas) and the rest are from the fields of commerce (0.3%), law (3%), and social sciences (0.5%).
Participant's demographics and mean, standard deviation, reliability of key measures.

Note. GLB = Greatest lower bound.
Of the participants that are employed, the majority (27.7%) were working in the Software, Banking, or Service sector. A small portion (1.5%) were working in the secondary sector, such as construction and other manufacturing-related services. The rest were distributed in the fields of Teaching (5.5%), Architecture (3.6%), Legal sector (11.1%), Government (7.6%), or were self-employed (5.7%). The other (5.4%) consisted of house makers, or they were unemployed or retired.
In terms of musical experience, 27.6% of the participants had some form of musical experience, either through learning or studying music formally or playing an instrument. In the current study, music skills are assessed based on the number of years spent learning music through formal training. We did not ask questions regarding the amount of practice as an indicator of expertise in music skills. Participants with music skills, learned music formally (n = 312) for an average of 4.6 years (M = 4.6, SD = 4.4, Min = 1, Max = 30) or studied music theory (n = 166) for an average of 3.8 years (M = 3.8, SD = 4.1, Min = 1, Max = 27). Participants (n = 126) played a musical instrument for an average of 4 years (M = 4.1 years, SD = 5.7, Min 1, Max = 50 years). Three binary variables were created according to the cut-off values proposed by (Zhang et al., 2018) to examine the differences between non-musicians or amateur musicians (1–5 years) and musicians with experience of 6 years and above: (1) participants who learned music formally by the non-musicians (n = 217) and musicians (n = 75), (2) studied music theory formally by non-musicians (n = 127) and musicians (n = 27), and (3) played a musical instrument by non-musicians (n = 99) and musicians (n = 22).
Twenty-three different favourite musical styles or music genres were reported by the participants. The most commonly mentioned musical styles were melodious (30.2%, n = 402), all genres/types (12.8%, n = 170), pop (9.7%, n = 129), classical (8.9%, n = 118), and rock (8.3%, n = 110) and the rest of the genres had in between 50 to 20 participants per each genre. The average music listening time per week was 11 h (M = 11.06, SD = 14.84). In addition, 77% (n = 1023) of participants had mentioned music as a hobby for an average of 10 years (M = 10.14 years, SD = 7.88, Min = 0 to Max = 50 years).
Procedure
Data was collected from participants of Indians and Indian origin immigrants using a paper and pencil method. Indian participants lived in three different cities (Hyderabad, Vijayawada, Bangalore) in India and Indian immigrants lived in Warsaw, Poland. In the Poland sample, data was only collected from Indian immigrants. Information about the study was displayed in social media networks and on printed posters in public places and private offices. In person, we visited the places of people who responded to the invitation of the study and gave the questionnaires and collected them back when they finished answering. We received answers from over 27 collection points spread across public and private universities and colleges, government offices, courts, corporate offices, and streets. Participation in the study was voluntary. The informed consent was received from the participants before enrolling in the study. Ethical approval was obtained from SWPS University.
Demographic questions such as age, gender, education, occupation, employment, and marital status were asked in the first part. The second part included questions about music preferences (genres), musical skills, hearing problems, and musical habits.
Measurements
Music engagement was measured using the Healthy Unhealthy Music Scale (HUMS, Saarikallio et al., 2015). It consists of 13 items grouped into two subscales that measure adaptive and maladaptive music use. Five items represent healthy music use (HM), and eight items represent unhealthy music use (UHM). The healthy music subscale represents adaptive music engagement and consists of items reflecting mood enhancement, social connection, and relaxation. The unhealthy music subscale represents maladaptive music engagement and consists of items reflecting rumination, negative thoughts and feelings, isolation, and escapism. All items were rated on a five-point Likert scale, ranging from 1 (never) to 5 (always). The two subscales have good internal consistency: Cronbach's α = .78 for HM and .83 for UHM (Saarikallio et al., 2015).
Depression was measured using the Beck Depression Inventory-II ( Beck, Steer, Ball, et al., 1996; Beck, Steer, & Brown, 1996). The instrument consists of 21 items. Each item has four options ranging from 0 (not experiencing any symptom) to 3 (experiencing the symptom in severe). Since we were concerned with symptoms of major depression, we selected 14 items from the depression inventory that most closely match the nine symptoms used to qualify for major depression criteria in ICD-11. Notably, symptoms that sum up to a total score that is below the clinical threshold can also disrupt the psychological and social functioning of the individual in a significant way and can advance into mood disorders in a full-fledged manner (Lewinsohn et al., 2000). Therefore, in the current study, we analysed the relationship between music engagement and depression on the symptom level, not only on the total score level.
Trait affect was measured using the Positive and Negative Affect Schedule (PANAS, Watson et al., 1988a, 1988b), consisting of the two subscales, positive affect (PA) and negative affect (NA). Items were rated on a five-point scale ranging from 1 (very slightly or not at all) to 5 (extremely). Participants were instructed to answer each item based on what they generally feel.
Results
Psychometric properties of the scales
The mean and standard deviation of the scales used in the study are presented in Table 1. The internal consistency of all the scales is within an acceptable range. Confirmatory factor analysis (CFA) was used to test the two-factor measurement model of the HUMS scale. The results indicated that the two-factor model had a close fit to the data, χ2(64) = 317.162, p < .001, normed chi-square χ2/df = 4.95, CFI = .929, SRMR = .055, RMSEA = .055, SRMR = .055, BIC = 48440.616.
Prevalence of depression symptoms
The prevalence of depression symptoms in Indians and Indian immigrants is reported in Table 7. The first and second most endorsed symptoms in Indians are disturbances in sleep and appetite symptoms from the somatic cluster. However, in Indian immigrants, changes in appetite were the top reported symptom, and the second most reported symptom is depressed mood. Guilty feelings were the third most reported symptom in Indian immigrants, whereas diminished interest in activities was the third most reported symptom in Indians. Concentration difficulty was the fourth most reported symptom in Indians, and fatigue was the fourth most experienced symptom in Indian immigrants. Fatigue is the fifth most experienced symptom in Indians. Finally, in Indian immigrants, the loss of pleasure symptom was the fifth commonly experienced symptom.
Music engagement and depression
Correlations between music engagement and depression symptoms
We calculated the Pearson correlations between the scores of HM and UM, the total depression sum score, and the 14 symptoms of depression to analyse if music engagement is indicative of depression (see Table 2). As expected, all symptoms of depression are positively correlated with UHM, but to a different extent: worthlessness, suicidal thoughts, and fatigue are moderately correlated with UHM. In addition, the total depression score shows a medium sized relation with UHM. With regard to HM, there were no substantial correlations. Thus, the correlation analysis shows that unhealthy engagement (UHM) with music is related to depression symptoms with a varying strength.
HM and UHM relationship with depression symptoms and sum score.
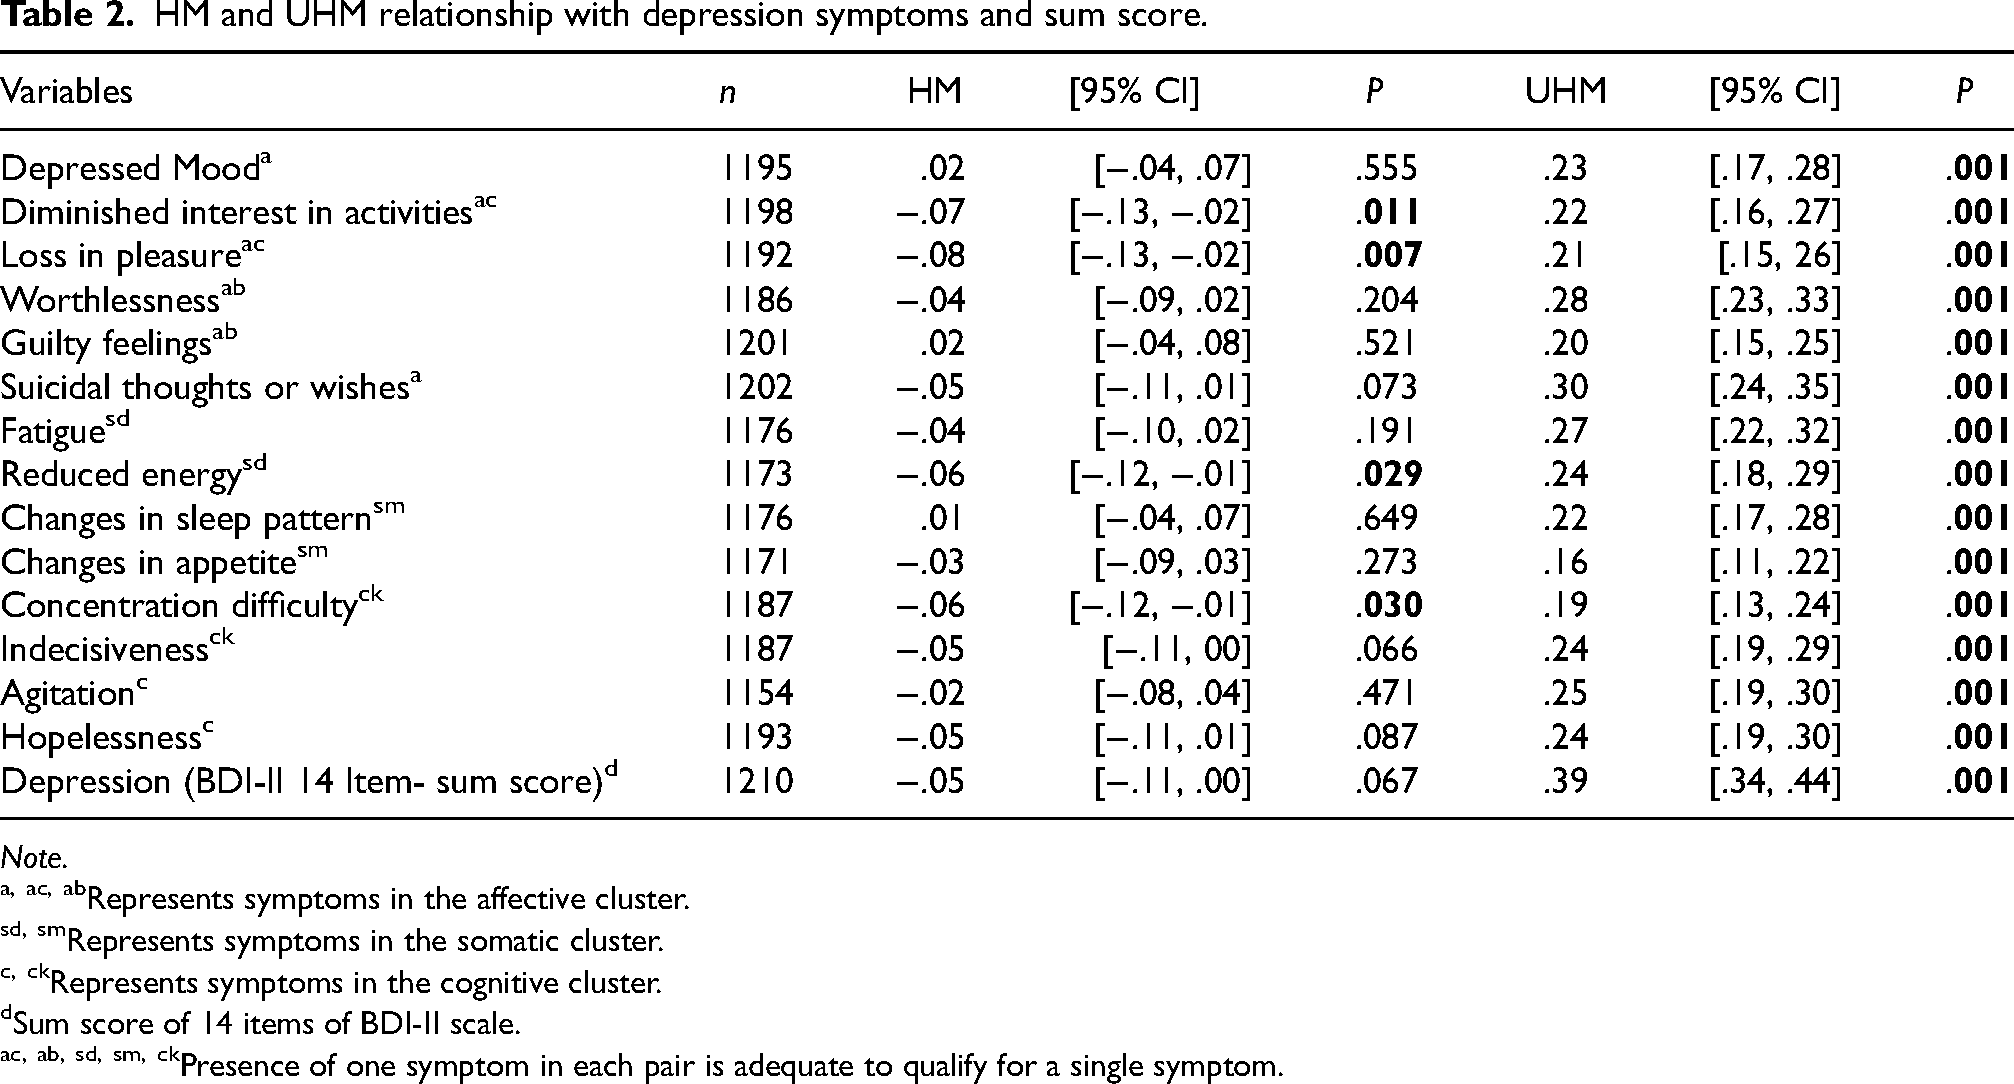
Note.
Represents symptoms in the affective cluster.
Represents symptoms in the somatic cluster.
Represents symptoms in the cognitive cluster.
Sum score of 14 items of BDI-II scale.
Presence of one symptom in each pair is adequate to qualify for a single symptom.
Depressive symptoms as predictors of UHM
Multiple linear regression analysis was used to examine whether depressive symptoms predict UHM. All the variables were entered at a time (enter method). Depression symptoms were selected as independent variables and UHM as the dependent variable. Regression coefficient estimates were derived from 5000 bootstraps. The results reveal (Table 3) three symptoms (depressed mood, worthlessness or guilt, suicidal thoughts) from the affective cluster and two symptoms (fatigue and changes in sleep pattern) from somatic cluster and one symptom (hopelessness) from cognitive cluster were significant predictors of UHM. The overall model was statistically significant, F(14, 1054) = 16.12, p < .001, R2 = 18.
Depression symptoms as predictors of maladaptive music engagement (UHM).

Note. 1069 participants were included in the analysis. The values in bold indicate statistically significant.
Represents symptoms in the affective cluster.
Represents symptoms in the somatic cluster.
Represents symptoms in the cognitive cluster.
Presence of one symptom in each pair is adequate to qualify for a single symptom.
UHM as predictor of depressive symptoms
Logistic regression was conducted while selecting UHM as the predictor (independent variable) and each depressive symptom as a dependent variable. Binary variables of each depressive symptom were created and coded 0 = No (condition absent) & 1 = yes (condition present). Odds ratio (OR) and area under curve (AUC) were selected to assess the probability of predicting the severity of depression symptoms. An OR > 1 implies a positive relationship, while OR < 1 implies a negative relationship. AUC is an important metric that indicates the performance of the classification model. The values range from 0 to 1. Values closer to 1 indicate a better model. The conventions for interpreting AUC are as follows: negligible (below 0.55), small (0.56 to 0.63), moderate (0.64 to 0.70), and strong (>0.70; Rice and Harris, 2005; Salgado, 2018).
The odds ratios (Table 4) of all the depressive symptoms show a positive relationship with UHM. The use of UHM increased the probability of experiencing depressive symptoms in the affective cluster by odds ratios between 1.04 and 1.14. In the somatic cluster, odd ratios ranged from 1.06 to 1.08 and in the cognitive cluster, odd ratios ranged from 1.07 to 1.11. AUC values of the five symptoms indicate that loss of pleasure or diminished interest, worthlessness, fatigue or reduced energy, changes in sleep pattern or appetite, and agitation had small effect sizes. AUC values of four symptoms show that depressed mood, suicidal thoughts, indecisiveness, and hopelessness had a medium effect size. The AUC value of guilty feelings had a strong effect size.
UHM as predictor of depression symptoms.

Note. Nagelkerke R2.
Represents symptoms in the affective cluster.
Represents symptoms in the somatic cluster.
Represents symptoms in the cognitive cluster.
Asymptotic Significance.
Presence of one symptom in each pair is adequate to qualify for a single symptom.
Role of depression on music engagement, music skills and demographic factors
A general binary depression variable (depressed and non-depressed) was created. Depressed category was based on the presence of five out of nine symptoms, including the compulsory presence of one or two primary symptoms (depressed mood and reduced interest in activities or loss of pleasure). Participants in the depression category were selected irrespective of the severity level and according to the diagnostic criteria for depression outlined in ICD-11. On the other hand, those who did not meet less than ICD-11 diagnostic criteria for depression, were included in non-depressed group.
No significant differences between non-depressed and depressed individuals were found regarding musical training, music education, gender and age. In music engagement, no differences were found between depressed and nondepressed in HM, Welch's t(501.86) = 1.36, p = .174, ΔM = 0.38, 95% CI [−0.17, 0.93], d = 0.09, 95% [−0.04, 0.22]. Yet, differences were observed in UHM. Depressed people had higher levels of UHM than people without depression, Welch's t(534.91) = −6.92, p < .001, ΔM = −2.47, 95% CI [−3.16, −1.77], d = −0.46, 95% CI [−0.59, −0.32].
Sensitivity and specificity of UHM subscale
Univariate binary logistic regression assessed the UHM subscale specificity, sensitivity, and accuracy in predicting and identifying depression cases through classification tables. UHM subscale is selected as an independent variable, and a binary (depressed and non-depressed) variable created according to ICD-11 criteria is selected as a dependent variable. The results indicate that the model is statistically significant (χ2(1208) = 48.39, p < .001). UHM is a significant predictor (B = 0.09, 95% CI [0.09, 0.13], SE = 0.02, Wald X2 (1) = 43.07, OR = 1.10, 95% CI [1.06, 1.13], p < .001) of depression episode that meets the ICD-11 criteria. The Nagelkerke R2 = .06 indicates that this model accounts for 6% of the variability in depression. Optimal cut-off values were calculated using ROC curves (Figure 1) to find the UHM subscale screening accuracy; 10.5 was selected as the cut-off score (Table 5) for the UHM subscale. The sensitivity was 0.86, specificity was 0.66, and area under ROC curve was .64, 95% CI [.60, .68], SE = .02, asymptotic significance p < .001.

ROC Curve.
Coordinates of the ROC curve test result Variable(s): Unhealthy music subscale (UHM).

The test result variable(s): Unhealthy Scale has at least one tie between the positive actual state group and the negative actual state group.
a. The smallest cutoff value is the minimum observed test value minus 1, and the largest cutoff value is the maximum observed test value plus 1. All the other cutoff values are the averages of two consecutive ordered observed test values.
Link between social and psychological factors and musical engagement
Since we observed a bidirectional relationship between music engagement and depression, we will focus on the demographic variables that might play a role in music engagement. These variables include demographic (age and gender, occupation, marital status, cities), musical skills, trait affect, and preferred music genres/styles.
Psychological factors
HM was positively correlated with trait PA: r(1185) = .29, 95% CI [.24, .34], p = .001, but not with trait NA: r(1184) = .01, 95% CI [−.05, .06], p = .854. UHM was negatively correlated with PA: r(1185) = −.14, [−.20, −.09], p = .001, and positively with NA: r(1184) = .36, 95% CI [.30, .40], p = .001.
Social factors
In the HM subgroup, no differences were found in occupation (F(2,276.29) = 1.15, p = .316, ω2 = .00) and relationship status (F(2, 34.23) = 1.28, p = .289, ω2 = .00).
In the UHM subgroup, 1308 participants were included in the Welch-ANOVA. Differences were observed between occupation categories (F(2, 279.20) = 40.01, p < .001, ω2 = .05) and relationship status (F(2, 34.64) = 39.39, p < .001, ω2 = .04). Games-Howell post hoc comparisons using scheffe's corrections method indicated that students (n = 797) had higher levels of unhealthy music use (UHM) compared to employed (n = 408, ΔM = 2.84, 95% CI [2.09, 3.59], pscheffe<.001) and other (n = 103, ΔM = 1.67, 95% CI [0.34, 3.00], pscheffe = .010). In the relationship status, married & life partner group had lower levels of UHM than people who are single (ΔM = −2.84, 95% CI [−3.58, −2.09], pscheffe<.001).
There were no differences found between the countries, India and Poland in HM (t(147.83) = 0.35, p = .728, ΔM = 0.13, 95% CI [−0.61, 0.87], d = 0.03, 95% CI [−0.16, 0.22]) and UHM (t(144.16) = 0.98, p = .328, ΔM = 0.52, 95% CI [−0.53, 1.57], d = 0.09, 95% CI [−0.09, 0.28]). There were no differences observed between cities in HM, but differences were observed between the cities (F(3, 75.13) = 32.33, p < .001, ω2 = .06) in UHM. Games Howell post hoc comparisons using scheffe's correction method indicated people from Hyderabad had lower levels of UHM compared to people from Vijayawada (ΔM = −2.92, 95% CI [−3.73, −2.11], pscheffe <.001). People in Vijayawada city had higher levels of UHM than people in Bangalore (ΔM = 4.41, 95% CI [2.04, 6.79] pscheffe<.001) and Warsaw (ΔM = 2.01, 95% CI [0.56, 3.45], pscheffe = .002]. The mean values of UHM levels indicate that people from Bangalore city had lower levels of UHM. The effect size interpretation for omega squared (ω2) is 0.01 (small), 0.06 (medium), 0.14 (Large).
Gender
Women had higher levels of HM than men (t(1304) = 2.04, p = .042, ΔM = 0.46, 95% CI [0.02, 0.91], d = 0.11, 95% CI [0.00, 0.22]), while no gender differences (t(1306) = 0.55, p = .581, ΔM = 0.17, 95% CI [−0.43, 0.78], d = 0.03, 95% CI [−0.08, 0.14]) were observed in UHM.
Age
HM was positively correlated with age: r(1306) = .06, [.00, .11], p = .045; UHM was negatively correlated with age: r(1306) = −.19, 95% [−.24, −.14], p = .001.
Participants were classified into three groups based on their age. 68.9% of participants were in emerging adulthood (18–25 years, n = 916), 23% were in young adulthood (26–39 years, n = 306), 8.1% of participants were in middle adulthood (40–65 years, n = 107). Age is used as WLS weight due to the uneven distribution of participants in age groups in the current study. Welch correction is used for the ANOVA test because of the violation of the equality of variance assumption. 1306 participants were included in the final analysis. Statistically significant differences were not present among age groups (F(2, 266.48) = 1.63, p = .197, ω2 = .00) in HM but in UHM (F(2, 288.65) = 43.94, p < .001, ω2 = .06). Games- Howell post hoc comparison tests using scheffes's correction method indicate that the emerging adulthood group has higher levels of unhealthy music use than young adults (ΔM = 2.86, 95% CI [2.06, 3.66], pscheffe < .001) and middle adulthood group (ΔM = 2.80, 95% CI [1.70, 3.91], pscheffe < .001).
Musical skills and musical history
There were no statistical differences in HM between non-musician and musician regarding learned music (Welch t(133.96) = −0.58, p = .561, ΔM = −.29, 95% CI [−1.28, 0.70], d = −0.08, 95% CI [−0.34, 0.19]), studied music theory (t(34.53) = 0.70, p = .486, ΔM = .64, 95% CI [−1.20, 2.48], d = 0.16, 95% CI [−0.26, 0.57]), or played an instrument (t(29.13) = 0.25, p = .802, ΔM = 0.25, 95% CI [−1.75, 2.25], d = 0.06, 95% CI [−0.40, 0.52]).
Regarding UHM, there were no statistically significant differences between musician and non-musicians, neither for learning music formally (t(151.03) = 1.08, p = .282, ΔM = 0.79, 95% CI [−0.65, −2.22], d = 0.14, 95% CI [−0.12, 0.40]) nor for studying music theory (t(44.73) = 0.21, p = .832, ΔM = 0.23, 95% CI [−1.91, 2.37], d = 0.04, 95% CI [−0.37, 0.46]). One exception are musicians who have played an instrument for six and above years, showing lower levels in UHM (t(38.47) = 3.89, p = .001, ΔM = 4.09, 95% CI [1.96, 6.21], d = 0.84, 95% CI [0.34, 1.33]) compared to non-musicians.
In addition, age was negatively correlated (r(873) = −.11, 95% CI [−.17, −.04], p = .001) with the number of hours a person listens to music in a week. Music as a hobby in years was positively correlated (r(1012) = .22, 95% CI [.16, .28], p = .001) with HM and negatively related (r(1014) = −.11, 95% CI [−.17, −.05], p = .001) with UHM. Familiarity with Indian popular music was positively associated (r(1202) = .13, 95% CI [.08, .19], p = .001) with HM but not associated (r(1202) = .06, 95% CI [.00, .11], p = .054) with UHM.
Music preferences
Only three musical styles showed significant correlations with music engagement (Table 6). Classical and melodious was positively correlated with HM. Sad music was positively correlated with UHM. In light of the large number of musical styles and the cumulation of Alpha error when testing all their associations with music engagement, we can conclude that there are no substantial correlations between music preferences and music engagement. Furthermore, the sample sizes for each genre are too small. The first five genres reported in Table 7 had above 100 participants each. From love and romantic genre to instrumental, the sample sizes of each genre were between 50 to 30 people. The rest of the genres were named by 20 to 30 people.
Correlation of healthy-unhealthy music subscales with music preferences.

Note. 1306 participants were included for the analysis between HM and music preferences (genres). 1308 participants were included for the analysis between UHM and music preferences. Music genres reported in this table are arranged in a descending way based on the number of people that reported their preference for that genre.
Prevalence of depressive symptoms in Indians and Indian immigrants.
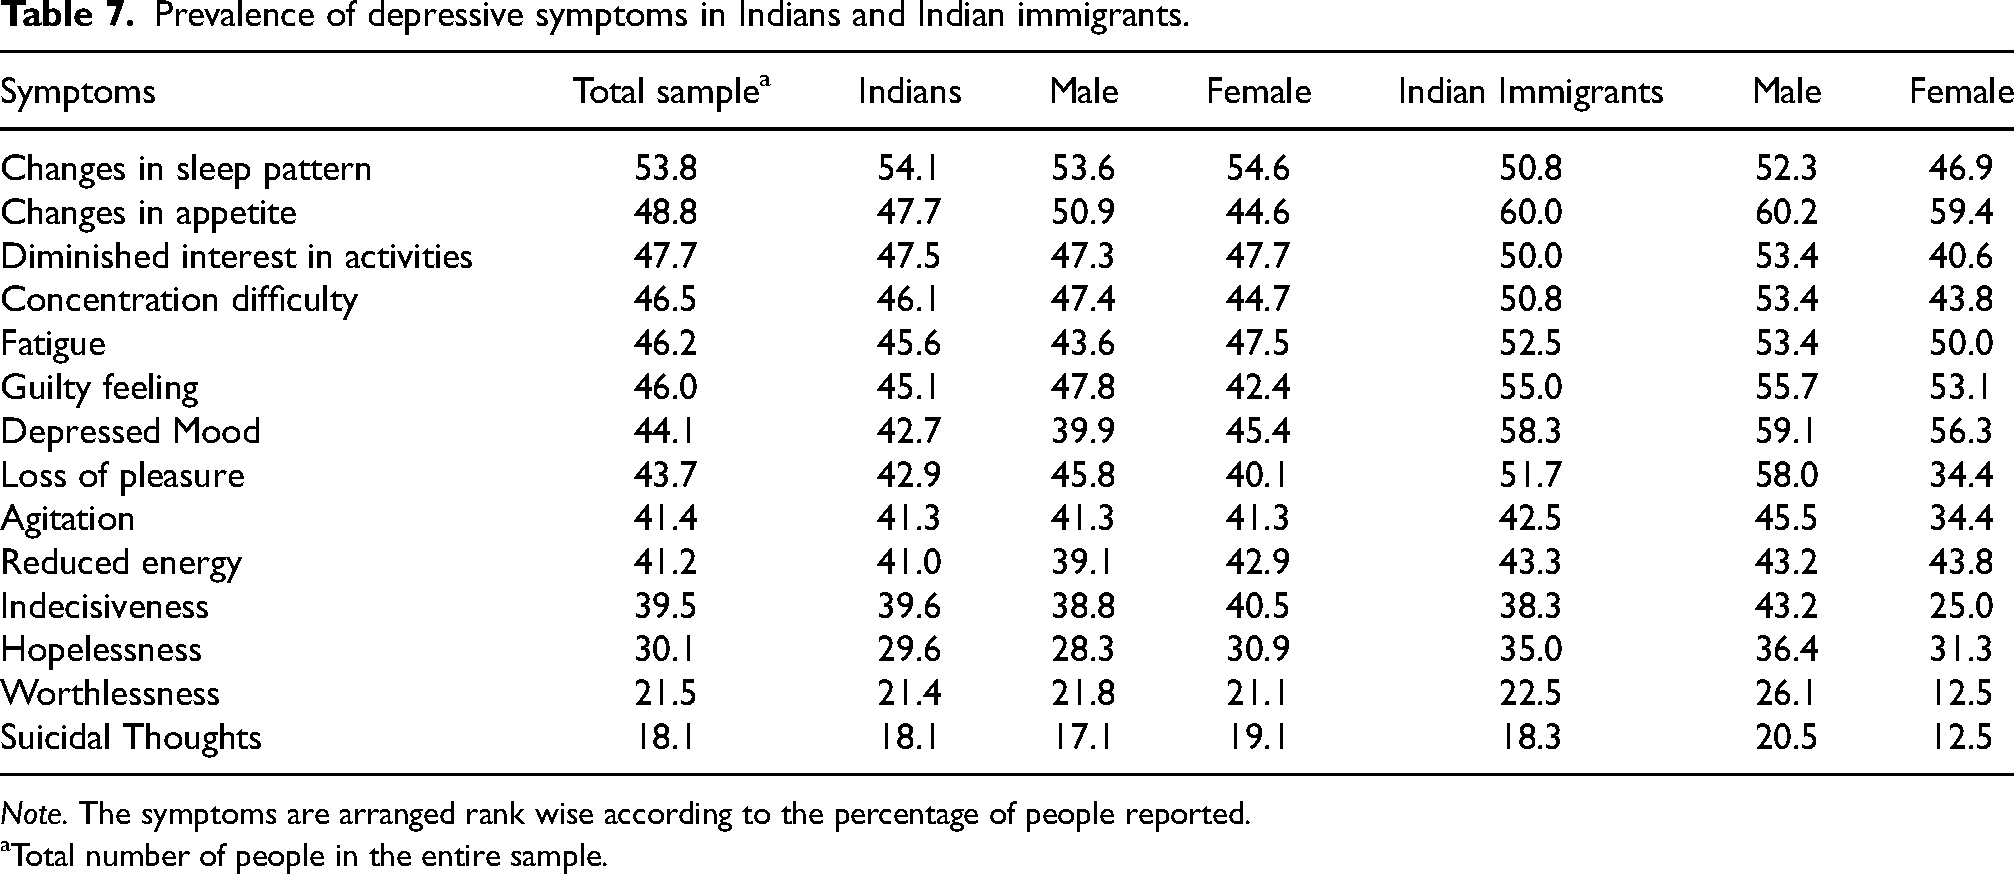
Note. The symptoms are arranged rank wise according to the percentage of people reported.
Total number of people in the entire sample.
Discussion
Prevalence of depression symptoms
The prevalence of depression symptoms reported by the Indian participants in the current study supports earlier research where people frequently reported somatic symptoms (Grover et al., 2010). The most commonly reported depressive symptoms experienced by the Indian immigrants in the current study are somatic symptoms and sad mood, similar to the depression symptoms reported in Indian immigrants (Bhugra & Mastrogianni, 2004; Bhui et al., 2004).
Music and depression
Depressive symptoms relation with UHM
The current study provides evidence that depressive symptoms significantly correlate with unhealthy musical use (UHM) positively but not associated with healthy musical use (HM). Unlike in the original study by Saarikallio et al. (2015), where they found that depression is positively correlated with HM.
The findings from correlation analysis show that the strength of the effect sizes between depressive symptoms and UHM extended from small to medium, but the effect size between depression sum score and UHM extends above medium (r = .39). The findings are in contrast with Saarikallio et al. (2015) and Agarwal et al. (2019), where they found a large effect size (r = .52 and r = .67) was observed in the relationship between the sum score of depression and UHM. This is because the K10 scale was employed to measure depression in both these studies. K10 scale was developed to assess psychological distress rather than to capture depression. In addition, the sample sizes of these studies are small that would inflate effect sizes. Garrido et al. (2017) obtained similar results, where they found a large effect size (r = .45) in the relation between UHM and sum score of the DASS depression subscale. The upper limit of the confidence interval reported in the current study has observed similar effect size (r = .44). The sample size in Garrido et al. (2017) study is acceptable. However, the gender distribution in the sample is skewed towards recruiting more women that might influence the results, as women have a higher risk of experiencing depression and rumination (Nolen-Hoeksema & Hilt, 2009). The overlap of item content between the DASS depression subscale and BDI-II is low. The authors of the DASS subscale admitted that the items in the depression subscale do not correspond to any diagnostic systems (DASS FAQ, n.d.).
Interchanging of depression scales changes the effect sizes and makes it difficult to interpret the findings. Therefore, we used the depressive symptoms criteria of ICD-11 to measure depression and assessed symptom level relationship with the HUMS subscales instead of depression sum scores. The results reveal crucial information on symptom level that suicidal thoughts, worthlessness, and fatigue symptoms had a robust relationship with UHM. Using depression sum score would obscure such important observations.
Depressive symptoms predictor of UHM
The results from multiple regression analysis indicate that six depression symptoms are predictors of unhealthy music use (UHM). Of those six symptoms, three are from affective cluster (AC), including one primary symptom, depressed mood. This is in line with the general belief that depression is considered an affective disorder. Therefore, we would expect it to be majorly associated with the affective component of musical engagement (Gabrielsson, 2010) and the inherent ability of music to influence emotions and mood (Juslin et al., 2010; Konečni, 2010). In addition, fatigue and changes in sleep pattern from somatic cluster (SC) and hopelessness from cognitive cluster (CC) are predictors of UHM. The effect size of R2 is above medium in strength.
The explanation behind the lack of improving mood when experiencing depressive symptoms is because of selecting mood-congruent music to sustain the negative states deliberately and worsen mood for misery sharing (Gibson et al., 2000; Skånland, 2013; Zillmann, 1988a). The mood congruency theory states that the increased recall of information, thoughts, or memories that are congruent with affective states (Bower & Forgas, 2000, 2001). For example, a negative mood tends to facilitate and entertain negative thinking and enhance or maintain negative affective experiences (Zillmann, 1988a), resulting in self-defeating tendencies that aggravate the distress. People who experience depressive symptoms most likely engage with music to reflect or to match their mood (Wilhelm et al., 2013).
Siemer (2005) found that mood induced through music tends to be accompanied by mood-congruent cognitions in an experimental setting. Sad mood increases the perception of sadness while listening to music (Hunter et al., 2011). Especially when the individuals are experiencing distress, they may consciously choose to hinder the process of mood repair altogether despite maintaining those affective states which do not help address those inducing incidents, nor does it help prevent manifesting such events in the future (Gibson et al., 2000).
Depressed individuals are highly susceptible to employing affect regulation strategies like expressive suppression and engage in rumination due to a lack of inhibition when processing negative material (Joormann & Gotlib, 2010). In the music context, deploying affect regulation strategies to change or maintain affective states that are maladaptive lead to impaired affect regulation (Marik & Stegemann, 2016; Sakka & Juslin, 2018b). Therefore, maladaptive music listening may contribute to maladaptive affect regulation outcomes in individuals with a disposition for depression. However, these outcomes may not represent the affect regulation intentions of these individuals.
In depression, persistent negative affect and impaired affect regulation skills are observed (Campbell-Sills & Barlow, 2007), when coupled with maladaptive ways of listening to music has harmful consequences and can cause disturbances in affective functioning, which is commonly observed in affective disorders such as depression and anxiety (Carlson et al., 2015; Garrido & Schubert, 2013a; Silverman, 2020a).
UHM predictor of depressive symptoms
The findings from logistic regression analysis confirm that subjects who engage with music in unhealthy (UHM) ways have an increased risk of experiencing depression symptoms. The more intense the individuals engage in UHM, the higher their risk of experiencing depression symptoms. Engaging with UHM can increase the odds of experiencing depressive symptoms by up to 14 percent.
McFerran and Saarikallio (2014) demonstrated in their study that young people at risk of depression are more likely to rely on music to improve their affective states and feel content about themselves. However, those people also unconsciously use music to intensify their distressed states and support rumination. People prone to depression may not be aware of the effect of music listening on them and report positive benefits from music engagement. Lack of awareness about the double-edged ability of music behaviours can be harmful to the individual if the music they are engaging with is used to intensify their mental health disorders (Cheong-Clinch & McFerran, 2016). Addressing how people engage in musical activities can increase awareness and insight into the effects of deliberate music listening (McFerran et al., 2018).
Maladaptive strategies such as rumination involve the individual in uncontrolled attention on pessimistic, negative thoughts and behaviours associated with prolonged sadness, leading to a decrease in motivation to do any activities that would improve the mood (Conway et al., 2000; Forbes & Dahl, 2005; Joormann, 2005). Rumination is a strong predictor of clinical depression (Calmes & Roberts, 2007; Nolen-hoeksema & Morrow, 1993). One explanation that might explain why people continue to pursue rumination despite it having negative consequences is that ruminative behaviour is reinforced by the fact that it permits ruminations to avoid the situations and evade active involvement in problem-solving (Moulds et al., 2007). Using rumination would make depressed people choose music that would not aid in improving their mood. Employing avoidance strategies as coping is a significant factor in predicting psychopathology, mainly depression, anxiety, and substance abuse (Aldao & Nolen-Hoeksema, 2012; Nolen-Hoeksema & Aldao, 2011).
Engagement with music for affect regulation does not always guarantee an improvement of mood in every individual. In some circumstances, it may also sustain the presence of psychopathology (Thomson et al., 2014). However, it is difficult to establish whether frequent use of specific strategies of music engagement advances the onset of psychopathology or whether psychopathology encourages the adoption of these maladaptive strategies. Future studies in music should focus more on longitudinal methods to establish the prediction at different time intervals (Miranda et al., 2012).
A detailed examination of the results between depressive symptoms and music engagement points us to a crucial observation. There is a strong association between unhealthy musical use (UHM) and suicidal thought symptom. First, the results indicate that suicidal ideation is one of the most important factors behind engaging in unhealthy use of music. Second, the use of unhealthy use of music indicates a higher probability of having suicidal thoughts. But again, due to the study's design, we cannot say anything certain about causality.
UHM subscale can be used as an indirect indicator of affect disturbances or severe mental illness in India, especially when stigma about mental health is high among Indians where 1 in 20 people suffer from depression (Arvind et al., 2019; Gautham et al., 2020) and are unlikely to seek help from a therapist (Shidhaye et al., 2016). Understanding the link between music engagement and mental illness has implications for treatment.
Music engagement in depressed and non-depressed people
Large effect size was observed from the findings of the t-test where depressed people have higher levels of unhealthy music use than people without depression. The results align with an earlier study that used the same tool (HUMS) on the people diagnosed with depression who were admitted to the inpatient ward had higher levels of UHM and lower levels of HM (Hense et al., 2018). These results are in contrast with a recent study by Sakka and Juslin (2018a) they found no differences between depressed and non-depressed individuals in employing maladaptive strategies. Nevertheless, the current results in line with the literature indicate that maladaptive strategies are higher in depressed individuals (Aldao et al., 2010).
Screening accuracy of UHM subscale
The UHM subscale had adequate screening ability to detect the presence of depression episode according to ICD-11. In addition, the sensitivity of the test was high, and the specificity was moderate. These results demonstrate that HUMS scale can be used as a screening tool in non-clinical settings. Despite the HUMS scale ability to detect depression, the HUMS scale cannot be used for screening severe depression symptoms or other mental disorders. Screening tool cannot be substituted for diagnostic evaluation.
Trait affect
Positive and negative trait affect had a significant role in musical engagement. Positive affect had a positive relationship only with HM with a medium strength in effect size, confirming that experiencing trait positive affect is related to flexibility in coping methods and affect regulation while engaging with music. Furthermore, higher levels of positive affect is a sign of individuals overall wellbeing and physical and mental health (Cohen & Pressman, 2006; Kuppens et al., 2008). Thus, employing cognitive strategies that are adaptive such as distraction is related to higher levels of positive affect, which is in line with past research (Augustine & Hemenover, 2009; Stone et al., 1995; Webb et al., 2012). In addition, the HM subscale is comprised of sociability component and it is known that positive trait affect correlates with extraversion (Naragon-Gainey & Watson, 2019).
Lower levels of positive affect and higher levels of negative affect had a relationship with UHM, which is in line with existing evidence that strategies such as avoidance and rumination sustain negative affect, eventually leading to depression symptoms (Aldao et al., 2010; Nolen-hoeksema & Morrow, 1993). Our results confirm that low positive affect and high negative affect had an association with maladaptive coping methods, which in turn is a predictor of psychopathology. The effect size between trait NA and UHM is moderate, but the effect size between trait PA and UHM is small.
Social factors in music engagement
In healthy music use, there were no substantial differences found among different socio-demographic groups. However, in unhealthy music use, there were differences within occupation and relationship status and cities. The effect size of cities and the rest (occupation and marital status) were medium in strength. We can infer two conclusions from the results. First, the geographical location had an association with musical engagement. Second, individuals who identify as students, single in relationship status, had a higher risk of engaging in unhealthy musical use.
The current findings inform us that musical engagement models need to consider social and cultural factors (North & Hargreaves, 2008). The formation of musical identity is shaped in the context of cultural, psychological and social factors and the musical identity cannot be inferred only through musical tastes or music preferences (Dys et al., 2017). How we listen to music and respond to music is related to geographic location and contextual factors (Krause et al., 2016; Krause & North, 2017). Where we are listening to music and how we listen to music can be a marker of musical identity (Hargreaves et al., 2016). However, further research needs to be done to examine geographical influences on musical engagement through the ESM method.
Gender differences
There were no gender differences observed in unhealthy music use. However, a significant gender difference is observed with a small effect size in healthy music use in the present study. Women engage with healthy musical use more frequently than men, which is consistent with the general literature on the use of coping mechanisms and affect regulation strategies where women employ a wide repertoire of affect regulation strategies to regulate their affect (Nolen-Hoeksema, 2012; Tamres et al., 2002) and women tend to use music for affect regulation, stress regulation significantly higher than men (Groarke & Hogan, 2018; Sloboda et al., 2001).
The gender differences found in the current study is in contrast with Saarikallio et al. (2015) study, where they found out that adolescent girls scored higher in unhealthy music use than boys and gender differences were not observed in healthy musical use. The differences in results between the current study and the former study are that the current study age composition of the sample is older than the younger school going sample and early college going girls in the former study. In a longitudinal study using an adult sample Hides et al. (2019) stated that gender did not have any role in HM or UHM.
Age relationship with musical engagement
In the current study, age was inversely correlated with UHM with a small effect size, consistent with the study by Garrido et al. (2017) that found a small effect size between UHM and age. In addition, findings from ANOVA test show that emerging adults had higher levels of UHM than the young and middle adulthood group with a moderate effect size. Overall the findings support the notion that affect regulation improves and negative affect decreases in old age (Mather & Carstensen, 2005), but our findings are in contrast with other studies (Agarwal et al., 2019; Saarikallio, 2011) that found no differences between age groups and music listening patterns that specifically focused on a link with depression.
Young individuals more frequently experience intense and extreme affective states (Larson, 1995), sometimes with a negative valence, which might reflect that the transition from childhood to young age sometimes is marked by an increase in psychopathology, particularly mood disorders (Davey et al., 2008; Paus et al., 2008). This is a crucial stage as the chance of developing maladaptive strategies rises, as it further increases the vulnerability for experiencing psychopathology (Cracco et al., 2017; Schirda et al., 2016). Young people with low emotional awareness have a higher chance of developing depression and anxiety and diminished access to strategies to cope with interpersonal difficulties and negative affect (Flynn & Rudolph, 2014; Kranzler et al., 2016).
Music skills and musical activities
The results indicate an absence of statistically significant differences in healthy, unhealthy music use between non-musicians and musicians, either in learned music formally or studied music theory. The findings support previous studies that did not find any differences in affective responses or music engagement strategies between musicians and non-musicians (Saarikallio et al., 2013). However, musicians playing musical instruments for more than six years had lower levels of unhealthy music use (UHM) than non-musicians, and the effect size is strong. The findings confirm that the amount of time involved in learning a musical instrument is related to the affective regulation of the musician and they use less maladaptive strategies when they engage with music. The findings support the notion that involvement in musical activities or acquiring music skills is related to the flexible use of affect regulation through music (Hanser, 2011). Thus, an individual's affective regulation might be improved by musical training (see also Lehmann, 1997; Pelletier, 2004; Stratton and Zalanowski, 2003).
The correlational results also indicate that the average music listening time in a week is reduced as the age increases, but having music as a hobby over the years is linked to HM and inversely related to UHM. As we age, having a music hobby is beneficial as it engages with music employing adaptive regulation strategies and reduces maladaptive music engagement strategies. The findings should be interpreted with caution as the effect sizes of correlation coefficients are small. However, these results are in line with evidence that music engagement through active involvement in music-related activities is positively associated with individual's affect regulation and physical, mental health, and wellbeing across the lifespan (Hanser, 2011; MacDonald et al., 2013; Rickard & McFerran, 2012).
The familiarity with popular music, in this case, it is Indian popular music, is correlated with HM with a weak effect size. However, earlier research showed that familiarity with music does not predict stress, but the degree of liking is related to reducing stress levels (Jiang et al., 2016).
Music genres
Overall, the results showed no substantial correlations between musical genres and music engagement. There were only three exceptions: melodious, classical, and sad music showed at least small correlations with musical engagement.
The preference for sad music was positively associated with UHM. Sad themes in sad music are related to higher levels of rumination (Garrido & Schubert, 2013a). In turn, rumination might lead to prolonged maladaptive music engagement and eventually to the development of depressive symptoms. The plausible explanation behind why sad music is associated with UHM can be explained through mood congruence theory, sad mood states make sad music more appealing for them (Hunter et al., 2011). However, some studies found that listening to sad music can also have positive outcomes as it helps release negative emotions (Van den Tol & Edwards, 2013). Yet, people who are already prone to depression might not be able to profit from this specific aspect (Garrido & Schubert, 2013b, 2015). The present study confirms that listening to sad music is connected with maladaptive engagement with music.
Preference for classical and melodious music genres was positively correlated to HM. Classical music is mainly rooted in tradition and is part of religious music in India (Joshi, 1982). The melodious style also refers to devotion and spirituality (Upadhyay et al., 2016). In India, traditional music is entwined with religious activities, and people listen to religious music as part of self-reflection and diversion to either seek solace from or indulge in spiritual activities. Schäfer et al. (2012) found that self-reflection in the form of devotion to God is one of the key functions of music in Indians. Within Indian cultural context, it is not possible to listen to Indian raga (melody) without emotionally being involved as each raga (melody) evokes a specific emotion, mood, or sentiment (Deva, 1992; Mathur et al., 2015; Midya et al., 2019). Findings from RCT trials demonstrated that the therapeutic application of ragas in treatment settings on mental health, neurocognitive disorders, and stress, hypertension has potential health benefits (Kunikullaya et al., 2015, 2016; Nizamie & Tikka, 2014; Sharma et al., 2021).
The current findings on music preferences align with earlier research that stated the association between music preferences (genres) and mental health did not generate enough evidence to infer a causal relationship (A.C. North & Hargreaves, 2006). Interventions that focus on raising awareness and self-reflection of the feelings and thoughts triggered by music listening are more predictive for positive outcomes than specific music style preferences (Stewart et al., 2019).
Limitations
The design of this study is cross-sectional, so our findings do not reveal any causality. We could have measured musical genres through validated scales instead of open-ended questions. The construct validity and reliability of the single item measurement of depression symptoms are prone to error. To date, most of the common scales developed to assess depression have not been validated to analyse individual depressive symptoms. A potential solution to improve the reliability of symptom measurement would be assessing the single symptom with multiple items on a broader scale, employing a scale like Inventory of Depression and Anxiety Symptoms (Watson et al., 2007) that measures a single symptom such as suicide with six different items might be a more reliable form of measurement. Another limitation is that we did not collect data on the acculturation and immigration experience of the Indian immigrants in Poland that would have revealed crucial information.
Conclusion
The way people interact with music may reflect their inner cognitive and emotional world and also an indicative of maladaptive ways of coping with everyday life, which might also reflect states of depression. In the present study, we mainly investigated the relationship between music engagement, symptoms of depression, and trait affect. We found that mainly the affective component of depression had a strong association with maladaptive music engagement. Since prior research has revealed nothing definite about the causality of these variables, we analysed predictive models in both directions and could show that maladaptive music engagement can predict depressive symptoms, but, at the same time, depressive symptoms can predict maladaptive music engagement. However, these causal pathways have to be tested empirically in future studies using longitudinal and ESM methods. Despite these limitations, the study's findings are important because the UHM subscale of HUMS can identify individuals at risk of experiencing depressive symptoms. Moreover, our results showed that learning a musical instrument for a longer duration can be a protective factor as they prompt individuals to engage with music using efficient and flexible affect regulation strategies.
We could also show that the HUMS scale is a reliable tool that can be used in the general adult population as a non-clinical element of screening depression symptoms, and it can also help in identifying people at risk for depression episode (ICD-11 criteria), which can also be valuable in therapeutic settings, especially in music therapy that deals with depression. It is cost-effective and easy to use. Employing the HUMS scale in music therapy may help develop healthy relationships with music by evaluating music's positive and negative impact on everyday lives (Ansdell, 2016).
Footnotes
Acknowledgements
I’m thankful to the participants who enrolled in the study. I’m grateful for the support of my family, friends and the people who helped me at every stage of this study. I wouldn’t have executed this study without them. I am indebted to the co-authors and anonymous reviewers of this paper.
Correction (August 2023):
Article updated; for further details please see the Article Note at the end of the article.
Action Editor
Suvi Saarikallio, Department of Music, Art and Culture, University of Jyväskylä.
Peer Review
Katrina McFerran, The University of Melbourne, Faculty of Fine Arts and Music. Dave Miranda, University of Ottawa, School of Psychology.
Author Contributions
SCK researched literature, designed the study, obtained ethical approval, recruited participants, conducted the data analysis and wrote the first draft of the manuscript. DMG, TS, AG reviewed and edited the manuscript and approved the final version of the manuscript. AG supervised the study.
Declaration of Conflicting Interests
The author(s) declared no potential conflicts of interest with respect to the research, authorship, and/or publication of this article.
Funding
The author(s) received no financial support for the research, authorship and/or publication of this article.
Article Note
The following updates are made in the article:
The article title is changed from “Depression Symptoms is Linked to Music Use: Investigating the Role of Trait Affect, Musical Ability, and Musical Preferences” to “Depression Symptoms are Linked to Music Use”.
Minor grammatical corrections have been made within the text of the article.
“Wellbeing” is replaced with “trait affect” in “The present research investigated how strongly maladaptive musical engagement is linked with depression and wellbeing in a sample of 1415 Indians (17–65 years) across four cities and two countries.” under “Abstract”.
The legend of Table 5 is changed from “Coordinates of the ROC curve test result Variable(s): unhealthy scale” to “Coordinates of the ROC curve test result Variable(s): unhealthy music subscale (UHM)”.
In Table 7, “Diminished interest” is changed to “Diminished interest in activities” under “Symptoms”.
References
Supplementary Material
Please find the following supplemental material available below.
For Open Access articles published under a Creative Commons License, all supplemental material carries the same license as the article it is associated with.
For non-Open Access articles published, all supplemental material carries a non-exclusive license, and permission requests for re-use of supplemental material or any part of supplemental material shall be sent directly to the copyright owner as specified in the copyright notice associated with the article.