
Abstract
Acoustic and musical components of consonance and dissonance perception have been recently identified. This study expands the range of predictors of consonance and dissonance by three analytical operations. In Experiment 1, we identify the underlying structure of a number of central predictors of consonance and dissonance extracted from an extensive dataset of chords using a hierarchical cluster analysis. Four feature categories are identified largely confirming the existing three categories (roughness, harmonicity, familiarity), including spectral envelope as an additional category separate from these. In Experiment 2, we evaluate the current model of consonance/dissonance by Harrison and Pearce by an analysis of three previously published datasets. We use linear mixed models to optimize the choice of predictors and offer a revised model. We also propose and assess a number of new predictors representing familiarity. In Experiment 3, the model by Harrison and Pearce and our revised model are evaluated with nine datasets that provide empirical mean ratings of consonance and dissonance. The results show good prediction rates for the Harrison and Pearce model (62%) and a still significantly better rate for the revised model (73%). In the revised model, the harmonicity predictor of Harrison and Pearce’s model is replaced by Stolzenburg’s model, and a familiarity predictor coded through a simplified classification of chords replaces the original corpus-based model. The inclusion of spectral envelope as a new category is a minor addition to account for the consonance/dissonance ratings. With respect to the anatomy of consonance/dissonance, we analyze the collinearity of the predictors, which is addressed by principal component analysis of all predictors in Experiment 3. This captures the harmonicity and roughness predictors into one component; overall, the three components account for 66% of the consonance/dissonance ratings, where the dominant variance explained comes from familiarity (46.2%), followed by roughness/harmonicity (19.3%).
Introduction
The investigation of musical consonance and dissonance—that is, the relative agreeableness/stability versus disagreeableness/instability of simultaneous and successive pitch combinations—has a long and checkered history (see e.g., Tenney, 1988). The Pythagorean school in ancient Greece held that consonance/dissonance (hereafter referred to as C/D and implying exclusively simultaneous pitch combinations) can be explained through the simplicity of number ratios, and this view was upheld well into the 16th century (e.g., in the work of music theorist Gioseffo Zarlino). In the 17th and 18th centuries, the origins of C/D were elaborated by scholars such as Marin Mersenne, Joseph Sauveur, and Jean-Philippe Rameau, who investigated the role of overtones and their relation to musical harmony. In the 19th century, scholars such as Hermann von Helmholtz (1875) and Carl Stumpf (1898) brought the knowledge of physics, anatomy, perception, and empirical testing to characterize C/D as something that depends on frequencies of the fundamental and the partials of the sound and how these are interpreted within the musical tradition that the listener is familiar with. Twentieth-century psychoacoustics made large strides in charting the sensory aspects of phenomena such as dependence on the frequency (Terhardt, 1984) and critical bands (Plomp & Levelt, 1965). Today, the research field is starting to reach a consensus that the overall perception of C/D in simultaneous sonorities in the Western musical culture is arguably based on a combination of roughness, harmonicity, and familiarity (see e.g., Harrison & Pearce, 2020; McLachlan et al., 2013; Parncutt & Hair, 2011).
Roughness denotes the sound quality that arises from the beating of frequency components (see e.g., Hutchinson & Knopoff, 1978; Kameoka & Kuriyagawa, 1969), and harmonicity indicates how closely a sonority’s spectrum corresponds to a harmonic series (see e.g., Parncutt, 1989). Familiarity, which has received the least amount of attention out of these three proposed features, denotes the prevalence of sonorities in a given musical culture which affects how familiar the listeners become with these sonorities (see e.g., Johnson-Laird et al., 2012). The order of importance between these features on the perception of C/D has remained contentious, and it has recently been the focus of a large-scale analysis (see Harrison & Pearce, 2020) that brought a number of roughness, harmonicity, and cultural models under a systematic review and analysis. This impressive modeling identified the strongest acoustic models for roughness and harmonicity, and it also demonstrated that across musical genres, roughness has a more strong and reliable negative effect on chord prevalence than harmonicity. However, it is too early to draw strong conclusions based on these results; these analyses were typically based on other proxy concepts than actual consonance, such as pleasantness in Bowling et al. (2018), and this method of assessing C/D has recently been demonstrated to result in possible confounds (Lahdelma & Eerola, 2020). Moreover, some of the analyzed datasets contained only a limited selection of chords/intervals (e.g., Schwartz et al., 2003) or have a large majority of culturally unfamiliar chords. Smit et al. (2019) found roughness, harmonicity, spectral entropy, derived familiarity, and mean pitch to contribute to C/D ratings in the case of unfamiliar (detuned) chords. Also, the range of register and timbre used in previous C/D research has been limited. Even a cursory analysis of the state-of-the-art literature suggests that a more thorough assessment of the possible contributions of the different main theoretical features is needed.
In the current study we aim to estimate which acoustic and cultural features account for perceptual evaluations of C/D. We assume that the three categories of features—roughness, harmonicity, and familiarity—as identified by Harrison and Pearce (2020) is a solid starting point to refine the model contributions. We will also add a new feature category labeled spectral envelope, since descriptors such as sharpness have been previously implicated in C/D studies (Zwicker & Fastl, 1990). Since there is a large number of possible models to include as the predicting features, we will explore and streamline the models in preliminary steps to provide robust, independent predictors for the actual model construction. In Experiment 1, we take a reasonable number (4–7) of predictors for each feature category and carry out cluster analysis of a new chord dataset to verify and possibly redefine the feature categories empirically. In Experiment 2, we use the confirmed feature categories to identify the most effective predictor for each category by comparing the alternative predictors within each feature category to the predictors in the current state-of-the-art model (Harrison & Pearce, 2020) using the raw consonance ratings in three recent studies. To assess the overall contribution of the models, in Experiment 3 we compare the C/D model that has been optimized via Experiment 2 and the model by Harrison and Pearce through building linear models via regression with the mean consonance ratings across nine datasets. We also evaluate the degree to which the feature categories contribute independently to the C/D ratings.
Experiment 1: Analysis of Consonance and Dissonance Predictors
We want to utilize a solid set of predictors for the stimuli when exploring the features of C/D. We obtain our predictors mostly from the compilation of models available in the
Definition of the Predictors
For roughness, we have four variant models. The model by Hutchinson and Knopoff (1978), hereafter
For harmonicity, there are seven alternative models:
The model by Gill and Purves (2009) is also based on a template-matching idea, and has been developed for intervals initially. The algorithm, hereafter
Another variant harmonicity model by Stolzenburg (2015) is based on ratio simplicity that takes into account the sensitivity to small tuning deviations in chords that are not just-tuned. In this model (
For familiarity, the current model relies on corpus-based counts as an index of familiarity of the chords and intervals. This predictor (
We also created two additional predictors of familiarity reflecting classic work on tonality and C/D. We calculate the tonal stability of each pitch class as established by Krumhansl and Kessler (1982), which is known to be a good estimator of pitch-class prevalence in Western classical music (Krumhansl, 1990), popular music (Temperley & Clercq, 2013), and even bebop jazz (Järvinen, 1995). The correlation between the best key profile and the pitch-class profile of the input has been used as a measure of key clarity (
We introduce an additional category of predictors that did not feature in Harrison and Pearce’s (2020) review, namely spectral envelope. This category is related to the shape of the energy distribution along the spectrum. For instance, in sharpness, the energy at high frequencies creates sharp sounds that are found to be less pleasant, and therefore sharpness has been implicated as a predictor of consonance in psychoacoustics studies (Terhardt, 1974; Zwicker & Fastl, 1990). We utilize Zwicker’s model to calculate sharpness (hereafter
Cluster Analysis of Predictors
To assess the numerous alternative models for all four categories of C/D features, we first wanted to establish whether the predictors represented the assumed categories. We assume that the predictors from the same feature category would be largely collinear and therefore easily clustered into the same cluster. We examine the degree of collinearity between all predictors by carrying out an analysis of a separate dataset created for this purpose called the Durham Chord Dataset (DCD). This dataset contains all pitch pairings no more than 12 semitones for 2-pitch (12 in total), 3-pitch (66 in total), 4-pitch (220), 5-pitch (495), and 6-pitch (792) combinations across three registers (starting from E 3, E 4, and E 5), resulting in 4,755 unique pitch combinations. To obtain predictions for the additional acoustic predictors, we generated all these pitch combinations using the piano timbre. The sounds were generated with Ableton Live 9 (a music sequencer software), using the Synthogy Ivory Grand Pianos II plug-in. The applied sound font was Steinway D Concert Grand. No reverb was used, and the intervals and chords had a fixed velocity (65). The DCD with audio and all predictors is available at https://github.com/tuomaseerola/DCD.
We first looked at the correlations between the predictors in the DCD dataset. The correlation matrix, shown in Figure 1, suggests that feature categories operate largely as surmised; the predictors within the same feature categories correlate highly positively with each other. To assess the membership of the two potentially mixed categories of roughness and harmonicity empirically, we first estimated the optimal number of clusters that would characterize the similarity of all predictors. We applied gap statistic (Tibshirani et al., 2001) with bootstrapping (1,000 replications) using the
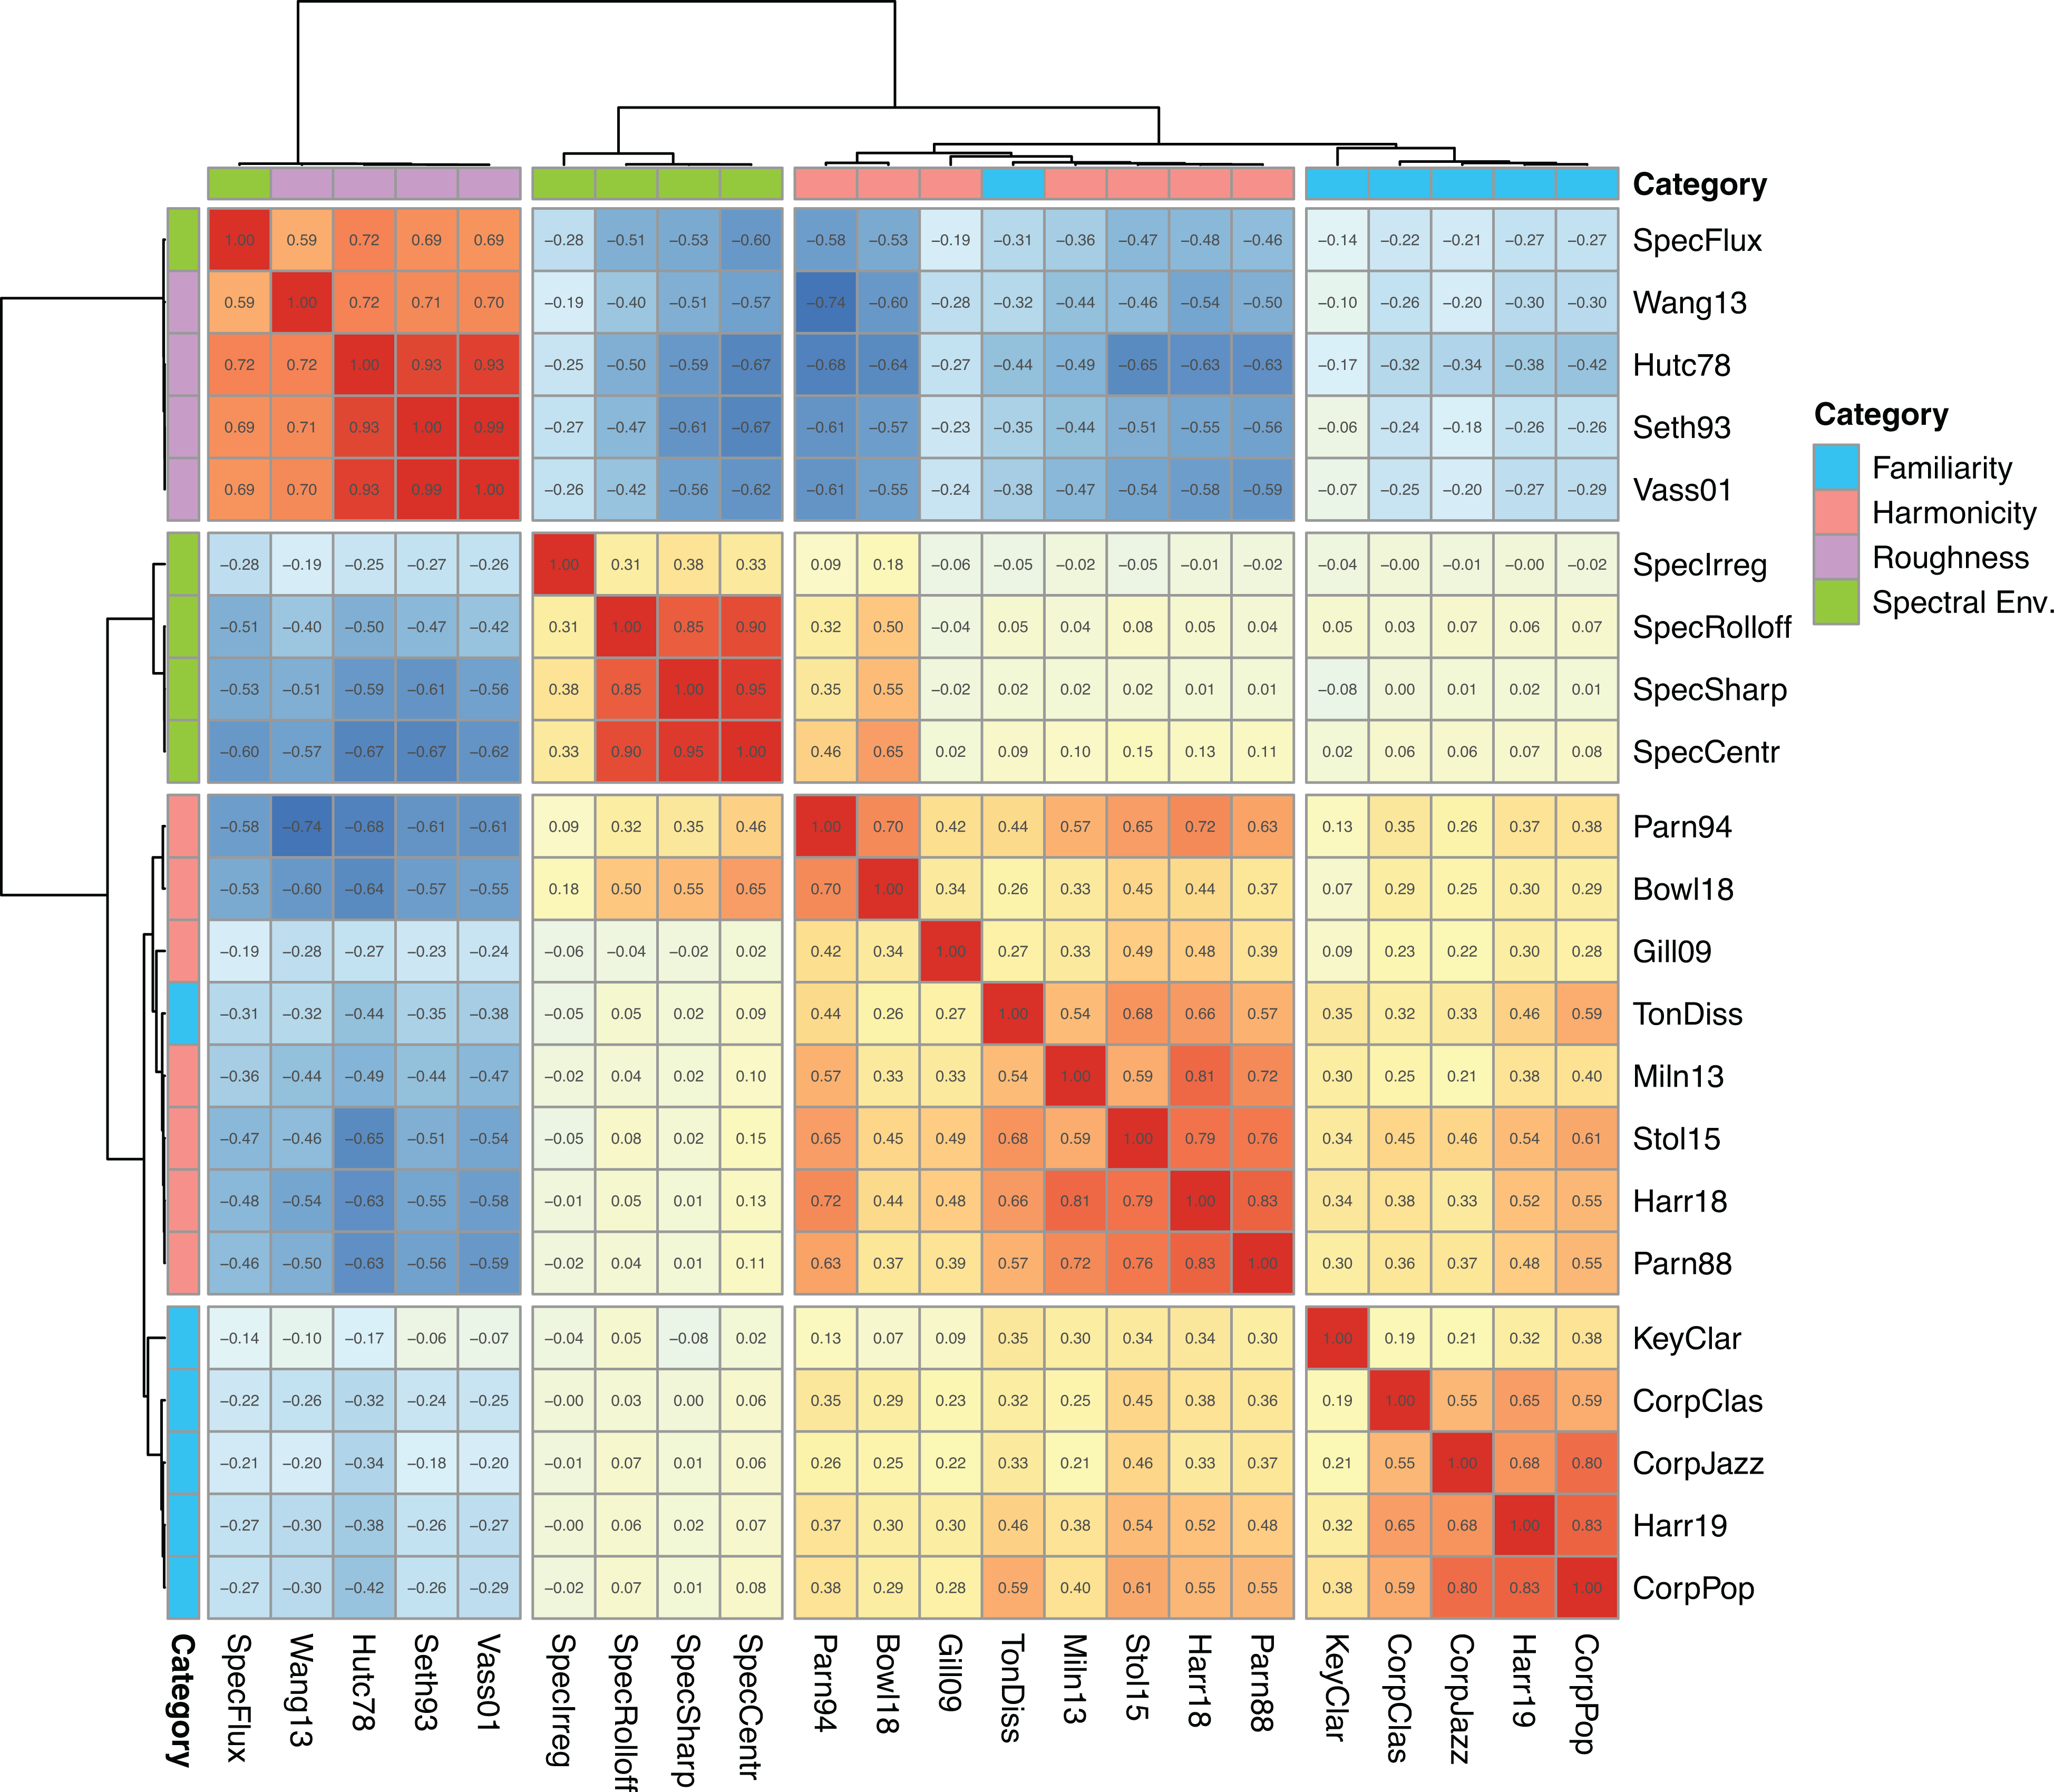
Correlations and a hierarchical cluster solution for predictors of roughness, harmonicity, familiarity, and spectral envelope categories (Durham Chord Dataset, n = 4755).
In this solution, shown in Figure 1, the harmonicity cluster contains harmonicity-related variables (
In the subsequent analyses, we will use this empirically established classification of predictors as the basis of selecting predictors for an optimized model. Moreover, it is also worth pointing out that most acoustic predictors are strongly impacted by numerosity and register. Analytically, this can be demonstrated by separate ANOVAs for each predictor with two factors (numerosity, referring to the number of pitches in the chord, and register, referring to the three different octaves in which the chords were created). This analysis shows the main effect of numerosity for all predictors (df(4,4740), all F
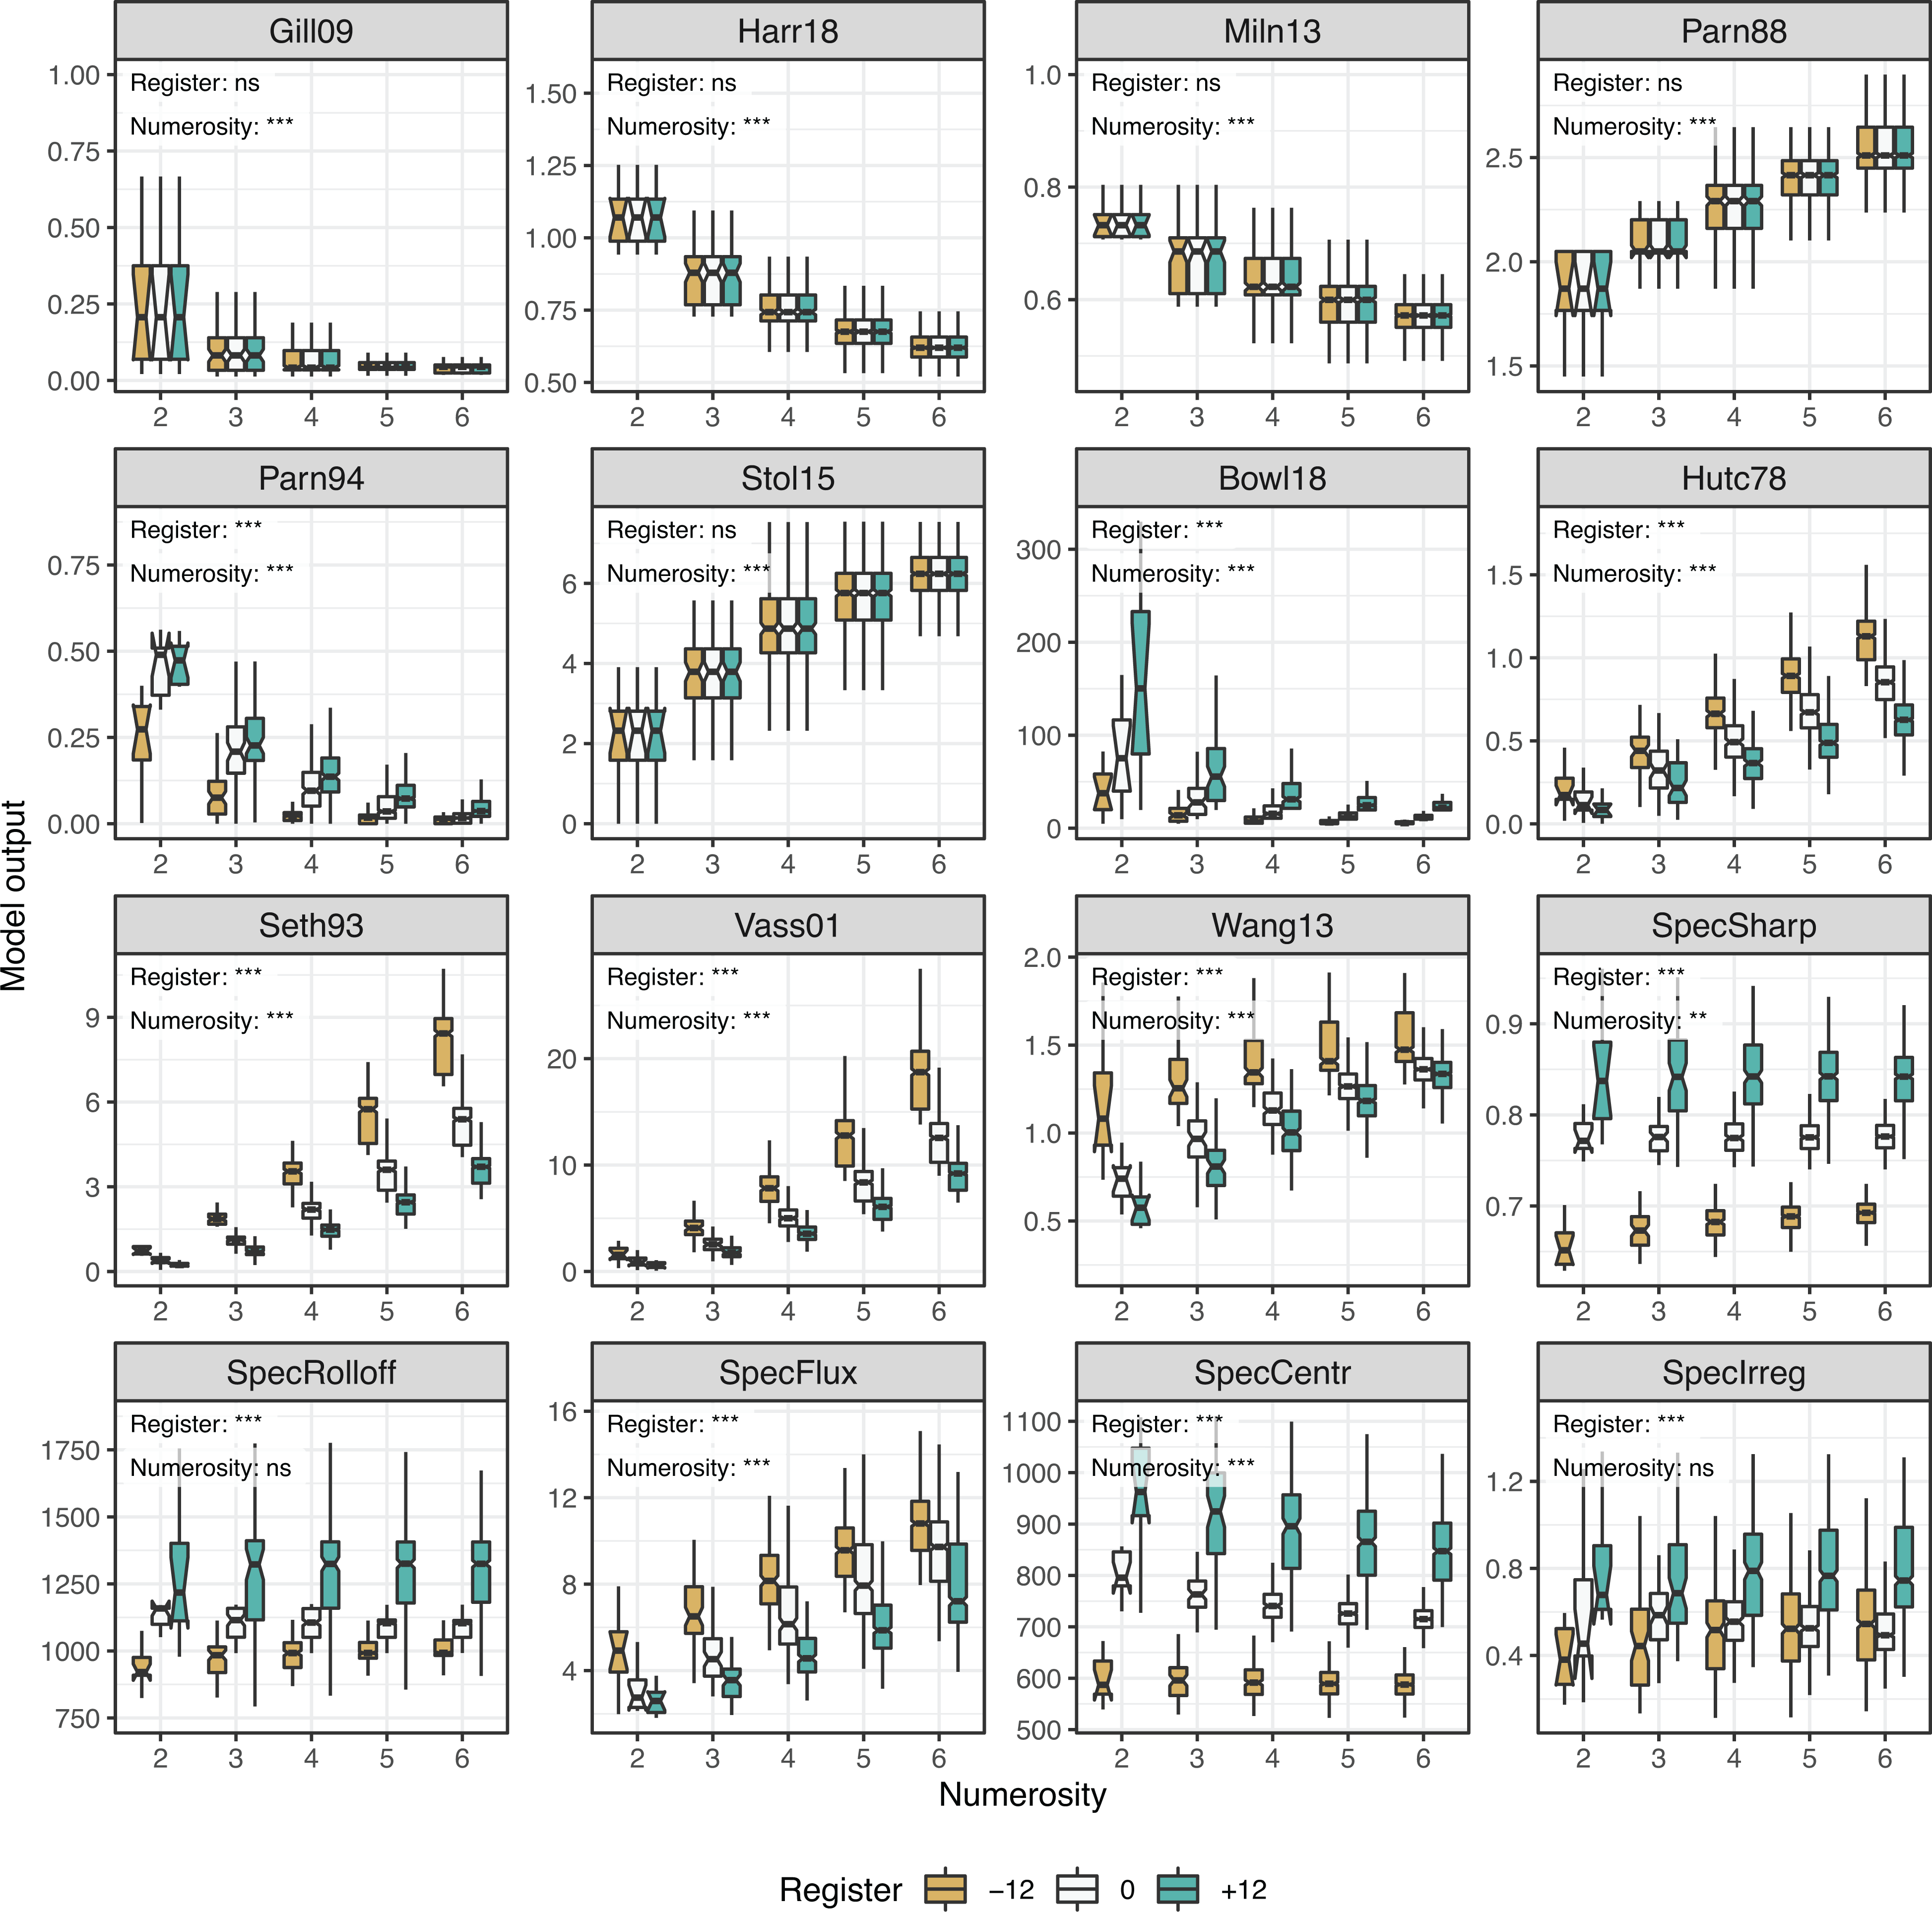
Numerosity and register across roughness and harmonicity models (Durham Chord Dataset, n = 4755). Asterisks refer to p-values in the ANOVA analysis across register or numerosity for each variable, * p < .05, ** p < .01, *** p < .001.
Discussion
Using the extensive Durham Chord Dataset we established how the central models of roughness, harmonicity, familiarity, and spectral envelope correlate highly with each other within the four categories that emerge through hierarchical cluster analysis. Some predictors also exhibit high correlations between these theoretically derived categories (e.g., Stolzenburg’s harmonicity model and Hutchinson’s roughness model demonstrate a correlation coefficient of r = 0.65). This is an important caveat for understanding the independent contributions of the predictors of C/D in subsequent analyses, as multicollinear predictors hinder the interpretation of the predictor contributions in linear regression. The analysis of the dataset also demonstrated that a host of new predictors representing familiarity and spectral envelope operate more or less independently of roughness and harmonicity, although exceptions were observed as well. Spectral flux and tonal dissonance behave with real chords more akin to the other predictors of roughness and harmonicity, respectively. The predictors representing spectral envelope, which is a notion that has been previously proposed to account for dissonance across a wide frequency range, may not have featured strongly in recent studies such as Harrison and Pearce (2020), since the musical materials have not spanned a large range in register or other spectral differences (instrument timbres).
The present analysis also demonstrated how sensitive the models are as to the number of simultaneous pitches (i.e., pitch numerosity). This is worth paying attention to, since several studies have reported that perceptual consonance ratings are dependent on pitch numerosity (Bowling & Purves, 2015; Lahdelma & Eerola, 2020; Lahdelma et al., 2020). Judging from the results of the present dataset, the statistical modeling needs to be able to handle numerosity differences in the models. Also, register could be an important determinant of C/D, although its role has remained largely unexplored; we will pay close attention to the register of the empirical datasets in our modeling and model comparisons. Although the current research has not yet extensively manipulated register, this is an important motivation to incorporate predictors to the consonance explanation that will be able to account for a wider variety of register and timbre in future research.
The present analysis, the selection of predictors, and the dataset were not exhaustive, of course; we did not address timbre in our dataset or the analysis which in real sounds has an undeniable contribution to C/D. However, the decision of leaving out timbre for now is related to the materials (models and data) available: the majority of the models do not easily incorporate timbre and the majority of the empirical data on consonance has been collected with relatively homogenous sounds using piano or sine wave timbres. Theoretically we could have created the Durham Chord Dataset with a wider range of intervals (2 octaves, resulting in 166,362 unique pitch combination if the same generation principles were used) and expanded the register (2, 3, or 4 octaves above and below) or the number of simultaneous pitches (to 7 or 8) for a more extensive coverage of these factors, but we felt that the point is already made and the variant formulations of the dimensions would yield little additional insight. There might be a small danger that the current dataset puts too much emphasis on high numerosity pitch combinations (5- and 6-pitch combinations form 81.1% of the dataset), which might undervalue the importance of familiarity predictors, since most of the 4-, 5-, and 6-pitch combinations rarely occur outside rare subgenres of contemporary music.
Next we will evaluate the goodness of individual predictors within the four categories of predictors using empirical data on C/D.
Experiment 2: Features of C/D
In the following analyses we will dissect C/D using four sets of features, namely roughness, harmonicity, familiarity, and spectral envelope. As a starting point, we will rely on the best three predictors (
Methods
We construct models with the data from Experiments 1 and 2 by Lahdelma and Eerola (2020) and by Popescu et al. (2019). The materials in Experiment 1 by Lahdelma and Eerola (2020) consist of 25 intervals, trichords, and tetrachords initially selected from Bowling et al.’s study (2018) and represent low cultural familiarity. The chords and intervals were presented to participants with piano and sine wave timbre. The materials of Experiment 2 by Lahdelma and Eerola (2020) are a balanced selection of 72 chords again selected from Bowling et al. (2018) representing high, medium, and low familiarity chords, all of which were presented with piano sounds. Popescu et al. (2019) provides rating data for 80 chords taken from real musical examples representing four distinct styles of music (jazz, classical, avant-garde, random) presented with piano sound. For all of these datasets (hereafter
Data Analysis
We use linear mixed models (LMMs) to identify which acoustic or musical predictors are most consistent with the perceptual ratings of consonance. Analyzing
In our analysis, we will start with the
Results
First we assessed the previously established features of consonance (roughness, harmonicity, familiarity) with the data. This
For the model improvements within the four predictor categories, we replaced the predictor of one category of the original model with each variant predictor of the same category. For instance, for roughness, we tested whether replacing
LMM results for the original model by Harrison and Pearce (

†refers to the predictor taken forward to the model dubbed
Summary of the LMM results for predicting consonance ratings with different models across three datasets. The unstandardized beta coefficients are shown and the random effect significance testing is displayed with Likelihood Ratio Test (LRT). The two measures of overall fit refer to variance related to fixed factors (

Looking at the breakdown of the variant predictors in Table 1, roughness variants indicate that none of the variant formulations of roughness increase the
The overall performance of the
Discussion
An analysis of three datasets using LMMs was utilized to probe the merits of several alternative predictors to the composite model offered by Harrison and Pearce (2020). This model (
Adding a predictor of the regularity of the energy in the partials of the sounds (
Next we will probe the contribution of the predictor categories across a larger selection of datasets to investigate the shortcomings and advantages of the models.
Experiment 3: Assessing C/D Features with Multiple Datasets
To explore the contribution of the acoustic predictors to C/D thoroughly, we compiled nine relatively recent datasets that contain consonance ratings (or one of its variant proxy terms, e.g., pleasantness) of intervals and chords. Our purpose is to apply the two variant models (
Datasets
The oldest dataset is from Schwartz et al. (2003), who compiled historic rankings of consonance of all intervals within an octave. Johnson-Laird et al. (2012) organized two experiments where they collected pleasantness (consonance) ratings for trichords and tetrachords organized according to their theory of dual-process theory of dissonance. Lahdelma and Eerola (2016) collected ratings of consonance for a small set (15) of trichords, tetrachords, pentachords, and hexachords. Likewise, Arthurs et al. (2018) carried out an experiment with a collection of trichords and tetrachords (n = 12) which were presented in two timbres and rated in terms of consonance, pleasantness, stability, and relaxation. Bowling et al. (2018) established the consonance (pleasantness) ratings for all 2-, 3-, and 4-pitch combinations within an octave (n = 298). Popescu et al. (2019) expanded the choice of chords by deriving them from real music spanning four styles (jazz, classical, avant-garde, random); the chords spanned a wide range in pitches and each style had 20 exemplars (n = 80 in total). Finally, Lahdelma and Eerola (2020) collected two substantial datasets of ratings of variant concepts of consonance for chords that were selected from the extensive collection established by Bowling et al. In most experiments, participants were Western, young, and educated, also the subject pools in many of these studies are relatively small; we have summarized the studies in Table 3. To make the datasets comparable, we have made sure that the ratings are in the same direction (high ratings indicate high consonance), reversing some of the scales (Johnson-Laird et al., 2012; Schwartz et al., 2003). We also have rescaled the ratings within the datasets to a range between 1 and 10 for consistency and comparability.
Description of the datasets including concepts, number of unique chords/intervals (N), numerosity, and pitch range in the stimuli.

Data Analysis
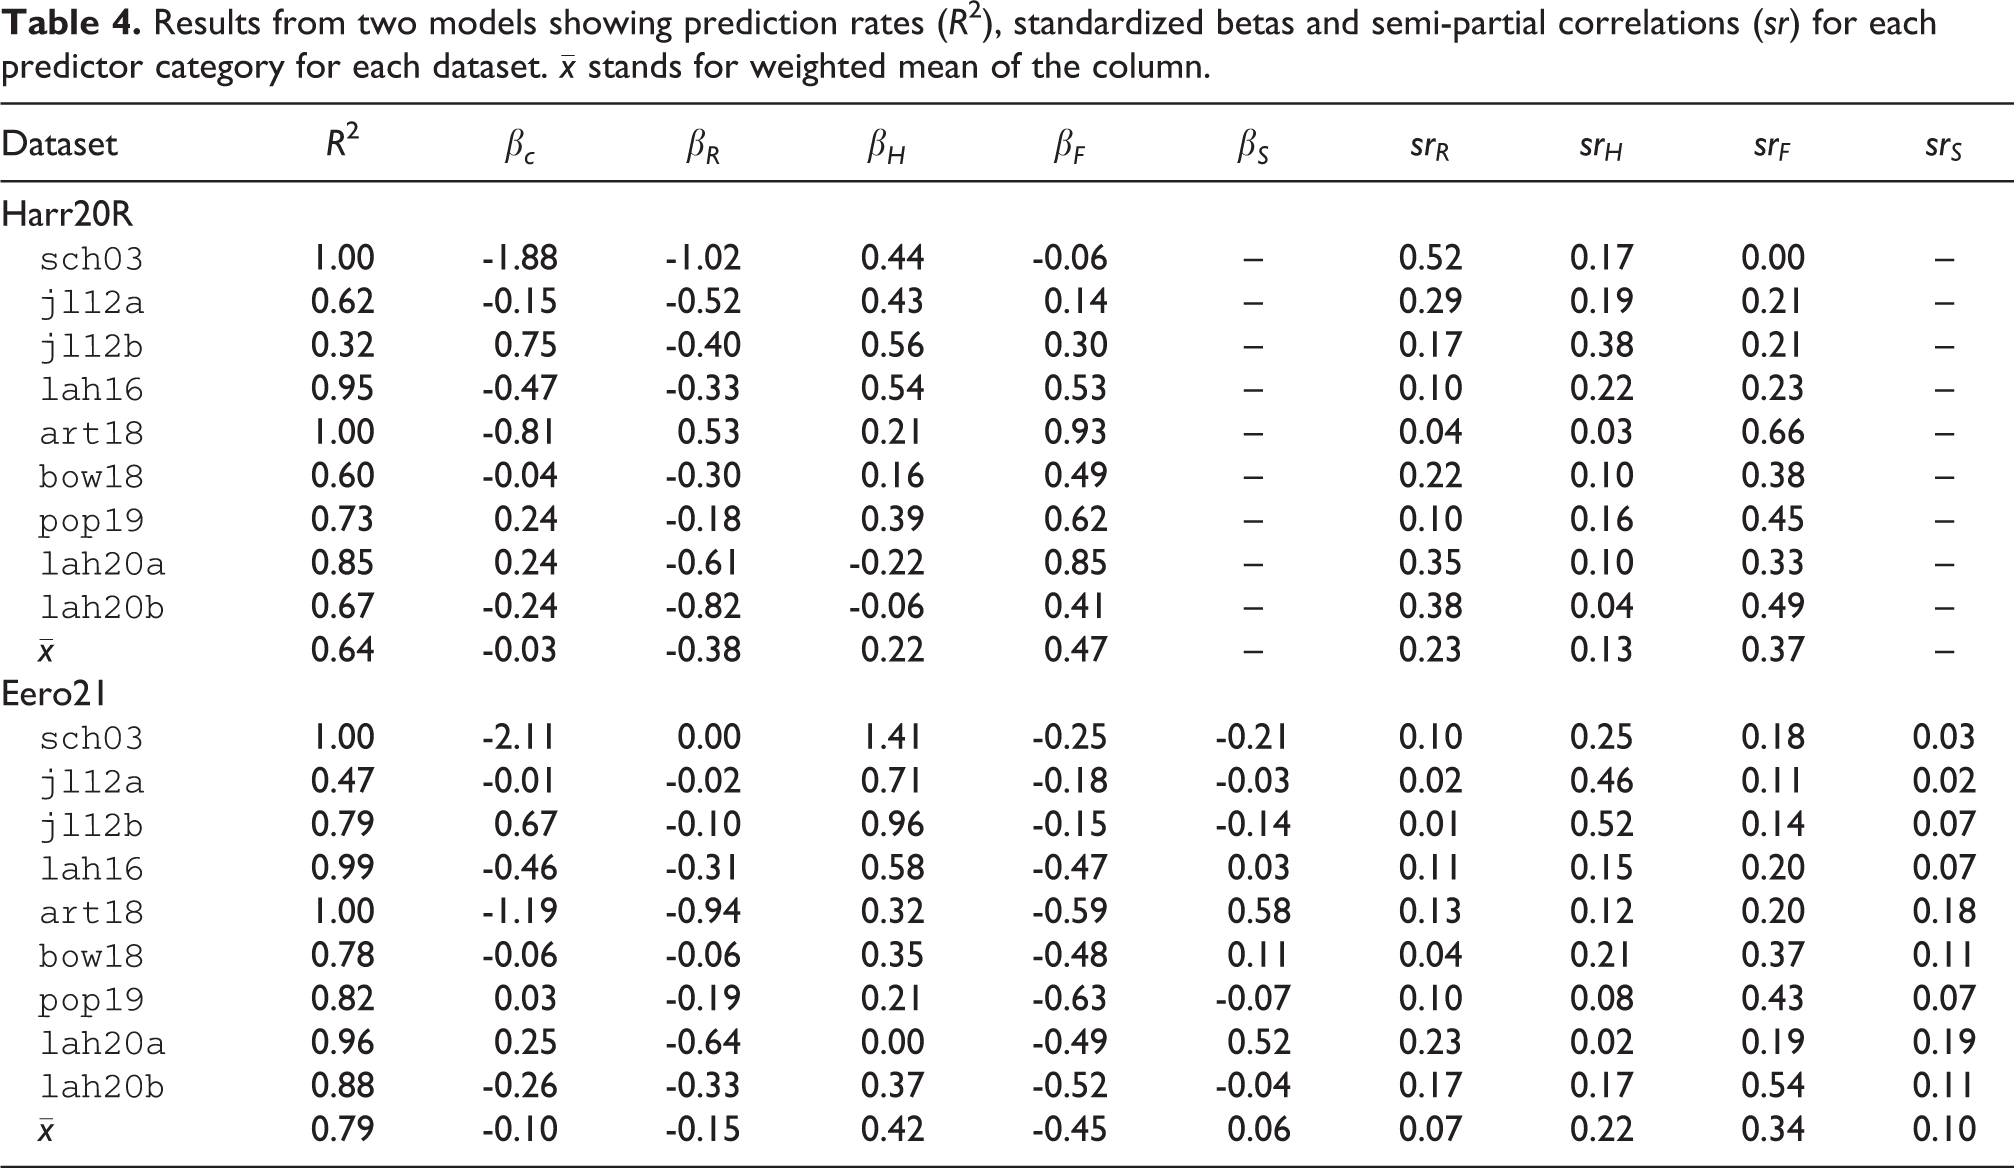
We will carry out two linear regression analyses—unpooled and pooled—to probe the model performance within (unpooled) and across (pooled) the datasets. In the unpooled analysis, we explore the generalizability of the models by training each model within a dataset utilizing a cross-validation and applying the constructed model to a testing portion of the dataset. The performance of the model is indexed with prediction rate (R 2) in the unseen data (training portion). This diagnostic operation aims to outline the differences in the datasets and the ways in which the models pick these up. In the pooled analysis, however, we aggregate all observations across the datasets and assess the model fit using regression across the data. In the construction of the models, we utilize a cross-validation scheme and predict the responses in the unseen part of the data. For the unpooled analyses, we utilize a 80/20% random split between training and prediction subsets and construct the model using a 10-fold cross-validation with 10 repeats. For pooled analysis, we have a similar split between training and testing data, but we increase the random repeats of the 10-fold cross-validation to 50. Again, the overall success of the model is captured with R 2 in the unseen portion of the data. To index the unique contribution of each predictor category within the models, we report semi-partial correlations (sr) between the predictor and C/D ratings when the contribution of all other predictors in the model have been partialled out. In contrast to the analyses in the previous section, we operate with mean data and relatively low number of observations for each dataset (see Table 4).
Results from two models showing prediction rates (R
2), standardized betas and semi-partial correlations (
In addition, we carried out an auxiliary analysis where we identify the principal components of the predictor matrix and use either the component scores or the predictors that best represent the components as predictors in the regression. The purpose of this analysis is to offer a reliable assessment of the predictor contributions to C/D, as several of the feature categories are known to be highly collinear and hinder the interpretation of the model components.
Results
Unpooled Analysis Results
The results of the linear regression where both models have been trained and assessed on each dataset separately are shown in Table 4 with model fits, standardized beta coefficients, semi-partial correlations, and weighted means.
Table 4 indicates that both models are able to produce adequate (R
2 = 0.32 for
The semi-partial correlations spell different stories between the two models. In the
Pooled Analysis Results
Turning our attention to how well the models operate across the datasets, we ran separate linear regressions for the
Model summaries across the pooled data showing unstandardized beta coefficients, semi-partial correlations, and Akaike Information Criterion (AIC) for model parsimony.

The baseline comparison is to the composite model (
Pooled Analysis with Principal Components
A close look at the models, and particularly the unique contributions of the feature categories, suggests that roughness and harmonicity may be highly collinear and this would hamper the interpretation of the component contributions. In the
Loadings of the predictors from the principal component analysis (n = 617). Loadings under 0.55 are not shown.
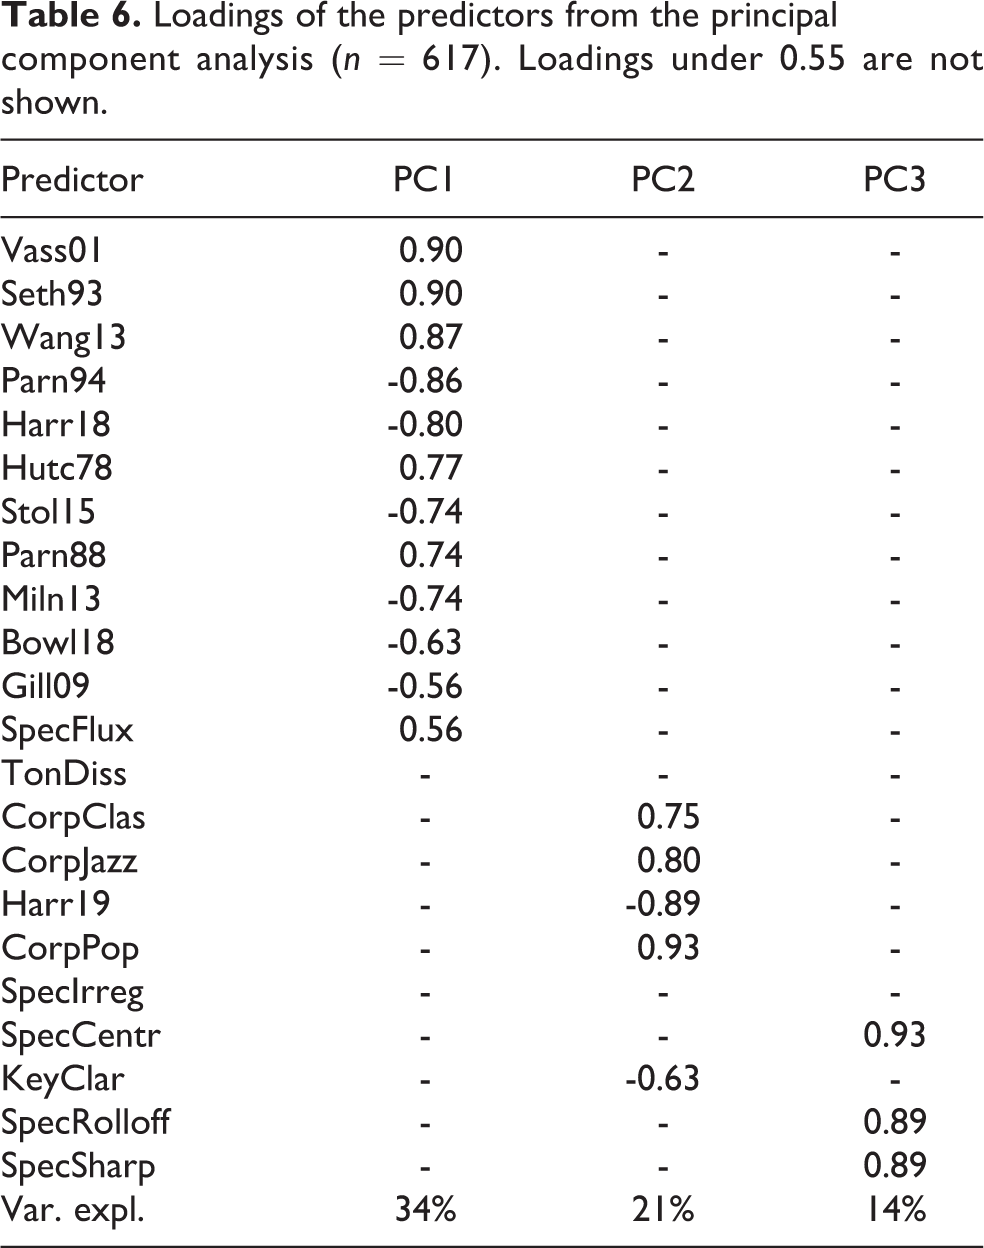
We used the scores of the three principal components as predictors in regression to predict C/D ratings in the pooled dataset using the same evaluation routine as with the other models (cross-validation and assessment of model prediction rate with the unseen data). This yields a model, labeled as PCA components, reported in Table 7, which puts the prediction rate at R
2 = 0.67. It is better than the
Results from two models related to principal component analysis showing prediction rates (R
2), standardized

Going back to the most successful model, a visualization of the model prediction of the C/D ratings is shown in Figure 3, where the

Model predictions and C/D ratings for unique Forte chords within each dataset. The red markers and lines indicate the model (
Discussion
The two regression analyses demonstrated a consistent pattern where the model proposed by Harrison and Pearce (2020) explains about 64% and 62% of the variance in C/D ratings in unpooled and pooled data, respectively, whereas the revised model with new predictors is able to account for about 10% more variance. Although the
A recent experiment by Lahdelma and Eerola (2020) also found roughness to be a more important predictor of C/D than harmonicity, corroborating the results of Harrison and Pearce (2020), but also found that cultural familiarity has a strong contribution to C/D ratings. Also, somewhat surprisingly, replacing the harmonicity predictor by Harrison and Pearce with another harmonicity model (i.e., Stolzenburg’s model) had a large impact on the model and decreased the unique contribution of roughness in particular. This has an important implication here; a fairly small change in the actual predictors can have a knock-on effect on how the overall model operates, which in this case seemed to relate to an increased collinearity between roughness and harmonicity.
The additional analysis of the predictor matrix with the principal components addressed the problematically high collinearity between predictors representing roughness and harmonicity. Although the ensuing models with principal components or predictors best capturing the components scores did not improve the model beyond the level already offered with the
We revised and improved the familiarity measure by simplifying the classification of the chords. We believe that the elimination of chord inversions made the frequency distribution of the chords in the corpus more consistent and closer to the perceptual assessment of the chords. It remains to be seen whether a better corpus could be established, and even better if the unit of analysis in the tabulation of chords corresponds to the way listeners recognize the familiarity of the chords and intervals. It would be beneficial for future endeavors in modeling C/D if familiarity could also rely on acoustic properties, as it would eliminate any need for symbolic representation in the models and would allow for a greater range of tunings, timbres, and musical conventions to be readily applied to the model.
We brought the spectral envelope as a new element to C/D and it turned out to be a significant, albeit small, addition to the model. However, we think that spectral envelope might play a more pronounced role once the stimulus materials in future empirical work span a wider range of registers and different timbres. This assumption is based on previous literature where, for instance, sharpness has been implicated as an important factor contributing to consonance/dissonance perception in addition to roughness and tonalness, that is, periodicity/harmonicity (see Zwicker & Fastl, 1990, p. 313). Moreover, Lahdelma and Eerola (2016) have empirically demonstrated that chords played in a higher register tend to be perceived as more dissonant than chords in a lower register. In their study, this observation was explained indeed with the effect of sharpness: the higher-register chords were lower in roughness but higher in sharpness compared to the lower-register chords, where the ratio between these two acoustic factors was the opposite.
Conclusions
The musical and acoustical aspects of C/D have not yet been fully accounted for. Despite the impressive and systematic work by Harrison and Pearce (2020), the present study is able to offer novel elements to this question and also to expose some shortcomings in the state-of-the-art C/D research. We do this using an unprecedented amount of data that consists of three individual-level datasets and nine datasets with mean ratings encompassing 600
In all of these datasets, the central problem for modeling C/D is the high collinearity between the predictors, mainly between roughness and harmonicity. When roughness was represented with the model by Hutchinson and Knopoff (1978) and harmonicity with Stolzenburg’s model (2015), the correlations between these two variables was -0.65, -0.83, and -0.81 in Experiments 1, 2, and 3. The attempt to untangle their unique contribution to C/D ratings with partial and semi-partial correlations in Experiments 2 and 3 needs to keep in mind the caveat relating to the collinearity between the variables, which renders the interpretation of the unique contributions of the predictors rather volatile. In this study, the decision was to take the feature categories as given and analyze the feature category membership with hierarchical cluster analysis in Experiment 1, which preserved the separation of roughness and harmonicity mainly because the predictors in these two categories have the opposite signs in the correlations. In Experiment 2, any predictor that improved the prediction rate within the feature category was taken as a better alternative predictor of that feature category. In Experiment 3, an alternative feature reduction was carried out, which first identified three independent principal components that captured 69% in the covariance of the original 22 predictors. When these three components were used in linear regression, they explained 66% of the variance in C/D ratings. Most importantly, the component contributions in the regression analysis suggested that the component that captures familiarity accounts for 46.2% (sr = 0.68) of the variance, whereas roughness/harmonicity represented by a single component accounted for 19.4% of the variance (sr = -0.44). The results of this alternative analysis offer an interesting simplification of the feature categories that allows to keep the categories unassociated from each other. However, the model based on the principal component analysis is not too elegant, simple, nor is it the best model in this data, but it points to a possible way to eliminate redundant categories of C/D features in future analyses. Further research might identify other ways to segment C/D into meaningful elements.
While it is early to decisively conclude the exact anatomy of C/D, the current investigation has offered new perspectives to the topic. If future research wishes to pursue the independent feature categories, we may have come full circle in identifying the anatomy of C/D; as Johnson-Laird et al. (2012) point out, von Helmholtz drew the conclusion that the perception of C/D is dependent both on a psychoacoustic and on a cultural factor. Also, excluding spectral envelope from future models of C/D might be ill-advised, and there is still a host of additional factors to be explored, including loudness, which might influence dissonance ratings (see Kameoka & Kuriyagawa, 1969; Mashinter, 2006). We hope that the present findings inspire the field to investigate the topic with a more versatile set of stimuli (e.g., multiple registers, dynamics, timbres) and to continue to use open datasets and libraries to further tease apart the roles of acoustic and cultural predictors in the fascinating question of consonance and dissonance.
Footnotes
Author contribution
TE and IL conceived the study, TE compiled the datasets and extracted the model predictions, and carried out the analyses, and wrote the first draft of the manuscript. IL contributed to the writing of the manuscript, collapsed the chord inversions and encoded the revised chord corpus with Forte numbers, and created the Durham Chord Dataset piano stimuli.
Declaration of conflicting interests
The author(s) declared no potential conflicts of interest with respect to the research, authorship, and/or publication of this article.
Funding
The author(s) received no financial support for the research, authorship, and/or publication of this article.
Action editor
David Meredith, Aalborg University, Department of Architecture, Design and Media Technology.
Peer review
Peter Harrison, Max Planck Institute for Empirical Aesthetics.
Andrew Milne, Western Sydney University, MARCS Institute for Brain, Behaviour and Development.