
Abstract
Visual associations with auditory stimuli have been the subject of numerous studies. Colour, shape, size, and several other parameters have been linked to musical elements like timbre and pitch. In this article, we aim to examine the relationship between harmonisations with varying degrees of dissonance and visual roughness. Based on past research in which high sensory dissonance was associated with angular shapes, we argued that nontonal and highly dissonant harmonisations will be associated with angular and rough images, while more consonant stimuli will be associated with the images of low visual roughness. A fixed melody was harmonised in 7 different styles, including highly tonal, nontonal, and random variations. Through a listening task, musically trained participants rated the stimuli in terms of enjoyment, familiarity, and matched them to images of variable roughness. The overall consonance of the stimuli was calculated using two distinct models (Harrison & Pearce, 2020; Wang et al., 2013) and a variant of the aggregate dyadic consonance index ( Huron, 1994). Our results demonstrate that dissonance, as calculated by all models, was highly correlated with visual roughness, and enjoyment and familiarity followed expected patterns compared to tonal and nontonal stimuli. In addition to sensory dissonance, however, it appears that other factors, such as the typicality of chord progressions and the sense of tonality may also influence this cross-modal interaction.
Introduction
Visualisation of music in two- and three-dimensional space has been one of the issues usually found at the forefront of interest in cross-domain studies. As the outcome of a blend of different conceptual domains (namely sound, linguistic metaphors, and visual imagery), it has received a lot of attention because of its approachability and application in everyday life. Having at its basis, the possibility to deconstruct music to its elements and by understanding these building components—both in terms of their intra-musical (i.e., pitch height, tempo, loudness, harmonization, timbre, acoustic roughness) and extra-musical parameters (i.e., performance setting, genre, performers’ age, gender)—it is possible to determine how listeners may relate these parameters to other domains. Correspondences between music attributes and other fields, such as imagery (Tsougras & Stefanou, 2015), tactile feeling (Ludwig & Simner, 2013) places, or organized human behaviour (Monelle, 2006), and among many others, literature, often with a broad historical and cultural range (Zbikowski, 2002), are indicative on how cross-modal correspondences in music are able to relate to analogy and metaphor (Zbikowski, 2017).
As reported by Spence (2011), interest in research was usually directed on how spatial placement and temporality contributed to multisensory cognition. Nevertheless, sensory features may offer grounds for a wide variety of cross-modal correspondences, especially considering the framework of semantic congruence. Employing Spence’s (2011) categorisation, this issue touches upon the following aspects: i) structural (harmonic consonance and dissonance and its subsequent perception which may be affected by innate parameters, as discussed below), ii) statistical (by learned responses based on experience and interaction with the environment, such as the association of mode with specific basic emotions) as well as iii) semantic (by learned linguistic associative descriptors used commonly across two perceptual domains – for example, roughness, a descriptor of surface smoothness, is used to describe the sound). On this basis, we shall be exploring the relationship between harmonisations of a single melody to visual cues varying in surface roughness, essentially evaluating the cross-modal correspondence of the domain of consonance/dissonance represented by variations in harmonisation, and visual roughness by 2d/3d images varying in surface smoothness.
Perception of Harmonic Consonance/Dissonance
Dissonance is often distinguished in two categories (Popescu et al., 2019): sensory dissonance, which is associated with auditory phenomena such as the interference of partials in simultaneous tones or harmonicity which is the property of a sonority's overall frequency spectrum to resemble a single complex tone (Oxenham, 2013); and culturally related dissonance, where preference and pleasantness depend on external factors like style (Popescu et al., 2019), familiarity (Athanasopoulos et al., 2021), musical expertise (Lahdelma & Eerola, 2016a, 2016b, 2020), and possibly even enculturation, in that preference to consonance may be culturally dependent (McDermott et al., 2016; also see Bowling & Purves, 2015). There is evidence to suggest that the preference of consonant sonorities over dissonant ones may even be biological (Trainor et al., 2002; Zentner & Kagan, 1996) and independent of exposure (Masataka, 2006), though this viewpoint has been challenged (Plantinga & Trehub, 2014).
Extensive research of harmonic dissonance in simultaneous tones examines the principles of their perception (Deutsch, 2013; Samplanski, 2005; Thompson, 2013), chord dissonance (Harrison & Pearce, 2020; Johnson-Laird, Kang & Leong, 2012; Lahdelma & Eerola, 2016b; Lahdelma et al., 2020), characteristics of nontonal sonorities (Kuusi, 2005, 2010), or preference and emotional charge in simultaneities (Kuusi, 2009; Lahdelma & Eerola, 2015; Lahdelma & Eerola, 2016a). Although there have been a number of studies on the cross-cultural perception of consonance and dissonance in the past (Butler & Daston, 1968; Maher, 1976) and more recently (Athanasopoulos et al., 2021; Lahdelma & Eerola, 2020; McDermott et al., 2016; Prete et al., 2020), there has been little agreement between them in terms of findings, while in terms of methodological design, each research team adopts a novel approach, making comparisons between the results a rather difficult task.
Numerous studies attempted to quantify the degree of consonance/dissonance (henceforth C/D) in isolated simultaneities. Huron (1994) proposed the aggregate dyadic consonance index, an elegant metric which makes use of the interval vector of a pitch class set. All six interval classes are assigned a rating based on measurements from Hutchinson & Knopoff (1979), Kameoka & Kuriyagawa (1969a), and Malmberg (1918), and then they are multiplied with the interval vector of the pitch class set under consideration. Harrison and Pearce (2020) compiled a list with all existing methods to calculate the C/D of simultaneities, accompanied by the incon package using the programming language R (R Core Team, 2017), which contains the computational tools to evaluate all the models they review. Additionally, they proposed a composite model of consonance perception that incorporates interference of partials, periodicity/harmonicity, cultural familiarity, and number of notes via a linear regression model.
Beyond the perception of isolated chords, harmonic context and chord sequences have been also investigated. The horizontal relationships of successive harmonic events have been remarked as a relevant area of study, since it contributes to the perception of harmonic C/D besides the vertical relationships between concurrent pitches (Lahdelma & Eerola, 2020; Parncutt & Hair, 2011). Johnson-Laird and colleagues (2012) approached the issue by addressing the dual-process theory for dissonance. Initially, they highlighted the importance of roughness in sensory dissonance and how implicit knowledge of tonal music and its rules influences the cognitive processes to assess dissonance as ‘tonal’. In addition to that, there are three principles of tonality, which further affect dissonance perception in chord sequences. These principles are summarised as follows:
Chords that are more frequently encountered in diatonic scales (major and minor) are to be perceived as more ‘tonally’ consonant, as opposed to those that cannot be formed in such scales. The major triad has a high degree of harmonicity, thanks to its correspondence to the harmonic series. Therefore, chords that are consistent with or contain this chord and its inversions are to be regarded as more consonant. Chords that are built according to the stack-of-thirds principle (directly or indirectly) should be more consonant than those not built in thirds.
This theory has been utilised to explain a phenomenon in which participants rated chord sequences in the following order of consonance: tonal chords in tonal context, tonal chords in random context, nontonal chords in tonal context, and finally, nontonal chords in random context.
Additionally, Bigand et al. (1996) examined the tension of all major and minor triads, as well as the 7th chords using all 12 pitch classes. They noticed that tension increased not only with the sensory dissonance of a chord type (i.e., seventh chords are tenser than standard triads), but that it was also affected by tonal hierarchies. In other words, chords on diatonic degrees of a major/minor key are perceived as less tense than those on nondiatonic, with triads on subdominant, dominant, and tonic degrees in that order, creating the least tension to musicians. Such findings are congruent to theories proposed by Krumhansl and Kessler (1982) and Lerdahl (1988). Other parameters contributing to perceived tension are the lack of common pitches and nonsmooth voice leading between the chords involved in the progression, especially to nonmusicians (Bigand et al., 1996).
Apart from how tonal hierarchies influence tension, Tymoczko (2011) argued that tonality can be organised under five main features. These features included smooth voice leading, the presence of consonant chords, the use of similar chord types, the adoption of a limited pitch collection within a moderate span of musical time, and the existence of some type of tone centricity. Tymoczko hypothesised that disrupting one of these elements can diminish the overall feeling of tonality, proposing a series of informal experiments to prove that they are detrimental to constructing a tonal music excerpt. Therefore, it could be argued that harmonisations with elements that suggest a strong presence/lack of tonality may be potentially perceived differently in an experimental setting, as a separate and/or additional parameter to the perceptual consonance/dissonance of a certain melodic harmonisation.
Considering the semantics of consonance/dissonance, many linguistic metaphors have been used to express them as well, such as smoothness, purity, harmoniousness, tension, pleasantness, or preference. Recently, Lahdelma and Eerola (2020) have evaluated those in relation to the stimuli's sensory dissonance, the number of pitches in a simultaneity, referred to as numerosity and timbre, and in groups of varying musical expertise. They concluded that tension was the most preferable synonym for analysing the perception of C/D in either group of expertise, while pleasantness is useful for testing in nonmusicians and harmoniousness for studies of timbre. Further discussion on linguistic metaphors in relation to auditory and visual modes in nonsemantic manner is presented in the next section.
Connections of Auditory and Visual Modalities
Cross-domain studies have looked upon the relationships between several modalities. Evans and Treisman (2010) examined how the brain may connect data from various sensory modalities to upgrade the speed and precision in identifying events from the surrounding environment, assisting the decision process, and guiding congruent reactions to external stimuli.
Examples of associations between musical and visual components are numerous in the field. Previous work indicates that physical size is frequently linked to core musical parameters such as pitch. Dolscheid et al. (2014) research pointed to this association, showing how small resonating bodies are perceived to produce high-pitched sounds, while larger bodies are perceived to emit lower-pitched sounds. Walker (1987) noted congruency between modulations in pitch and terms such as “small, bright, sharp, fast, active” among Inuit, Haida, Shuswap, Tsimsian Indians, and Canadian (western) participants. There have also been cases of iconic representation of music, among nonliterate participants recruited in Papua New Guinea: when exposed to musical stimuli, they visually represented physical sounds as the musical instruments which they believed created them (Athanasopoulos et al., 2016; Athanasopoulos & Moran, 2013).
Nonsemantic cross-modal association between auditory sounds and visual information is demonstrated by the bouba-kiki/takete-baluba effect. The bouba-kiki effect refers to the inclination of individuals to coordinate certain phonetic sounds with specific shapes, when the sounds convey no particular semantic significance and the shapes are novel: For instance, a bended, curved shape is more frequently coordinated with a soft-sounding word structure like “bouba,” and a rakish shape with a sharp-sounding word structure like “kiki.” The effect is present across age groups as it is also found in children younger than three years of age, so it does not depend upon grown-up levels of phonetic capability (see Maurer et al., 2006). A certain degree of universality has also been observed regarding the effect across monolingual users of distinctive languages, proposing that the bouba-kiki categorisation is not restricted to any specific population, as people from diverse cultural backgrounds consistently match shapes and sounds in a similar fashion to western participants (Bremner et al., 2013; but also see Chen et al., 2016). The bouba-kiki effect may also be influenced by the literacy level and style of the participants (Cuskley et al., 2017).
Research indicates that both linguistic and nonlinguistic associations between music and images are feasible and can be readily blended as conceptual metaphors of space, path, velocity, size, and force, among others (see Antovic, 2009). A significant number of these associations have revealed visual schematic similarities. Particularly with regards to pitch variation, participants (children) have been shown to provide congruent responses by matching sonic stimuli to visual counterparts following specific organisational strategies, such as linking pitch variation with visual modulation uniformly and with little variation. In this context, questions arise as to whether such visualizations stem from initiated linguistic/phonetic portrayals of metaphors and sound, or whether children genuinely experience music and then proceed to visualise it. Further to this, Antovic (2011) has shown how the association between a musical concept and a(ny) counterpart from another domain, comes from blending the perceived physical properties of the stimulus (increase-decrease in loudness and pitch) to a target experiential domain. It has been observed that musical training enhances consistency in responses to association tasks between music and visual components in particular, as it advances listening from a nonconceptual to a conceptual level (Athanasopoulos & Antovic, 2018; DeBellis, 1995; Küssner & Leech-Wilkinson, 2014).
Within the boundaries of cross-modal perception and particular interest for this article, studies have also examined the relationship between auditory roughness and angular shapes. Sensory dissonance's ability to trigger perceptual linkages with objects of varying texture, shape, and hardness, has been studied by Liew et al. (2017). Participants were exposed to both natural and artificial single notes from acoustic instruments with varying degrees of auditory roughness and proceeded to rate them on the aforementioned cross-modal dimensions. Listeners tended to group more dissonant sounds to spikier and rougher objects and vice versa, thus suggesting a (likely unconscious) connection between auditory roughness and dissonance with visual cues.
Similarly, another research project examined how the presence of noise in music invokes cross-modal mappings to spiky three-dimensional shapes. Liew et al. (2018) have conducted two sets of experiments, one embedded in a live audio-visual performance (based on Liew et al., 2017 experiment) and one performed in a lab environment. In the first, the audience collectively designed spiker objects for music segments of high auditory roughness and curvier for those with low or no auditory roughness. The results from the second experiment showed significant correspondence with the first experiment, thus, suggesting a shared sensory structure of those stimuli or the existence of a connection between the two through shared affective outcome. Acknowledging the association of stimuli with high auditory roughness to angular shapes, we shall extend auditory roughness via harmonic dissonance to varying degrees. In this present study, we will explore the relationship of harmonisations in distinct styles to visual stimuli of varying roughness.
Goal and Hypotheses
We aim to demonstrate an association between the perception of harmonic roughness, as represented through the harmonisation of a set melody in different styles and the surface roughness of two/three-dimensional images. Should there be a consistent pattern of organisation in the participants’ responses, it may be possible to further support the claim that there is a clear organizational model of human perception which facilitates the conceptual blend of visual music imagery (Godøy & Leman, 2010; Gritten & King, 2006; Keil & Batterman, 1984; Malloch & Trevarthen, 2018). The visualisation of specific, core elements of musical stimuli may provide an alternative method of associating music with another nonlinguistic domain in a more comprehensible manner and it may empower researchers to see broader designs or even patterns in human perception, that may have otherwise gone unnoticed without visualisation.
Therefore, the objective of this study is to deploy a music visualisation task, where sonic stimuli with a stable melody varying in harmonisation styles are matched with images varying in perceptible roughness. The sonic stimuli are further assessed in terms of their familiarity and enjoyment. Based on the literature reviewed above from both music psychology and conceptual blending, our hypotheses regarding the participants’ responses are the following:
A sonic stimulus (where loudness, timbre, and tempo remain constant) with high/low dissonance will be matched with an image of high/low perceptual roughness. Modifications in the harmonic context of the melody (e.g., melodies harmonised using tonal, jazz, quartal chords, and others) will result in variations in perceived harmonic dissonance and be further linked with congruent images varying in perceptual roughness. Harmonisations with elements that suggest a strong presence of tonality will be associated with pictures of low perceptual roughness, whereas the lack of tonality in harmonisations will be linked with high perceptual roughness. Familiarity of the stimulus may vary, based on the participants’ musical training, and preference is expected to mirror familiarity in this regard. The level of complexity of the harmonisation will be analogous to the complexity of the matched image.
Method
Music Stimuli
A melody was created which did not include the 3rd, 6th, or 7th degree, so as to avoid any harmonic implications of a major or minor mode. Our purpose was to place particular focus on the harmonisations; as such, we opted for a melodic structural pattern which could be harmonised fairly easily and in different harmonic styles. This melody was harmonised in 7 different harmonic styles by the first author:
tonal in a major key in Bach chorale style, tonal in a minor key in Bach chorale style, jazz harmony in a major mode, quartal harmony using quartal chords, mostly tetrachords, octatonic style taking harmonic material from the two octatonic scales, wholetone harmony using augmented triads and subsets of the wholetone scale, a randomly generated harmonisation.
Regarding the first two harmonisation styles, they were diatonic in nature with tonal triads including a few seventh chords. The jazz harmonisation consisted mostly of tetrachords with major or minor 7ths and some higher extensions. The progressions were of two types: either ii-V-I or vi-ii-V-I, also, incorporating inversions. The quartal harmonisation was a diatonic harmonisation using as a basis quartal chords in various voicings, either using stacked 4ths or a combination of 7ths and 5ths. For the octatonic harmonisation, the material used was chords like minor triads with major 7th(e.g., F-Ab-C-E), major triads with split 5th (e.g., Eb-G-Bb-B), and others, following Olivier Messiaen's treatise on his personal style (Messiaen, 1956/1944). Since the notes of the diatonic melody are not found in a single octatonic scale, harmonic material was taken from the variations OCT(0,1) and OCT(2,1). Similarly, regarding the wholetone harmonisation, the chords were chosen from both wholetone scales (WT-0 and WT-1) because the melody is mostly diatonic. The harmonisation comprised of augmented triads and other simultaneities based on major 2nds and tritones, such as C-D-G#, D-E-A#, C#-F-A, or F-G-A-C#, and others. Lastly, the random harmonisation consisted of four voices; each pitch of the melody was harmonised with three randomly selected pitches from the 12 pitch classes and the pitches were arranged from the lower to higher voices.
All harmonisations were created in a way that the chord progressions maintained smooth voice leading, as defined by Straus (2003) and Tymoczko (2011). Additionally, a limited number of different chord types was used (M = 5.5, SD = 1.23), except in the random harmonisation. Finally, the major, minor, and jazz harmonisations had a clear tonal centre; although the melody itself was strongly suggesting the tonal centre of C chords and chord progressions in the quartal, octatonic, wholetone, and random harmonisations partially disrupted the implied tone centre and introduced tonal ambiguity. A significant effort was made to stay ‘true’ to each harmonisation style during the development stage, and the results were carefully assessed by an independent academic expert on Music Analysis and Style Studies. Many variables were fixed so that the factor of harmony is isolated and distinct from the melody. Additionally, a smooth voice leading within the harmonisations themselves was applied, and the number of unique chords and chord types selected was moderate, considering Tymoczko’s (2011) claims that the use of similar chords/chord types and smooth voice leading are essential to tonality; further to this, the selection and follow-up decision in using some salient notes to strengthen the perception of a tonal centre within each stimulus is also a relevant matter. Nevertheless, we acknowledge that the harmonisations that we have produced are indicative of an endless number of possibilities available (e.g., neo-Riemannian) and any results should be considered in light of these specific examples.
The audio rendering of all stimuli was generated using the “Steinway Piano” plug-in from Garritan Instruments in Finale v25.5, ensuring that timbre, dynamics, and duration (22 s) remained constant. All examples were set in the same tempo (90 bpm), and all harmonisations followed the same harmonic rhythm. The files were exported in mp3 format (44.1 kHz), in order to fit better in the online survey. All stimuli may be found in the Open Science Framework: https://osf.io/3vc8p/?view_only=16377de688444e4dbb2ae02e9666d864
Evaluation of Consonance/Dissonance
In order to explore the association between the roughness levels of the harmonisations with the visual stimuli more thoroughly, it was considered necessary to obtain quantitatively measured levels of their C/D. To calculate the overall C/D degree of the harmonisations, we employed a series of dissonance models.
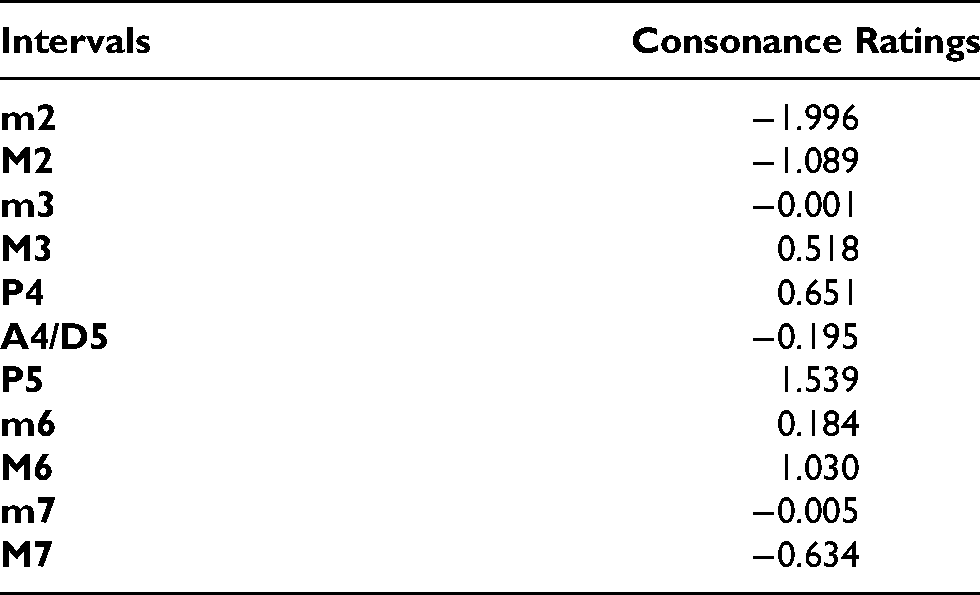
The first model was used to calculate dissonance utilising the overall content of harmonic intervals in the harmonisations, and it was based on Huron’s (1994) simple model for pitch class sets. Here, a similar methodology was followed, but instead of using 6 interval classes, all 11 (except the unison/octave) were employed. In particular, the measurements from Hutchinson & Knopoff (1979), Kameoka & Kuriyagawa (1969a), and Malmberg (1918) were standardized; i.e., the values were transformed to have a mean value of 0 and a standard deviation of 1. Note that the two latter studies examined dissonance, therefore, the values were reversed. Then, all three ratings per interval were averaged producing the numbers shown in Table 1. It is useful to mention that these data were acquired from empirical studies on Western listeners, therefore, a portion of cultural bias is possibly involved.
The consonance ratings per interval of the octave produced from merging the results from Hutchinson & Knopoff (1979), Kameoka & Kuriyagawa (1969a), and Malmberg (1918) (see Huron, 1994).
For the current study, the distribution of the 11 harmonic intervals was calculated for each musical excerpt. Each example had a different total number of harmonic intervals, because of the different cardinality of the used chords per harmonisation. For that reason, each interval frequency in the distribution was divided by the total amount of vertical intervals, again for each example. Then, the dot product between these interval profiles and the new vector of interval ratings was computed. The final values are presented in Table 2.
The C/D indices for each harmonisation in each of the three models used.

The second model focuses on the sensory perspective of dissonance (Wang et al., 2013). It was originally designed for calculating noise in the interior of a vehicle; however, it has also been evaluated as a model to calculate roughness (Harrison & Pearce, 2020). In the current study, the whole harmonisations acted as unique sound inputs to produce a single index of roughness. A gate pass filter was inserted so that frequencies below 100 Hz and above 3000 Hz were eliminated, focusing on the range at which all harmonisations are located.
The last model is accounting for both the sensory and the cultural dimension of C/D. After reviewing an all-encompassing list of existing psychological explanations and computational models for simultaneities, Harrison and Pearce (2020) proposed their own model that combines linearly the number of distinct pitch classes in a chord, interference, periodicity/harmonicity, and the chord's degree of cultural familiarity. This model produced a consonance index for each chord, and then, all values were averaged for every unique harmonisation (Figure 1).

Three C/D models employed for calculating the degree of consonance of the seven melodic harmonisations. Values are normalised in the range 0–1 (0: least consonant, 1: most consonant).
Although these three models follow similar trends, there are small differences per harmonisation. According to the Wang model, the jazz chord sequence is considered slightly more consonant than minor. This model addresses parameters contributing to dissonance, such as the beating of partials. Therefore, the presence of diminished chords in the minor harmonisation may be considered less consonant than triads with extensions, in terms of sensory dissonance. In contrast, the other two measurements place jazz at a lower position and nearer to the quartal harmonisation. The variant of Huron's model regards the minor harmonisation marginally more consonant than the major one, opposed to the other two models. The octatonic harmonisation is evaluated noticeably more consonant by the variant of Huron's model in comparison to Wang and Harrison-Pearce (H/P) models.
Additionally, we employed a key-finding algorithm to determine how tonal these excerpts were. Roughly, a key-finding algorithm searches the highest correlation coefficient between a pitch class profile of a given musical excerpt and the pitch class profile for major and minor in all keys (cf. Krumhansl, 1990; Temperley, 1999). If an excerpt is tonal, the found coefficient will be high; if the piece is not tonal the coefficient will be low. Here, we employed the Temperley algorithm (Temperley, 1999) and evaluated its confidence on the key suggestions for all 7 music stimuli. As expected, confidence on major and minor harmonisations was very high (r > .90), for jazz and for quartal it was slightly lower (r = .89 and r = .86). However, the algorithm was moderately confident for the remaining three (r < .60).
Visual Stimuli
The visual stimuli consisted of two sets of images varying in visual roughness developed manually using the Perlin Noise Maker (McKay, 2015) and SketchUp 2015 (version 15.0.0351). The first set of images were based on Perlin's (1985) Computer Graphics Animation software, used to depict convincing portrayals of the surface of physical elements with a degree of random variation in smoothness/roughness. A Pixel Stream Editor allows for the manipulation of several parameters, including pixel size, to produce novel visualisations, which can be arranged in a sequential fashion. For this study (Figure 2), we physically manipulated the pixel size on a grayscale image, measuring 3 × 3 cm. The pixel size of “noise” pixels increased from 0 mm (smooth surface) to 2 mm, 4 mm, 6 mm, and 8 mm (rough surface).
Regarding the second set of images, it included a surface with 5 stages of roughness starting from completely flat to highly spiked, to represent the transitioning from smoothness to roughness, respectively (Figure 3). The notion of roughness was created using aesthetic criteria. Our goal was to develop five variables in surface roughness so that they fitted a 5-point Likert scale. To create these variations, we designed a 33 × 33 mm surface on a Sandbox 2.31 plugin. Then, an increasing number of points were picked at random positions which we proceeded to distort on the vertical axis by creating artificial spikes. All visual stimuli, the audio, and the scores for the music stimuli can be found in the Supplementary Materials (https://osf.io/3vc8p/?view_only=16377de688444e4dbb2ae02e9666d864)

Perlin images displaying variation as to their pixel size: 0 mm, 2 mm, 4 mm, 6 mm, and 8 mm.
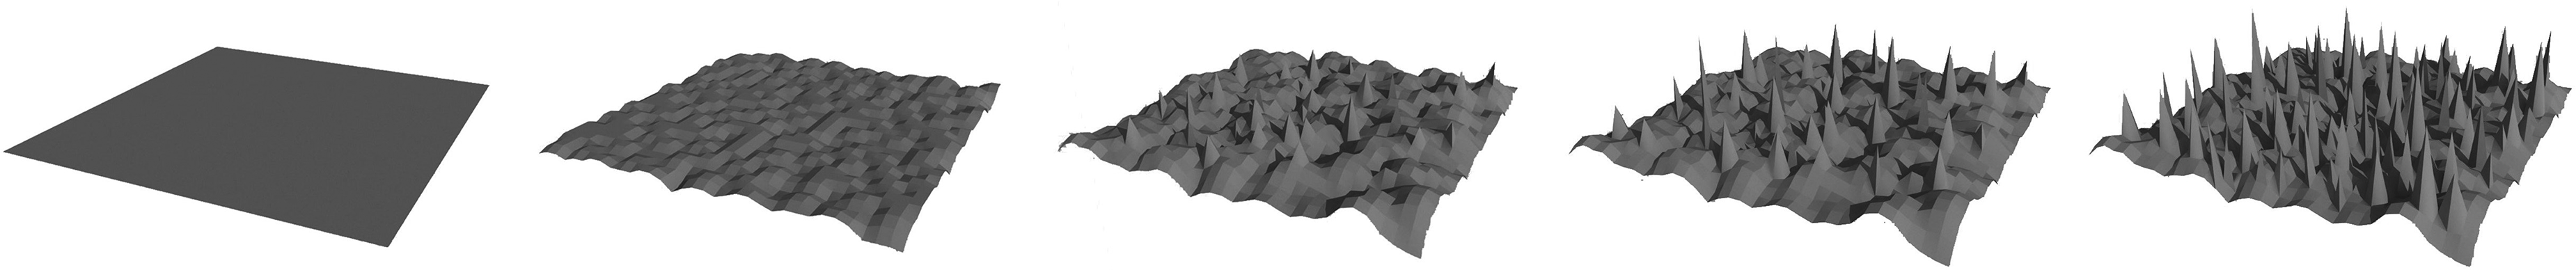
Spiky surfaces created via the Sandbox 2.3.1 Plugin in increasing roughness.
Participants
Thirty-four people (19 females) participated in the survey (Age M = 27.58 yrs, R = 18–40, SD = 5.00). The participants were Greek nationals in their majority, twenty-four of whom had completed university studies. In order to assess the participants’ music sophistication, they completed the Goldsmiths Musical Sophistication Index (Gold-MSI) v1.0 questionnaire (Müllensiefen et al., 2014). Since all participants in this study scored significantly higher than Müllensiefen and colleagues’ original findings (M = 97.61, SD = 12.86 in this study, compared to M = 81.58, SD = 20.62 in (Müllensiefen et al., 2014), they have been classified as possessing a high level of musical sophistication.
Procedure
Ethics approval was provided by the host institution (217775/2019 - 6031/2020). The duration of the experiment from beginning to end (instructions, consent, trials, harmonisation ratings, debriefing), was 30 min on average. Informed consent was a prerequisite to begin the study. In the main listening task, each stimulus was accompanied by a set of closed-type questions presented on a 5-point Likert scale. The questions related to the stimuli's perceived emotional content (not presented in this study), how familiar they sounded (“How familiar does the sample sound?”, 1-Extremely familiar to 5-Not familiar at all), and whether participants found them enjoyable (“I enjoyed the music sample”, 1-Strongly disagree to 5-Strongly agree). In addition to the above, two further questions were presented, in which the participants were asked to associate each music stimulus with the two sets of images (Perlin and spike surfaces), choosing one image from each set that they felt best represented the harmonisations (“What image fits the music sample best?”).
Results
The outputs of the C/D models that were employed for the evaluation of the harmonisations correlated highly with the listeners’ responses in all variables. For the sake of convenience, familiarity values have been reversed so that higher values correspond to greater familiarity and vice versa. Regarding the variant Huron model, strong and significant correlations were detected between consonance and enjoyment (r = .90, p = .005), familiarity (r = .85, p = .016), the spiked surfaces (r = −.88, p = .008), and the Perlin images (r = −−.90, p = .006). For the Wang metric, very high and significant correlations were detected between consonance and enjoyment (r = .90, p = .005), familiarity (r = .85, p = .016), the spiked surfaces (r = −.88, p = .008), and the Perlin images (r = −.90, p = .006). For the Wang metric accounting for sensory dissonance, a very high and significant correlation was observed between dissonance and rough surfaces (r = .90, p = .005) and the images with high Perlin noise (r = .92, p = .003). Similar patterns are detected with regards to familiarity (r = −.87, p = .01) and enjoyment (r = −95, p < .001). Finally, the composite model of Harrison and Pearce (2020) for consonance also displayed high and significant correlations with all parameters tested: enjoyment (r = .95, p < .001), familiarity (r = .94, p = .002), spiked surfaces (r = −.99, p < .001), and the Perlin images (r = −.98, p < .001).
Additionally, tonality, as measured in the current study was correlated significantly with all variables including enjoyment (r = .93, p = .002), familiarity (r = .88, p = .009), spiked surfaces (r = −.85, p = .015), and images of Perlin noise (r = -.88, p = .01).
With respect to how listeners selected the best fit image for the harmonisations, the following pattern was observed. Major and minor harmonisations are related to the smoothest pictures. Additionally, jazz and quartal harmonisations are the ones associated with a moderately rough visual stimulus. Moreover, the octatonic and the wholetone harmonisations score highly in images of roughness, whereas the random harmonisation has the lowest values for consonance and is related to the roughest visual stimuli. The responses to image fit per harmonisation are shown in Figure 4.

The spread of listeners’ responses for each harmonisation style in terms of increasing pixel size in Perlin noise images (panel a) and spiked surfaces (panel b), as raincloud plots are depicted. The black line in the boxplots represents the median and the dots represent individual responses for each style. Lower values in the vertical axis represent smooth images with low visual roughness and the opposite for higher values.
A high and significant correlation was observed between the variables of enjoyment and familiarity. For the sake of convenience, enjoyment values have been reversed so that lower values correspond to greater enjoyment and vice versa. The spike surface and the Perlin noise images also correlate strongly with enjoyment and familiarity. The two sets of visual stimuli (Surface and Perlin) align almost perfectly (r = .99, p < .001). All the relevant correlation pairs are illustrated in Table 3.
Correlation pairs for enjoyment, familiarity, and the two sets of images for all stimuli.

***p < .001
The chart in Figure 5 presents the average degree of enjoyment and familiarity for each harmonisation (minor, major, jazz, quartal, octatonic, random, and wholetone) by the participants. Regarding enjoyment, a small difference is observed between the averages of major and minor, where the latter is more enjoyed than the former. However, this outcome is only close to significance with the sample size being not very representative of the effect, t(33) = 1.49, p = .15, r = .25. The harmonisations appeared to be separated in two groups with regards to the mid-point preference rating (3): in one group are the relatively consonant, more tonally stable harmonisations, i.e., major, minor, and jazz; in the other are the nontonal harmonisations, i.e., octatonic, random, and wholetone. The quartal harmonisation seems to have been placed between those two groups.

Means of the responses for each harmonisation for enjoyment and familiarity. The bars correspond to the standard errors of each reported variable. Higher ratings correspond to higher enjoyment and familiarity.
With respect to the familiarity of the music samples, the order changes only slightly, it being major, minor, jazz, quartal, random, octatonic, and wholetone. Major and minor examples sound more familiar to a noteworthy degree compared to the rest. However, familiarity decreases to a greater extent than enjoyment. Quartal, random, octatonic, and wholetone all lie roughly below 2.5, while jazz is just above 3. This point is strongly corroborated by the current bibliography, in which familiarity and enjoyment correlate strongly (e.g., Lahdelma & Eerola, 2020). This is not surprising to see, considering the background of participants who are mainly from Western Europe and the nature of these excerpts, which lack several tonal characteristics, such as functional tonal harmony. The familiarity averages are also marginally bigger than the enjoyment averages in all cases, except the random one.
The general sophistication index regarding musicianship of the participants was not particularly varied, since it included mainly musicians. Therefore, the relationship between the responses and different degrees of musicianship could not be explored. Nevertheless, a handful of significant correlations was found between the enjoyment factor in quartal (r = -.37, p = .03), in random (r = -.46, p = .006), and in wholetone (r = -.44, p = .009), and the scores in general sophistication, especially in singing abilities. These numbers mean that a higher score in the musical sophistication questionnaire partially contributes to higher enjoyment of these three harmonisation styles; that being said, such an observation is a mere indication and needs to be further explored against a more diverse audience.
In addition, an analysis of variance was conducted to evaluate the differences in ratings of visual roughness in terms of Perlin noise and spiked surfaces across each separate style of harmonisation. Overall, the differences in harmonisations vary to a significant degree with regards to both images of increasing Perlin noise F(6,231) = 22.67, p < .001, η2 = .37, and spiked surfaces F(6,231) = 25.75, p < .001, η2 = .40. Most pairwise differences are significant for either of the visual stimuli, after the Bonferroni correction. Minor exceptions are the pairs of major and minor, jazz and quartal, and among the group of octatonic, wholetone, and random.
A multiple linear regression analysis was executed to analyse which parameter was more effective at predicting the judgements of listeners with regard to visual roughness. Using the forward selection method, the most optimal model of predicting responses to Perlin images was one combining the Harrison and Pearce (2020) index and the familiarity variable. This consonance metric performed better than the other two in the regression analysis. The remaining parameters of enjoyment and the tonality index also failed to contribute significantly to the final model. The resulting regression indicated that the model explains 99% of the variance and that the model was a significant predictor of association to Perlin images, F(2,4) = 205.1, p < .001, compared to F(1,5) = 137.1, p < .001. A similar model arose from the examination of spiked surfaces F(2,4) = 128.6, p < .001, explaining 98% of the variance. In Table 4 are presented the steps of the multiple regression analysis.
The steps of the forward selection for producing a multiple regression model.

*p < .05, ***p < .001
Discussion
The harmonic content of the quartal, jazz, major, and minor musical examples contain on average the most consonant chords. However, the roughness levels of the chords in the harmonisations themselves do not fully explain the association. The features listed by Tymoczko (2011) can easily be found in major and minor harmonisations. These follow strictly the rules of functional harmony, and they are restricted to pitches found within their respective key. Jazz, by contrast, uses an expanded variety of pitches deviating from its original diatonic key. Nevertheless, it contains many functional progressions which contribute to a better sense of tonality. Finally, the progressions in the quartal example are not functional, resulting in a less obvious tone centre; thus, creating ambiguity.
The octatonic harmonisation used in this experiment has a reasonable number of consonant chords. Its pitch class content is considerably varied, spanning in the whole chromatic scale. Furthermore, no functionality (in the sense of functional tonal harmony) can be found in the chord progressions, and this makes the tonal centre more vague. Because of having a large number of dissonant chords and lacking harmonic functionality, which augments the ambiguity of a potential tonal centre, participants have also associated the random and wholetone with high visual roughness. Regarding the wholetone harmonisation, although the pitch class distribution is mostly limited to those of the wholetone scale, contrary to the octatonic and random harmonisations, it is unclear whether this variable influences the perception of C/D and to what degree.
The dual theory of dissonance (Johnson-Laird et al., 2012) may provide valuable clues in order to explain the results. This theory suggests that chord progressions involving tonal chords within a tonal context are more consonant, followed by those in a random context. Then, nontonal chords in a tonal context and nontonal chords in a random sequence complete the order of consonance according to them. This observation can be also supported by the current study. Sequences of tonal chords presented in major or minor keys, which follow the rules of functional tonal harmony, are associated with visual stimuli that have the lowest level of roughness. These were followed by more dissonant tonal chords in a tonal context, for example, the jazz harmonisation stimulus. The harmonisation with nontonal quartal chords was next. Although these progressions cannot be explained by traditional tonal harmony, there is a relatively strong implication of a tonal centre and the use of a familiar diatonic mode. The ones associated with the roughest images were those with nontonal chords over nondiatonic modes.
Focusing solely on the C/D dimension, all the employed models showed strong associations between rough visual stimuli and dissonant harmonisations and vice versa. Acknowledging that these evaluation attempts account for both sensory and cultural dissonance, it still is a demanding task to disentangle these two concepts. This would require conducting the experimental task between participants of different cultures, as well as using appropriate culturally relevant stimuli varying in roughness levels. The responses suggest that not only sensory dissonance, but also a strong sense of tonality, among other cultural aspects of dissonance, are related to visual roughness. However, the degree to which each of those parameters contributes to the effect is still unclear.
Moreover, tonality was highly correlated to visual roughness. In the current study, tonality was measured in relation to the presence of a major/minor mode. As such, the variable was linked with rough visual stimuli. However, it was bypassed in the regression model suggesting that either its measurement is problematic and thus requires to be modelled in a more elaborate fashion, including tone centricity outside the major/minor system, functional relationships, and other factors, or C/D has a stronger effect than tonality; although these two variables usually interact in a musical context.
It is noticeable that there is a correlation between the roughness of the visual stimuli and familiarity ratings for the harmonisations. There are two possible explanations here: firstly, familiar sounds are perceived to be less rough (also see results by Lahdelma and Eerola, 2020). For this reason, Western (European) participants and participants overly exposed to western culture, who are more accustomed to the major and minor harmonisations, consider these to be ‘smoother’ on the grounds of familiarity, and as such, relate them to visual stimuli of low roughness, based on both sensory and metaphorical association. Alternatively, it is also possible that auditory roughness and visual roughness are independently related, regardless of familiarity; i.e., a listener may still associate a stimulus with rough harmonisation to a visual image high in surface roughness if they considered the stimulus to be high in acoustic roughness. Although it is observable that harmonisations high in acoustic roughness (random, wholetone, and octatonic samples) are correlated to visual stimuli with increased roughness, it is also noteworthy that the quartal harmonisation which was considerably unfamiliar to the participants was related to images with moderate roughness. Enjoyment also fits a relatively similar pattern, since, in this experiment, enjoyment and familiarity had a very high level of correlation (r = .94, p < .001).
The current study confirms the results from Liew et al. (2017, 2018) according to which rougher objects are associated with harsher sounds and vice versa. The key difference, however, is that the stimuli presented in those experiments represented either single tones or the element of noise in music, whereas the current study examines this linkage through the perspective of harmony. Although the results are analogous, auditory roughness might not be the sole factor responsible for the relationship in question. Harmonic elements such as dissonance of specific chord types, unconventional chord progressions, and lack of an established tonal centre seem to contribute to such associations. Visual roughness is readily associated with the most dissonant stimuli at hand. The present scope is limited to observing the cross-modal association between C/D and visual roughness. Nevertheless, the perception of C/D is a complex phenomenon that interacts with several other parameters. As a point for future research, it would be potentially interesting to compare noise and dissonant harmonies on a cross-modal level, to evaluate the percentage of auditory roughness, and dissonance-originating enculturation in the effect. Further exploration is also required to disentangle the imprint of enjoyment or familiarity in this association. Another point would be to evaluate how participants unexposed to jazz or western tonal harmony would link the latter to visual or even tactile stimuli varying in roughness, as they would operate on different connotations of familiarity.
There are several ways to explain why and how this relationship exists. It is apparent that a cross-modal correspondence is present between the lack of tonality and dissonance on the auditory part and a high level of roughness in visual representations (which stand as a proxy for tactile surface roughness). If the perceived cross-modal correspondence is between surface (2d/3d) and tonality/consonance, then a strong sense of these two attributes is associated with visual smoothness and homogeneity. By contrast, noise, tonal dissonance, and atonality are analogous to visual roughness and harshness. As discussed in the introduction, in terms of semantics, a shared term is used to describe both the tactile prescriptive (surface roughness) and the sonic prescriptive (auditory roughness experienced metaphorically via atonality and dissonance), leading to pairings between the two. In terms of statistical associations, although the aforementioned research by Liew et al. (2017, 2018) is indicative, a call for a cross-cultural investigation is necessary to discern whether these responses are established via cultural experience through repetition and interaction with the environment. Alternatively, the association between C/D and visual smoothness/roughness is structural, and as such, innate.
On this biological level, angular shapes have been associated with threat, danger, and negative concepts in general (Bar & Neta, 2007; Medford et al., 2005; Palumbo et al., 2015). The frequent correlation between the surfaces of varying roughness and the Perlin noise images suggests that the latter are recognised in a similar fashion as angular shapes generally do. The unfamiliarity and high percentage of dissonance in some music examples may have evoked feelings of tension within listeners, which usually prepare an organism to respond to potential danger from the surrounding environment (Huron, 2006). Higher levels of dissonance/roughness could also potentially lead to a higher level of perceivable energy tension (Lahdelma & Eerola, 2016a, 2016b), which in turn, is related to 2d/3d shapes in a metaphorical manner with higher surface roughness (Eitan & Rothschild, 2011). The stimuli of modalities with a high level of dissonance seem to trigger similar reactions, and thus, are connected in an affective manner.
Conclusion
Our research supports a significant interaction between the variables of enjoyment, familiarity, and acoustic roughness as expressed through harmonisation variants, with images of different degrees of visual roughness. Although sensory dissonance is recognised as a contributing factor to this relationship, other aspects, such as the lack (or not) of tonality, the (a)typicality of chord progressions, or cultural familiarity, among others, may also be relevant to this association. The origins of these interactions are still unclear, yet some cues could be explored employing the Conceptual Metaphor Theory or through the lens of human biology. As future steps, it would be valuable to investigate how musical sophistication and cultural background may influence the relationship between harmonic dissonance and visual roughness, further extending this association to the tactile modality.
Footnotes
Acknowledgments
The authors would like to thank Professor Tuomas Eerola for providing the analysis of the auditory stimuli using the ![]() model, Dr. Imre Lahdelma for his helpful comments regarding references, and the three anonymous reviewers for their suggestions and their constructive feedback. This scientific paper was supported by the Onassis Foundation under the Special Grant & Support Program for Scholars’ Association Members (Grant No. RZO 001-1/2018-2019).
model, Dr. Imre Lahdelma for his helpful comments regarding references, and the three anonymous reviewers for their suggestions and their constructive feedback. This scientific paper was supported by the Onassis Foundation under the Special Grant & Support Program for Scholars’ Association Members (Grant No. RZO 001-1/2018-2019).
Action Editor
Samuel Mehr, Harvard University, Department of Psychology.
Peer Review
Jackson Graves, École Normale Supérieure, Département d'Études Cognitives. Peter Harrison, Max Planck Institute for Empirical Aesthetics. Lawrence Zbikowski, University of Chicago, Music Department.
Author Contributions
KG and GA researched the literature and conceived the stimuli. GA also helped with gaining ethical approval. KG curated the obtained data and wrote the first draft. EC was responsible for study design and supervision. Participants were recruited by all authors. All authors reviewed, edited, and approved the final version of the article.
Declaration of Conflicting Interests
The author(s) declared no potential conflicts of interest with respect to the research, authorship, and/or publication of this article.
Funding
The author(s) disclosed receipt of the following financial support for the research, authorship, and/or publication of this article: This study was supported by the Alexander S. Onassis Public Benefit Foundation (grant number RZO 001-1/2018-2019).