
Abstract
Tunings of Thai classical music have been a source of disagreement during the past century. Focusing on 28 ensembles, the present study analyzes ways in which the intervals they produce can be formulated so that they are both falsifiable and verifiable. Of these, a model that corresponds to Rothenberg’s formulation of strict propriety excels among pairs of tones that span different numbers of scale degrees. According to Rothenberg’s model of strict propriety, intervals that span fewer scale degrees are smaller than intervals that span more scale degrees. Further, according to a formulation of clear patterning among intervals that span precisely two scale degrees (i.e., a single step), there is no clear pattern of one-step intervals unless all the instances of at least one interval that spans two particular consecutive scale degrees are smaller and/or larger than all the instances of all the other intervals that span two consecutive scale degrees. Among the 28 ensembles, single-step intervals tend to constitute chains that overlap in size rather than a clear pattern of small and large intervals.
As Terry Miller (2008, p. 140) has stated, “controversy swirls around the problem of Thai tunings, specifically whether the tones of the Thai system are equidistant or not.” In this regard, Thai tuning often has been formulated in ideal, mathematical terms as comprising octaves that have a fundamental-frequency ratio of 2:1, that is, 1,200 cents, within which there are 7 steps of equal magnitude, that is, 21/7:1 ≈ 1.10409:1 or 1,200/7 ≈ 171.4 cents. Nonetheless, more than a century ago, Alexander Ellis (1885, p. 1105), who introduced the idea that Thai tuning was equiheptatonic, claimed only that this was an “ideal” tuning. Concerning actual Thai tunings, Ellis reported measurements of fundamental frequencies for two instruments in a single Thai ensemble and found that the steps varied from 159 to 200 cents on one instrument and from 127 to 219 cents on the other. As well, among the fundamental frequencies Ellis reported, the octaves (i.e., the pairs of tones that spanned 8 degrees (cf. octavus in Latin and “eighth” in English) within the two instruments differed from the ideal value of 1,200 cents by as much as 25 cents, and between the two instruments the primes (i.e., the pairs of tones that spanned 0 degrees) differed by as much as 49 cents.
Subsequent studies, extensively surveyed by John Garzoli (2015, pp. 5–9), have borne out the kinds of differences Ellis found between a mathematically ideal equiheptatonic tuning and actual fundamental-frequency measurements. For instance, among 23 instruments in four ensembles, Garzoli (2015, p. 20) found that the smallest and largest 1-step intervals differed by as much as 66, 65, 79, and 117 cents. However, a convincing way of framing such differences has not yet been advanced. For example, David Morton (1976, pp. 232–237) concluded merely that in two registers (specifically, between approximately C#4 and C#6), three or four instruments of one ensemble were “closely in tune” with each other and the intervals they produced were “within about 10 cents above or below [i.e., larger or smaller than] the theoretically correct interval of 171.4 cents.” As well, Morton noted that these instruments displayed “more variety” in the registers above and below this range, and that two instruments of another ensemble produced “greater deviations” from the 171.4-cent value, ranging as they did from 129 to 190 cents.
Absent from such characterizations as “closely in tune,” “more variety,” and “greater deviations” are criteria that would specify what amounts of difference would constitute out-of-tune-ness, excessive variety, or substantially great deviation, that is, demarcation criteria that would distinguish between “hits” and “misses.” To address this lacuna, the present report considers two ways in which an equiheptatonic model can be formulated, termed “grid” and “ruler” frameworks here, and proposes a contrasting model that corresponds to David Rothenberg’s (1978, pp. 206–208) model of “strict propriety” and amplifies Rothenberg’s model by introducing a formulation of single steps.
As in previous studies of Thai tuning, the principal focus in what follows is on the extent to which acoustical measurements of fundamental frequencies and their concomitant fundamental-frequency ratios diverge from particular models. Unlike earlier accounts, the present study also considers the extent to which such measurements verify or falsify such models. Further, whereas acoustically measured intervals are the main focus here, their perceptual counterparts are considered in the Discussion section.
Measurements of Actual Tunings
Whereas an ideal, mathematical model can serve as a model of actual tunings, an acoustical assessment of the relationship between such a model and actual tunings involves measurements of fundamental frequencies and the ratios that result from them. Like the qualities of intervals in an ideal, mathematical model, the measurements of an actual tuning are conveyed by means of real numbers, for example, particular numbers of hertz (Hz), or logarithms to a particular base. In principle, however, the numbers that result from measurements differ from the numbers of an ideal, mathematical model. Unlike the numbers of an ideal mathematical model, the numbers that convey measurements are necessarily subject to the limitations of a particular measuring device, including its calibration. As well, though less predictable, substantive errors might have been made in the course of recording measurements, including, for example, errors of data entry.
Although each tone on which the present study focuses was produced by a fixed-frequency instrument (e.g., a gong circle, a xylophone, or a metallophone), and although each tone resulted in a single fundamental-frequency measurement and each pair of tones resulted in a single logarithmic value, in actual practice these individual values would be subject to change and hence variable over time. Important sources of such change would be the ongoing re-tuning and adjustment of an instrument between performances, especially in the case of gong circles and xylophones. As well, the validity of particular measurements would be subject to problems of a particular instrument’s manufacture and maintenance. Finally, potential differences between the values of an ideal, mathematical model and measurements of actual tones are increased if one considers several instruments in an ensemble rather than merely the individual tones produced by a single instrument, and such potential differences are increased even further if one considers the tones produced by several ensembles.
Models of Tuning
In general, the tones of two scale degrees are different only if their fundamental frequencies are different. As a matter of acoustical measurement, distinguishing between different fundamental frequencies involves distinguishing between smaller and larger fundamental frequencies and would have to take into account the distinction between measurements and the actual things that are being measured. For instance, if a particular measuring device was calibrated to the nearest two cents, the resulting measurements could differ from the actual frequencies by more than those that would result from a device that was accurate to the nearest cent. In the present study, this kind of error, which one can trace to a particular measuring apparatus and/or a particular way of recording measurements produced by the apparatus, is termed a “calibration error” and symbolized by the letter e. In this regard, if the actual frequencies of two tones were precisely the same, for example, x, the measured value of one tone’s frequency could be as small as x – e and the other’s as large as x + e. Conversely, for each of the models considered here, the fundamental frequencies of all the tones of a single degree, that is, 0 steps, would have to differ from those of other degrees by more than 2e; that is, for there to be certainty that two tones are instances of different scale degrees, their measured frequency ratio must exceed 2e (Figure 1(a)).

Criteria for verifying measurements of fundamental frequencies: (a) within particular degrees in general, (b) according to a grid model, (c) with measurements of fundamental-frequency ratios according to a ruler model, or (d) a strict-propriety model, including a calibration error of ±3.5 cents.
Turning from the measured frequencies of individual tones to the measured fundamental-frequency ratios of pairs of tones, the most precise way of formulating an ideal equiheptatonic tuning in a manner that can be assessed empirically by means of acoustical measurements would be analogous to a grid in which the fundamental frequencies of octave intervals ideally constituted a ratio of 2:1, that is, 1,200 logarithmic cents (Ellis, 1880, p. 295) and adjacent degrees ideally would be 1,200/7 ≈ 171.4 cents, apart. Such a model would be verified or falsified empirically by measurements of successive fundamental frequencies that differed by ∼171.4 cents plus-or-minus a value for calibration error (e.g., e). In other words, the grid constraint implies that every step interval is 171.4 cents. Given a calibration error of e, this implies that a tuning fulfilling the grid constraint would have n-step musical intervals of measured sizes in the interval [(171.4 n) − e, (171.4 n) + e], where n = 0, 1, 2, 3,…(Figure 1(b)). That is, the measured values of the individual frequencies within successive degrees would range from –e to + e cents, from ∼171.4 – e cents to ∼171.4 + e cents, from ∼342.9 – e cents to ∼342.9 + e cents, and so forth. Without adding or subtracting such a variable as e for calibration error, a grid model corresponds to the ideal mathematical model of equiheptatonic tuning with which previous studies have compared actual acoustical measurements. In this regard, such a model corresponds to John Rahn’s (1980, pp. 19–39) “integer model of pitch” where the tones of European-derived atonal music are considered to be analogous to area-less points of geometry and are arranged from low to high in increments of 21/12, rather than the grid model’s increments of 21/7.
A Ruler Model
Of the three models considered in this study, the grid model is the most constrained, and the most stringent. A less precise model would be analogous to a ruler in which the units spanned ∼171.4 cents and measurements of individual intervals were to the nearest unit (as in measurements of length to the nearest inch). Such a model would be verified empirically by measurements of successive degrees’ fundamental frequencies that, as in a grid model, were ideally ∼171.4 cents apart, but also plus-or-minus one-half of the unit’s value (i.e., ∼85.7 cents). That is, the ideal fundamental-frequency ratios of successively larger intervals would be between the following extremes: for intervals of 0 steps (i.e., primes), 0 and 85.7 cents, for 1-step intervals (i.e., seconds), 85.7 and 257.1 cents, for 2-step intervals (i.e., thirds), 257.1 and 428.5 cents, and so forth. In other words, the ruler constraint implies that ideally every n-step musical interval is in the interval (171.4 ((2n − 1) / 2), 171.4 ((2n + 1) / 2)), where n = 1, 2, 3…, etc. Note that for pairs of tones that span 0 steps, n would be equal to zero, and such musical intervals would be in the interval (0, 171.4 / 2) rather than in the absurd interval (−172.4 / 2, 171.4 / 2): absurd insofar as the magnitudes being measured, like lengths, masses, or durations, are not analogous to area-less points as they are in a grid model; instead, they are quantities that might comprise various positive amounts or no amount but not a negative amount (Figure 1(c)).
Around the boundary between intervals of n and n + 1 steps (where n = 0, 1, 2, 3,…), calibration error might result in overlapping values. For example, in a ruler model, the measurements of 0-step and 1-step intervals’ fundamental-frequency ratios might be, respectively, 85.7 + 2e cents and 85.7 – 2e cents: 2e rather than e, because in a ruler model each interval comprises a pair of tones whose ratios are to be compared with an ideal range of values, rather than tones whose individual frequencies are to be compared with a single ideal value. Measurements of 85.7 – 2e and 85.7 + 2e cents would verify the ruler model’s distinction between, respectively, a 0-step interval and a 1-step interval in a manner that would exclude false positives for the distinction between 0- and 1-step intervals within the ruler model’s framework. Nonetheless, measurements from 85.7 – 2e to 85.7 + 2e cents would not falsify the ruler model’s distinction between a 0-step interval and a 1-step interval in a manner that excluded false negatives.
Of the two desiderata, namely, excluding false positives and excluding false negatives, excluding false positives would correspond to a greater degree of falsifiability in that it would include fewer measurements as possible confirmations of a particular distinction between, for example, a 0-step interval and a 1-step interval. Further, the grid model is falsifiable to a greater degree than the ruler model in that it would include fewer measurements as confirmations of a particular distinction between, for example, a 0-step interval and a 1-step interval. Accordingly, if the efficacy of the grid model to distinguish, for example, a 0- step interval from a 1-step interval is to be compared with the ruler model’s efficacy in making this distinction, falsifiability would be enhanced by considering, for example, –e to +e cents as the range of measurements for instances of the 0-step interval within which the grid model would be preferred, and e to 85.7 – 2e cents as the range of measurements for instances of the 0-step interval within which the ruler model would be preferred. A similar pair of ranges would be critical for instances of the 1-step interval: 171.4 – e to 171.4 + e cents for the grid model versus 85.7 + 2e to 257.1 − 2e cents for the ruler model.
A consequence of such comparisons would be a constraint on the size of e. For instances of the 0-step interval, the critical boundary between 85.7 – 2e cents and 0 + e cents would be e ≈ 85.7 / 3 ≈28.6 cents, which would be the maximum value of e for such a comparison. With such a maximum value of e, comparisons of the grid and ruler models’ effectiveness as models of actual measurements for the 1-step interval would have a range of ∼(171.4 – 28.6) cents to ∼(171.4 + 28.6) cents, that is, ∼142.8 cents to ∼200.0 cents according to the grid model, and according to the ruler model a range of ∼(85.7 + 57.1) cents to ∼(171.4 – 28.6) cents, that is, ∼142.8 cents to ∼(257.1 – 57.1) cents, that is, ∼200 cents. Accordingly, for such a comparison to be reasonable, e would have to be smaller than ∼28.6 cents. For example, if e was 3.5 cents, the grid model of 0-step intervals would be verified by tones within a range of –3.5 to + 3.5 cents and, by comparison, the ruler model of 0-step intervals would be verified by intervals within a range of 3.5 to ∼85.7 – (2 × 3.5) ≈ 78.7 cents. For 1-step intervals, these ranges would be, respectively, ∼171.4 – 3.5 to ∼171.4 + 3.5 cents, that is, ∼167.9 to ∼174.9 cents for the grid model, and, by comparison again, ∼85.7 + (2 × 3.5) ≈ 92.7 cents, to ∼167.9 cents and ∼174.9 cents to ∼257.1 – (2 × 3.5) ≈ 250.1 cents, and similarly for other intervals that span more than 0 degrees.
Both the grid model and the ruler model are based on a single ideal absolute value, namely, the fundamental-frequency ratio 21/7:1, which, historically, was based on an ideal fundamental-frequency ratio for the 8-degree, 7-step interval of an octave, namely, 2:1, as in Ellis’s original study of Thai tuning (1885, p. 1105). Notwithstanding their assumption of such an ideal absolute value, both the grid model and the ruler model can be regarded as special cases of David Rothenberg’s (1978, pp. 206–208) model of strict propriety.
A Strict-Propriety Model
According to Rothenberg’s model, pairs of tones constitute a strictly-proper relationship if the following condition obtains: if one tone-pair, x, spans fewer scale steps than another tone-pair, y, then x is smaller than y. Accordingly, the magnitudes, that is, the sizes, of each interval in an ideal strictly-proper scale can be represented by mn where m is the magnitude of a pair of tones, n = 0, 1, 2, 3,…is the (natural) number of steps which that pair of tones spans, and m n < m n+1, i.e, m 0 < m 1 < m 2 < m 3…, etc.
As an illustration, in ideal equal temperament, strict propriety holds between all pairs of tones except an augmented fourth and a diminished fifth, for an augmented fourth spans fewer scale steps than a diminished fifth (respectively, three steps and four steps), but both are ideally the same in size: specifically, 26/12 = 600 cents. By contrast, in various ideal meantone diatonic tunings, i.e., where the perfect fifth is smaller than 27/12 = 700 cents, strict propriety holds among all pairs of diatonic intervals, including the augmented fourth and diminished fifth, whose sizes ideally are, for example, ∼579.5 cents and ∼620.5 cents in quarter-comma meantone diatonic tuning, respectively (Barbour, 1951; Carey, 1998, pp. 108, 303), rather than both being 600 cents. Similarly, in the ideal 24-quartertone equal temperament of North African, Middle Eastern, and Turkish music (Ayari & McAdams, 2003; Marcus, 1993; Marcus, 1998/2001), the tuning of rāst is strictly proper, having as it does 1-step intervals whose successive sizes, in twenty-fourths of an ideal octave whose fundamental-frequency ratio is 2:1, are 4, 3, 3, 4, 4, 3, and 3: respectively, 200, 150, 150, 200, 200, 150, and 150 cents.
A tuning that satisfied the constraints of the grid or ruler models discussed above would be strictly proper, for every 0-step interval would be smaller than every 1-step interval, which would be smaller than every 2-step interval, and so forth. Moreover, as ideal rāst and meantone diatonic tunings illustrate, a tuning might be strictly proper without the constraints on absolute step sizes that the grid and ruler models specify. Indeed, even the 8-degree, octave interval of size 2:1 in ideal rāst and meantone diatonic tunings is not requisite for a tuning to be an instance of strict propriety. In order to identify a particular model of Thai tunings as strictly proper without implying the grid and ruler models’ constraints on absolute interval sizes, such a model will be termed simply a “strict-propriety” model or a “strictly-proper” model.
According to a strictly-proper model, each pair of tones that spanned a particular number of steps would be compared with each pair of tones that spanned a different number of steps. Since the calibration error of both the upper tone and the lower tone in each interval would be ±e, the largest measured fundamental-frequency ratio of one interval would have to be more than 4e smaller than the smallest measured fundamental-frequency ratio of any interval that spanned more steps in order to verify the model in a way that would avoid false positives for the distinction between an interval of n steps and an interval of n + 1 steps. That is, tone-pairs that would span n = 0, 1, 2,…steps would have as their fundamental-frequency ratios the magnitudes x 0, x 1, x 2,…, where xn + 2e < xn +1 – 2e, as illustrated in Figure 1(d).
For comparisons of the grid and ruler models, there are, as discussed above, two effective error values: e for the grid model’s single values and 2e for the ruler model’s pairs of values. In comparisons of the ruler model and the strict-propriety model, the effective error value for both is 2e. If one considered the strict-propriety model on its own, that is, in isolation from other models, measurements that verified it and did not include false negatives would also exclude false positives, for if xn + 2e < xn +1 – 2e, then xn – 2e < xn +1 + 2e, but not vice versa. If one considered the ruler model on its own, measurements that verified it and did not include false positives would not necessarily exclude false negatives. For example, if e = 3.5 cents, measurements of ∼78.7 and ∼92.7 cents for, respectively, a 0-step interval and a 1-step interval would confirm the ruler model and would exclude false positives, but measurements of ∼92.7 and ∼78.7 cents for, respectively again, a 0- and a 1-step interval would exclude false negatives. Accordingly, in comparing the effectiveness of these models, one also has to consider the possibility of false negatives among the measurements assessed according to the ruler model. Although measurements that verify a strict-propriety model would not falsify such a model, a measurement that might not seem to verify the ruler model, for example, a measurement between 85.7 – 2e and 257.1 + 2e cents for a 1-step interval, might in fact be a measurement that actually does not falsify a ruler model.
Step Sizes
Concerning the measurements of 1-step intervals he made of Thai fixed-frequency instruments, which he considered to be equiheptatonic, Morton (1976, pp. 232, 236) noted that “no clear pattern of large and small intervals obtains.” Unfortunately, Morton did not specify what would constitute a “clear pattern.” Nonetheless, meantone diatonic and rāst tunings, both of which are strictly proper, arguably have the following clear patterns of 1-step intervals: respectively, L L s L L L s and L s s L L s s, where s < L, that is, each of the 1-step intervals whose size is denoted by “s” is smaller than each of the 1-step intervals whose size is denoted by “L.” In this sense, within each tuning, the L intervals constitute a class of intervals that are clearly larger than the intervals in the class that comprises the s intervals. Moreover, irrespective of various ways in which meantone diatonic tuning has been formulated, for example, as summarized by Carey (1998, pp. 108, 303), L L s L L L s not only constitutes a clear pattern of large and small 1-step intervals but that pattern also clearly distinguishes meantone diatonic tunings from such a tuning as rāst, which constitutes a pattern of large and small 1-step intervals that clearly differs from the meantone diatonic pattern.
Consistent with the way discussed above for verifying the strict-propriety model for intervals that span different numbers of degrees in a manner that excludes false positives, a 1-step interval, i, that spans a particular pair of degrees is clearly smaller than another 1-step interval, j, that spans a different pair of degrees, if the size of j exceeds the size of i by more than the amount of measurement error, that is, 4e. In cases where there would be several instances of the 1-step interval between a particular pair of degrees, for example, where different instruments of a single ensemble produced different fundamental frequencies as instances of particular degrees, then, again, a 1-step interval, i, is clearly smaller than another 1-step interval, j, if the size of each instance of j exceeds the size of each instance of i by an amount greater than 4e: in other words, if the largest fundamental-frequency ratio of i is smaller than the smallest fundamental-frequency ratio of j by an amount greater than 4e.
The present study holds that unless certain 1-step intervals are clearly smaller than the others, there is no clear pattern of smaller and larger intervals of the sort exemplified by rāst and meantone diatonic tunings. Nonetheless, because strict propriety does not accord special status to the octave, or to any other interval that spans a particular number of steps, a tuning might be strictly proper and convey a clear pattern of smaller and larger intervals without such a pattern being duplicated periodically as occurs in each octave of rāst and meantone diatonic. Moreover, a specific upward succession of smaller and larger steps might not be repeated periodically within a single ensemble. Nonetheless, a clear non-periodic succession of smaller and larger steps might recur among more than one ensemble. Accordingly, as well as determining the extent to which acoustical measurements verify or falsify each of the three models of sizes among intervals that span different numbers of steps, the empirical portion of the following account considers the extent to which there is some sort of clear patterning of smaller and larger steps among ensembles of Thai classical music.
Measurements Included in the Present Study
In order to assess the extent to which measurements of fundamental-frequency ratios in Thai classical music verify or falsify the grid, ruler, and strict-propriety models discussed above and in order to discern whether there is a clear patterning of small and large 1-step intervals among such ratios, the following account focuses on relationships among pairs of tones produced by fixed-frequency instruments in traditional Thai classical music ensembles for which Sugree et al. (1997, pp. 81–99) reported fundamental-frequency measurements in the study Research for Standard Pitch and Scale of Thai Music that they undertook for Mahidol University. The fixed-frequency instruments Sugree et al. considered were xylophones, metallophones, and gong circles. To facilitate a critical reading of the following account, the values Sugree et al. reported are accessible online in a spreadsheet (Rahn, 2017).
Sugree et al. (1997) also reported fundamental-frequency measurements for traditional Thai flutes, oboes, and bowed chordophones in these ensembles. Like the human voice, these instruments produce fundamental frequencies that during performance often differ audibly within individual tones, as in vibrato and bends, and between tones at different scale degrees, as in slides or glissandi (Miller, 2008, p. 15; Yannavut, 2016, p. 23). In contrast, xylophones and gong circles are tuned by means of a mixture of lead shavings and wax applied to individual bars and gongs (Garzoli, 2015, pp. 11, 13−14). As a consequence, the fundamental frequencies of these idiophones remain effectively constant throughout a performance. To be sure, changes in tuning sometimes occur between performances if, for example, a piece of the wax and lead mixture falls off. However, individual xylophone and gong-circle tones whose fundamental frequencies have changed can be re-tuned quite readily between performances.
Sugree et al. (1997) reported fundamental-frequency measurements for 35 “bands,” that is, instrumental ensembles. Like Somchai (1973), theirs is one of the most extensive studies of tuning for Thai classical music, comparable in its scope to the path-breaking account of Central Javanese tuning by Surjodiningrat, Sudarjana, and Susanto (1972) that has been a basis for several further studies: for example, Dowling (1978), Rahn (1978), Carterette and Kendall (1994), Braun (2002), Sethares (2005), and Rahn (2016).
Among the 35 bands, fundamental-frequency measurements of four are excluded from detailed study here. For the bands they numbered 9, 14, and 29, Sugree et al. (1997) provided measurements of fundamental frequencies only for the ensemble’s flute (khlui), which, as mentioned above, is not a fixed-frequency instrument. Further, as the fundamental frequencies in band 30 were tuned by mechanical means, namely, a Korg MT-1200 Multi-Temperament Tuner (Korg, Inc., Tokyo; Sugree et al., 1997, p. 13), they are not relevant to the present study, which focuses on tunings that have been tuned in the traditional manner, that is, aurally, entirely “by ear,” and thereupon measured by acoustical instrumentation.
Members of the Mahidol University tuning project undertook the study to determine whether there would be solutions to certain issues they regarded as problematic in tuning Thai instruments according to an equidistant arrangement of seven steps. For the Mahidol research group, these problems involved how one may tune such intervals, how the human ear responds to such intervals, “what aesthetic guides the choice [of intervals],” and whether “a system [can be] obtained that will allow some degree of consistency in a musical performance” (Sugree et al, 1997, pp. 8–9). With regard to these issues, the group identified with greater precision four problems, namely, that the seventh root of 2 is irrational, that the seventh root of 2 does not match the twelfth root of 2 or the fifth root of 2, that “there is no seeming means of creating such a temperament [i.e., an equal temperament] from any chosen ratio [i.e., of small whole numbers],” and that “it has been observed that equal temperament consciously opposes natural responses of the human ear” (Sugree et al, 1997, pp. 10–11).
Since, by definition, no irrational number is equal to any rational number, the first three issues the group identified comprise mathematical truisms. In this connection, Sugree et al.’s (1997) survey of tunings within various historical and cultural contexts refers to 12- and 5-fold equal divisions of a 2:1 interval: the 12-fold division with regard to Chinese and European-derived tuning since the 16th century (Christensen, 2006, p. 205; Robinson, 1980), the latter with regard to sléndro tuning of Indonesia (e.g., Rahn, 2011). Concerning the final issue of this list, the report by Sugree et al. provides a survey of various kinds of tuning that, as in Helmholtz’s (1885, pp. 179–197) classic account of sensory consonance among tones that have harmonic partials, accord privileged status to the fundamental-frequency ratios 2:1, 3:2, 4:3, 5:4, and 6:5.
Concerning the “standard pitch” of the report’s title and the privileged auditory status it attributes to the ratios 3:2 and 4:3, Sugree et al.’s (1997) discussion of Pythagorean tuning says (pp. 5–6), “The tuner tunes a standard pitch, then tunes up a perfect fifth, down a fourth, up a fifth…etc. Each interval is tuned perfectly without beats.” Of further relevance to a standard pitch, the report says also, concerning Mesopotamian music, “A central tone, similar to the Greek mese, is employed. Perhaps it points to an approximate standard” (p. 5). Of relevance to the ratios 5:4 and 6:5, the report says as well that Ptolemy employed them as “a means of making ratios agree with the ear’s response” (p. 7).
Among its general results, Sugree et al.’s (1997) report tabulated the approximate fundamental frequencies of single tones produced by more than a hundred instruments, tones that in European-derived notations of traditional Thai music (e.g., Panya, 2001; Morton, 1976, pp. 49, 56) would be close to 440 Hz, specifically, between 400 and 455 Hz (pp. 13–14) and for certain ensembles between 795 and 847 cents above C4, that is, ∼414 to 427 Hz (p. 15), characterizing such absolute frequencies as “standard pitches” (p. 13) and “Thai pitch centers” (p. 14: cf. their preceding account of the mese in Greek Antiquity and the Mesopotamian central tone as a putative approximate standard).
Having identified their principal finding that ∼425 Hz was the modal (i.e., most frequent) value among tones close to A 440, Sugree et al. (1997) said that “Thai musicians may find it to their advantage to hold a convention with the purpose of establishing a national pitch standard, perhaps A = 425 [Hz]” and immediately explained the advantage they referred to by saying that “the greater portability of instruments would be a convenience to all” (p.13).
In contrast to Sugree et al.’s (1997) detailed findings concerning standard pitches and pitch centers, their only conclusion concerning the hypothesis that “Thai traditional musicians use a seven-step equidistant scale” was the relatively vague observation that “despite the fact that there is no Thai theory of music or tuning, the results show a remarkable level of accuracy and consistency.” Concerning relationships between the intervals they measured and the small-whole-number ratios their survey of other tunings treated as privileged, they characterized as “the only results of possible interest” four isolated intervals that were within 10 cents of their counterparts in 5-limit just tuning, Pythagorean tuning, and 12-semitone equal temperament. Additionally, concerning the aesthetic that guides the choice of intervals, the report claimed only that “present-day Thai musicians are more concerned with the overall sound (timbre) of the music than with exactitude of pitch. The overriding aesthetic is one of sound. This is the chief determining factor in all variants of this music.” (p. 16).
Rather than specifying the fundamental frequencies of individual tones directly in cycles per second (i.e., Hz), Sugree et al. (1997) aligned individual fundamental-frequency measurements parallel to a grid-like framework arranged in ideal increments of ∼171.4 cents across several registers: approximately from 0 to 4,457 cents above C4. Relative to A 440, this range would be from ∼262 to ∼3,434 Hz. In this regard, though conventionally notated in a range from D3 to E5 (as in, e.g., Panya, 2001), the actual range for a khong wong yai gong circle is from D4 to E6, that is, approximately 294 to 1,319 Hz, which corresponds to the entries for this kind of instrument in the measurements Sugree et al. report. Whereas measurements in cycles per second would be relevant to a detailed study of fundamental frequencies per se, the present study focuses on the sizes of intervals, that is, the ratios of fundamental frequencies, for which the cents data of Sugree et al. provide the relevant values.
Sugree et al. (1997) made their original fundamental-frequency measurements by means of a Korg MT-1200 Multi-Temperament Tuner, for which the measurement precision is ±1 cent (MT-1200, 1995, p. 31). However, detailed analysis of Sugree et al.’s measurements leads one to conclude that this calibration error should be increased to ±3.5 cents. The fundamental frequencies Sugree et al. reported consist disproportionately of values that differ from each other by multiples of 5 cents. In particular, among 298 rows of measurements in which there is more than one measurement for an individual degree among the instruments of a particular ensemble, 240 (80.5%) consist only of measurements that differ by multiples of 5 cents, that is, by 5, 10, 15, etc. cents. The remaining 58 rows comprise a second group of measurements that differ from this 5-cent group by –2, –1, +1, or +2 cents. Of relevance to this general observation, the MT-1200’s display is calibrated in increments of 1 cent and prominently highlights differences from a particular pre-set fundamental frequency that are multiples of 5 cents (MT-1200, 1995, p. 4). Accordingly, whereas a face-value reading of the measurements in Sugree et al.’s study might suggest precision to the nearest cent, a more cautious interpretation would consider them accurate within a range of ±3.5 cents. Accordingly, with regard to the grid, ruler, and strictly-proper models discussed above, e = 3.5 cents, 2e = 7 cents, and 4e = 14 cents.
Sugree et al.’s use of the MT-1200 tuner also accounts in large measure for individual measurements that are missing from their report, for which there were “no discernible tones,” that is, fundamental frequencies (Sugree et al., 1997, p. 18). The MT-1200’s principal use has been to tune guitars for pop music. Single guitar tones have a harmonic spectrum, last long enough, and decline in amplitude sufficiently slowly to result in clear and stable MT-1200 readings, in contrast to xylophone tones. Since Sugree et al.’s report, reliable free and inexpensive software that obviates problems that xylophone tones present has become widely accessible (e.g., Audacity®, 2014a, 2014b; Transcribe!, 2014a, 2014b).
Sugree et al.’s (1997, p. 12) solution was to record individual tones about five times in quick succession, as documented by hundreds of waveforms they displayed in their report (pp. 101–481). Many of these waveforms reveal hard symmetrical clipping that reflects the power output of an amplifier, especially with regard to the upper portions of the waves’ spectra, so that, for example, in shape a sine wave approaches a square wave (Holman, 2010, pp. 49–50). Arguably, such instances of clipping are flaws that undermine the reliability of Sugree et al.’s data. However, whereas clipping affects upper portions of a tone’s spectrum and consequently its timbre, it does not affect its fundamental frequency. To be sure, clipping would underline the reliability of a study that focused on timbre (e.g., Sethares, 2005). More important for the present report, in the highly inharmonic spectra of the gong circles, xylophones, and metallophones on which this study focuses, the frequency of a tone’s fundamental is unaffected, as Rahn (2018c) demonstrates. Moreover, among such inharmonic tones, the amplitude of the fundamental is disproportionately large, and clipping does not compromise the measurement of a tone’s most prominent partial.
With regard to audio samples that are otherwise distorted, Sugree et al. (1997, p. 16) explain that certain tones produced only noise rather than clear fundamental frequencies, and say they verified these anomalies as such by means of an oscilloscope (pp. 12, 16), and entered their values as dashes rather than in cents. However, this might not always have been adequate, for there are gaps in Sugree et al.’s lists of measurements. Concerning these gaps, they said: Despite the interest of musicians in sound, many of the instruments that were examined would not produce a full range of pitches. This is a common problem with mallet idiophones (ranat, khong, xylophone [sic]). In a few instances instruments were omitted from the study when they produced no discernible tones, only noise (verified with the oscilloscope). Many instruments had this failing for some pitches. Dashes, rather than cents, indicate this condition in the Appendix. There would seem to be room for Thai instrument makers to improve the overall design and structure of some instruments (Sugree et al., 1997, p 16).
Method
As mentioned above, two scale degrees differ only if their fundamental frequencies are different (Figure 1(a)). In view of the ±3.5-cent calibration error described above, Sugree et al.’s (1997) measurements were examined to see whether the highest fundamental frequency of all the tones they identified with a particular degree was at least 2e = 7 cents lower than the lowest fundamental frequency of all the tones identified with the next higher degree. This served to determine whether a particular tuning verified the usual model of tunings and also identified possible anomalies of data entry among the approximately one thousand measurements Sugree et al. reported.
In order to determine the extent to which Sugree et al.’s measurements more specifically verified the grid, ruler, and strictly-proper models, the fundamental-frequency ratios of all pairs of tones that spanned 1, 2, 3,…steps were compared with the values each of the models specified, taking into account the ±3.5-cent calibration error for each relevant fundamental frequency. In particular: The grid model was considered to be verified if the fundamental-frequency ratios for all the 0-step intervals were between –3.5 and +3.5 cents, that is, to the nearest cent, within a range of ∼7 cents; all 1-step intervals were between 171.4 – 3.5 and 171.4 + 3.5 cents, that is, between ∼168 and ∼175 cents; those for the 2-step intervals were between ∼339 and ∼346 cents, and so forth (Figure 1(b)). The ruler model was regarded as verified in a way that excluded false positives if all the 0-step intervals were between 0 and 85.7 – 7 ≈ 79 cents; all the 1-step intervals were between 85.7 + 7 ≈ 93 cents and 257.1 – 7 ≈ 250 cents; all the 2-step intervals were between ∼264 and ∼422 cents, etc., and in a way that excluded false negatives if all the 0-step intervals were between 0 and 85.7 + 7 ≈ 93 cents, all the 1-step intervals were between 85.7 – 7 ≈ 79 cents and 257.1+7 ≈ 264 cents, and so forth (Figure 1(c)). Whereas comparisons of the grid and ruler models’ efficacy tested the grid model against the version of the ruler model that excluded false positives, comparisons of the ruler and strictly-proper models tested the versions of the ruler model that excluded both false positives and false negatives against the version of the strictly-proper model that excluded false positives. The strictly-proper model was considered verified in a way that excluded false positives if the largest pair of tones that spanned 0 steps was more than 4 ×3.5 = 14 cents smaller than the smallest pair of tones that spanned 1 step, the largest pair of tones that spanned 1 step was more than 14 cents smaller than the smallest pair of tones that spanned 2 steps, etc. (Figure 1(d)).
Finally, to determine whether the measurements comprised a clear pattern of smaller and larger intervals, each 1-step interval in each ensemble was characterized as smaller, larger, or overlapping in comparison with the others. Figure 2 shows that the ninth step from the bottom of ensemble 26 is clearly smaller than all the other 1-step intervals, as it is more than 14 cents smaller than the second lowest step, which is the next smallest interval. As well, the second lowest step is clearly smaller than the fifth lowest step. However, none of the remaining steps is clearly larger than the fifth lowest step: e.g. the smallest and largest sizes of the twelfth lowest step are both 166 cents, and hence overlap 161 and 166 cents, which are the smallest and largest sizes of the fifth lowest step. Similarly, the smallest and largest sizes of the twelfth lowest step overlap the smallest and largest sizes of the eighth lowest step and the fifteenth lowest step: respectively, 171 and 171 cents, and 171 and 176 cents, and so forth.

Smallest and largest instances of 1-step intervals among fixed-frequency instruments in Thai classical music ensemble #26, whose fundamental-frequency measurements are reported in Sugree et al. (1997, p. 96).
Results
In 13 of the 31 ensembles, the fundamental frequencies of all the tones that Sugree et al. (1997) aligned for each degree were registrally discrete: that is, all the fundamental frequencies of a particular degree were at least 7 cents smaller than all the fundamental frequencies of higher degrees. In Figure 3, these contrasts are conveyed for each ensemble by the entry for the largest (max) ratio of among the tones comprised by the ensemble’s 0-step intervals and the smallest (min) ratio among all of its 1-step intervals. As well, in each of these ensembles, the strictly-proper hypothesis that intervals spanning fewer degrees would be smaller in size was verified, for the fundamental-frequency ratios of all the intervals that spanned a particular number of steps were more than 14 cents smaller than those of all intervals that spanned more steps. For each of the 13 ensembles, the basis for this generalization can be seen in Figure 3 if one compares the number of cents in the largest fundamental-frequency ratio (max) among the tones that spanned a particular number of steps with the number of cents in the smallest fundamental-frequency ratio (min) among the tones that spanned one more step; indeed, in such comparisons, the fundamental-frequency ratios differed by at least 20 cents.
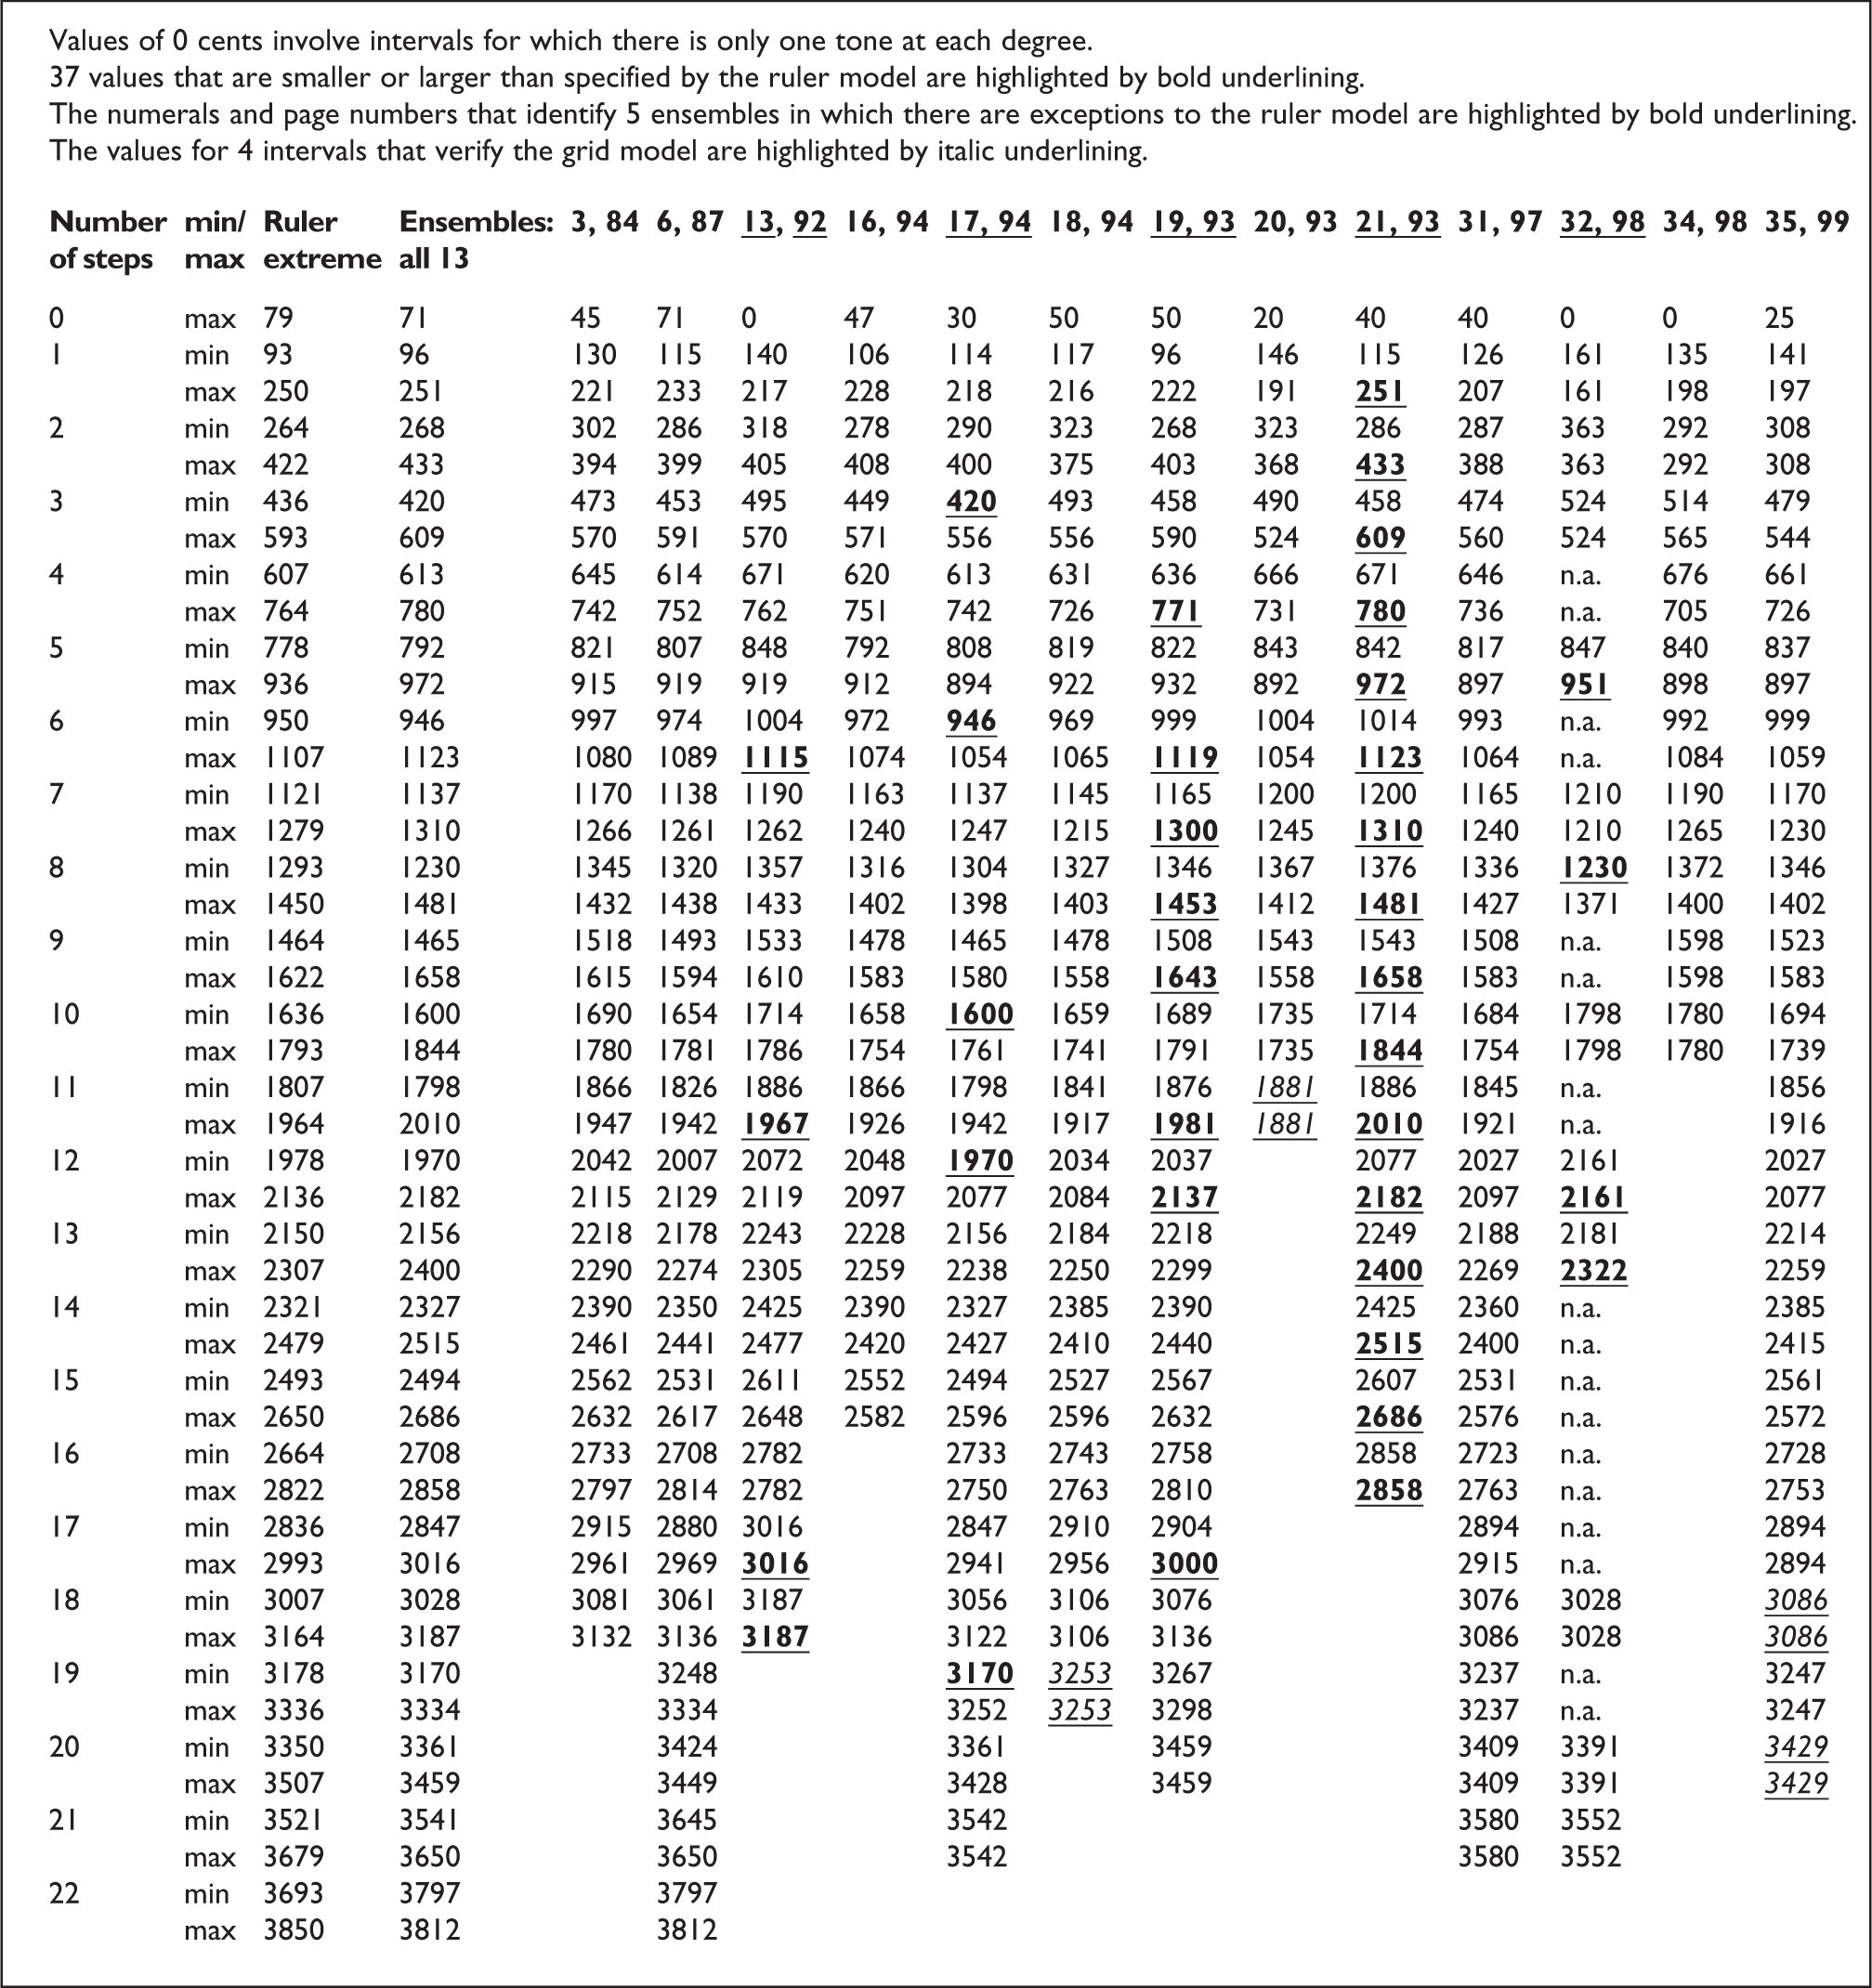
Smallest (min) and largest (max) intervals spanning 0 to 22 steps among fixed-frequency instruments of Thai classical music in 13 ensembles whose fundamental-frequency measurements are reported in Sugree et al. (1997, pp. 81−99).
In Figure 3, the column for “all 13” ensembles shows that whereas the strictly-proper model was verified for each of the 13 ensembles, that is, severally, it was falsified for all 13 ensembles regarded as a single group, that is, jointly. As a consequence, one can regard the verification of the strictly-proper model of intervals that span different numbers of steps as relevant to particular contexts, namely, specific ensembles, rather than as a generalization that would hold absolutely from one ensemble to another.
In contrast to the strictly-proper model of individual ensemble tunings, 37 (17%) of 222 intervals (i.e., paired tones spanning particular numbers of steps) produced by the 13 ensembles falsified both versions of the ruler model (i.e., the version that excluded false positives and the version that excluded false negatives). In particular, these intervals occurred in 5 of the 13 ensembles. For example, in ensemble 32, the smallest 8-step interval’s fundamental-frequency ratio was smaller than the minimum value the ruler model specified: 1,230 cents versus the model’s 1,279 (or 1,293) cents. Finally, none of the 13 ensembles supported the grid hypothesis. Indeed, only four intervals in three ensembles were within the small ranges it would predict: specifically, ensembles 18, 20, and 35.
More challenging was an analysis of 15 other ensembles. Considered at face value, none of these ensembles verified the grid, ruler, or strictly-proper model. In particular, 241 and 143 of the 281 intervals conflicted with, respectively, the ruler and strictly-proper models. Nonetheless, one can trace the sources of the 143 exceptional intervals to 24 (4.6%) of the 15 ensembles’ 542 individual tones, as identified by highlighting in Rahn (2017).
The entries for 10 of these 24 exceptional values were arguably a result of typographical error. For example, the entry “6309 [cents],” that is, above C3, far exceeded the range from C3 to A6. Other arguable typos involved adjacent keys of the typewriter on which the fundamental frequencies were recorded (e.g., 1,928 for 1,028 and vice versa) as well as particular values that were entered one line too high on a particular page. In this regard, Sun, Tang, Zeng, and Greenes (2002) found that the most frequent kind of data-entry errors involved adjacent positions on a keyboard.
Alternatively, placing an entry on the wrong line of the typescript might have been a result of the way in which particular instruments were laid out, for the individual bars of the xylophones and metallophones and the individual gongs of the gong circles can be detached and moved from one position to the next in an instrument’s linear, basically one-dimensional arrangement. In any event, and notwithstanding such arguably ad hoc explanations, the 24 (2.5%) of the 28 ensembles’ 415 + 542 = 957 tones to which the exceptions can be traced are rather few in view of the difficulties involved in recording, measuring, tabulating, and listing the fundamental frequencies of many ensembles, and in comparison with the number of conflicts that result from the ruler model.
In the latter regard, if the 24 tones are excluded from the analysis, each of the 15 ensembles verifies the strictly-proper model, whereas 36 (13%) of the 281 intervals still falsify the ruler model (Figure 4). In total, if these 24 tones are excluded, 28 of the ensembles confirm the strictly-proper model, whereas 9 of the 28 ensembles and 37 + 36 = 73 (15%) of the 222 + 281 = 503 intervals conflict with the ruler model, all 28 ensembles falsify the grid model, and only six intervals verify the grid model: specifically, in ensembles 10, 11, 12, and 36. As well, it should be noted that the fundamental-frequency measurements of the three remaining bands seem to be intractable; that is, no combination of typographical errors and/or exclusion of a minority of the measurements was found that resulted in interval sizes that verified the strictly-proper model or the ruler model. Nonetheless, in order to facilitate a possible future model of their intervals, the spreadsheet in Rahn (2017) displays the raw measurements of these bands’ fundamental frequencies.
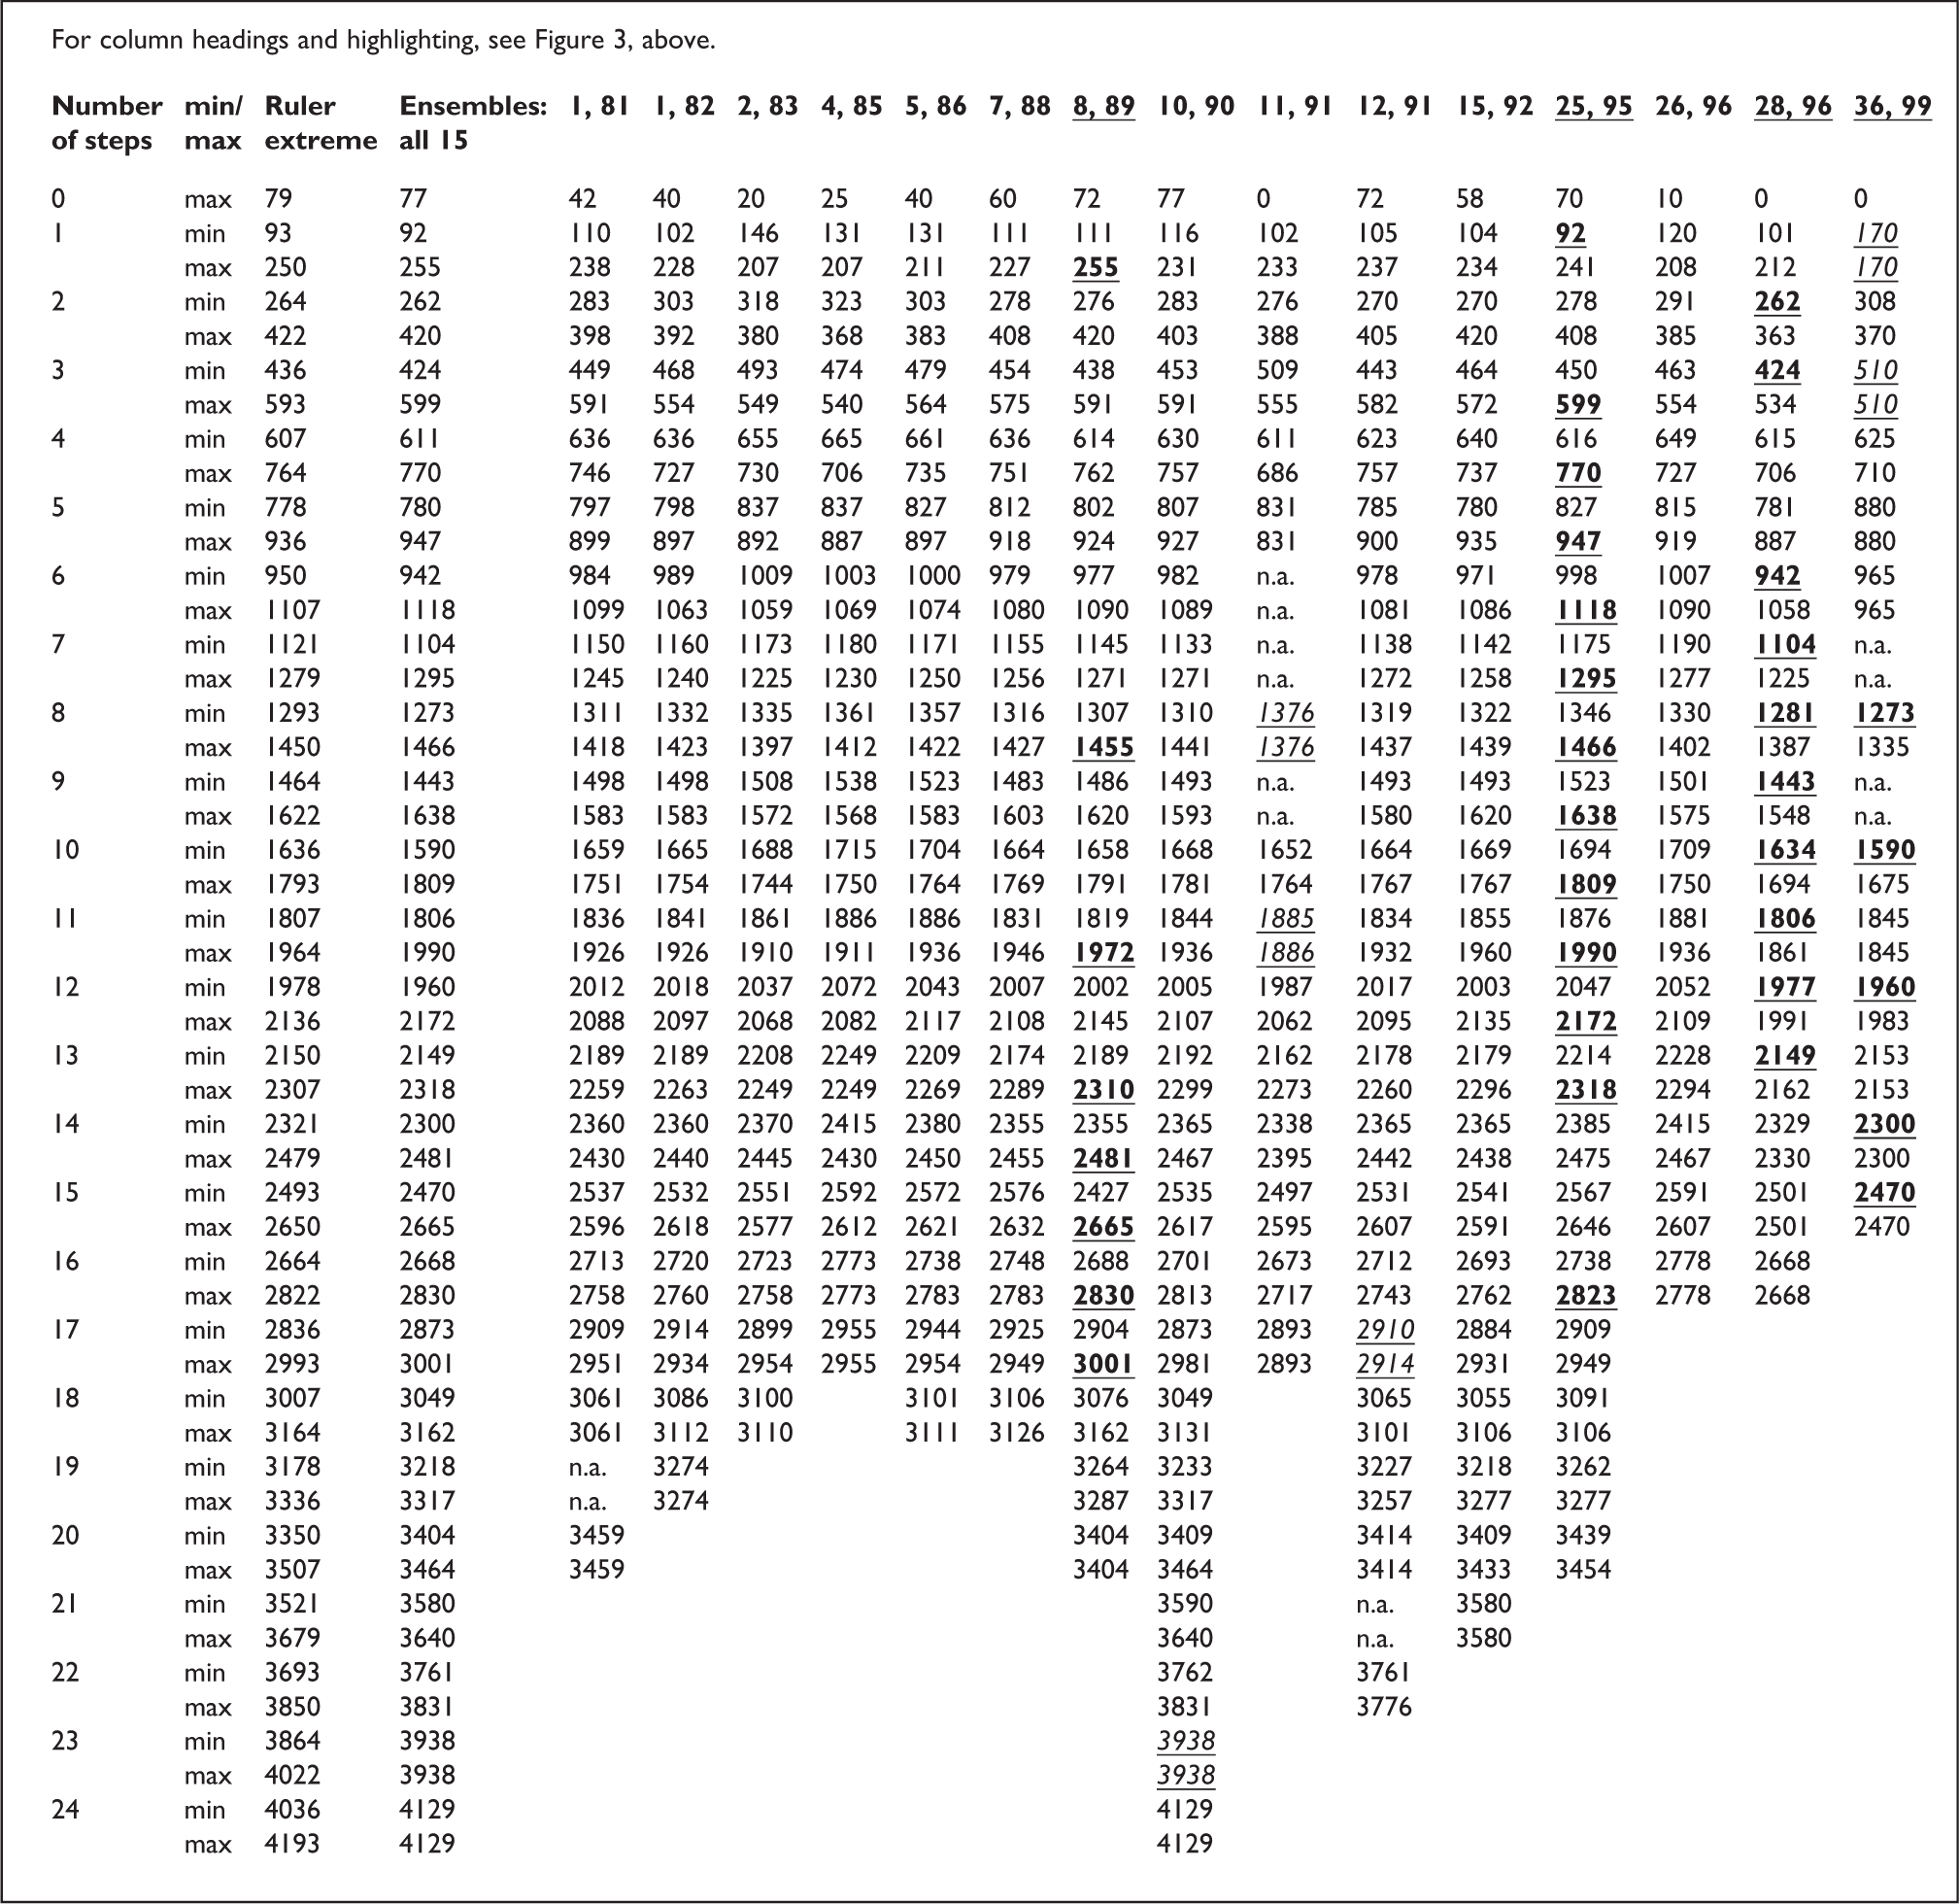
Smallest (min) and largest (max) intervals spanning 0 to 24 steps among fixed-frequency instruments of Thai classical music in 15 ensembles whose fundamental-frequency measurements are reported in Sugree et al. (1997, pp. 81–99).
Finally, Figure 5 shows that among 385 1-step intervals, only 9 (2.3%) are clearly smaller or larger than all of the other 1-step intervals. Further, among the six ensembles in which there are clearly smaller or larger steps, no particular pattern obtains. To be sure, all 9 steps that are clearly smaller or larger than other steps were realized by a pair of single tones, so that their smallest and largest sizes are the same. Nonetheless, such clear contrasts of step size are not an inevitable result of particular steps being produced by single tones, for among the 385 1-step intervals, 113 (29%) were produced in this way. Instead, a clear tendency among the ensembles is for steps to overlap in size, whether their constituent degrees are realized by one or more tones.
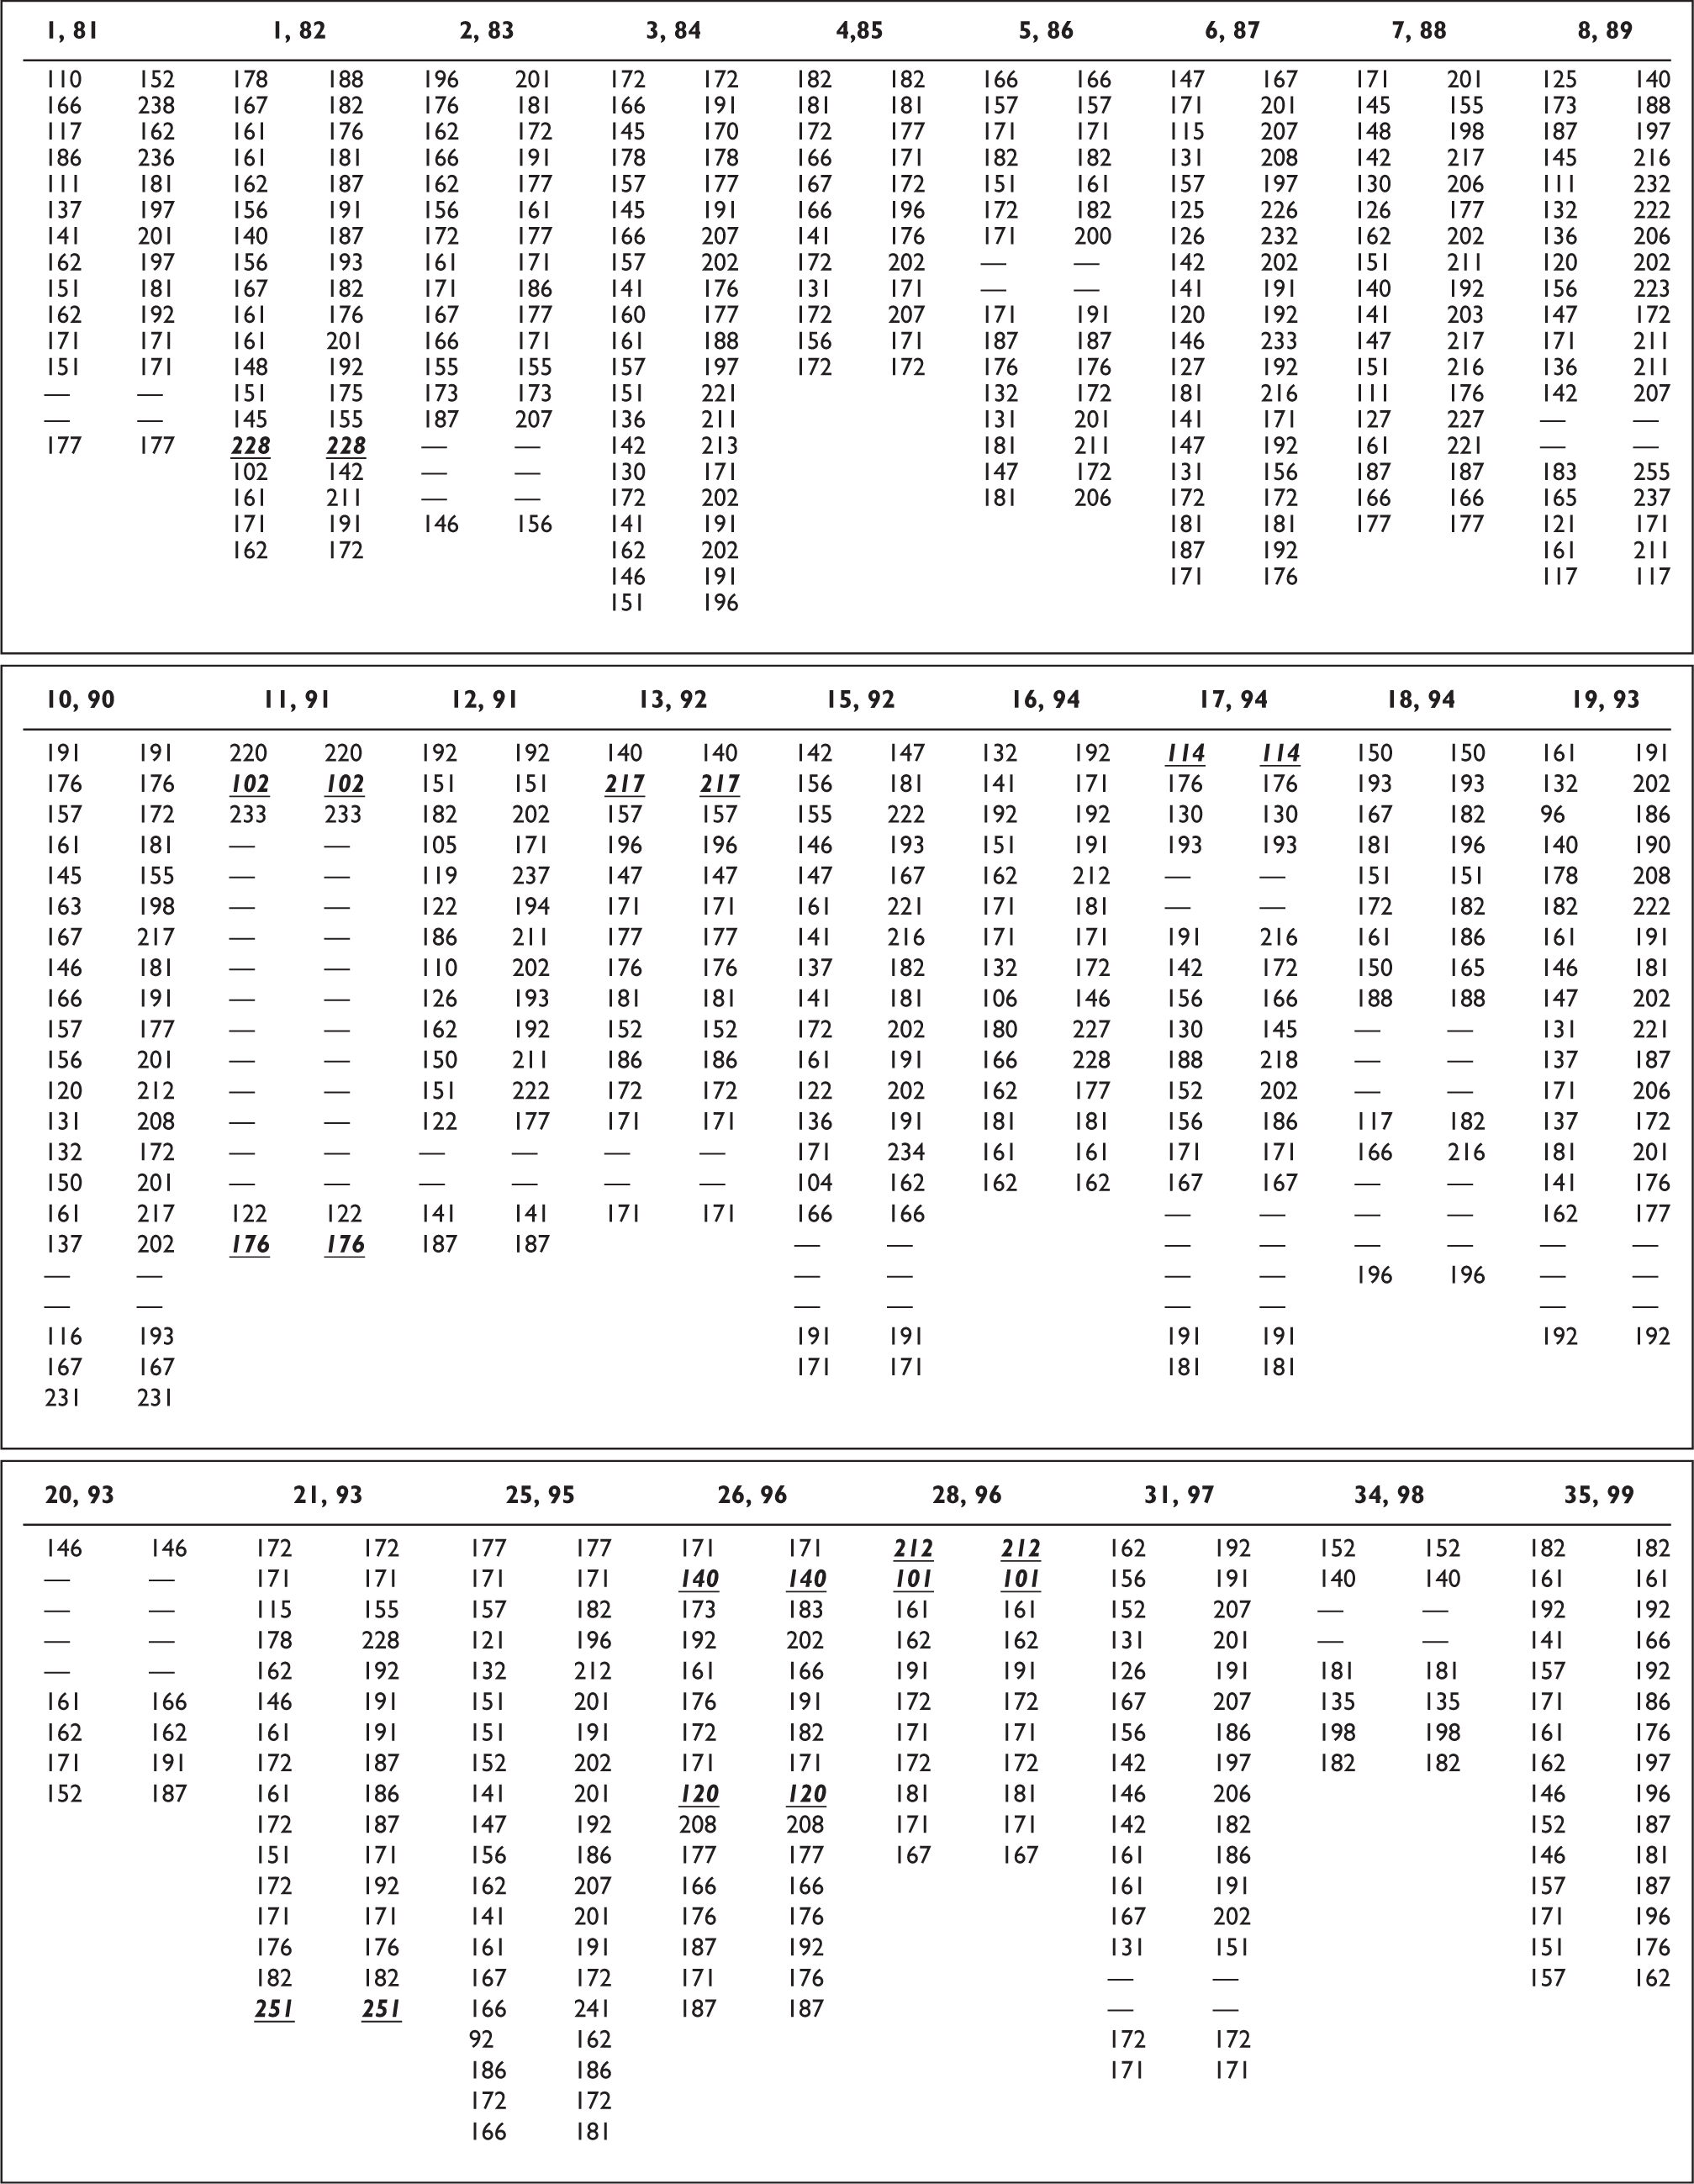
Smallest and largest instances of 1-step intervals among fixed-frequency instruments in Thai classical music ensembles whose fundamental-frequency measurements are reported in Sugree et al. (1997, pp. 81–99). For column headings, see Figures 3 and 4, above. For highlighting, see Figure 2, above.
Discussion
As acoustical entities, the 28 tractable ensembles in Sugree et al.’s (1997) study that comprise fixed-frequency instruments favor the strictly-proper model. Moreover, unlike such strictly-proper structures as various meantone tunings or 24-quartertone rāst, the 28 tunings do not manifest a clear pattern of smaller and larger 1-step intervals. Accordingly, one can re-interpret the “equi-” prefix of the term “equiheptatonic” that has been applied to Thai tunings as conveying a lack of patterning among the tunings’ steps.
To be sure, the present study could be regarded as biased toward the strictly-proper model, for if the grid model is not falsified, the ruler model is not falsified, and if the ruler model is not falsified, the strictly-proper model is not falsified. On the other hand, all three models are falsified to a certain extent, so that favoring one or another is largely a matter of the degree to which one would countenance exceptions. In this regard, the strictly-proper model results in fewer than one “wrong” or “out-of-tune” tone per ensemble, or if 10 of the 24 exceptions are actually products of data entry, as few as one for every two ensembles. In contrast, the ruler model results in almost three—or more than five— times as many anomalies, and the grid model is thoroughly anomalous.
Another factor in favoring a particular acoustical model is its external—specifically, perceptual—validity. This aspect of the models is of relevance to the actual practice of Thai classical music, for traditionally instruments have been tuned aurally, that is, entirely “by ear.” As a starting point for perceptual study, each model could be regarded as implying that tones that are heard as lower have smaller fundamental frequencies. However, as studies of difference limens or just noticeable differences (JNDs) have shown, tones that have smaller fundamental frequencies are not necessarily heard as lower, for in such studies the relationship between acoustically measured values and perceptual responses is generally probabilistic, as conveyed by frequency distributions of responses to particular stimuli (Hartmann, 1996, pp. 3,491–3,492).
With regard to intervals, the models’ perceptual implications would differ. A strictly-proper model would further presume only that one pair of tones which is heard as intervallically larger than another probably has a larger fundamental-frequency ratio. Much less parsimoniously, a grid or ruler model would consider an octave interval whose absolute fundamental-frequency ratio is 2:1 = 1,200 cents to be perceptually privileged a priori, as well as a precise division of such a 1,200-cent interval into equal parts.
To be sure, 7-step intervals in the 28 ensembles tend to be relatively close to 1,200 cents. Stated more precisely, 6-step intervals are not only smaller than 7-step intervals, they are also smaller than 1,200 cents, and 8-step intervals are not only larger than 7-step intervals but also larger than 1,200 cents; in contrast, only 7-step intervals are both smaller and larger than 1,200 cents. Further, simultaneous intervals of 7, 14, and even 21 steps are rhythmically prominent in Thai classical music, coinciding as they do with the tones of a gong and a damped cymbal (chap) in large-scale colotomic structures of duple meter (Morton, 1970, pp. 12–13). As well, simultaneous 7-step intervals are exceptionally frequent in xylophone and gong-circle performance, as is evident in Panya Roongruang’s (2001) detailed edition. However, as Rahn (1983, p. 225) has pointed out, such an idiomatic practice is arguably a matter of contingent design, rather than an inevitable product of 2n:1-ratio hardwiring. One could also regard as similarly contingent the prominent employment of passages that contain pentatonic subsets comprising 1 + 1 + 2 + 1 + 2 steps, duplicated in each register and evident throughout the Thai classical repertoire (Morton, 1976, pp. 24–31, 115–179).
The grid and ruler models could provide a point of departure to determine whether perception of traditional Thai tuning is categorical in a manner parallel to what has been found for European-derived perception (e.g., Aruffo, Goldstone, & Earn, 2014). For such a study, a grid model would provide absolute prototype values and a ruler model would provide absolute border values. In a discrimination task, one would expect intervals close to prototype values to be differentiated from each other less frequently than those close to border values. In contrast, a strictly-proper model does not entail a commitment to such precise absolute fundamental-frequency ratios as 2:1 and 21/7:1. Instead, a strictly-proper model provides for the possibility that octaves produced by the tones of inharmonic fixed-frequency instruments would result in beating and roughness among themselves. Moreover, a strictly-proper model is relevant to individual tunings of entire ensembles rather than being framed in terms of absolute ratios that would hold among several tunings. Nonetheless, like the other models, a strictly-proper model could provide a framework for analyzing an expert musician’s process of tuning traditional Thai instruments. As well, such a process could be documented in “real time” by means of widely accessible audio and video technology.
According to Garzoli (2015), the notion that 7-step intervals span 1,200 cents has been “firmly entrenched” since Ellis’s (1885) study as “orthodoxy.” In contrast, the present study does not presuppose that this notion is true; instead, it takes this notion seriously as a point of departure by framing it in two ways that are subject to verification and falsification, namely, the grid model and the ruler model. Of these, the measurements of Sugree et al. (1997) definitely falsify the grid model. Further, this study does not presuppose that the 1,200-cent interval is a component of putatively “ideal” heptatonic tuning, that is, in the sense that it should be prescribed as the only “correct” tuning. To be sure, the present report employs the term “ideal”; however, it uses this term only in connection with platonistic values of mathematics, not as a description of empirical measurements, for which its models qualify mathematically ideal values in terms of calibration error.
Information that the octave on fixed-frequency percussion is not intended to be harmonic includes Garzoli’s explicit claim (2015, p. 13) that “many tuners do not intend to tune the octave to a ratio of 1:2, but aim for a marginally larger interval” as well as references cited in Garzoli’s larger discussion of this claim (2015, pp. 13–15). In this regard, Garzoli (2015, p. 14) says that electronic tuners are occasionally used nowadays, an observation independently corroborated by Sugree et al.’s (1997, pp. 13, 96) account of the way in which band 30 was tuned and by their actual measurements of the tones it produced. As well, Garzoli (2015, p. 15) has reported that Prasarn Wongwirojruk occasionally uses an electronic tuner. Such a tuner could result in an instance of the grid tuning. However, Garzoli (2015, p. 14) also quotes Panya (1999, p. 65) to the effect that tuners are known to make “small personal” adjustments to equidistance, but how “small” or “personal” these adjustments might be is not specified. Also indeterminate are the following details Garzoli offers concerning Prasarn’s method of tuning: Although the theoretical interval of 171.43 is a factor in his [i.e., Prasarn’s] practice, his tuning is not equidistant. He aims to tune the first six intervals [i.e., steps], ascending and descending from the starting pitch, to his concept of equidistance. The octave is tuned to a slightly larger interval, which is commonly thought to be about 10 cents larger than the other intervals (Garzoli, 2015, p. 15).
None of this testimony is documented by direct transcript or supported by measurements of tones produced while such experts are actually tuning or re-tuning their respective ensembles. Moreover, none of this information would falsify the ruler model, which allows for much greater variability, e.g. 1,200 ± 85.7 cents, than a usual construal of what “about 1,210 cents” would refer to. Further, none of this testimony would falsify a strictly-proper model, which, as such, does not constrain the 7-step ratios’ sizes. Most important, the present study has tested both the ruler model and the strictly-proper model empirically, the latter resulting in far fewer discrepancies with actual measurements than the former.
Footnotes
Declaration of conflicting interests
The author declared no potential conflicts of interest with respect to the research, authorship, and/or publication of this article.
Funding
The author received no financial support for the research, authorship, and/or publication of this article.
Peer review
Andrew Milne, Western Sydney University, MARCS Institute for Brain, Behaviour & Development.
John Garzoli, Monash University, Sir Zelman Cowen School of Music.
Pablo Padilla, Universidad Nacional Autonoma de Mexico Facultad de Ciencias, Institute of Applied Mathematics.
David Hughes, SOAS, University of London, Department of Music.