
Abstract
Audience motion is a defining component of the face-to-face concert experience. Motion is also a common component of individual audience members’ reactions and actions to live performances. This article investigates patterns in chest-mounted accelerometer measurements from audience members at a chamber music concert experiment. The aim is to contextualize their behavior during music performance using a sequence of exploratory analyses. Combining insight from subjective reports of audience motion; musical, environmental, and biological frequencies; and similarity of motion timing with neighbors or more distant participants, both in-hall audience participants and live-stream viewers show two distinct music–motion patterns: either unobtrusive dynamic stilling or noticeable tempo-matched bouncing. Audience motion outside of music, during applause, speeches, or survey writing, also shows distinct average quantities of motion and degrees of shared information between seat neighbors, prompting a discussion on the constrained opportunities for audience action and social interaction at live classical concerts. Although exploratory, these extensive analyses provide a useful foundation for future work to further understand audience behaviors in concert music settings and beyond.
Introduction
Motion is often expected from music audiences, with synchronized motion posited as a central mechanism for the social bonding benefits of this evolved cultural practice (Savage et al., 2021). Yet Western classical music audiences are known today to be restrained in their physical responses during a performance, staying still and quiet in their seats while the music program is presented. From survey responses and chest accelerometer measurements on face-to-face and remote audience participants at a live chamber music concert experiment, this article employs a sequence of exploratory analyses to consider the quantity and coherence of group motion to music, speeches, and other events, and to demonstrate two categorical distinct music–motion relationships performed by the same audience to different pieces. As a complement to studies of music and movement under more constrained conditions, this article also considers social and spatial factors potentially contributing to this audience's behavior in an ecological concert setting.
Listener motion to music has been measured across many circumstances: with explicit prompting (Burger et al., 2018), without direction (Dotov et al., 2021; Swarbrick et al., 2019), and even under instruction to suppress movement (Gonzalez-Sanchez et al., 2018). Within these paradigms, several factors have been recognized as encouraging listener motion to music. For example, music in a certain range of rhythmic complexity and groove qualities has been found to prompt both a greater desire to move and changes in listeners’ movements such as postural sway with less frequency variability (Ross et al., 2016), more head motion (Dotov et al., 2021), and more total involuntary micromotion (Gonzalez-Sanchez et al., 2018; Zelechowska et al., 2020). Live performance and a fan's investment in a performer can also encourage more vigorous motion, at least for rock music (Swarbrick et al., 2019), while seeing others in the audience can encourage more motion and more synchronous motion—even to recorded music (Dotov et al., 2021).
Quantitative studies of how people move together have usually focused on coordination in their active gestures: swaying while playing in an ensemble (D’Amario et al., 2023), manipulating objects in parallel (Calabrese, 2021), or grooving habitually to the right genre or context (Swarbrick et al., 2019). For these strongly rhythmic genres of music, listener motion is expected and seems hard to resist, but what about styles of music that do not ask listeners to dance? In such cases, expectations for audience movement are less clear. For example, the average involuntary micromotion to an excerpt of Indian classical music was found to not be significantly greater than the motion recorded during periods of silence, at least in listeners less familiar with the genre (Gonzalez-Sanchez et al., 2018; Zelechowska et al., 2020). Looking for shared information in the motion of audience members who are sitting quietly is a different kind of challenge.
Visual exposure to the motion of others, whether in line of sight or in the periphery, has been found to influence posture shifts and oscillatory motions (Richardson et al., 2007; Varlet et al., 2011), even without explicit instruction to synchronize or the presence of music. Interpersonal synchrony can be modulated by liking and affiliation, with preexisting rapport facilitating mimicry (Lakin et al., 2003). At the same time, coordinated synchronous action (such as tapping together) has been found to encourage a sense of affiliation (Hove & Risen, 2009). Even restrained concert settings may allow both unintentional (or un-attended) motion coordination and deliberately interactive motion between audience members with potentially positive social results.
Two studies that quantified audience motion in performances where quiet sitting was expected behavior found some correlates with experience. Audience motion measured with video of participants’ hands and upper body during a contemporary dance show found that the audience tended to move very little Theodorou et al. (2016), with even less hand motion to the pieces that were most preferred (Theodorou & Healey, 2017). This lack of motion during stage performance is consistent with good audience etiquette in contexts where stillness is interpreted by performers, audience members, and third-party observers as evidence of engagement (Healey et al., 2022; Theodorou et al., 2019; Upham et al., 2024). A study looking for temporally loose synchrony (offsets of up to 2 s) in video-tracked quantity of motion between people at a classical music concert found mild coordination between audience members but not between the audience and performing musicians (Seibert et al., 2019). Comparing the quantified shared motion of these audience members with the ratings of their musical experiences, a negative relationship was found between more synchrony in the quantity of motion change and absorption and between more synchrony and the feeling connected to the musicians. When stillness is the norm, coordination may be more a product of frustration—a cascade of distracted and distracting fidgeting—rather than the enjoyable deliberate interaction found with other musical activities. These video-based measures of audience members’ motion are very different from the accelerometer measurements used in this study; however, they demonstrate that structure in audience motion is not always desirable during live performance.
Regardless of how unobtrusive audience members may be while music is being performed, classical music concerts are social gatherings, at least for the people attending in person. Conventional concert activities allow for different degrees of interaction between audience members. One can expect the audience to be measurably more active during rounds of applause and when they are filling out paper questionnaires, but how might proximity or familiarity affect how they interact during these tasks? At what times during a concert does the audience move the most, or with the highest level of coordination?
Using chest-mounted accelerometry, we examined more closely the temporal patterns of audience members’ active gestures of appreciation and involuntary micromotion across concert events and in conjunction with social and spatial factors. This article reports the findings of an exploration of these accelerometer data in conjunction with other related measurements, including subjective assessments of audience motion, concurrent audio, and social relationships between participants. Figure 1 provides an overview of the data types, analyses, and arguments to help readers navigate the article structure. Through five analyses, we identify two distinct music–motion relationships performed by these audience participants, put audience motion to music in context with other types of crowd activities, and argue for a richer investigation of changeable audience dynamics within and beyond classical music concerts.

Summary of project structure and the flow of information through the article from measurements down to conclusions. Data sources and initial treatments at the top (rounded elements) all described in the Experiment section, going into the five Analyses subsections (purple rectangles with bold titles), and then down into the four Discussion subsections (blue boxes with bold titles) with information from related articles already published on this experiment (white pages) and finally into the Conclusions and considerations for future concert research (green hexagon and clouds).

Left: Demonstration of mobile phone holder and sensing device position. Right: Depersonalized image of the audience. Circled are sensors worn by visible audience participants in first row.
Experiment
This concert experiment was an intimate chamber performance by the Danish String Quartet (DSQ), hosting less than 150 people in a small hall with a low stage, including over a dozen researchers. A professional, multi-camera live stream of the concert performance was also broadcast on YouTube for a remote audience. On entering the physical venue (or starting the live stream), audience members were invited to participate in the research component of the concert experiment. The experimental elements were developed through a collaboration of researchers investigating concerts from many disciplines and with many tools for questions ranging from performer motion and cardiac activity to live music visualization, with audience behavior and experience in between (Danielsen et al., 2023). Audience members at the concert hall who consented to participate in data collection shared their experience by self-report in paper questionnaires and by wearing on their chest either their own mobile phone with the MusicLab app recording sensor data or a small Axivity AX3 sensor device (see Figure 2). Audience members attending remotely were shown instructions on how to participate by downloading the MusicLab app to answer their own questionnaires and also how to wear their phones during the music to share body motion. Depersonalized measurements from the audience and archival information about the performance have been made available through an open science foundation repository (Høffding et al., 2021).
Audience participants were asked to complete six questionnaires in English or Danish: one before the concert with demographic questions, familiarity with the performers, seating arrangement, and musical background, and then a set of questions after each of the four sections of the performance and some additional trait assessment scales after the show. The four post-stimulus questionnaires asked about their experience of the preceding performance including their awareness and judgment of audience member motion. In-hall participants’ motion was captured continuously during the concert experiment except when some participants paused the MusicLab sensor recording during the intermission. Remote audience participants activated the MusicLab app for themselves to record motion during synchronization taps (per instruction) and during the music pieces. Many then paused the motion recording to answer parallel questionnaires presented within the same app. For a more thorough description of the questionnaires and responses with comparisons to their total quantity of motion, please see the accompanying article (Swarbrick & Vuoskoski, 2023). This article will only directly use their social, spatial, and motion judgment responses.
In the first half of the concert, the DSQ performed Beethoven's String Quartet No. 16 in F Major, Op 135 and Schnittke's String Quartet No. 3 without additional technology on stage. After the intermission, the quartet returned to the stage wearing optical motion capture suits and pupillometry glasses and performed J. S. Bach's Contrapunctus 14 BWV 1080: Fuga a 3 soggetti (the last fugue of Die Kunst der Fuge) and a set of Nordic folk tunes arranged by quartet members. Additionally, the Bach fugue was presented with a projected visualization of the performance on a screen beside the stage. A more detailed description and discussion of the music can be found in the article introducing the stilling response (Upham et al., 2024).
While some elements of the experiment did intrude on the chamber concert experience, the quality of music presented and the characteristics of the live attending audience were comparable to performances without a scientific agenda, as explained below.
Audience Participants
Audience participants were recruited from those already attending the performance. The concert had been advertised as a collaboration between the DSQ and researchers, but not all attendees were aware of the experimental elements before arriving. In-hall concert attendance was ticketed, and the live stream was available to watch for free. All attendees were invited to participate but no compensation was offered for participation, and those that declined were not prevented from attending. Of the in-hall audience, two-thirds chose to participate (91 of 135 audience members). Of those, 85 participants’ motion measurements were sufficiently complete to include in this analysis; 46 of the online viewers also chose to share their experience through the MusicLab app, with 30 of those reporting enough motion data to be analyzed here.
Audience participants reported some demographic information, musical background, and social relationship information in the initial questionnaire. Full questionnaire responses are available in the project's OSF repository and described in other articles on this same project. The following describes those from whom sufficient motion measurements were collected:
Age: In-hall participants’ ages ranged from 19 to 84 years, with a median of 58. Remote participants ranged from 22 to 71, with a median of 42 years. Fan status: On a scale from “Neutral listener” (1) to “Big fan/Admirer” (7) of the performing musicians, half of the in-hall participants selected the maximum value and 82% reported 4 or more. Remote participants had proportionally more “Neutral listeners” (35%); however, a majority still reported 4 or more. Personal relation to performers: 18% of in-hall participants and 13% of remote participants reported being a relative or friend of the performers. Musician status: Most of in-hall participants (55%) identified as “Music-loving nonmusicians” with 22% reporting being serious amateur, semiprofessional, or professional musicians. In contrast, 65% of remote participants fell into this latter range of musicianship and only 12% identified as any kind of nonmusician.
Besides these trait characteristics, participants rated their familiarity with each piece after it was performed. A majority (In-hall: 72%, Remote: 62%) reported being at least somewhat familiar with at least one part of the program (4 or more on a scale from 0 to 6), and similarly many were also unfamiliar (0 or 1) with at least one piece performed (81%, 53%). Complete distributions for these demographic details are reported in Supplementary Materials Part 2, Figures 3 and 4.
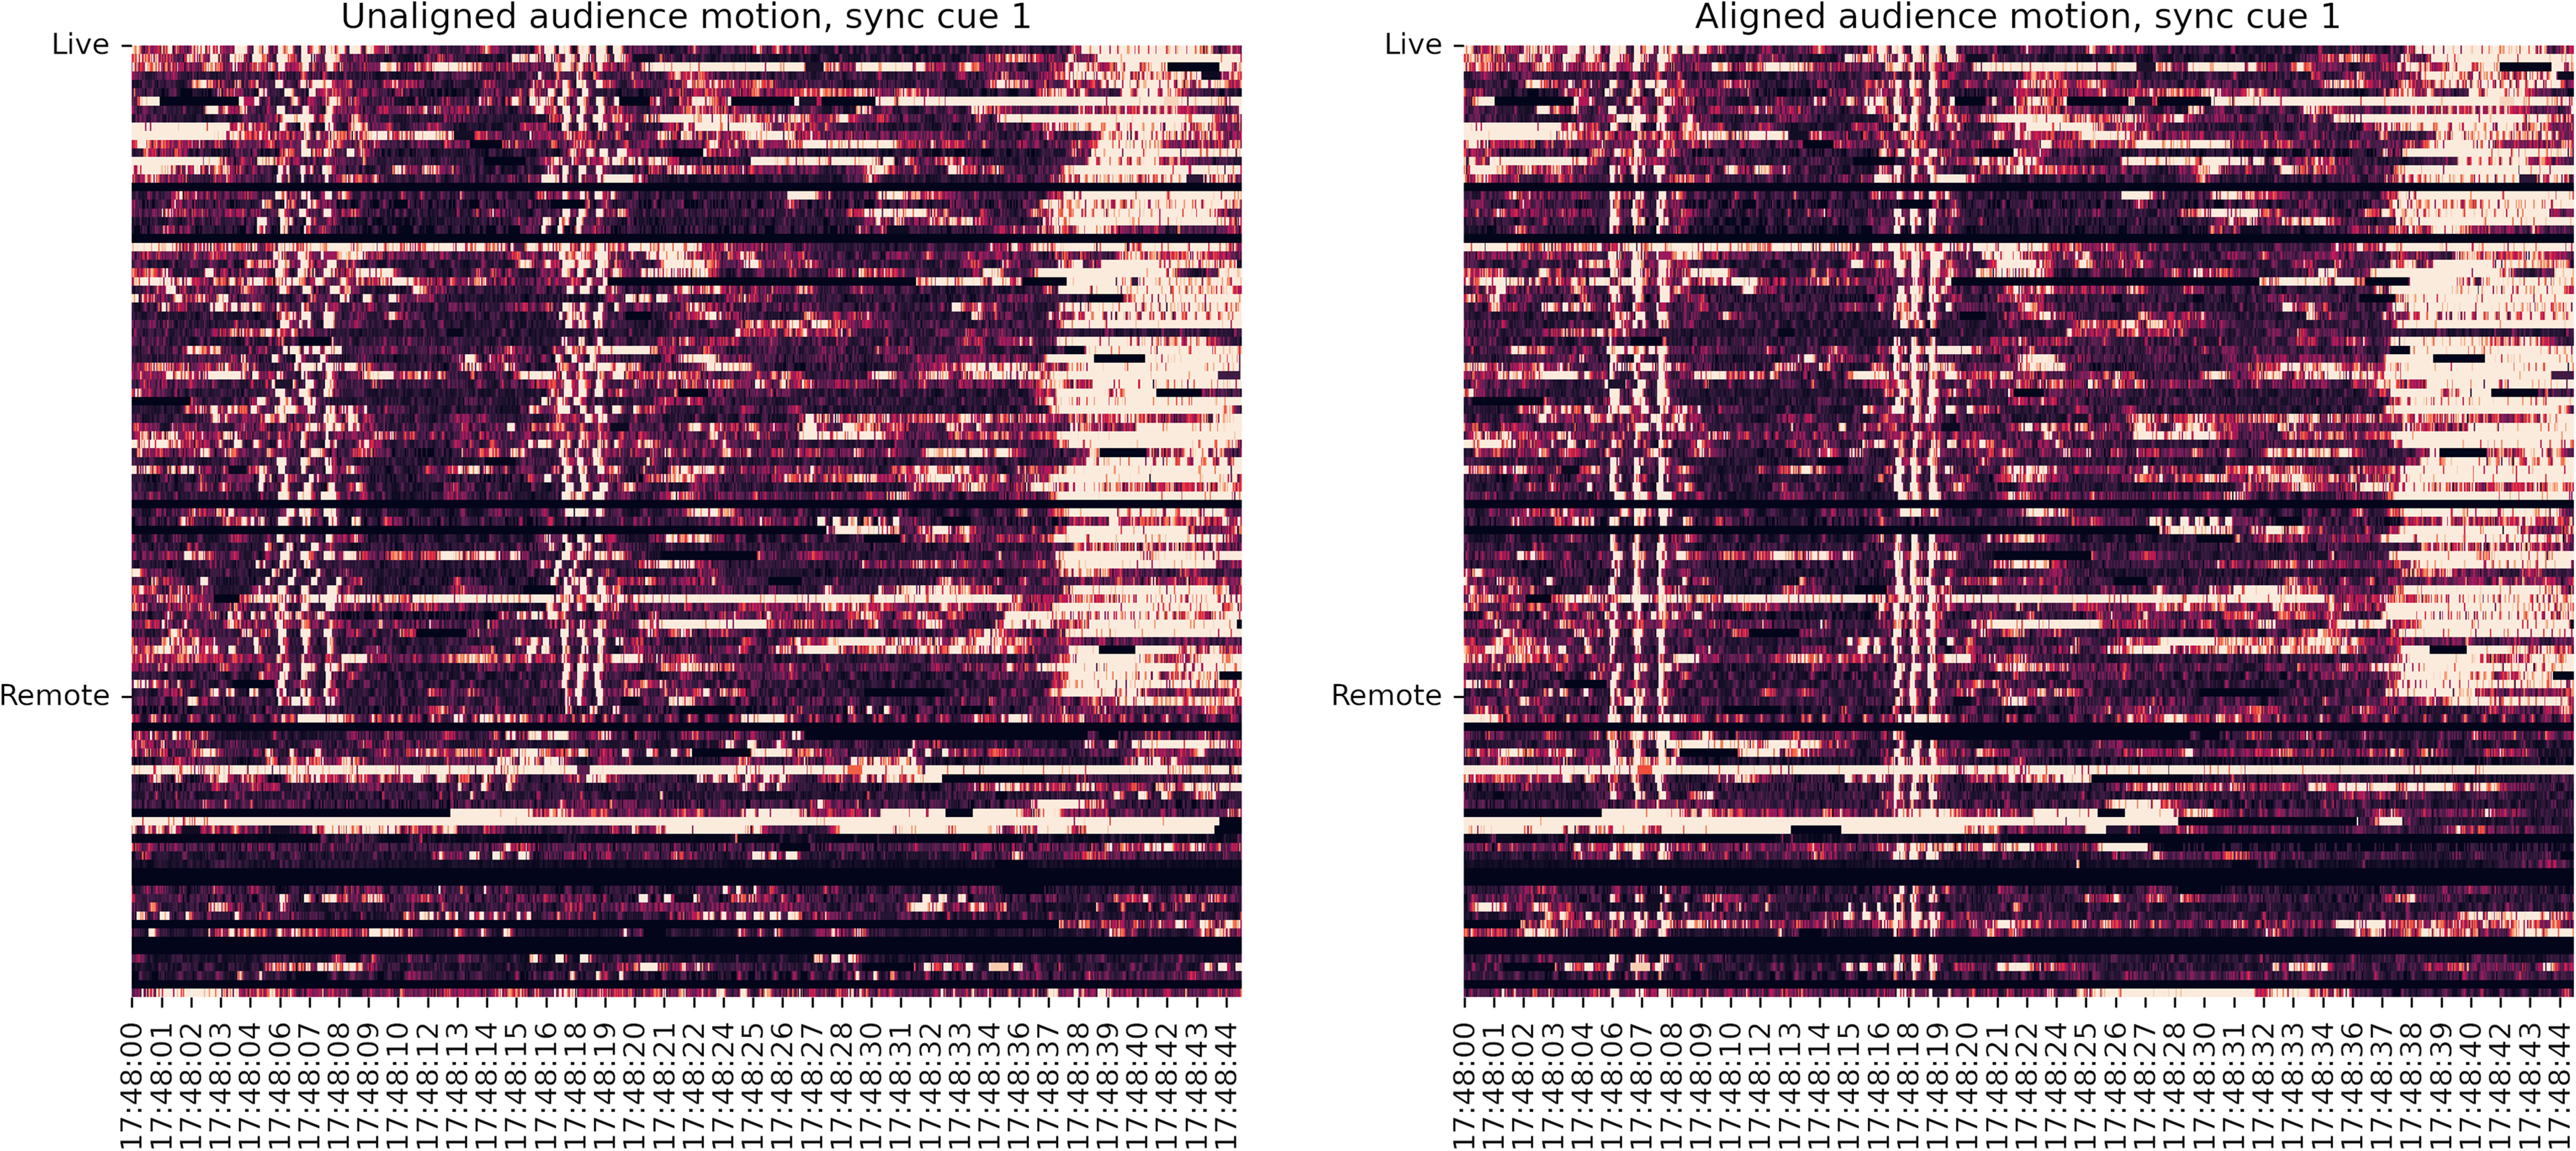
Rows of continuous quantity of motion measurements from individual audience participants, Live/in-hall (above) and attending remotely (below) around the time of the first synchronization cue. Left First set of synch taps in original device clock time. Right Synch taps after correcting timestamps to common concert time. The spectrum here ranges from dark (little jerk) to white (high jerk), thresholded to facilitate tap visibility. The wave of white shortly after the taps is the in-hall audience's applause before the musicians begin to play the Beethoven quartet. The timestamps are in universal time code (UTC).

Above: Rows of the continuous quantity of motion measurements from individual audience participants, in-hall (above) and attending remotely (below) during the full duration of the concert experiment (2:30:43.3). Motion intensity reported in clipped gray scale with the concert segments marked by overlay shading. Various technical issues resulted in intermittently dropped measurements (jagged horizontal stripes). Middle white space corresponds to the interval. Below: Median quantity of motion measurements across remote audience (gray) and in-hall audience (black) throughout the performance. The beginnings of concert events evaluated (all ≥ 60s) are labeled on the x-axis.
In combination, the majority of the in-hall and remote audience participants appeared to be experienced with classical music culture generally and with this concert's musicians specifically, but not to the point of knowing this particular program by heart.
Concert Audio and Concert Event Types
The concert experiment performance lasted approximately three hours, including an intermission halfway through. During each half, different types of activities or events took place. Some of these were typical for chamber music concerts; others were specific to the experiment, such as instructions to participants or time given to fill out survey questionnaires. This article focuses on four types of concert experiment events, given the motion and interactions they allow. Note: while some occur frequently in short bursts, only events lasting at least 60 s have been counted for evaluation:
Music (4 segments, 14 pieces) Intervals during which music was performed. There were four segments of music, a Beethoven string quartet (4 movements), a Schnittke string quartet (3 movements), J.S. Bach's Contrapunctus (1 movement), and a set of Nordic folk music arrangements (6 works). Survey (4 post-music) Intervals after each music segment when audience participants completed the designated survey questions. Speech (4 instances) Intervals when the audience was addressed by a musician or the concert experiment's Master of Ceremonies (MC) from the stage, explaining the pieces to be played, the scientific activities, or conveying instructions. Applause/Claps (2 instances) Intervals when the in-hall audience was actively applauding for more than a minute, specifically before the intermission break and at the end of the performance.
A recording of the live stream broadcast (audio/video) was used to identify the onset of each concert segment. Music intervals began when the musicians’ postures were set for playing, speeches from the first word uttered into the microphone, and applause from the first audible clap. The survey intervals began when either instructions were given to fill out the surveys or the clapping ended (after final applause), and survey interval motion was only evaluated over an estimated minimum time needed to complete the questions (4 min generally, 2 min for Survey 3).
These different phases of the concert experiment also reflect different conditions of attention and opportunities for action/reaction/interaction in the audience. During applause, audience participants are expected to collectively move a lot and produce noise that is heard through the hall, and then individually stop clapping until the round has ended. During the speeches and instructions, the audience is expected to be generally quiet and attentive to the speaker. However, there may still be some freedom to react audibly (e.g., laughter) and interact discretely with the people around them with shared looks and quiet comments, or to prepare physically for the next event (e.g., settle into their chair). While completing the survey questions, participants are again actively moving, though more modestly and independently than during applause, as they read questions and mark answers in their own time.
The audio of the recorded live-stream also offers an opportunity to compare the sound of concert events with the motion of the audience. For the most direct comparison, the audio amplitude envelope (RMS) was downsampled to match the audience motion time series (10 Hz) and cut to match the identified concert events. Note that the audio from the live-stream feed is not a direct measurement of the sound in the hall, instead reflecting the priorities of the stream producer for the remote audience. Crowd noises can be heard during intervals of applause and scattered babble while filling out surveys, but otherwise, the audience is not prominent in the mix.
Audience Motion Measurement
Most of the participating audience shared their motion during the concert by using the MusicLab app on their own mobile phones. While in motion recording mode, and with permission from the phone user, this application records measurements from the mobile's internal accelerometer, gyroscope, and geolocation sensors (Swarbrick et al., 2022). These streams of sensor values were transmitted to a secure server every 60 s with timestamps recorded in Universal Time Code (UTC) rather than the mobile phone's local time to facilitate alignment of measurements from remote participants watching the live-stream in other timezones. Measurements from mobile phone accelerometers were usually sampled at around 60 Hertz, although there was some variation in the regularity and rate of the data collected, described in the preprocessing section below. Participants at the concert hall that could not or preferred not to use the mobile phone app were given small accelerometer data loggers (Axivity's AX3) to wear in a similar fashion.
In-hall participants wore their accelerometer sensors (phones or experimenter-provided dataloggers) on their chests with the use of an adapted phone holder hanging around their neck (see Figure 2).
Each holder was adjusted to lie the sensor device flush to the wearer's chest just a few centimeters below the suprasternal notch. This location is high enough to position the device stably against the wearer's upper rib cage on a variety of body shapes. App-using participants wearing open-necked shirts were given cardboard slips to cover their phone screens to prevent accidental screen touches that could disrupt the app's operation. Live stream concert attendees were directed to instructions on how to construct a comparable holder from common household materials and asked to wear their phones around their necks or in a breast pocket while music was being performed.
Accelerometer Data Preprocessing
Alignment
Accelerometer sensor recordings were aligned with the help of an auditory synchronization cue broadcast in the hall and over the live stream. Participants were instructed to listen carefully to two isochronous sequences of six beeps (at 60 and 80 beats per minute (BPM)) and to tap with the last three beeps of each sequence directly on their sensor devices. This procedure makes use of participants’ ability to entrain to a beat, allowing more accurate simultaneous taps on their sensors than a single prompt to tap. At the same time, the temporal and tempo offsets between the two sequences define a larger interval of measurements to robustly identify alignment despite common variations in tap production. Figure 3 shows how the participants’ taps produced identifiable peaks in a one-dimensional reduction of accelerometer measurements that allowed us to improve intra-device alignment.
This synchronization procedure was performed before each half of the concert. Supervised detection of recorded taps improved alignment from a few seconds spread to within 200 ms for in-hall participants’ measurements, and virtual participants’ devices from minutes apart to within 2–3 s throughout the full concert (see the data repository or conference paper for a more explicit description of the alignment procedure (Upham, 2023)).
Comparability of Measurements Between Devices
These measurements from chest-mounted accelerometers are not easily normalized between participants. Each recording captured an unspecified mixture of gestures, combining traces of displacement from the core body, head, and limbs. The distributions of the measured acceleration values may reflect real differences in the shape and frequency of motions performed by individual participants over the course of the full concert. Participant-wise normalization could substantially distort the signal values and noise-floor because of real signal differences in each time series.
Besides capturing acceleration from displacement, accelerometers consistently report gravitational pull, with the average magnitude of acceleration felt by a stationary sensor equating to
The AX3 devices report acceleration in units of gravity (
Measurement Gaps and Resampling to 10 Hz
After assigning new aligned timestamp values to the original measurements, all accelerometer measurements were resampled on a common fixed sample rate for analysis. The mobile phones’ sample rates were intermittently unreliable. For all mobile devices, the most common sample period corresponded to a 60 Hz rate, however an array of larger gaps between samples were recorded for reasons that are not easily identified after measurement. About one-third (38) maintained a sample period of under 20 ms, with an additional 17% of devices showing fewer than 0.4% of samples following gaps of 40 ms to 1000 ms. Across devices, the median number of gaps between 1 and 9 s was 78, ranging from 0 to 175. The median estimated total data lost was around 4 min (227 s) per device; however most of those gaps were small: less than 100 ms. Supplementary Materials, part 1.1 reports further information on gap handling.
Given the limits of alignment quality between these measurements, it seemed most practical to downsample these audience measurements to 10 Hz. While insufficient for measuring coordination quality between performing musicians, this rate is still fast enough to catch the audience's typical musical behaviors at rates of up to 5 Hz (300 BPM). However, because of the frequent irregularities in the original time series, this resampling was not performed after a preparatory low-pass filtering. The remaining noise is specifically useful for some analyses to follow.
After quality control for alignment and recording duration (at least one of four segments of the program recorded), we are left with audience motion measurements from a total of 85 in-hall and 30 remote participants.
Due to differences in app use between in-hall and remote participants, many of the analyses to follow will only use the motion of the audience members in the same room as the musicians. The data of the remote audience participants is included only when specified.
Quantity of Motion for Motion Detection
After alignment, device-scaling, and downsampling, the accelerometer measurements were reduced to a simple unidimensional measure to report when and relatively how much these participants were moving. These quantity-of-motion time series were calculated from the magnitude of the first-order difference on the three-dimensional sensor values, explicitly the instantaneous magnitude of jerk. With acceleration per sample time

Because these measurements were taken from the chests of seated participants, they described acceleration and jerk within a strongly constrained system. Like a pendulum, any motion away from stability must be followed by a return to it because these bodies are tethered to their seats. This condition allows the magnitude of jerk to function as a monotonic correlate to absolute velocity. Thus, we treat these one-dimensional reductions of accelerometer measurements as quantity of motion (QoM) time series: a feature capturing when participants move more or less, ignoring orientation or trajectory. This calculation and use of accelerometer sensor measurements are quite different from instances where this kind of sensor is used in more complex and integrated motion tracking. For our purposes, these unsmoothed measurements sufficed. The resultant instantaneous quantity of motion time series are plotted row by row in Figure 4.
Scaling Average QoM
Some of the following analyses use participants’ average quantity of motion over specific segments of the concert experiment. To facilitate the interpretation of figures, these values have been scaled by the average quantity of motion across the in-hall audience participants during all speech intervals (green in Figure 4). Values below 1.0 are lower than the average quantity of motion while listening to the MC or when musicians addressed them from the stage. QoM values above 1.0 report intervals when the audience, on average, moved more than they did while listening to speeches.
Controlling QoM Time Series
While the frequent small gaps are mostly missed by the downsampling process, there are longer intervals of missing data due to device failure and participants independently turning off motion measurement on their phones. The analyses using the QoM time series only include measurements from participants with signal for at least 75% of the duration of the event. Further controls for missing data are reported per analysis.
Subjective Ratings of Audience Motion
Besides measuring audience body motion with sensors, participants were asked to report their awareness of their own bodies and movement in the audience during the music performances. These judgments were reported as part of survey questions answered after each quarter of the music program.
The first question (“Were you aware of your physical body during this piece?”) functioned as a check on the interference of observation on their behavior. If participants moved systematically more or less with self-consciousness, that could be a constraint on generalizability to audience behavior outside of these measurement conditions.
Audience behavior is contingent on their expectations of what is acceptable in a specific concert setting. Participants’ evaluations of their own and each others’ movements were requested in explicitly normative terms to give a functional scale to the measurements captured. These judgements were solicited with a compound question: “Were you aware of [your own physical movement, others in the audience moving] during this piece? If so, how much did [you, they] move relative [to your own usual behavior, the usual behavior you observe] at this kind of concert?” To this, they selected one of: Not aware of movement, Less than usual, A normal amount, or More than usual. These questionnaires were available in English and Danish for both participants in the hall and those attending remotely. Some of the reported figures used contracted versions of these questions for legibility.
In-Hall Participants’ Locations and Relationships
In-hall attendees were lightly encouraged to sit toward the front of the hall as they arrived, while allowing them to make the final call of where to sit and with whom. Their seat numbers were recorded on their questionnaires and again by the concert ushers. During the concert, a note was also taken of seats filled by non-participant audience members and left empty. The reconstructed map of audience member locations in Figure 5 made it possible to consider shared patterns in participants’ motion given their relative positions in the hall.
When audience members are expected to be silent, between-participant influence on movement timing is assumed to be principally visual. Comparison of motion between audience members by distance was limited to pairs within a few seats of each other. Proximity was counted categorically by the degree of potential contact, and Table 1 reports the total number of pairings across the 85 participants with usable motion measurements by three tiers of proximity:
Adjacent: participants seated directly next to each other in the same row. In front: participants in sequential rows, one seated in front of the other. Staggered seating allowed up to two participating audience members to be positioned in a participant's line of sight to the stage. Near: participants positioned one seat apart, whether beside, in front, or behind.
Number of in-hall audience participant pairings by distance category and social relationship (Family, Friends, Strangers).
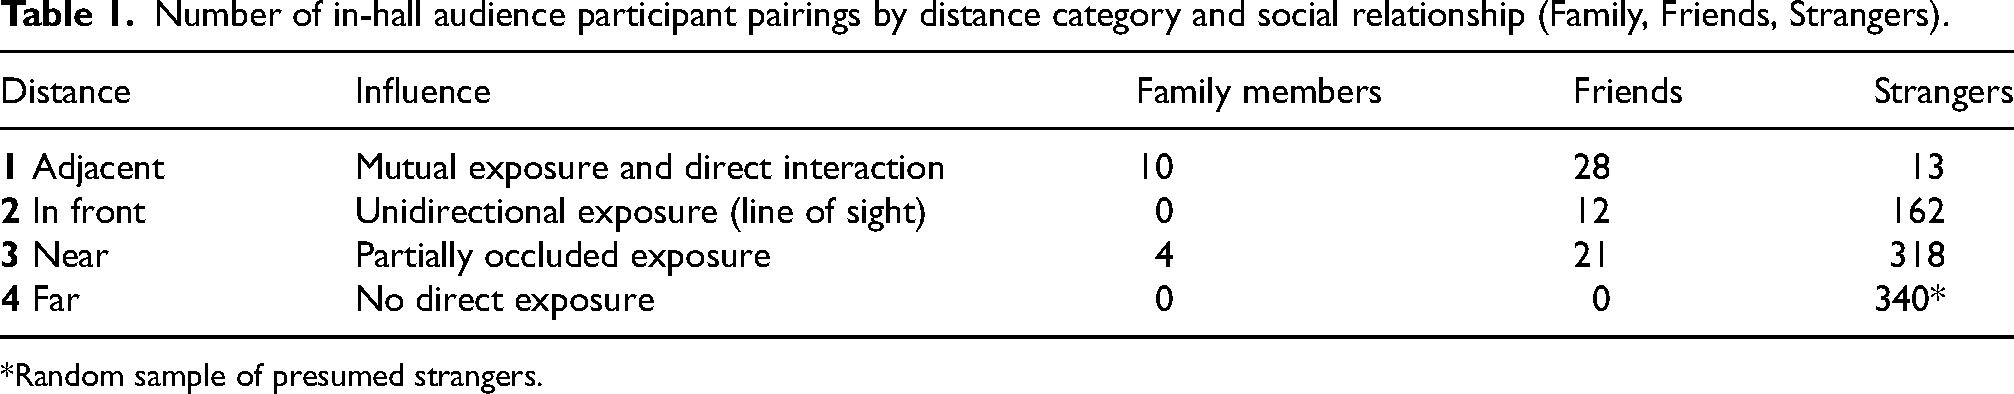
*Random sample of presumed strangers.
We identified a total of 568 pairings with potentially measurable mutual influence out of 6972 combinations across all participants. As a control for these direct influence conditions, we also constructed a “Far” condition by taking a random subset of pairs more than two seats apart.
In the pre-concert questionnaire, participants also reported whether they were friends, family, or strangers to the people immediately around them (adjacent, in front). Cross-tabulating participants’ reported locations and relationships yielded constellations of confirmed preexisting social connections and neighboring strangers. Because of the limited coverage of these combinations, some analyses collapse or reduce these conditions.
Analyses
With relatively few descriptive statistics available on the topic of classical music audience motion, we opted to describe these measurements from multiple perspectives. First, we report their average quantity of motion compared to participants’ reports of their own and others’ movements during music, how these averages compare to the quantity of motion during other concert event types and segments, then we report on physiological and musical frequencies captured in these audience motion measurements, and lastly evaluate concurrent motion between participants, per type of concert event and according to their seating arrangements. Complete statistics on the ANOVA, Games–Howell tests, and t-tests reported in the figures and text are available in the supplementary materials and code base.
Average Quantity of Motion and Subjective Judgments of Motion
To get a sense of this classical music audience's awareness and understanding of audience motion during a live performance, we can compare their subjective reports after each segment of music to their measured average quantity of motion. Participants describing their own and others motion as “usual” for this kind of concert supply a valuable reference for how these accelerometer-derived measurements capture motion information related to their subjective experience.
The distributions of average quantity of motion per rating were tested using a one-factor Welch ANOVA. The Welch variant of ANOVA better accounts for differences in sample size and sample variance between categories (Liu, 2015), a useful allowance for comparing measurements according to unevenly reported rating responses. Posthoc pairwise comparisons were performed with the Games–Howell non-parametric test, an alternative to Tukey's pairwise test that is similarly flexible for these conditions and accounts for multiple comparisons. The average quantity of motion distributions are plotted with letter-value plots. This method of displaying distributions is an extension of the boxplots that conveys more information about the tails of distributions and sample size (Hofmann et al., 2017). The center box reports the median and quartiles of the sample like a boxplot (Letter-value M 25–50% and 25–75%); however instead of whiskers extending to fixed percentile, these plots add additional boxes as supported by the data: Letter-value F 12.5–25% and 75–87.5%, Letter-value E 6.25–12.5% and 87.5–93.75%, etc. Each letter-value covers half as many sample points as the last and the width of each successive box reflects the proportion of the distribution covered. In this implementation, the number of letter value boxes shown (
Reported Body Awareness
The proportions of participants reporting specific degrees of body awareness were remarkably stable across the four sections of the concert, with a plurality reporting intermittent awareness throughout, shown in Figure 6(a). The music presented with a projected visualization, Bach's Contrapunctus, dipped toward less body awareness, but the shift is small. The proportion of people reporting continuous awareness of their bodies was never over 20% of participants.

Positions of measured in-hall audience participants relative to the stage and each other, with pre-existing social relationships to neighboring audience members marked by solid (friend) and dashed (family) lines, and the proportion of concert motion captured for each participant expressed in hexagon face darkness.
After aggregating responses and motion data across music segments, there was no significant effect of degree of body awareness on the average quantity of motion per segment (
Reported own Motion During Music
Participants reported subjective normative judgments of their own movement during each section of music. To the compound question: “Were you aware of your own physical movement during this piece? If so, how much did you move relative to your own usual behavior at this kind of concert?”, in-hall participants responded relatively consistently for the first three pieces but reported more movement during the Folk music, shown in the left side of Figure 6(b). To the Beethoven, Schnittke, and Bach music segments, very few reported moving more than usual (<10%), while many more reported moving less than usual (25–40%). In contrast, a full 40% of in-hall participants reported moving more than usual for “this kind of concert” to the Folk music section, and just as many reported moving a normal amount. To see how these reports relate to their average quantity of motion, movement per rating level was assessed across the classical pieces and the folk music section separately. The rightward subplots of Figure 6(b) show their distributions and post-hoc test of mean differences.
The relationship between subjective ratings of their own motion and measured average quantity of motion was initially assessed with a two-factor mixed effects ANOVA on the ratings (between) and the music (within participant) with repeated measures. Evaluating all participants’ motion together identified a main effect of the Music (
Remote Participants’ Motion and Ratings
The remote participants watching the concert live stream were also presented with survey questions about their movement after each piece. Although a smaller sample, their ratings show a similar story to those of the participants in the hall.
Their reported body awareness was relatively stable throughout the concert, also dipping slightly during the Bach piece. There was also no apparent interaction between awareness and the average quantity of motion. The only notable difference between presentation conditions was that no remote participants reported being “Not at all” aware of their bodies during the music performances.
While remote participants’ subjective judgments of their own movement showed similar distributions to in-hall participants, their average quantity of motion differed. A mixed ANOVA (repeated measures within music segments) analysis found a significant effect of Remote-vs-Live (
Reports of Others’ Motion
Audience participants in the concert hall were also asked to rate the movement of the audience around them with the question: “Were you aware of others in the audience moving during this piece? If so, how much did they move relative the usual behavior you observe at this kind of concert?” As shown in Figure 6(d) (left panel), these participants showed a remarkable lack of awareness of other audience members’ movements during most of the music performed. During the first three music segments, the majority could not offer a normative judgment of those around them. The exception again was during the set of folk music, with a more active distribution of responses reported. However, even in this last part of the performance, there were still fewer in-hall audience participants reporting an opinion on others’ movements than on their own.
To assess the relationship between audience ratings of others' movement and the measured motion, ratings were matched with the average QoM across measured audience members directly beside and in front of each participant. Aggregating across pieces, the quantity of motion shows a significant correspondence between the movement of participants’ visible neighbors and their report of others’ motion (Welch ANOVA
Based on audience participants’ movement judgments and average quantity of motion, we see categorical differences between the classical music pieces on the program and the segment of Nordic folk music. The difference is in how much these participants moved, how much they thought they moved (remotely and in the hall), and in whether or not they were aware of other audience members’ movements during the performance.
Average Quantities of Motion Across Concert Events
To put the quantity of motion measured during music in context, participants’ quantity of motion time series were averaged per event for the four types of concert events. Figure 7 shows the distributions of these averages from in-hall participants, by segments and type (top plot), and then by individual events: non-musical segments lasting over 60s in the middle, individual movements and pieces of music below. Complete statistics, including effect sizes on pairwise tests, are reported in the supplementary materials, Tables 9–13.

Audience participants’ motion rating responses per music segment (left) and average quantity of motion per rating value (right): (a) In hall participants’ judgements of body awareness, (b) In hall participants’ judgements of their own amount of motion, (c) Remote participants’ judgements of their own amount of motion, (d) In hall participants’ judgements of other audience members amount of motion. Colors on the right are legends for stacked distributions on the left. Average quantity of motion distributions reports in letter-value plots, p-value from one-factor Welsh ANOVA and Games–Howell comparisons: *p < .05, **p < .01, ***p < .001. Distributions on right-hand subplots combine all music segments except (b).
The results show that in-hall participants moved the least during music performances. Even during speeches, which also demand attentiveness to the stage and polite immobility, audiences tended to have twice as much average motion as measured during the music intervals. Not surprisingly, the applause events were the most active, during which the chest-mounted devices bounced with the force wave of each clap.
However, these participants’ stillness to music was not uniform across pieces. As foretold by their judgments of audience motion, the folk music segment showed significantly higher average quantity of motion, shown in the top plot of Figure 7. However, when broken down into individual pieces, three of the six folk music arrangements provoked substantially more motion than the rest (bottom panel in Figure 7). The in-hall audience participants were relatively active to the DSQ's arrangements of Stædelil (Folk 2), Halling efter Haltegutten (Folk 3), and Halling (Folk 6), where a few audience members were even nearing applause values (outliers > 2.5). The one piece of music to fall substantially below the average motion during the classical pieces is the slow movement of the Beethoven (Beeth. 3), also identified as distinctly stilling in the accompanying Stilling Response article (Upham et al., 2024).
Analysis also showed variation in the average quantity of motion across longer speech intervals (≥ 60 s), with less movement during the first two speeches and more in the speech welcoming the audience back from intermission (Speech 7, middle panel in Figure 7). This interval included the audience's reactions to new measurement devices appearing on stage. When these participants completed paper questionnaires at their seats, the survey intervals included more motion than speeches or music, with more in Survey 2 and 4 when these intervals overlapped with some participants taking a seat after standing to applaud.
Quantity of Motion and Audio Envelope Power Spectrum Analysis
Human movement often involves periodicities, whether the result of physiological processes such as regular respiration or cyclical activities like walking. Music-related periodicities in body motion have been found in music listeners and audiences (Dotov et al., 2021; Swarbrick et al., 2019), even in conditions where participants are not supposed to be actively dancing (Gonzalez-Sanchez et al., 2018; Ross et al., 2016). Other periodicities in the environment can also encourage motion cycles, such as visual stimuli (Mergner et al., 2005). Making a summary of signal energy over a range of frequencies, the power spectrum, is an interesting lens for interpreting long quantity of motion time series. In these audience motion time series, it is of interest to evaluate prominent shared frequencies in participants’ motion across concert events.
Using the 10 Hz quantity of motion time series shown in Figure 4, divided into the same events presented in Figure 7, an average power spectrum was constructed per event or event type and participant as follows:
The quantity of motion time series from a participant during an event (or for an event type) was cut into frames of 512 samples with a hop size of 100 samples (51.2 s and 10 s) and convolved with a Hanning function to reduce edge artifact. Spectral content of each window was calculated with the fast Fourier transform (FFT). The resulting frequency amplitudes were averaged across frames for that event or event type to produce the average power spectrum per participant. For each event or event type, the mean power and 95% confidence intervals per frequency were calculated across participants’ average power spectra.
The chosen frame size (512 samples) captures a range of frequencies, 0.02 to 5 Hz or 2 to 300 BPM, while the dense hop size facilitates pulling out robust components despite steady changes such as shifting tempo. By this construction, longer events allow for smoother spectrum averages per participant, lowering the noise floor for more subtle frequency components that are persistent across frames. Averaging across in-hall participants exposed frequency components (frequencies with energy above wide spectrum noise level) that are common across the audience for any given event (see top row of Figure 8).

Distributions of the average quantity of motion across in-hall audience participants during different concert events in letter-value plots, all scaled to the average during speeches (horizontal dotted line). Pairwise t-test contrasts with p < .005 demarcated with brackets that are grouped by color and height to facilitate focus on the most contrasting conditions (Bonferroni corrected for multiple comparisons, full results in Supp. Tables 9–13). Top: Distributions across participants and events of average QoM per music and event category. Mid: Distributions of average QoM across non-music events lasting over 60 s. Low: Distributions of participants’ average QoM across movements and pieces of music.
This same analysis can be applied to the corresponding events from the livestream audio's 10 Hz amplitude envelope (RMS). These audio feature segments were evaluated identically through the first two steps of the above process to generate a parallel average power spectrum from the music pieces, speeches, and other concert events (lower row of plots in Figure 8). To facilitate the comparison between audio and audience accelerometer-measured motion, prominent frequency peaks in the audio spectra are traced up through the audience motion power spectra.
Figure 8(a) reports the average log power spectrum across participants during the different concert events (shaded confidence intervals, 95th percentile, evaluated empirically). The spectrum values reaffirm the hierarchy of quantity of motion between categories of concert events as captured by the averages in Figure 7. The chest-mounted accelerometers caught the greatest concentration of audience motion during rounds of clapping, with applause carrying the only distinguishable component at this scale: a crest between 2.7 and 3.2 Hz (160 and 190 BPM, highlighted) matching the distribution of clapping rates across individuals in these longer instances of applause as evaluated from inter-peak-intervals in a separate closer analysis. The peaks shared with the audio from these applause intervals match the clapping rates across the audience when they synchronized in these extended applause intervals, with 2.94 Hz matching the median clapping rate in the final applause interval. In this left-most column of plots in Figure 8, the peaks in the corresponding audio are a direct result of the in-hall audience participants’ periodic and (at least partially) synchronized movement. Audience motion during speeches and survey response intervals show more power across the spectrum than the music conditions across all frequencies, but without distinguishable common frequency peaks. If the audience moved together, it was not with sufficient regularity to stand out after averaging across frames and participants.
The spectrum energy of the in-hall audience was so low during music that the y-axis in subplots (b, c) of Figure 8 had to be rescaled. In subplot (b) are the audience quantity of motion spectra for three pieces that show strong frequency peaks in the averages across participants. Like the applause intervals show the common clapping rate from this audience as they synchronized their claps, the in-hall participants show synchrony in moving at the same rate. Below in subplot (e), the audio envelope spectra for these pieces also have strong distinguishable peaks, and tracing these up to the audience's quantity of motion shows their correspondence. For these three pieces, a substantial portion of the in-hall audience was moving at the same music-related frequencies, each peak labeled with beats per minute. Unlike the clapping intervals, the audio during these pieces was not mixed to prominently share audience motion sounds like clapping or stomping along. Instead, these audio peaks reflect the performers’ sound output. It is also worth noting that the audience's motion does not reproduce all the frequency peaks from the music in this motion range. These group averages instead show a concentration around the beat level and sometimes also one subdivision (Folk 6, Halling) or superdivision (Folk 2, Stædelil), even though the music presents many other prominent cycles. This kind of frequency selectivity is common for practiced music–motion relationships, and it appears this Danish audience showed encultured sensitivity to Nordic folk music through their agreement on which cycles to match. Parallel analysis of the remote audience's motion shows similar frequency peaks to the Folk pieces 3 and 6, shown in Supplementary Materials, part 6, Figures 6 and 7b.
Audience motion through the remaining music program is quite different. On the same scale as the middle plot, subplot (c) of Figure 8 shows the extremely even and low power spectrum for all other music events. None of the classical repertoire or the other folk music pieces prompted cyclical motion patterns that were common across the audience. Below, the average power spectra of their audio show a variety of frequency textures. Some have strong tall peaks that fall within the range of frequencies expressed by the audience to Folk 2, 3, and 6: Beeth. 1 at 1.2 Hz, Folk 1 at 1.45 Hz and 2.9 Hz, Folk 4 at 1.6 Hz. Other pieces show prominent crests with rubato spread: Beeth. 1 at 2.2 Hz, Beeth. 4 at 2.5 Hz. None of these music-frequency peaks prompted corresponding shared motion cycles in the audience, in-hall (Figure 8) or remote.
The only region of distinct energy for the audience participants during these pieces is a bump that is consistent across works in the range of 0.95 to 1.52 Hz. This bump is still extremely low power, only visible during these pieces because there was so little total motion adding energy to the spectrum. Under low motion conditions such as seated quietly watching a concert, measurement of average heart rate through a chest-mounted accelerometer is possible (Kwon et al., 2011). As a check on the distribution of frequencies forming this persistent bump, we empirically estimated these participants’ average heart rates according to their reported ages (Avram et al., 2019) (Supplementary Materials, part 5). These expected heart rates are in rose on the rightmost plots of Figure 8: the darker range marking the groups’ quartile and lighter covering outer 10th percentiles of estimated average heart rates. The breadth of this persistent component is a product of the natural variance of heart rates across a crowd, rather than the sharp peaks of matching frequencies from coordinated actions.
The visibility of audience cardiac activity in these measurements is also a consequence of the sensor used to track audience motion. Motion capture that tracks location would have difficulty picking up the small disturbances of the chest with cardiac activity. However, an accelerometer is, by construction, sensitive to the jerk produced by the vibrations of heart muscle contractions carried to the phone laying on participants’ upper chest, even if the displacement is small (Landreani & Caiani, 2017). This particularity of accelerometry also explains why these measurements did not capture this audience's breathing rates (expected 0.2 Hz–0.33 Hz range highlighted in these right-most plots). Besides being more variable than cardiac cycles in duration and in expression through upper chest displacement, the smoothness of the respiratory cycle would make inspirations and expirations less prominent to accelerometers than similarly positioned location markers.
This analysis clarifies the motion distinction observed in the averages and subjective reports of audience motion. Audience participants performed motion at music-related frequencies during a few folk music arrangements and nowhere else. Otherwise, there were only incidental (heartbeat) and activity-specific (clapping) regularities measurable across these audience participants’ quantity of motion time series power spectra. However, this power spectrum analysis only evaluates a specific shape of shared information between these time series and is insensitive to the simultaneity of movement by participants. Next, we consider an analysis better suited to evaluating the coincidence of sparse and non-cyclical shared motion patterns across the audience.
Cross-Audience Concurrent Motion
Interpersonal coordination of movement is expected in social situations, with mutual attention and familiarity commonly associated with strong shared information between postural sway and other motion features during interaction. In dyadic conversation and other activities with turn-taking, this congruence is often on a substantial and variable temporal offset, requiring loose cross-correlations to capture shared information. In the context of an ongoing common stimulus, say a performance from a stage, the temporal window for potential mutual influence is more restricted while opportunities for simultaneous actions are enhanced. By their own report, participants were not particularly aware or attentive to each other's movement during most of the music performance (Figure 6(d)), so it is reasonable to question whether there might be any patterns of simultaneous motion during most concert events.
As an initial assessment of simultaneous motion across the in-hall audience, a concurrent motion estimate per participant and concert event was calculated by averaging the Spearman correlation (
This statistic of average Spearman correlations between participants’ quantity of motion time series is a test of shared information across the in-hall audience. To assess the significance of information shared because of the common moment rather than a common activity or behavior, truly concurrent motion from one participant with the crowd during any given event is paired with the same concurrence calculation between that participant's motion and the crowd's from a different event in the same category. The spearman
For every event and alternative of the same type (of at least 40% of the true event duration), paired true and alternative mean

Average power spectrum of in-hall participants’ QoM time series, subplots (a, b, c), with 95% confidence intervals (band) across participants, and the same average power calculation on the concert livestream audio amplitude envelope, subplots (d, e, f), for the same concert event types (a, d) and individual music pieces (b, e, c, f). Power peaks in audio spectra are traced up through the audience's motion power to demonstrate when they do and do not correspond. Peak labels in the middle column report corresponding beats per minute (BPM). Highlighted ranges correspond to expected bio-rhythm frequencies: clapping, heart, and respiration rates.
Assessing the significance of these mean
Figure 9 shows these paired true and alternative distributions for the larger music and event type categories and individual events. The differences in the alternative distributions show the need for this kind of event type-specific construction of alternatives: mean
Summarizing this simultaneity advantage, Table 2 reports in more detail the t-test results and effect size for the music segments and other event categories. The effect size per segment and category better illustrates these shared influences than the mean
Concurrent motion statistics, reporting per concert event: the mean average Spearman concurrent motion estimate (Mean

Within the non-music events, two do not show significant simultaneous motion relative to the alternatives. The last round of applause (Claps 14), when truncated to the same duration as the pre-intermission Claps 5, only shows marginally higher true concurrence. This is partly because of the coarseness of these measurements, with low sample rate and alignment inconsistency blurring out the phase alignment during the audiences’ synchronized clapping. In contrast, the similarly blurred parallel calculations on Clap 5 include the drop of motion as individual audience members stop applauding within the measured interval, creating a common larger contour easily captured by these correlations. The speeches show lower mean
The commonalities between the survey sections may be a combination of how participants were prompted to start this independent task and from common rates and strategies for reading and marking responses. They were not confined to answering questions in time with each other, so similarities must be a by-product of the rhythms of the activity, reflected in some of the highest alternative values, after clapping.
Across the music segments, the segment with the smallest effect size of concurrent motion was J.S. Bach's Contrapunctus. This is the music segment that was presented with a live visualization, to which in-hall participants moved the least overall and during which fewer could report any judgment of their own motion (Figure 6(b)). Less coordination across the audience may be the result of something about this music, perhaps by holding the audience in a state of extreme stillness or the fugue's persistent refusal to resolve and rest (see Upham et al., 2024), or an effect of co-presentation with novel visual stimuli, or some other unidentified influence.
It is reassuring to see that the pieces already identified as prompting music-frequency movement cycles in the in-hall audience have some of the largest differences from alternatives, underlining the audience's motion was not only at the same rate but also aligned over time, moving more to specific measures. The lower motion frequency to Folk 2 (65 BPM) might also allow some phasic alignment to be captured at this 10 Hz sample rate. The concurrent motion differences between the folk pieces suggest that this quality of audience motion may be interesting to explore in more detail, folding in the context and reception of individual works, whether for stillness or musical rocking.
Pairwise Concurrent Audience Motion
After establishing the potential of Spearman correlations to capture concurrent motion information between in-hall audience participants, this approach was adapted to look for shared motion information between pairs of audience members seated near each other. Did neighboring participants show distinct patterns of mutual influence in aligned or near-simultaneous bursts of movement? Might there be differences in mutual influence patterns for types of concert events? Is such influence limited to audience members who are attending together, or might adjacent strangers affect how or when audience members move?
This experiment does not offer enough instances of all combinations of concert events, social relationships, and distances to allow a balanced decomposition of these effects. Within the samples available, we assess the factors through a sequence of simpler statistical comparisons. The results suggest directions for more controlled comparisons and analyses of similar measurements in larger audiences with similar compositions. Complete statistics are in Supplementary Materials, part 8.
The first is the question of what matters more for similar patterns in quantity of motion time series: social relationships or spatial proximity. Table 1 reports the instances of each of three categories of social relationships and distances counted for statistical evaluation, also illustrated in Figure 4. Pairwise Spearman correlations were tested in a two-factor ANOVA (first set statistics reported in Table 3, Supp. Table 20), counting only the first three distance categories. Tukey pairwise tests within factors are reported in the top plot of Figure 10 (Supp. Tables 16–19).

Distributions of concurrent motion (mean
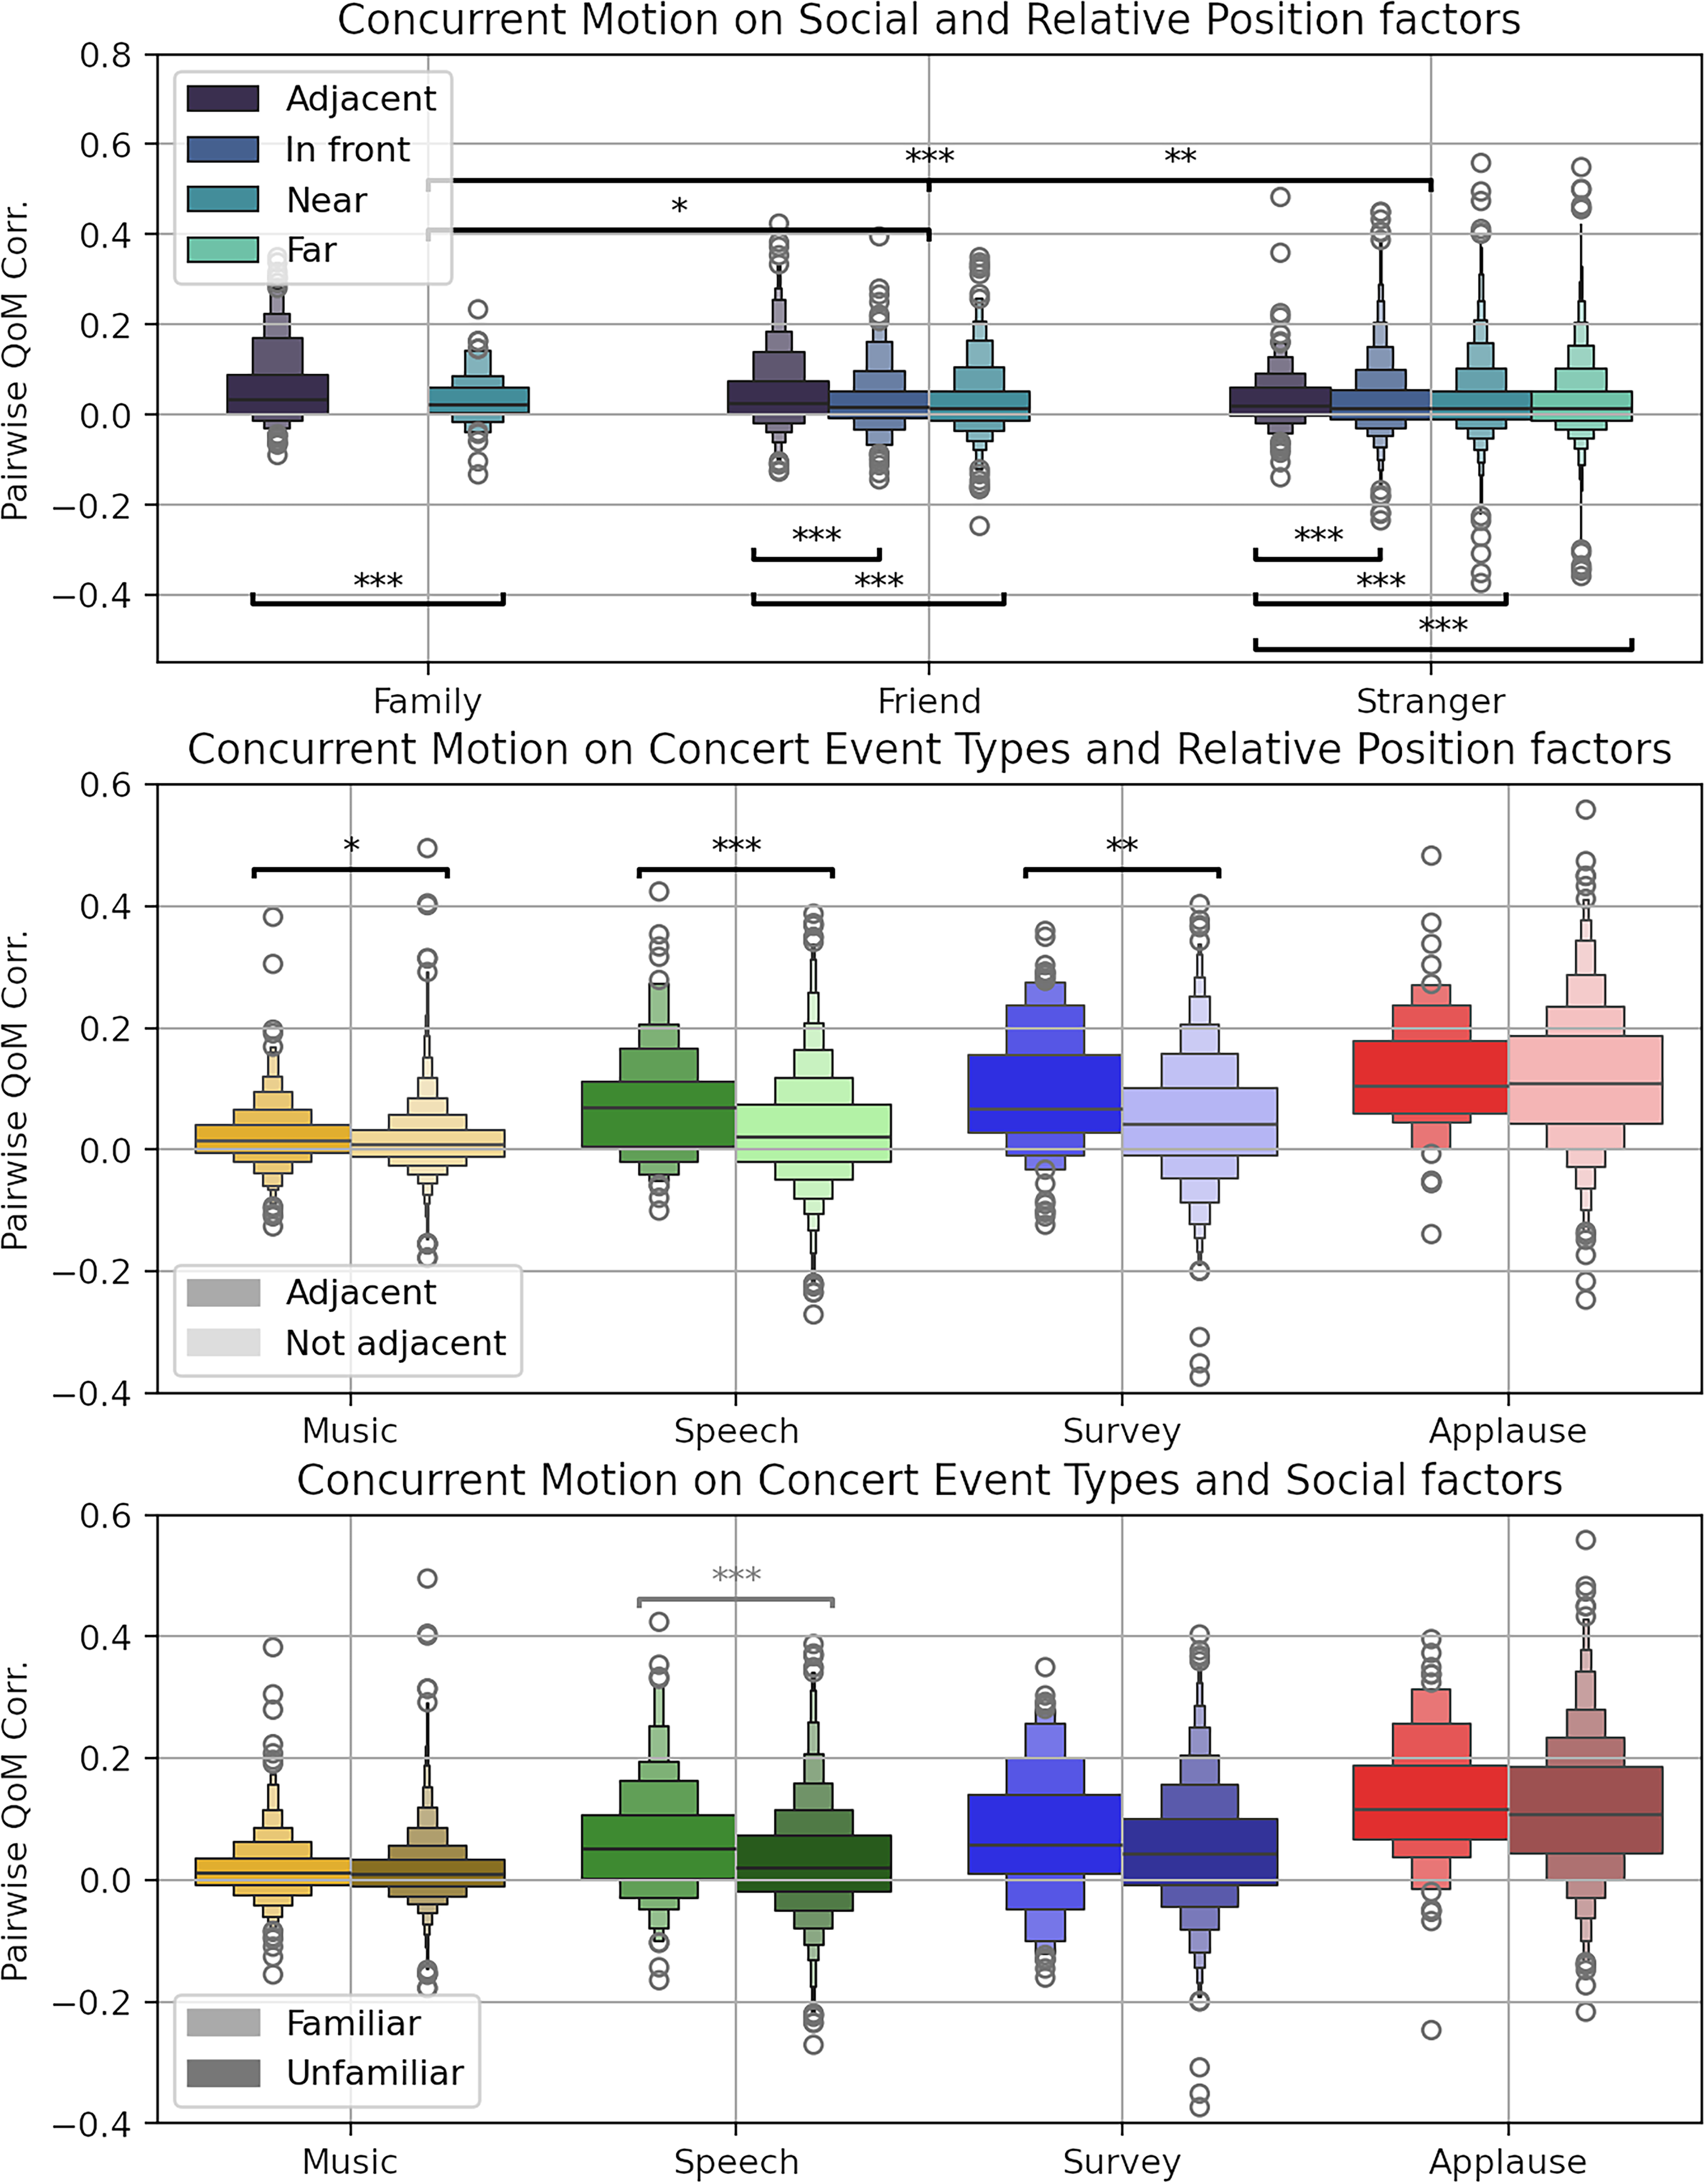
Letter-value distributions of pairwise Spearman correlations between pairs of audience participants according to their relative seating position, social relationship, and concert event type (see Figure 5, Table 1). Top: Distributions of pairwise correlations by social relationship and relative positions. Posthoc comparisons within factors with Bonferroni correction, Supp. Tables 17–18. Mid: Distributions of the same for relative positions, Adjacent or not (lighter), by each concert event type. Posthoc comparisons on across interactions with Bonferroni correction Supp. Table 22. Low: Distributions of the same for social relationships, Familiar or not (darker), for measurements of each concert event type. Posthoc comparisons across interactions with Bonferroni correction Supp. Table 24.
Audience neighbor concurrent motion, two factor ANOVA consider relative social and positional factors (Supp. Table 20), Mixed two factor ANOVA comparing Position and concert event type (Supp. Table 21), and mixed two factor ANOVA comparing social familiarity and concert event type (Supp. Table 23).
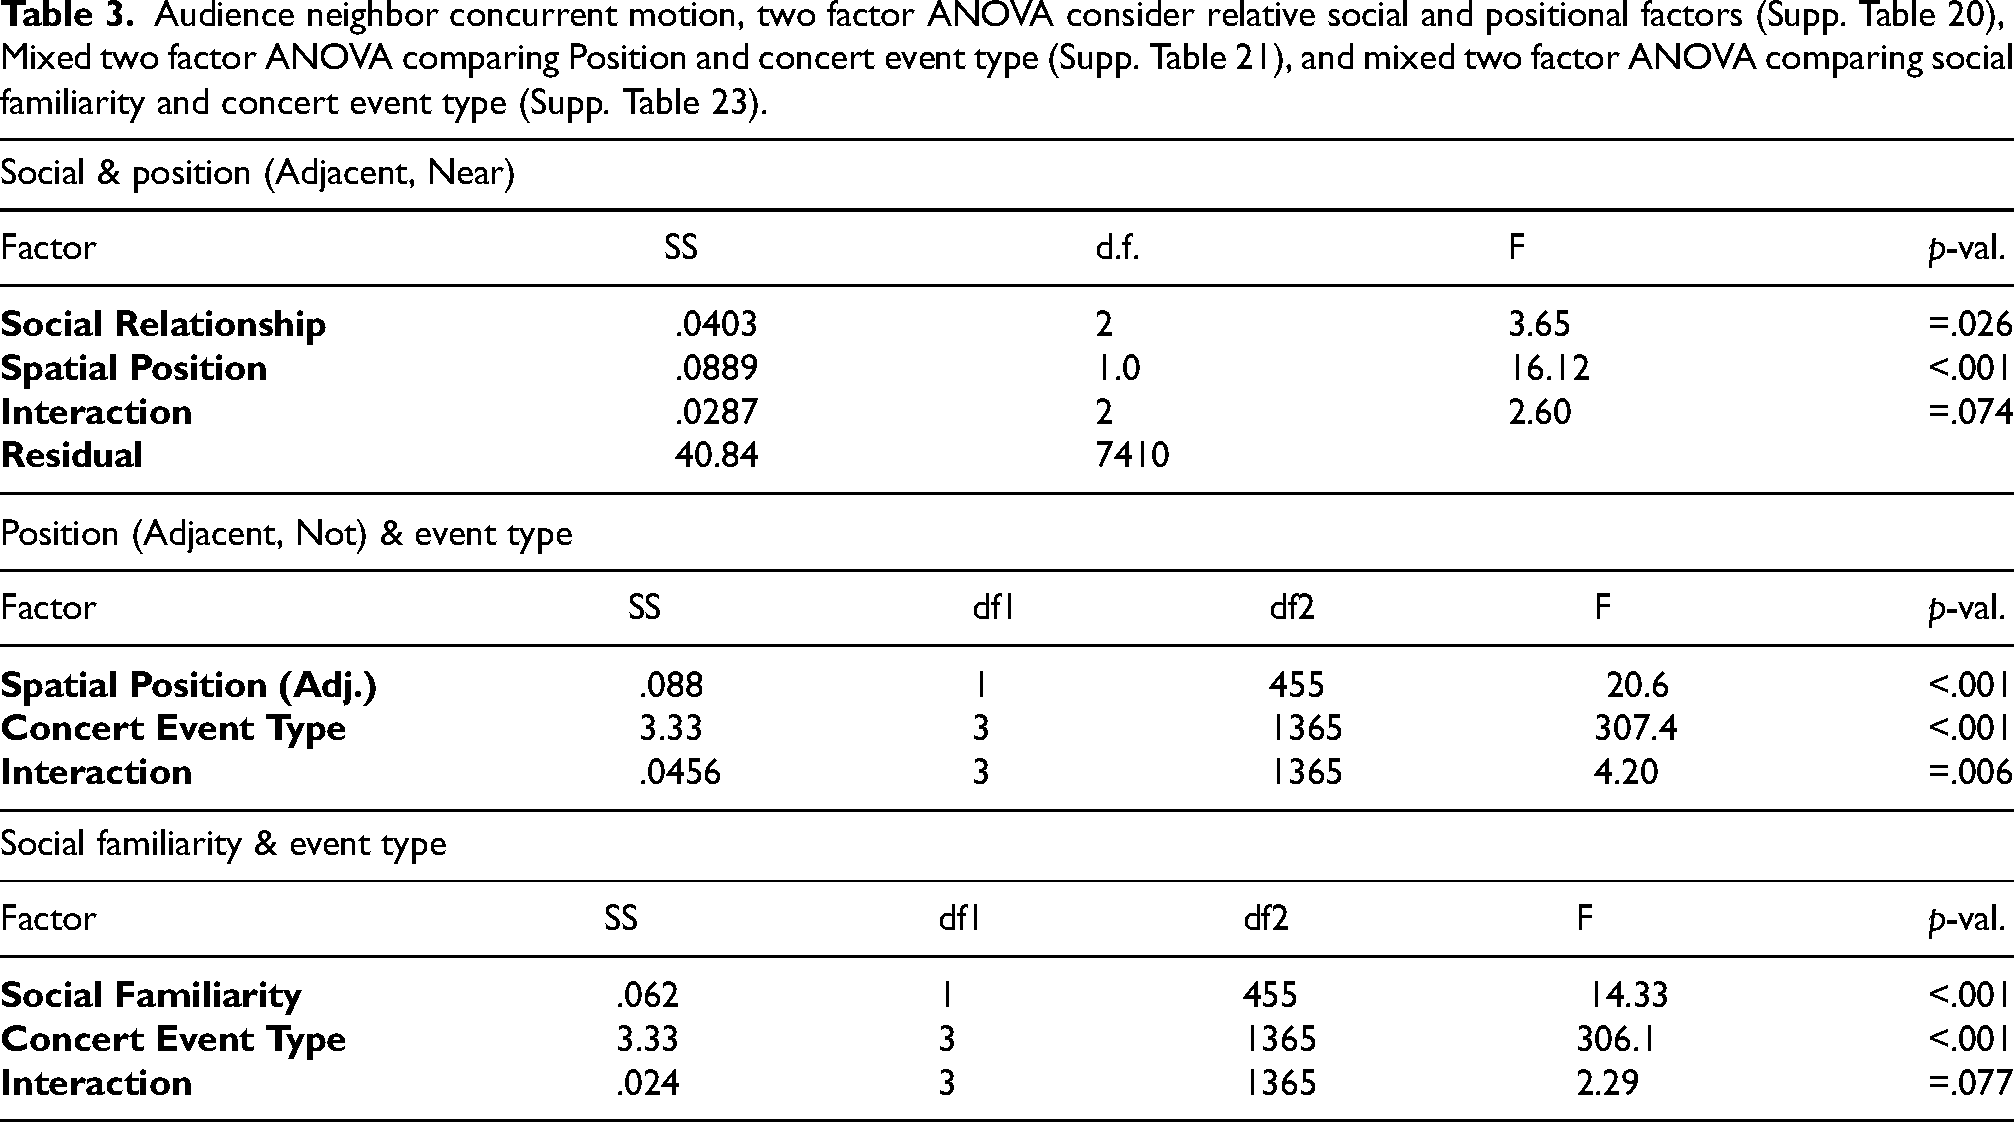
The principal results show that even with substantial overlap, social relationships and seating distance each contribute significantly to pairwise simultaneous motion, without strong evidence of interaction. In terms of distance, the main effect was between adjacently seated pairs and all others. For this measure of concurrent motion, there is not enough of an effect between more distant conditions to continue testing across all categories. To avoid over-balancing the samples, the Far pairs were dropped from subsequent tests and In front and Near folded into one category: Not-adjacent. For social relationships, there was a strong difference between pairs of family members and pairs of strangers, and a smaller difference between friends and family. However, with few instances of family relationships in the non-adjacent conditions, we opted to collapse these relationship categories to a simple contrast of Familiar and Unfamiliar.
Having simplified the between-pair factors of distance and social relationship to adjacency and social familiarity, these were considered against concert event type in a mixed ANOVA design. The second set of statistics of Table 3 and the middle plot of Figure 10 show some effect on adjacency on the main effect of concert event types and a marginal interaction between the two factors (Supp. Tables 21–22). In particular, speech events show the most robust effect of adjacency, more so than music or survey events, and adjacency shows no particular impact on pairwise correlations during applause.
A lack of adjacency effect on applause makes sense when considering how participants might be aware of each other's actions. In a small concert hall where audience member applause is heard across the room without noticeable delay, there is little signal-based reason to be more aligned with your neighbor. In these long applause intervals, we might expect to see participants starting and stopping the action of applause with the people next to them or with smaller delay. However, whether that might happen in larger crowds, it is not at a scale that matters here.
During this kind of concert, speeches from the stage are some of the rare moments when a chamber music audience is attuned to the same broadcast sound signal but still has “permission” to subtly (visibly/tangibly/quietly but not silently) express their reactions. Laughing together, turning to share a look, and murmured exchanges would contribute sufficient simultaneous quantity of motion increases to increase these pairwise correlations. These proximate audience–audience interactions can arise multiple times during a speech of a couple of minutes, but they would be much rarer, and maybe smaller, during live music. The wider range of correlation values between audience pairs during surveys reflects the amount of motion and their relative independence while reading and marking paper. Here adjacency effects may include the negotiation of moving bodies, dueling elbows and changing of seating position to facilitate this otherwise independent task, as well as possible instances of participants discretely sharing reactions as they did to speeches.
Performing the same repeated measures ANOVA with social familiarity does not sharpen the between-pairs factor or the interaction with concert event types, shown in the bottom set of Table 3 and bottom plot of Figure 10 (Supp. Tables 23–24). The condition of social familiarity, whether audience pairs were friends or family and presumably attending the concert together, was a weaker factor than plain adjacency. If direct adjacency is a necessary condition for measurable influence between pairs, this weakness could be a consequence of the non-adjacent familiar pairs muddying the distributions. As such, we must consider the post hoc assessment of interaction across event types to be provisional, recognizing how the samples across factor combinations are too limited to robustly catch smaller effects. The only event type with a lingering difference in medians is speeches, plausible with the kinds of neighbor-oriented interactions admissible during this type of concert event and not others: the rare opportunities at chamber music performances to interact with valued social company (Mulder & Hitters, 2023).
Combining these results, it is remarkable how pairwise concurrent motion to music events only shows a slight adjacency effect and no measurable advantage for those with existing social relationships. Separating those pieces that had the audience moving cyclically from the rest (during which stillness and mutual unawareness were the norm) did not expose a latent social advantage for either type of music, even when reducing these distributions to only the adjacently seated pairs. This sequence of null results for social familiarity but not adjacency suggests that music allows audience members to change the way in which they interact, prioritizing the common signal of the performance on stage and adapting to friends and strangers alike.
Discussion
The information we have gleaned from this audience's motion, as captured by chest-mounted accelerometers, coalesces into the four themes described in Figure 1: the limits of accelerometry, two distinguishable modes of music–motion behavior, the conditions for synchronous motion across event types, and non-periodic audience motion coherence.
Limits of Accelerometry for Capturing Audience Motion
Many strategies have been employed to capture how audiences move during real performances: three-dimensional optical motion capture with select markers, two-dimensional video analysis with and without markers in the visible and infrared ranges, and accelerometers positioned to capture the motion of specific body parts. Chest-mounting accelerometers on seated participants during a classical music concert was a novel strategy, both because of the little movement expected and the ambiguity of motion captured from this central point of measurement. With rare exceptions of actions also documented in other sensor modalities (applause, synchronization taps), we cannot easily distinguish what movements are resulting in the measured forces captured by these sensors. Bursts of jerk can come from changes in seating positions, large sighs or laughter, or bobbing and stomping along to the beat.
The fact that these sensors captured participants’ heartbeats was not anticipated prior to measurement but is understandable, given what accelerometers are most sensitive to. These sensors can be counted on capturing sudden motion but are not the best measure of steady or smooth displacement patterns, such as the gentle rise and fall of the upper chest during quiet breathing. As such, there may be qualities of audience motion accessible via location-oriented measures that are absent from the picture we could draw from these signals.
That said, these sensors did capture enough information to corroborate key aspects of the audiences’ self-reported evaluations of audience motion, both in the quantity of motion averages and in time series analyses. These measures exposed distinctions between different concert events and activities, giving a useful scale for motion during music. Whether through participants’ mobile phones or via distributed sensors, accelerometry measurements of audience motion are valuable for future research.
Two Distinct Patterns of Music–Audience Motion
As evidenced by multiple angles of assessment, this chamber music audience performed two categorically different music–audience motion relationships during this concert experiment.
Subjective ratings of their own motion showed a marked increase during the Folk music segment, while their judgments of other audience members’ movement showed a change from majority unaware to majority aware and plurality exceeding the amount of motion usually observed during this kind of concert. As described in Swarbrick et al. (2024), these participants’ absorption in the music interacted differently with their reported awareness of their own bodies and that other audience members motion for the Folk music segment of the program than for the Beethoven and Schnittke quartets. Specifically, that awareness of others did not diminish absorption during the folk music as it did during these classical works, nor did the reported condition of being continuously aware of one’s own body. Average quantity of motion per concert event showed extraordinarily low amounts of motion during the music pieces, with medians across the audience half that captured during other activities, except during three of the six folk music pieces. Participants’ reported connection to the audience interacted with the average quantity of motion across their visible neighbors by piece as well, with a positive correlation for the Folk music segment and no or negative correlation for the Schnittke and Beethoven quartets (Swarbrick & Vuoskoski, 2023). Average power spectrum analysis of the participants’ motion time series showed that during the three “active” folk music pieces, in-hall participants’ motion shared frequency components matching beat frequencies in the corresponding music (with octaves). During the remaining music pieces, there were no shared music-frequency components within the range of 0.1 Hz to 5 Hz (6 to 300 BPM), and the total motion was so low (wide-spectrum noise floor) that heartbeat perturbations of the chest-mounted sensors were measured instead. Still, the effect size on the cross-audience motion correlations (mean
This audience's motion patterns during the Folk pieces fit with common theories on how music compels motion and induces some of the main social benefits of music: bonding through synchronous movement patterns. During these tunes, most of the in-hall audience moved with the music in genre- and piece-suitable periodic actions that were noticeable and contributed positively to the experiences of other audience members through connectedness.
During the remaining music program, most of the concert, the in-hall audience's lack of music-frequency motion patterns and low average quantity of motion were also genre- and piece-suitable. Most were successfully unobtrusive, in ways that did not detract from other audience members’ experiences. However, rather than this overall lack of beat-expressing motion resulting in an incoherent noise, these measurements expose a shared influence of the music in more subtle and less regular fluctuations of the quantity of motion over time.
The remote audience, watching the concert experiment over the live stream, also showed a similar division in motion behavior, albeit with a higher quantity of motion overall. Across this smaller set of participants, discernible music-related frequency components were measured from their mobile phone measurements to two of the folk music pieces (Folk 3 and 6), and none for the classical repertoire. The piece-specific lack of periodic motion when experiencing this music at home suggests that the disconnect between musical beat information and listener movement is not simply out of deference to the performers, or other audience members or other constraints of the concert hall.
Conditions of Synchrony and Interaction Across Event Types
Rather than exposing music-independent noise through most of the concert, the cross-audience concurrent motion tests showed that there was still substantial shared information in the in-hall participants’ quantity of motion time series during almost all events. Understanding the conditions supporting shared information in motion between audience members during these different events may help contextualize the contrasting behavior captured during music performance.
The strongest simultaneity was captured during the two longer applause intervals that shifted into synchronized clapping (Table 2), as should be the case. These were instances when the audience was actively moving in a way clearly captured by the motion sensors, each clap producing a discernible bounce and spike in jerk in the chest-mounted sensors. The measurements are relatively coarse for capturing ≈3 Hz clapping rates, with only a 10 Hz sample rate and one or two sample alignment variances. Still, the distributions of mean
This broadcast quality of the applause motion is similar to that of the audience motion during the active folk music pieces. While not everyone stomped and clapped loudly during those pieces, an audible component to the audience's motion may well have encouraged movement regardless of adjacency and reinforced their adherence to the same subset of music-related frequencies.
In non-music events, the audience motion was lowest during some speeches. The speech intervals generally required quietness and stillness from the in-hall audience. Still, they also prompted moments of expressive response that can be heard in the audio recordings of these events. This included audible murmurings and laughter at instructions and at the MC pointing out various scientific instruments on stage. These moments of reaction are, of course, coordinated by the common stimulus of whomever is addressing the crowd. The audio recordings also expose additional sounds that are less obviously speech-related in these intervals, shifting in chairs and quiet conversations between audience members. While not likely to prompt fully synchronous movements between neighbors, these instances of audible audience motion may still produce overlapping intervals with higher jerk. Some of the survey intervals opened with instructions from the MC and the audio recordings captures quiet murmurings again between audience members as they move through the process of reading questions and marking the page with responses. Both speeches and surveys show degrees of influence from the common stimuli (speech, task) and potential for mutual influence between adjacently seated participants during an activity that did not demand quiet stillness as strictly as most of the musical program.
And yet, when there is almost no demand or opportunity for expressive or interactive motion, that is, during most of the music program, this audience still shows comparable degrees of shared information (by effect size on cross-audience concurrent motion) to these active events.
Non-Periodic Audience Motion Coherence to Music
Even without shared periodic components to their movements during the music, in hall audience members shared simultaneous highs and lows of motion in real-time, matching better with measurements from the audience at the same moments than during similar alternative events. The most apparent common source of information for such simultaneous behavior change is the music performance, to which they were attentive and engaged. Some coordination might also be due to additional temporally fleeting extra-musical intrusions from the environment, such as a surprisingly in-tune passing siren during the second movement of the Schnittke.
One potential mechanism for this shared non-periodic variation in quantity of motion is some kind of stilling response to more sparse musical cues. In Upham et al. (2024), the Stilling response is introduced and evaluated on this concert program, demonstrating a systematic relationship between audience motion and moments in the music performance that suggest or request silence from the audience, like rests, new sections with a reduced texture, or decrescendi. Such moments are common in classical chamber music repertoire; over 250 stilling points were identified during this concert program. However, they are not evenly distributed in time (periodic in a metrical range) or prominent in all works. At a majority of these identified points, a majority of in-hall participants showed measurably less motion than three seconds prior, suggesting that stilling is a common reaction to such musical cues.
This analysis also exposed a practical limit for how little motion this audience could collectively maintain. For a few pieces, the median quantity of motion time series across the in-hall audience reached the noise floor, most notably during the Bach Contrapuctus and the third movement of the Beethoven quartet. In cases where audience members cannot effectively become more still because they are maintaining extreme stillness, a lack of strong pairwise coordination cannot be interpreted as a lack of influence from the performance.
While a lack of motion may seem like a poor signal for communication between audience members or from the audience to musicians, there is value in stillness and the corresponding silence at key moments. The performers reported using moments of quiet in their performances to check in on the audience, listening for their stillness as a sign of engagement (Upham et al., 2024). And despite no evidence of conscious monitoring for intermittent stilling between audience members, nor any exceptional self-awareness that might facilitate active strategies of stilling, individuals’ participation in stilling at stilling points correlated mildly with their feelings of connectedness to the audience (Swarbrick & Vuoskoski, 2023).
The Stilling response is only one proposed mechanism for how a live audience might be coherent in their motion time series without expressing beat-related periodicities. However, regardless of the process, the evidence of shared information at zero lag, without compensating for inter-participant differences in response times via cross-correlation, suggests that temporal predictability of the shared signal is sufficient to facilitate true synchrony between audience members’ movements (and lack thereof). These audience members did not need to act with the same temporal precision and alignment as the performers. Still, this quality of shared information in their motion patterns suggests that successful metrical entrainment and other aspects of music prediction facilitate simultaneous coordination, at least within this experiment's inter-device alignment of 100–200 ms.
Whether through sustained suppression of motion or intermittent avoidance of audible fidgeting, there is a strategic, cooperative, and coordinated quality to how an audience does not move during this kind of concert music. This quality warrants further study and theoretical consideration.
By considering audience motion patterns during both music and other events of the concert experiment, and by taking an exploratory approach that allows categorically different behaviors and interactions to emerge from informationally-orthogonal analyses, these results complement more focused and controlled investigations of music audience motion and behavior.
Conclusions
In this article we studied audience motion during a classical music concert experiment from various points of view, combining continuous sensor measurements and subjective reports. Our results suggest that the movement patterns of seated audience members can vary greatly in both intensity and texture (i.e., frequencies and sparsity) across different events within a concert, as well as in their prominence and influence on the people around them. Perhaps surprisingly, our analyses showed that the body motion of audience members was most constrained while music was being performed, even more so than while listening to speech.
We found two kinds of music–motion patterns, one seemingly suited to classical music and the other fitting some pieces of Nordic folk music. In the room, this difference in audience behavior was obvious and acceptable to the many audience members familiar with the Danish String Quartet's repertoire. However, a substantial portion of the audience described their own and other peoples’ motion during the last portion of the concert as more than typical for this kind of concert. Although substantially different in character, this audience showed no difficulty changing between these two modes of motion, switching back to stillness for the softer pieces in the folk music set. The average quantity of motion from audience members to Folk 4 matched their restraint through the string quartet movement. This suggests that a lack of motion to music is not exclusively a response to classical or art music presented acoustically on a stage.
This tendency to move less to music is not without social implications. While the in-hall audience participants were less aware of each other's motion during the classical segments of the concert, the fact of their stilling aligning with quieter musical moments and the correlation of stilling participation with reported connection to the audience suggest a real participatory element to well-timed restraint. Audience members perform their understanding of the music by stilling cooperatively in ways beneficial to the other people attending and the musicians on stage (Upham et al., 2024).
This is not to say that there are only these two music–motion patterns for an audience to perform. The selectiveness of these audience participants’ engagement with music-related frequencies suggests an important contribution of enculturation at the very least. Similar measurements from people standing and dancing would have much more information to consider. Also, the mechanisms required for non-periodic stilling, such as sensitivity to genre-typical form and performers’ manipulation of tempo, could support an array of more active behaviors synchronized by the performance.
From these measurements alone, we cannot distinguish between the multiple distinct physiological mechanisms that may result in motion reductions across a crowd. Concurrent measurements of breathing, muscle tension in the back or neck, and skin conductance could illuminate mechanisms for short-term stilling (Upham et al., 2024). Measurements that explicitly track head and limb motion would also clarify the visibility of such restraint.
While music-related audience motion was the intended focus of these measurements within the larger MusicLab Copenhagen concert experiment (Danielsen et al., 2023), looking at audience movement during non-musical events was extremely useful for contextualizing the information captured by each analysis. The difference between average motion during speeches and music is categorical, exposing a change in opportunity for interaction between audience members and potentially a difference in attention and engagement.
The audience acts together throughout a concert, not only while music is being played on stage, and extra-musical moments may provide more opportunities to be aware and appreciative of seat neighbors and feel connected to the collective audience. Correlations were stronger between adjacently seated participants during the non-musical events of speeches and survey writing than in the music performances. The opportunity for social relationships to shape these participants’ motion behavior was also extremely limited by the standard concert conditions of such classical music performances. As such, it might be time to broaden the field's focus on coordination during (classical) concert music to consider spectatorship activities of all kinds: popular music, sports, theatre, and politics.
This article presents an unconventional sequence of analyses because complex signals captured in naturalistic conditions offer distinct opportunities for open-minded exploratory analysis. The claim of two distinct patterns of music–motion was not hypothesized before the experiment, but this result is strongly supported through convergent evidence via multiple informationally orthogonal analyses. The choice to use simple data treatments (averages, FFTs, correlations) with careful testing criteria allowed for relatively direct inferences between accelerometer data and known audience behaviors, all despite the complications of missing data and small numbers of event types and participant conditions. We show descriptions of full distributions in many plots and match this article with complete records of the computation behind each claim because the existing literature in music research on audience motion measurements did not offer comparable information from similar experiments when we needed it. We hope this example encourages further creative forays into the rich and subtle landscape of audience behavior to music and beyond.
Supplemental Material
sj-pdf-1-mns-10.1177_20592043251398280 - Supplemental material for When and How the Audience Moves
Supplemental material, sj-pdf-1-mns-10.1177_20592043251398280 for When and How the Audience Moves by Finn Upham and Fernando E. Rosas in Music & Science
Footnotes
Action Editor
Niels Chr. Hansen, Royal Academy of Music, Aarhus/Aalborg.
Peer Review
One anonymous reviewer Anna Czepiel, University of Toronto Mississauga, Psychology.
Contributions
This combination of exploratory analyses were conceived of, initially performed, and drafted jointly by Authors 1 and 2 from data curated by Author 1. Final analyses, data visualization, and unified open codebase managed by Author 1. Editing of final submission by Authors 1 and 2. Initial data collection was part of a much larger collaborative effort, described in other publications.
The authors express their gratitude for the fantastic opportunity to work with measurements from a performance by the outstanding Danish String Quartet, and to the many hands involved in creating such an event as MusicLab Copenhagen. Many thanks also to the reviewers for their patience and attention.
Data Availability
All openly publishable data used in this analysis is released in the concert experiment's OSF repository. Analyses performed are also published openly on GitHub and preserved on Zenodo (Upham, 2025).
Declaration of Conflicting Interests
The authors declared no potential conflicts of interest with respect to the research, authorship, and/or publication of this article.
Ethical Approval
The ethics committee of Norwegian Centre for Research Data (NSD) approved this study (REC numbers: 915228, 748915)
Funding
The authors disclosed receipt of the following financial support for the research, authorship, and/or publication of this article: This work was supported by the Norges Forskningsråd, NordForsk, (grant number Centres of Excellences, 262762, Nordic Sound and Music Computing Network, 86892).
Supplemental Material
Supplemental material for this article is available online.
References
Supplementary Material
Please find the following supplemental material available below.
For Open Access articles published under a Creative Commons License, all supplemental material carries the same license as the article it is associated with.
For non-Open Access articles published, all supplemental material carries a non-exclusive license, and permission requests for re-use of supplemental material or any part of supplemental material shall be sent directly to the copyright owner as specified in the copyright notice associated with the article.