
Abstract
Background
Lung cancer is the most common cause of cancer-related death worldwide and therefore there has been a growing demand for low-dose computed tomography (LDCT) protocols.
Purpose
To investigate and evaluate the dose and image quality of patients undergoing lung cancer screening (LCS) using LDCT in Norway.
Materials and Methods
Retrospective dosimetry data, volumetric CT dose index (CTDIvol) and dose-length product (DLP), from 70 average-size and 70 large-size patients who underwent LDCT scan for LCS were included in the survey. Effective dose and size-specific dose were calculated for each examination and were compared with the American Association of Physicists in Medicine (AAPM) requirement. For a quantitative image quality analysis, noise, signal-to-noise ratio (SNR), and contrast-to-noise ratio (CNR) were determined for different regions in the chest with two iterative reconstruction techniques, iDose and Iterative Model Reconstruction. Differences in dose and image quality between average-size and large-size patients were evaluated by Independent sample t test, and Wilcoxon signed rank test within the same patient group.
Results
The independent sample t test revealed significant differences (p < .05) in dose values between average-size and large-size patients. Mean CTDIvol and DLP for average-size patients were 2.8 mGy and 115 mGy.cm, respectively, with appropriate increment for the large-size patients. Image quality (image noise, SNR, and CNR) did not significantly differ between patient groups when images were reconstructed with a model based iterative reconstruction algorithm.
Conclusion
The screening protocol assessed in this study resulted in CTDIvol values that were compliant with AAPM recommendation. No significant differences in objective image quality were found between patient groups.
Introduction
Lung cancer is one of the leading causes of cancer in both men and women worldwide,1,2 and while not always the most diagnosed, lung cancer has the highest mortality rate in the world.3,4 In 2018, 2100 people died of lung cancer in Norway. 5 Early detection of lung cancer is currently the most effective way to reduce the total mortality of lung cancer. Patients with lung cancer diagnosed at stage I have a 5-year survival of more than 80% while the total overall survival is 15%–20%. 6 It is reported that lung cancer screening using low-dose computed tomography (LDCT) results in increased detection and decreased mortality. 7 In large prospective studies as the National Lung Cancer Screening Trial (NLST) in 2011 and the Dutch-Belgian in a lung cancer screening trial in 2020 confirmed that computed tomography (CT) screening can reduce lung cancer mortality by 20%.8,9 A growing number of countries are implementing lung cancer screening programs; however, there is a concern that exposure to the ionizing radiation of LDCT in lung cancer screening might increase the risk of developing solid cancers and leukemia. 1 Current lung cancer screening (LCS) protocols recommend repeated screening at either annual or biannual frequency for eligible individuals, which can result in over 25 scans over a lifetime.10–12 Literature has shown that patient dose varies across regions and countries due to several factors, including CT scanner design, diagnostic protocols, and local-based choices of technical parameters.12–14 This will also affect if the image quality is sufficient for detection and measurement for small pulmonary nodules in LCS programs.
There exists a need to implement screening programs for lung cancer around the world.15,16 The American College of Radiology (ACR), Society of Thoracic Radiology, and the European Society of Thoracic Imaging have published practice guidelines and technical standards to assist radiologists and medical physicists in developing local CT lung cancer screening protocols.17–19 In addition, the American Association of Physicists in Medicine (AAPM) has published a recommended set of lung cancer screening protocols for a range of scanners. 20 These protocols are based on the experience gained from the NLST study and other screening studies by the working group. These protocols and the ACR guidelines result in a radiation dose (CTDIvol) ≤ 3 mGy (≤1.0 mSv) for a standardized patient of 70 kg and a height of 170 cm. However, radiation dose may vary from 0.25 to 5.6 mGy for patient of 50 to 120 kg. 20 The aim of this study is to investigate and evaluate the dose and image quality of patients undergoing LCS using LDCT at a local hospital in Norway. This will provide valuable information for protocol optimization to further reduce patient radiation dose in the implementation of a future LCS.
Method and materials
Patient data
The first lung cancer screening study in Norway started in August 2022. A total of 125,000 Norwegian inhabitants in the age group of 60–79 years were invited to participate in this study using LDCT protocol. Fourteen thousands out of 125,000 agreed to participate and 1,000 of these were selected as participants for the screening study over a 3-year period from 2022 until 2025. Data were collected from the Picture Archiving and Communication Systems, Carestream Vue PACS version 12.2.20105, Philips Healthcare, Best, Netherlands, between February and March 2023.
Patient selection
AP thickness of average-size and large-size patients scanned with a contrast enhanced chest pulmonary angiogram protocol used for inclusion range of AP thickness used in this study.

CT acquisition parameters
Characteristics of the CT scanners and acquisition parameters included in the survey.

aNotation of the detector configuration: the number of active detector rows x the detector element thickness.
bDose right index.
Radiation dose assessment
Volume computed tomography dose index (CTDIvol) and dose-length product (DLP) values were collected for each examination retrospectively. The estimated effective dose was calculated as DLP multiplied by a k-factor of 0.014 mSv*mGy−1 cm−1 for the chest. 24 Size-specific dose estimate (SSDE) was calculated as described in the AAPM Report 204. 25 Thus, SSDE was calculated for each examination based on the recorded CTDIvol values and the corresponding AP chest thickness conversion coefficient. 24
Objective image analysis
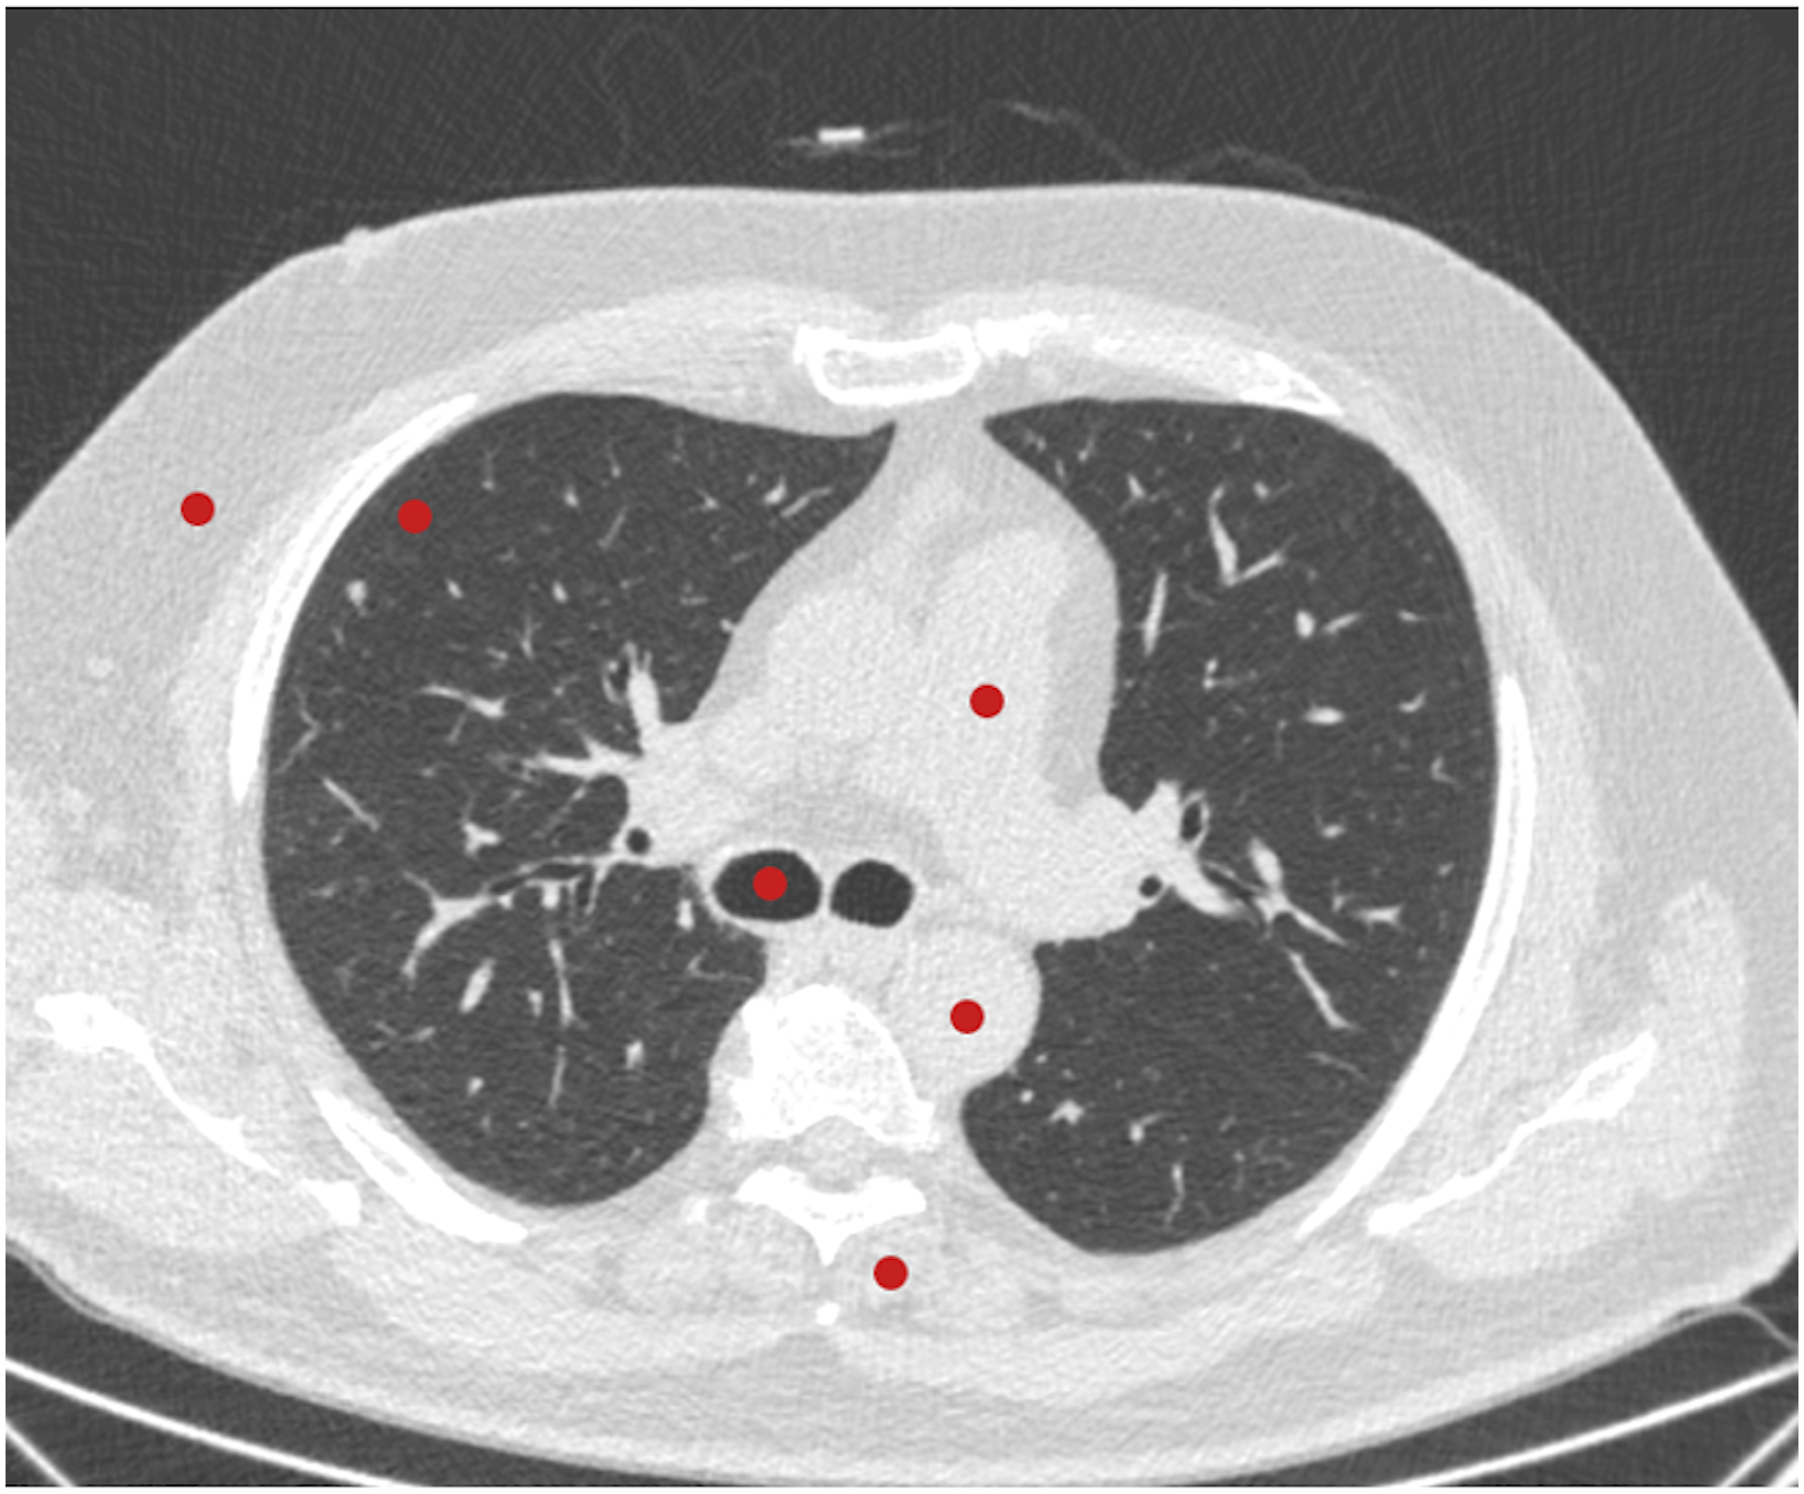
Standardized 30-mm-diameter circular regions of interest (ROI) were used to record signal and noise, which represented mean attenuation value and standard deviation (SD) in Hounsfield units (HU). The ROIs were placed in the axial slices at the level of tracheal bifurcation in the subcutaneous fat, peripheral lung parenchyma, air within the trachea, truncus pulmonalis, aorta descendent, and paravertebral muscle,
26
as shown in Figure 1. Moreover, the signal-to-noise ratio (SNR) was calculated in all ROIs as follows
27
: Placement of the regions of interest for an objective image quality assessment: the subcutaneous fat, peripheral lung parenchyma, air within the trachea, truncus pulmonalis, aorta descendent, and paravertebral muscle.
The paravertebral muscle measurements were used as the background attenuation to calculate contrast-to-noise ratio (CNR) as follows
27
:
Statistical analysis
Data were recorded in Excel (Microsoft Office 2010) and were analyzed with the Statistical Package for the Social Sciences software version 18.0 (IBM Corp.). The Kolmogorov–Smirnov test was performed to determine whether data were normally distributed. Descriptive statistical analysis of the collected dosimetry parameters, CTDIvol, DLP, SSDE, image noise, SNR, and CNR values was performed for each patient to determine the mean and standard deviation. Independent sample t test was used to compare the differences between average-size and large-size patients. Two-way ANOVA was used to investigate gender differences between the same size groups. To compare the difference in image quality within the same patient group, the Wilcoxon signed ranks test was used. The p value <.05 was considered as statistically significant.
Ethical considerations
This study was approved by Data Protection Office/institutional review board at the involved hospital defined as a quality assurance study. The need for informed consent for the use of existing CT scan images, including raw data, was waived. No sensitive patient data was recorded in the study.
Result
Patient selection
Basic characteristics of the participants.

Figure 2 shows box plots of CTDIvol, DLP, effective dose, and SSDE categorized according to patient’s size. The mean CTDIvol of average-size patient was found to be 2.8 ± 0.48 mGy (range, 1.9–3.9) which is significantly lower (p < .001) than that of the large-size patients (4.5 ± 0.96 mGy; range, 2.3–6.6 mGy). Nonetheless, mean CTDIvol for the entire patient group was found to be 3.62 mGy. No significant difference was observed with average scan length of the two patient groups (p = .204). Consequently, mean DLP of the large-size group (193.6 ± 42.37 mGy∙cm; range, 94.2–293.5) was significantly (p < .001) higher than that of the average-size patients (115.22 ± 21.45 mGy∙cm, range, 79–160.2). The same trend was seen for the effective dose and SSDE data, where effective dose and SSDE of the large-size patients were 3.3 ± 0.72 mSv (range, 1.6–5) and 5.3 ± 1.03 mGy (range, 2.9–7.4) and that of average-size patients were 2 ± 0.4 mSv (range, 1.3–2.7) and 3.8 ± 0.67 mGy (range, 2.7–5.2), respectively (Figure 2). No correlation between gender and dose was observed in this study. No statistically significant difference was found between the CTDIvol (p = .28), DLP (p = .32), SSDE (p = .31), and effective dose (p = .3) when comparing the dose in men versus women within the same size group. Box plot showing (a) CTDIvol = volume CT dose index, (b) DLP = dose-length product, (c) effective dose, and (d) SSDE = size-specific dose estimate of lung cancer screening using low-dose computed tomography. Box plot midlines indicate medians, outer lines indicate 25th and 75th percentiles, respectively, and whiskers indicate the range of data points excluding outliers represented by blank circle. p < .05 indicates statistical significance between average-size and large-size.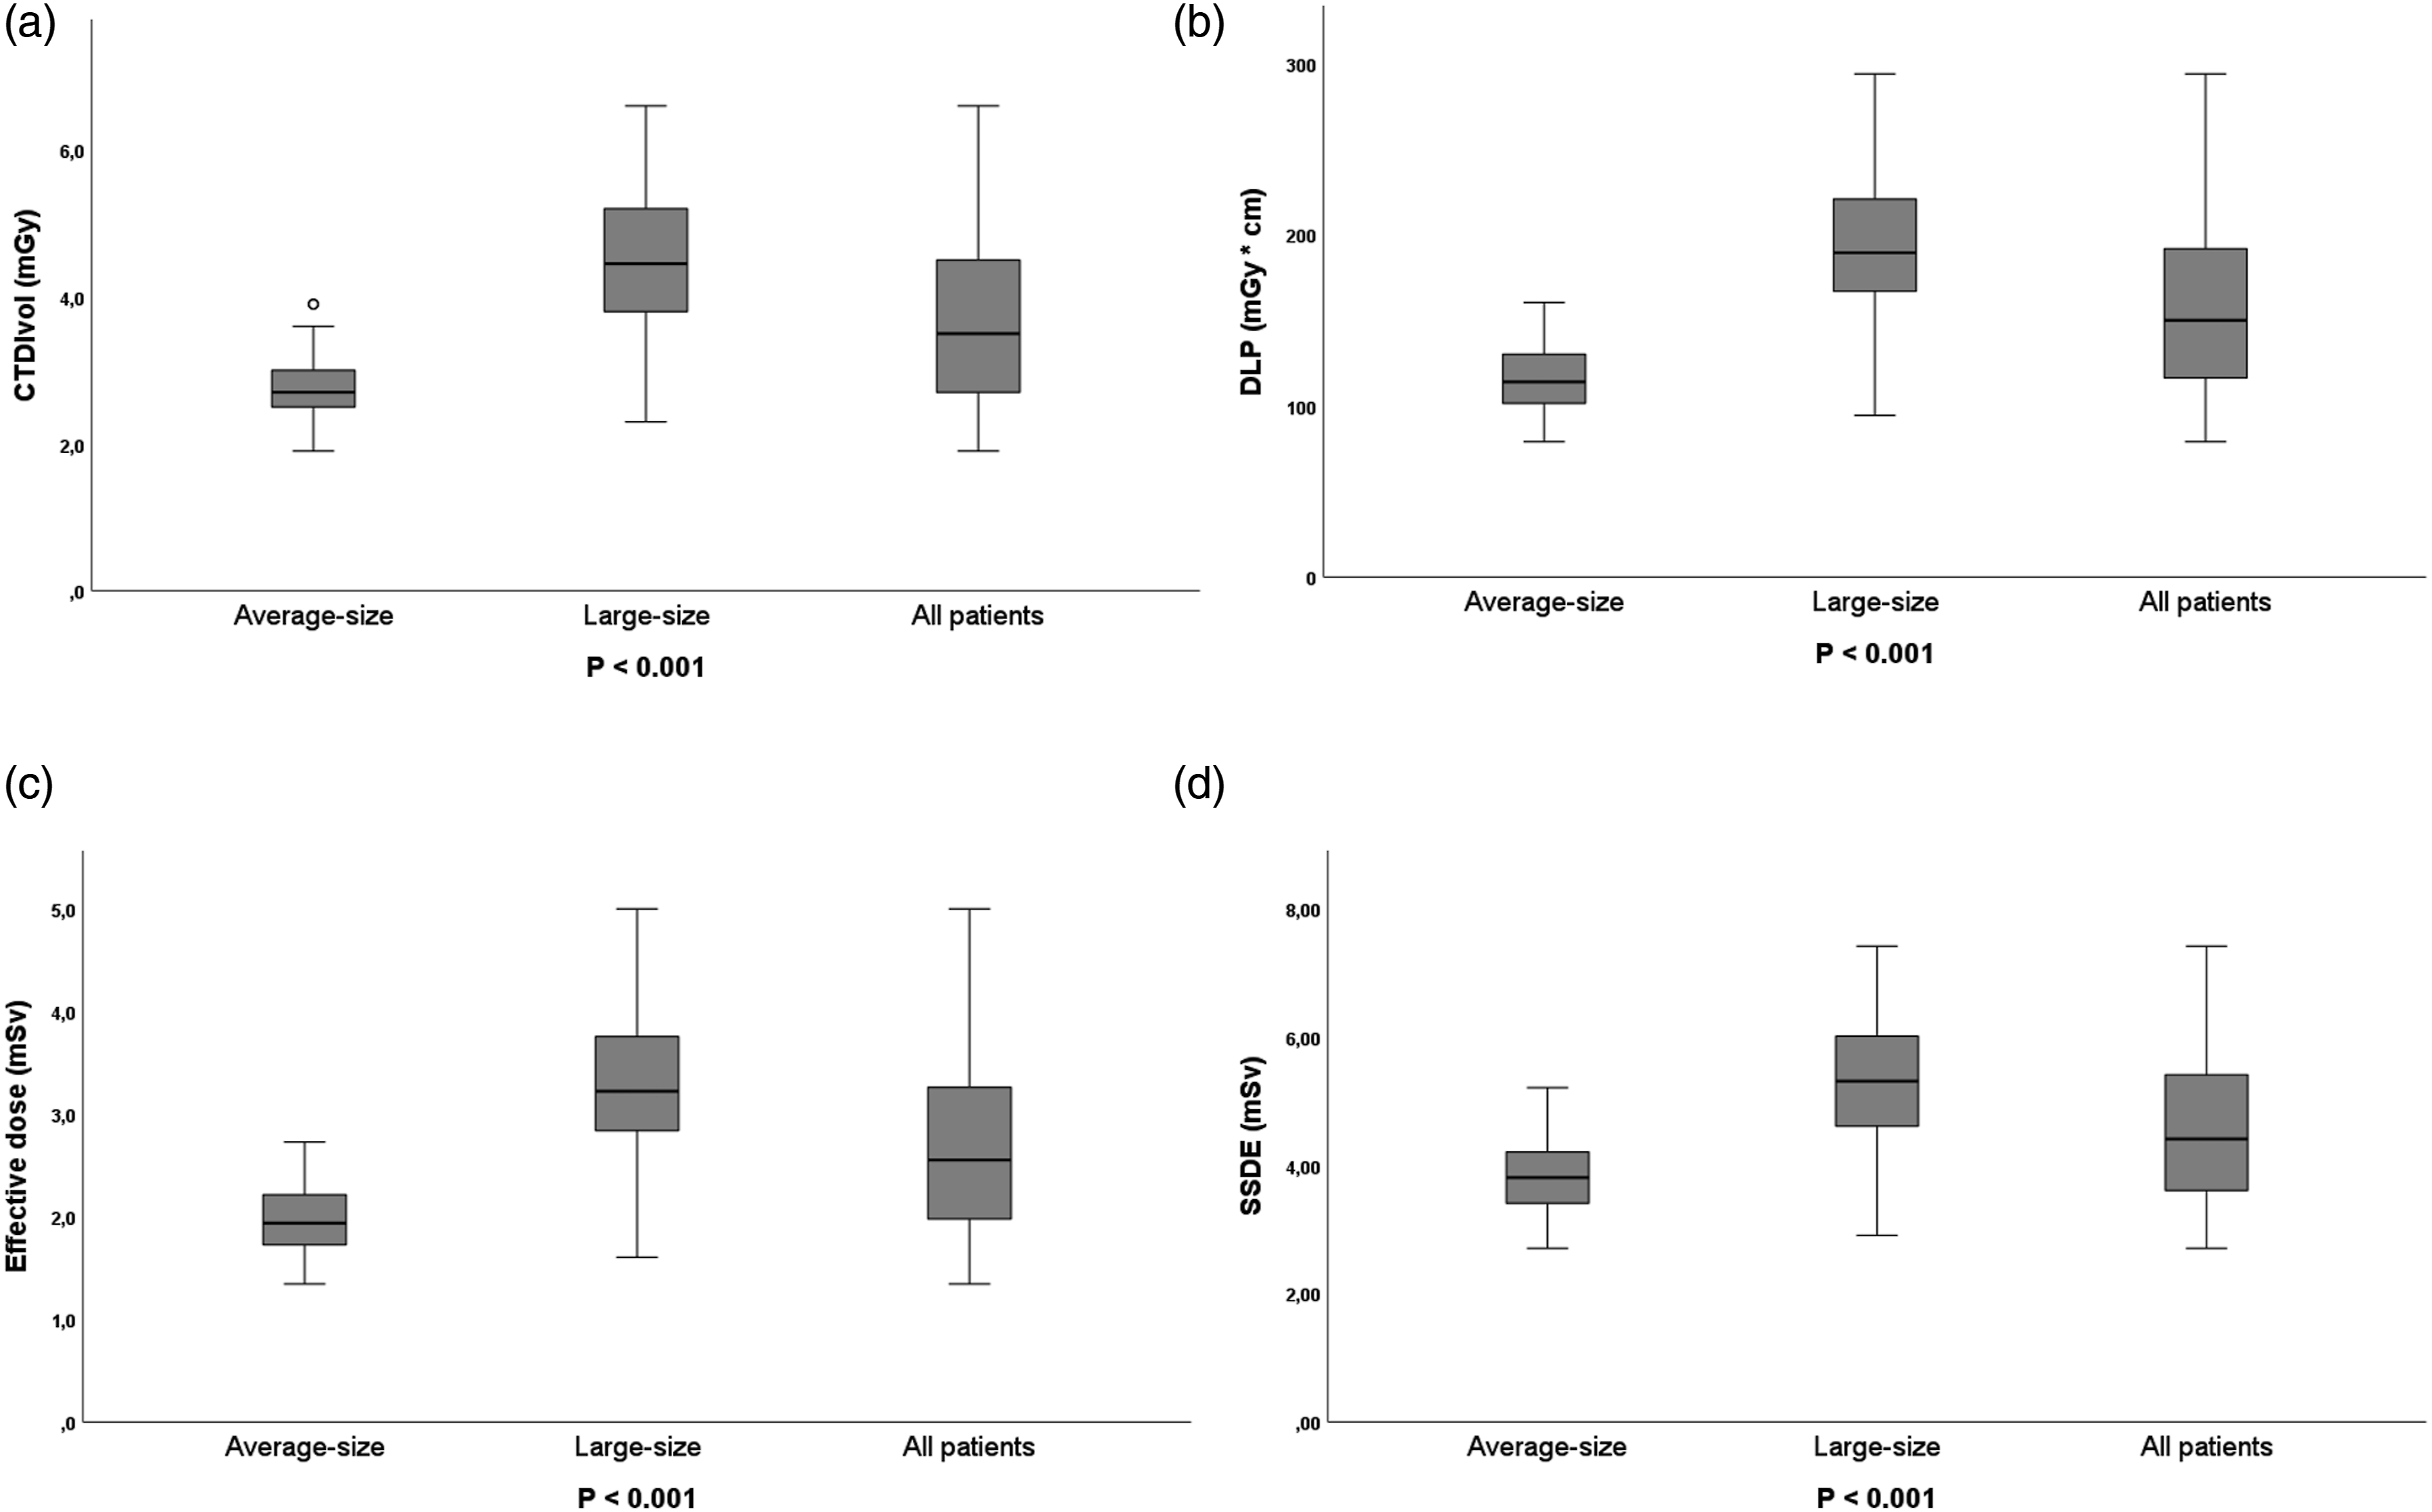
Results of the objective image quality assessment: image noise, SNR, and CNR. Results are presented as median ± SD.
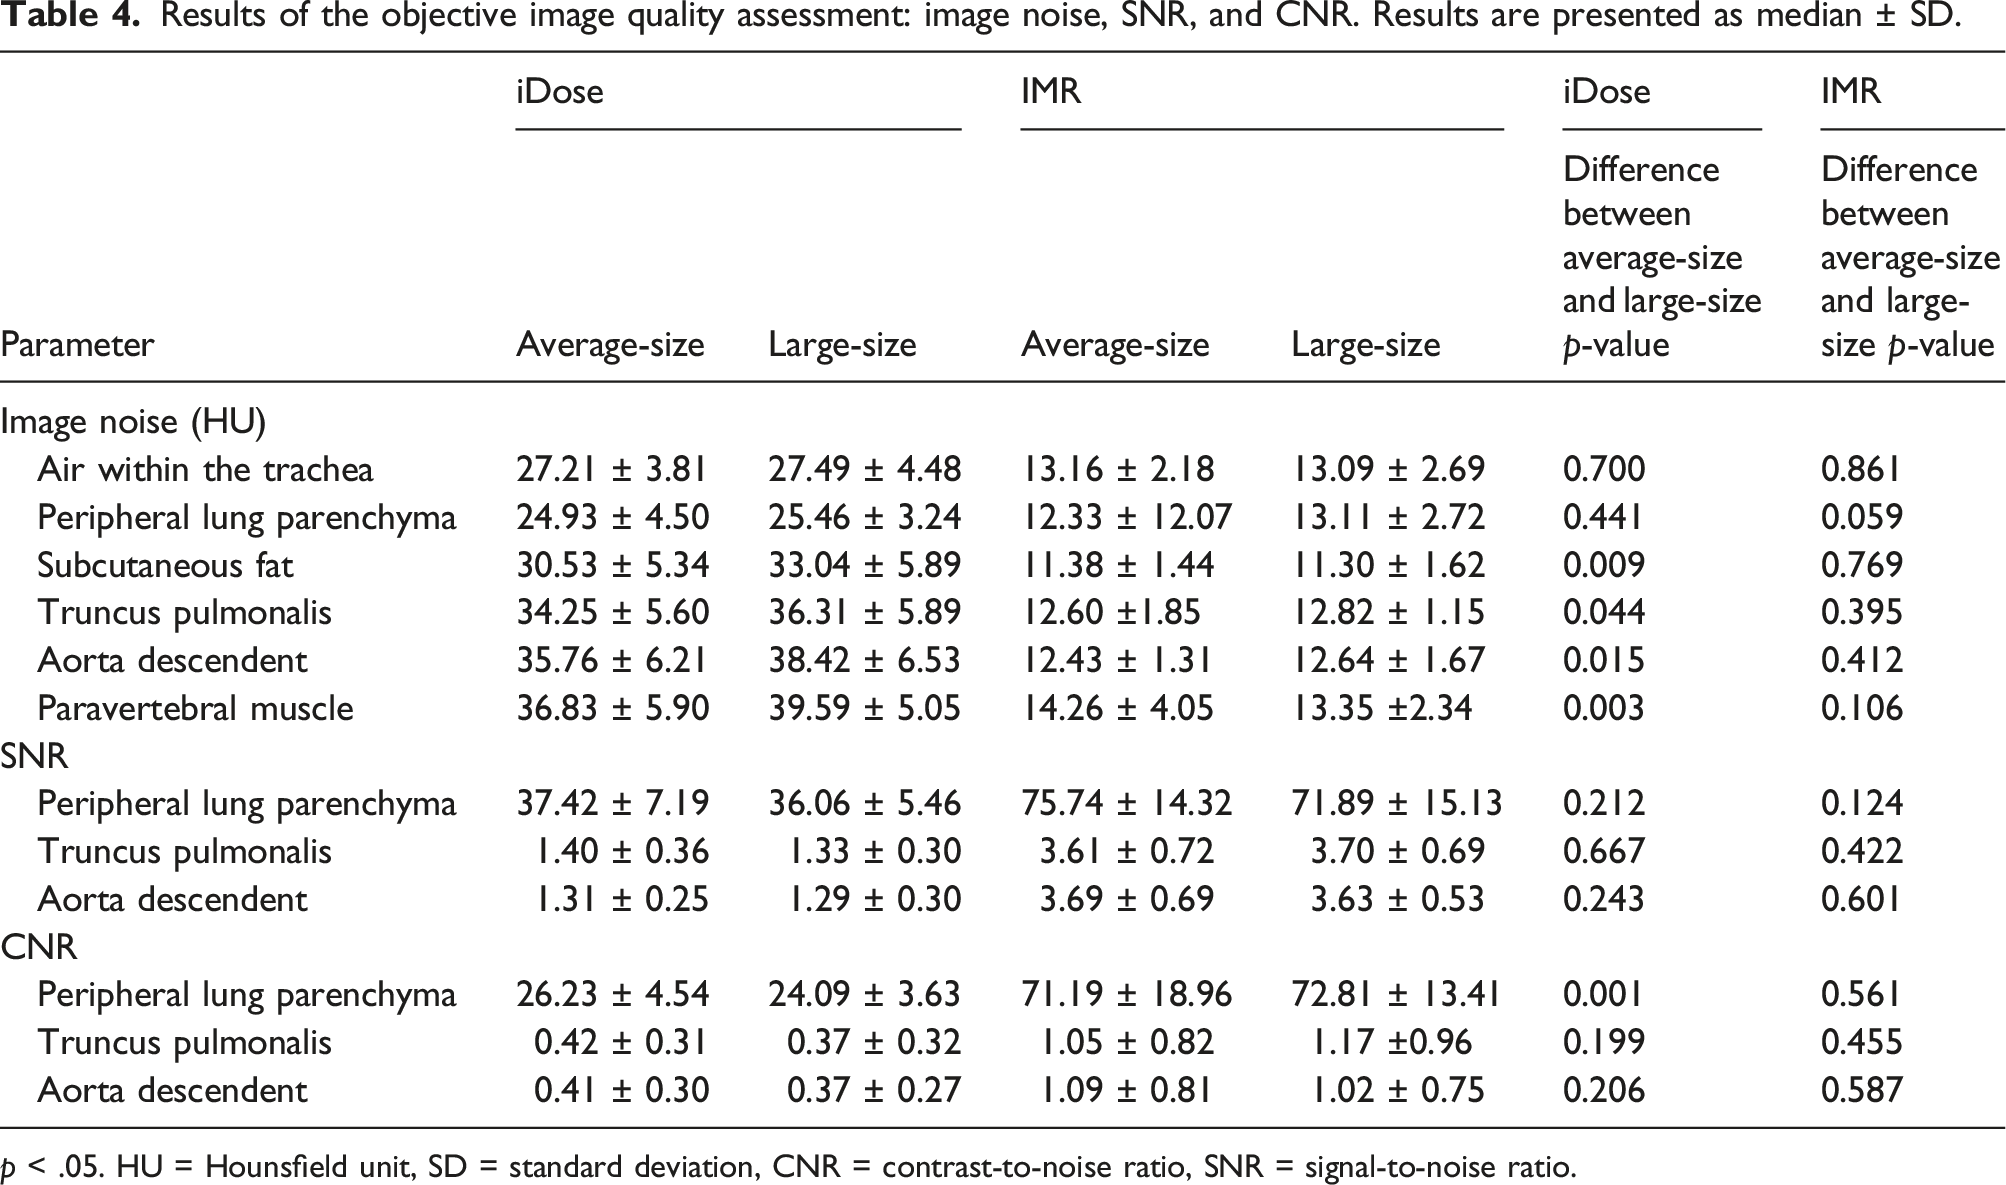
p < .05. HU = Hounsfield unit, SD = standard deviation, CNR = contrast-to-noise ratio, SNR = signal-to-noise ratio.

Bar chart showing (a) SNR = signal-to-noise ratio and (b) CNR = contrast-to-noise ratio in mean for average-size and overweight. HU = Hounsfield units.
Discussion
In this study, the impact of a LDCT protocol on dose and image quality in both average-size and large-size patients was investigated. The results of this study showed a significantly higher radiation dose for large-size patient group compared to average-size. However, no significant difference in objective image quality was observed between the two patient groups.
Even though the risk of radiation-induced cancer is low compared to the benefits of LCS, it is important to keep all doses as low as possible, especially for patients undergoing repetitive examinations. 28 According to the ACR and AAPM recommendation, LDCT must be performed with a CTDIvol of ≤3.0 mGy for a standard-sized patient.18,20 In the present study, the mean CTDIvol for the average-sized patient was found to be 2.8 mGy, which is well within the recommendation. For protocols that use AEC methods, the tube output will be dependent on the patient’s anatomy. Our results also reveal that the Philips AEC (DoseRight Z + 3D) used in this study allowed the tube output to be adjusted according to patient size. Thus, mean CTDIvol used for the large-size patients was significantly higher than that of the average-sized patients. Other researchers have also reported CTDIvol < 3 mGy for average-size patients with appropriate reduction and increment for patients with lower and higher BMIs.29,30 No statistically significant difference was found between the radiation dose (CTDIvol, DLP, SSDE, and effective dose) related to gender within the same size group. The results are in agreement with doses reported by Chu et al 31 confirming that dose variation is dependent on patient size and not gender.
Mean CTDIvol observed in this study for average-sized and large-size patients (2.8 and 4.5 mGy, respectively) was higher than what AAPM proposes for a Philips Brilliance iCT 256 scanner (2.7 and 3.6 mGy, respectively). Additionally, mean DLP and ED observed for average-size patients in this study were 115 mGycm and 2 mSv, respectively, which are higher than what AAPM proposes for a standard-sized patient (≤75 mGycm and ≤1.0 mSv, respectively). 20 These discrepancies might be due to difference in scan parameters and scanning techniques. Also, difference in software version can affect the radiation dose according to the vendor. Besides, research has shown that small differences in scan techniques even with the use of AEC can lead to variation in radiation doses for the same patients. 32 Changes in the table height, scan length, and small differences in the patient’s positioning may also affect the patients’ radiation dose, according to research.32,33 For low-dose CT examination, the desired coverage is from the apex to the lung bases. However, technologist will often add a “safe margin” to the scan length to assure complete coverage, which may increase the DLP. 33 Hence, scan length should be adapted strictly to the clinical indication for each individual patient and must be limited to the area of interest in order to avoid unnecessary radiation dose to the patient.34,35 This suggest that there is potential for dose reduction which implies the protocol will benefit from optimization.
In lung screening, it is critically important to ensure high confidence in the detection and volumetric measurements of small lung nodules. 36 The assessment of small lung nodules does not require high CNR but good spatial resolution because of the inherent high contrast present in the chest. 37 Thus, the evaluation of the lung parenchyma can tolerate high noise. Therefore, it is important that careful attention be paid to the selection of exposure parameters in order to achieve the desired level of image quality. 36 Our results revealed no significant differences in image noise between patient sizes when images where reconstructed with IMR and 0.9 mm slice thickness. The reconstructed slice thickness is a critical determinant for the detection and volumetric measurement accuracy of small nodules as well as the ability to reconstruct images in multiple planes. Consequently, thinner slice thickness increases spatial resolution and decreases the partial volume effect even though it increases image noise.38,39 In the present study, slice thickness of 0.9 mm was used for both lung and soft tissue reconstructions. Study findings have shown greater variability and inaccuracy in volume determination of small nodules compared with large nodules with different slice thicknesses.38–40 Winer-Muram and colleagues 41 found that an increase in slice thickness leads to an increase in overestimation of nodule volume. Our data indicates that MBIR (IMR) improves the image quality of LDCT more than hybrid algorithm (iDose) which is in accordance with previous studies. 42
The present study has some limitations that need to be addressed. Thus, patient’s weight and height were not available for this study, making it impossible to calculate BMI of the patients. Hence, patient grouping was done based on AP diameter measured in axial slices at the carina and compared with that of previous studies where weight and height were recorded. The study would have benefited from a qualitative image quality assessment; however, this is a retrospective study so all images had been evaluated by one or two radiologist and image quality was considered clinically adequate. Finally, the study was carried out at a single institution. However, our findings are generally in line with previous studies and therefore may well be valid to other centers. In conclusion, this study showed that the CTDIvol values from a lung cancer screening program were within the AAPM recommended dose for average-size patients. It also showed the use of AEC adjusted the dose according to patient size without affecting image quality. However, the protocol might benefit from optimization of scan parameters in order to reduce the radiation dose further.
Footnotes
Declaration of conflicting interests
The author(s) declared no potential conflicts of interest with respect to the research, authorship, and/or publication of this article.
Funding
The author(s) received no financial support for the research, authorship, and/or publication of this article.