
Abstract
Keywords
Introduction
The latest global cancer statistics show that lung cancer ranks first in mortality and second in morbidity. 1 Due to the asymptomatic nature of early lung cancer, most patients present in the advanced stages when treatment opportunities are limited, resulting in reduced survival. Low-dose computed tomography (LDCT) plays an increasingly important role in early lung cancer screening. 2 Moreover, with the increasingly extensive application of artificial intelligence in medical research, the mining and analysis of medical image data have gained attention. Pulmonary ground-glass nodules are similar to ground glass in appearance. 3 Studies have shown that pulmonary ground-glass nodules, especially semi-solid nodules, are associated with a high probability of malignancy. Therefore, timely detection of pulmonary ground-glass nodules and subsequent interventions could reduce the incidence of lung cancer. 4 At present, the diagnosis of benign and malignant pulmonary ground-glass nodules is mainly based on the density and morphology of the nodules and the experience of radiologists, but sometimes it is still difficult to distinguish between benign and malignant nodules. 5 With the development of radiomics, medical images have gained unprecedented diagnostic advantages. There have been studies on combining image analysis and artificial intelligence to predict the presence of benign or malignant pulmonary ground-glass nodules, but a consensus has not been reached.6–9 This study aimed to assess the clinical value of radiomics parameters based on LDCT in the diagnosis of pulmonary ground-glass nodules.
Materials and Methods
Study Design
A retrospective analysis was performed on 274 patients who underwent LDCT scanning identifying pulmonary ground-glass nodules in the Affiliated Cancer Hospital of Chongqing University from January 2018 to March 2021. There were 84 males and 190 females, with an average age of 50 years (ranging from 21 to 81 years). All patients met the following inclusion criteria: 1) the nodule type was based on the pathology assessment, and 2) There was no history of other malignant tumors. The exclusion criteria were as follows: the nodules were too small to extract radiomics parameters. Information on gender, age, nodule position, spiculation sign, diameter, and smoking history were collected and recorded. The 274 cases were randomly divided into training and validation sets in a 7:3 ratio. The patient enrollment flowchart is shown in Figure 1. This study was approved by the Affiliated Chongqing University Cancer Hospital Ethics Committee (Ethical code: CZLS2022054-A).

Patient enrollment flowchart.
Image Acquisition
A GE Revolution CT scanner was used to obtain all images. CT scanning parameters were as follows: voltage 120 kV, current size 50 mA, scanning thickness 7 mm, and reconstruction thickness 1.5 mm. The reconstruction matrix was 512 × 512, and the pitch and interlayer spacing was 1 mm and 7 mm, respectively.
Extraction of Radiomics Parameters
LIFEx software was used to segment and extract the target lesions. The exported CT images in DICOM format were imported into LIFEx software, and the lesions were segmented manually slice by slice. The segmented regions of interest (ROIs) were examined to ensure that ROIs did not include peripheral blood vessels, the trachea, or normal lung tissue. As an example, an image of lesion tissue segmentation by LIFEx software is shown in Figure 2. The extraction of radiomics parameters was set as follows: image resampling parameters: 2 × 2 × 2 and binWidth: 64. A total of 47 parameters were extracted, including First Order Statistics, 10 Shape, 5 Gray Level Cooccurrence Matrix, 7 Gray Level Run Length Matrix, 11 Gray Level Size Zone Matrix, 11 and Neighboring Gray Tone Difference Matrix. 3
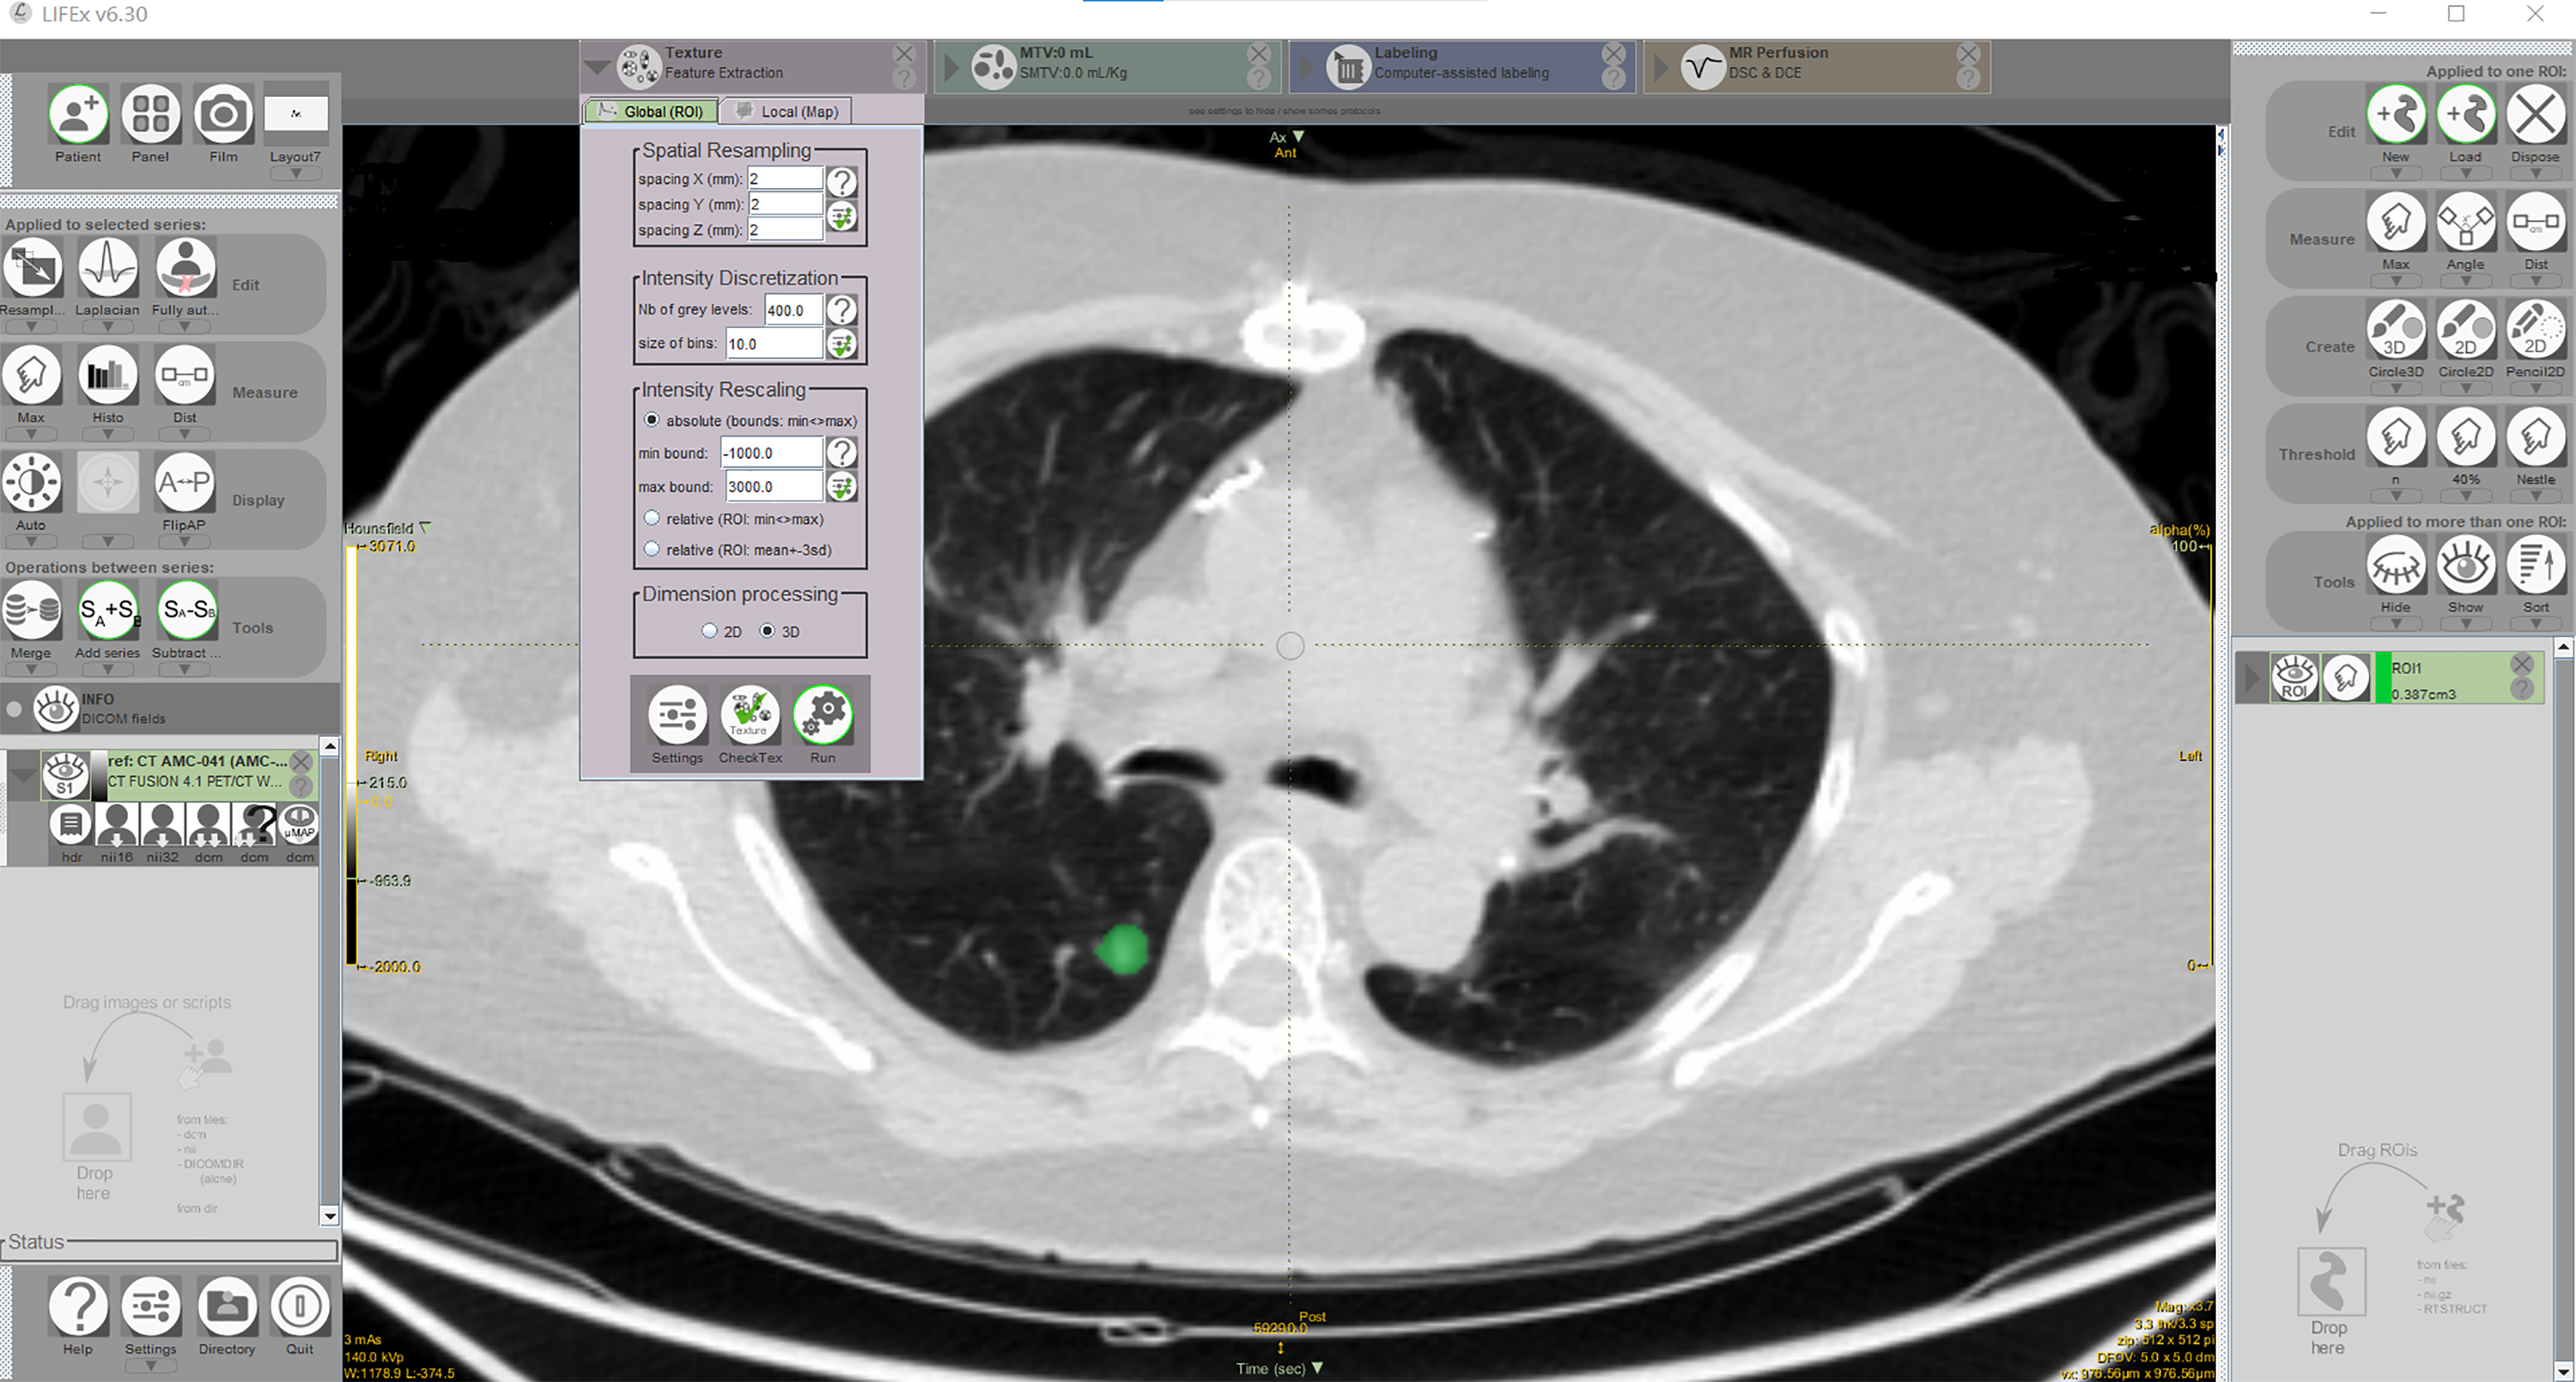
The lesion tissue segmentation by LIFEx software.
Feature Engineering, Modeling, and Selection
Feature engineering and modeling were only completed for the training set. Clinical, radiomics, and combined prediction models were established based on the stepwise regression method of binary logistic regression classifiers.
The same feature selection method was used in all three models. The recursive feature elimination (RFE) method was used for the first step selection. The parameters were selected according to the model accuracy. Then, the logical regression stepwise regression method was used to determine the parameters for establishing the model based on the Akaike information criterion (AIC). The model with the minimum AIC value was selected.
The clinical model included gender, age, nodule position, spiculation sign, diameter, and smoking history. The radiomics model included 47 radiomics parameters. The combined model included all clinical and radiomics variables.
Model Comparison, Optimal Model Selection, and Visualization
The indicators used for model comparison in this study included the AIC value used to establish the model, which reflects the good-of-fitness of model fitting with smaller values corresponding to a better good-of-fitness). The receiver operating characteristic (ROC) curve and the area under the curve (AUC) were also used for model comparison. AUC values closer to 1 correspond to a better ability of the model to distinguish between benign and malignant nodules.
After selecting the optimal model, the calibration curve was plotted to test the good-of-fitness of the model for the validation set. The calibration curve P-value was <.05, indicating no deviation between the predicted and observed values in the validation set. Finally, a nomogram was created to visualize the optimal model.
Statistical Methods
R software (version 3.6.3) was used for statistical analysis. Continuous variables were analyzed using T-tests or the Wilcoxon rank-sum test depending on whether the variables were normally distributed, and categorical variables were analyzed with Fisher's exact test. The “caret” package was used for fitting the logistic regression model and RFE parameter selection, and the “pROC” package was used for plotting the ROC curve. The “rms” package was used to plot the calibration curves and nomograms. P < .05 indicates statistically significant differences.
Results
Analysis of Enrolled Patients and Clinical Data
The 274 enrolled patients included 156 cases of lung adenocarcinoma (51 males and 105 females) and 118 cases of benign nodules (33 males and 85 females) confirmed by pathology. There were 191 patients in the training set (61 males and 130 females), including 109 lung adenocarcinoma and 82 benign nodule cases. There were 83 patients in the validation set (23 males and 60 females), including 47 lung adenocarcinoma and 36 benign nodule cases. Clinical data from 274 patients are shown in Table 1. The data show that nodule diameter and position were closely correlated with benign and malignant nodules (P = .005 and P < .001, respectively).
Comparison of Clinical Data of 274 Patients Enrolled in the Study

Comparison of Clinical Data between the Training and Validation Sets
The univariate analysis showed that patient age and nodule diameter were statistically different between benign and malignant nodules in the training set (P = .023 and P < .001), while only the nodule diameter was statistically different between benign and malignant nodules in the validation set (P = .021; Table 2).
Comparison of Clinical Variables.

Selection of Radiomics Parameters
The RFE method was combined with the logistic regression classifiers to select the most significant variables for predicting outcomes. Two radiomics parameters, GLZLM_SZLGE and Shape_Compacity, were considered stable. There were no statistically significant differences in radiomics parameters between benign nodules and lung adenocarcinoma in the two data sets (P > .05; Table 3).
Comparison of Radiomics Parameters in the Training and Validation Data Sets.

Comparison and Selection of Clinical Prediction Models
The clinical model included patient age and nodule diameter, the radiomics model included GLZLM_SZLGE and Shape_Compacity, and the combined model included GLZLM_SZLGE, Shape_Compacity, and nodule diameter. The ROC curve was plotted, and the predictive ability of the three models was compared based on their AUC values. In the training set, the ability of the three models to distinguish between benign and malignant pulmonary nodules was as follows: clinical model (AUC: 0.662, 95%CI: 0.588-0.736,ACC:0.634,sensitivity:0.486,specificity:0.829,PPV:0.791,NPV:0.548), radiomics model (AUC: 0.555, 95%CI: 0.471-0.638,ACC:0.576,sensitivity:0.633,specificity:0.500,PPV:0.627,NPV:0.506), and combined model (AUC: 0.711, 95%CI: 0.634-0.787,ACC:0.696,sensitivity:0.617,specificity:0.816,PPV:0.835,NPV:0.585). As the AUC value for the radiomics model is relatively low, in the validation set, the ability of the other two models with higher AUC values (the clinical model and the combined model) to distinguish between benign and malignant pulmonary nodules was investigated and the results are as follows: clinical model (AUC: 0.656, 95%CI: 0.542-0.770,ACC:0.639,sensitivity:0.468,specificity:0.861,PPV:0.815,NPV:0.554) and combined model (AUC: 0.695, 95%CI: 0.574-0.816, ACC: 0.747, sensitivity: 0.694, specificity: 0.824, PPV: 0.850,NPV: 0.651). The difference of AUC between the clinical model and the combined model in the training set and the validation set was significant (p < .05) according to the Delong test. Thus, the prediction ability of the combined model is slightly higher than that of the clinical model. The ROC curves of the combined model for the training and validation set are shown in Figure 3.

The ROC curves for the combined models (A) training set; (B) validation set.
Model Calibration
The results showed that the clinical and radiomics models had poor prediction ability in the validation set. However, when the clinical and radiomics models were combined, the predictive ability in the validation set was slightly higher than that in the training set. Calibration curves were plotted for the validation set according to the comparison results (Figure 4). The calibration curve showed that the model had good-of-fitness in the validation set (P = .775 > .05).

The calibration curve of the combined model in the validation set.
Establishing Nomograms
Finally, based on the combined model results, we created a nomogram to visualize the optimal prediction model (Figure 5).
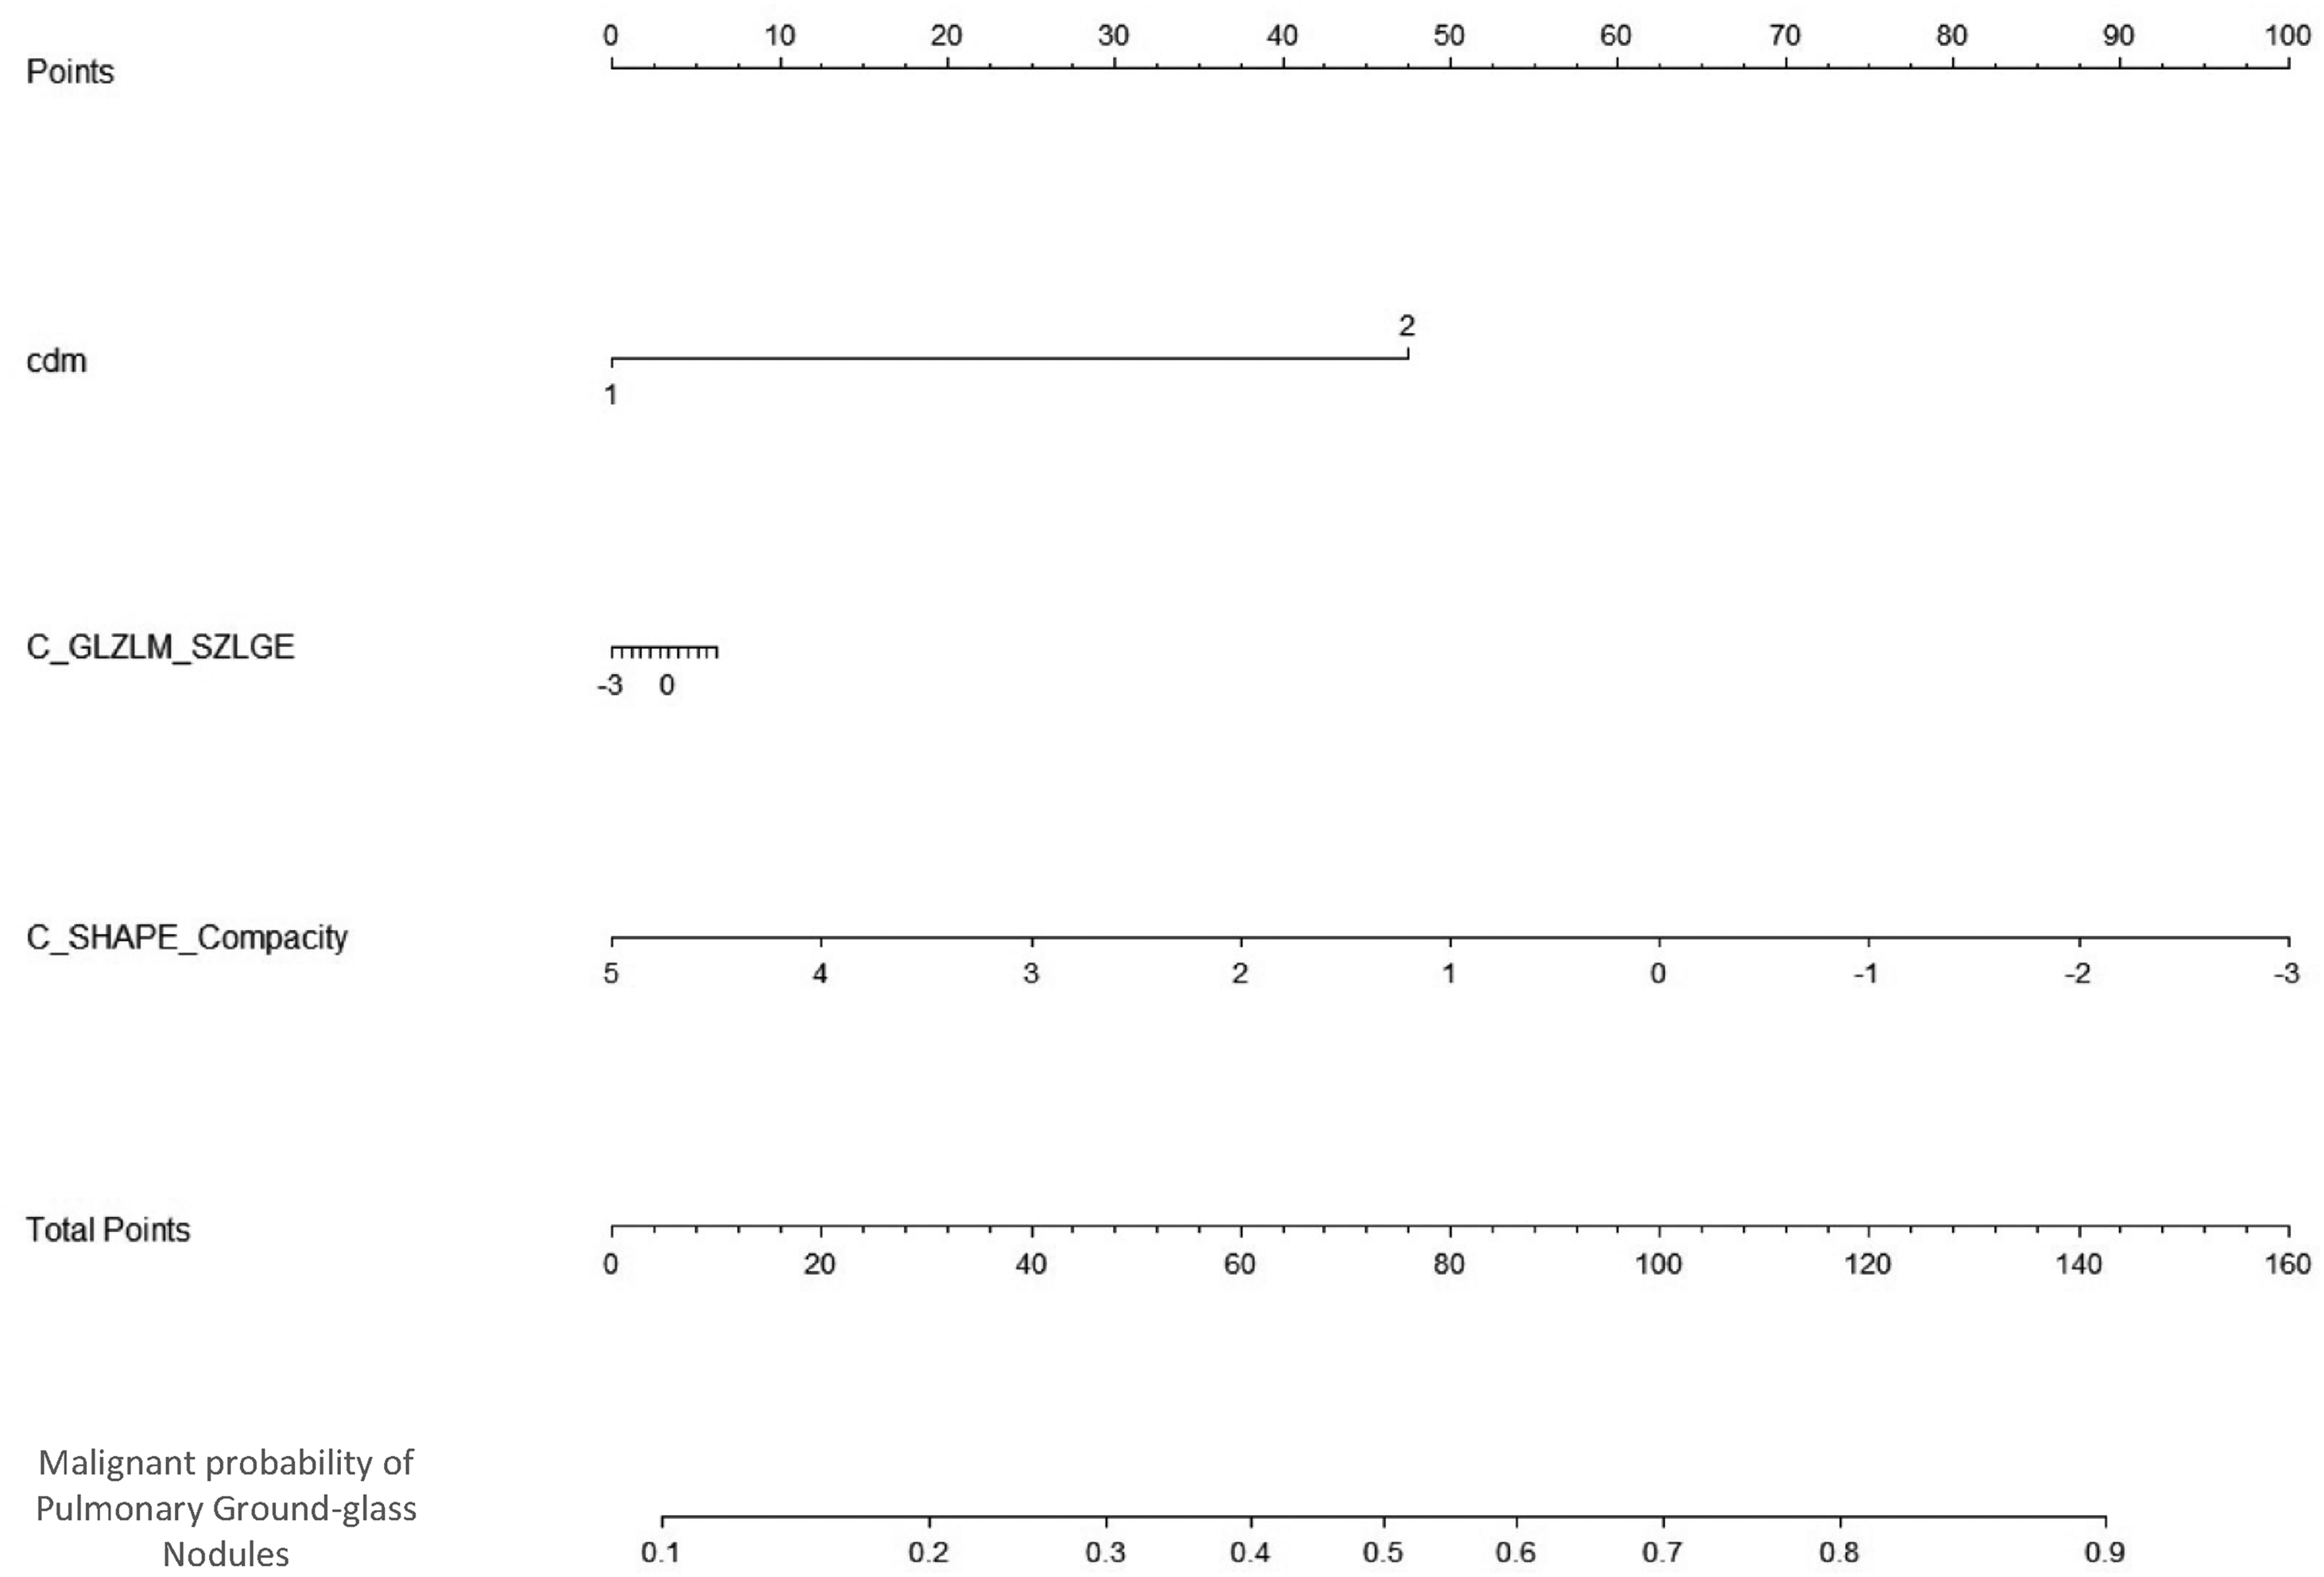
The nomogram based on the combined model. Notes: cdm is nodule diameter; 0 means ≤8 mm; 1 means >8 mm.
Discussion
With the aggravation of air pollution and other factors like smoking, the incidence of lung cancer has been increasing. Early screening, diagnosis, and treatment play a crucial role in lung cancer prognosis, and early treatment by surgical resection can improve five-year survival rates. 10 During routine medical CT examinations, most patients undergo conventional CT for lung scanning. High radiation doses may be harmful to healthy people. Therefore, LDCT has gradually become the main means of lung disease screening for people undergoing a physical examination. In this study, data from patients with pulmonary ground-glass nodules identified during LDCT scanning and confirmed by a pathology diagnosis were collected. A clinical prediction model was established using artificial intelligence to predict the benign and malignant pulmonary ground-glass nodules.
Many recent studies have compared the value of low-dose and conventional CT in detecting and diagnosing pulmonary ground-glass nodules. Liu 11 and Zhu et al 12 used conventional and LDCT to compare the detection rate of pulmonary ground-glass nodules, and the results showed that LDCT had a higher image quality and detection rate of nodules than conventional CT. The higher-order parameters derived from CT images also have predictive value for the pathological results of pulmonary ground-glass nodules. Xu et al 13 used CT density histograms to study 126 patients with pulmonary ground-glass nodules, and their results showed that the average CT value, maximum CT value, skewness, and kurtosis density difference indexes could predict pathological grade. Feng et al 14 conducted a computer-aided diagnostic study on 121 patients with early ground-glass nodule adenocarcinoma. Their results showed that computer-aided diagnosis could be used to quantitatively evaluate the internal characteristics of pure ground-glass nodules and distinguish between infiltrating lesions and pre-infiltrating/micro-infiltrating lesions.
With the advancements in precision medicine and statistical methods, clinical prediction models are widely used. Further, the wide application of radiomics parameters has also brought unprecedented advantages to medical imaging. Recently, the research focus has gradually turned to combining artificial intelligence and radiomics to predict benign and malignant pulmonary ground-glass nodules. In this study, three prediction models were established to compare the research value of clinical variables with radiomics parameters in predicting benign and malignant nodules. A total of 47 radiomics parameters were extracted to evaluate nodules density, morphology, and internal heterogeneity. After comparing the three models, we found that the combined model, including nodule location, size (diameter), and density had the best predictive ability. Eguchi et al 15 showed that tumor size and tumor density on CT images more accurately predicted the invasiveness of ground-glass nodules. In our model, nodule size (diameter) and density were also important variables for predicting benign and malignant nodules. Similar to our approach, Zhao et al 9 studied 626 cases of pathologically confirmed ground-glass nodules and included the average CT value in their final prediction model. The tumor density on CT images could distinguish between benign and malignant nodules. Similar research results were also described by Gao et al. 7
However, the results are different when radiomics parameters are analyzed. The following reasons could account for the differences: (1) The software and settings of extraction parameters were different; (2) Differences in the included cases could lead to different results; (3) Different modeling classifiers and feature selection methods could lead to different results.
The main limitations of our study were the small sample size and the lack of external tests on the model. Also, since only patients with pathologically confirmed lung adenocarcinoma were included, the applicability to other cancer types may have certain limitations.
Footnotes
Abbreviations
Declaration of Conflicting Interests
The author(s) declared no potential conflicts of interest with respect to the research, authorship, and/or publication of this article.
Funding
The author(s) disclosed receipt of the following financial support for the research, authorship, and/or publication of this article: This work was supported by the Decision Consultation and Management Innovation Project of Science and Technology Bureau of Shapingba District, Chongqing, Key Project of Chongqing Technology Innovation and Application Development, Key Technology Project for Prevention and Control of Major Diseases in Chongqing, (grant number Jcd202112, CSTC2019JSCX-FXYD0025, 2019ZX002).