
Abstract
Purpose:
To compare the diagnostic performance of a thick-slab reconstruction obtained from an ultra-low-dose CT (termed thoracic tomogram) with standard-of-care low-dose CT (SOC-CT) for rapid interpretation and detection of pneumonia in hemato-oncology patients.
Methods:
Hemato-oncology patients with a working diagnosis of pneumonia underwent an SOC-CT followed by an ultra-low-dose CT, from which the thoracic tomogram (TT) was reconstructed. Three radiologists evaluated the TT and SOC-CT in the following categories: (I) infectious/inflammatory opacities, (II) small airways infectious/inflammatory changes, (III) atelectasis, (IV) pleural effusions, and (V) interstitial abnormalities. The TT interpretation time and radiation dose were recorded. Sensitivity, specificity, diagnostic accuracy, ROC, and AUC were calculated with the corresponding power analyses. The agreement between TT and SOC-CT was calculated by Correlation Coefficient for Repeated Measures (CCRM), and the Shrout-Fleiss intra-class correlations test was used to calculate interrater agreement.
Results:
Forty-seven patients (mean age 58.7 ± 14.9 years; 29 male) were prospectively enrolled. Sensitivity, specificity, accuracy, AUC, and Power for categories I/II/III/IV/V were: 94.9/99/97.9/0.971/100, 78/91.2/86.5/0.906/100, 88.6/100/97.2/0.941/100, 100/99.2/99.3/0.995/100, and 47.6/100/92.2/0.746/87.3. CCRM between TT and SOC-CT for the same categories were .97/.81/.92/.96/.62 with an interobserver agreement of .93/.88/.82/.96/.61. Mean interpretation time was 18.6 ± 5.4 seconds. The average effective radiation dose of TT was similar to a frontal and lateral chest X-ray (0.27 ± 0.08 vs 1.46 ± 0.64 mSv for SOC-CT; P < .01).
Conclusion:
Thoracic tomograms provide comparable diagnostic information to SOC-CT for the detection of pneumonia in immunocompromised patients at one-fifth of the radiation dose with high interobserver agreement.
This is a visual representation of the abstract.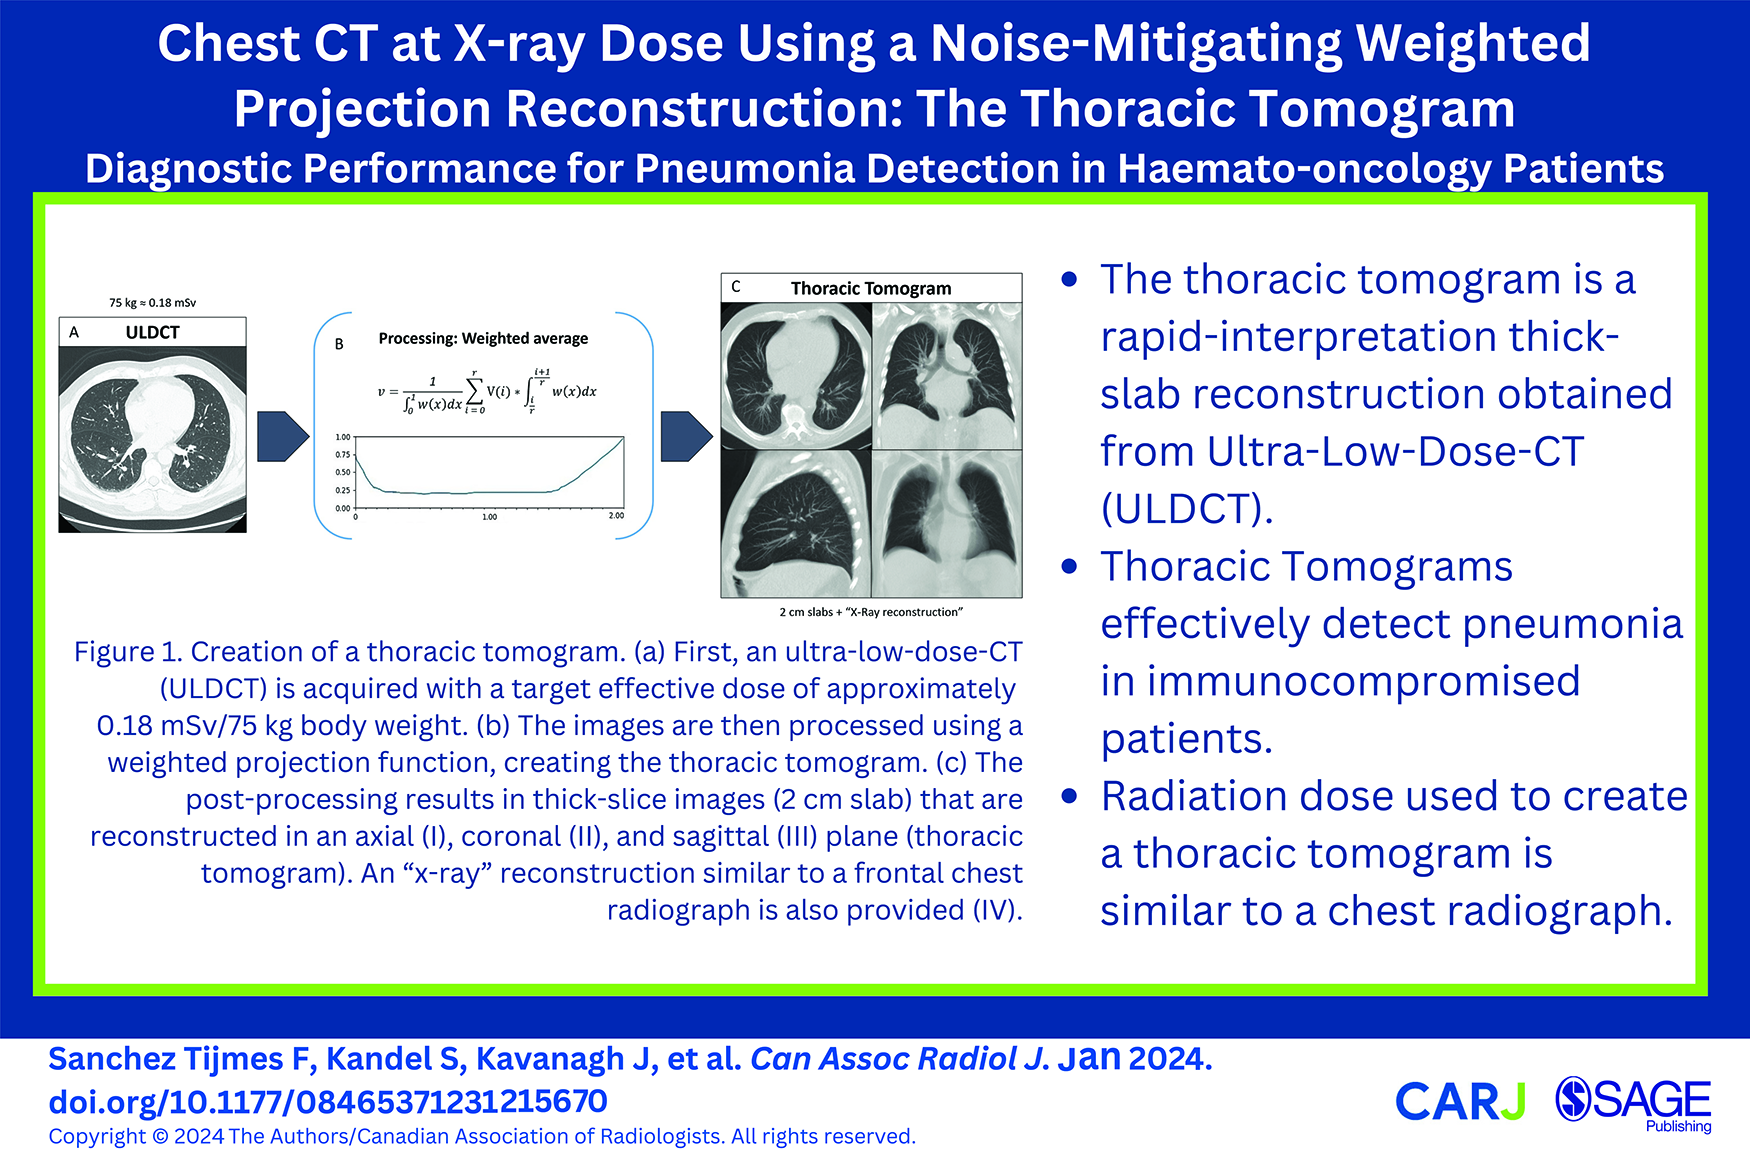
Introduction
Pulmonary infections are a major cause of morbidity and mortality in hemato-oncology patients. Up to one-fifth of patients undergoing chemotherapy for hematologic malignancies will develop some form of pneumonia during the course of treatment. 1
Chest X-ray has been historically the first imaging approach in the work-up of pneumonia.2,3 However, its diagnostic performance is suboptimal and may lead to under- or overdiagnosis.4,5 Compared to chest CT, the sensitivity and positive predictive value for the presence of pulmonary opacities have been reported to be as low as 43.5% and 26.9%, respectively. 6 Thus, some authors advocate using chest CT as a first imaging technique in immunocompromised populations to improve patient management,4,7 at the expense of increased radiation exposure. 8
Low-dose chest CT (LDCT) has been shown to be a suitable alternative to standard-dose CT for assessing pneumonia, 9 although radiation dose is still non-negligible. 10 Ultra-low-dose CT (ULDCT) is becoming an increasingly viable alternative, given the continuous technological improvements and development of new image reconstruction techniques. 11 Despite technological advances, image noise remains an issue as a trade-off with dose reduction. 12 Besides, using CT instead of chest X-ray would imply an additional burden to the workload at a time of growing challenges with human health resources.13,14
A thick-slab, noise-mitigating projection technique for ULDCT, termed thoracic tomogram (TT), has been proposed to address the aforementioned issues. 15 Thoracic tomograms (TT) are derived from native Ultra-Low Dose Computed Tomography (ULDCT) images and were designed to potentially enhance the standard-of-care for patients who might otherwise undergo a conventional X-ray. The resultant TT images exhibit reduced noise compared to native ULDCT images, providing superior contrast between abnormal opacities and the surrounding healthy lung tissue, all while preserving satisfactory edge sharpness. Due to the increased slice thickness, the resulting image stacks comprise significantly fewer images than a standard CT. The clinical application of this technology, though, has yet to be studied.
This study aims to compare the diagnostic performance of TTs to that of a standard-of-care LDCT of the chest (SOC-CT) for the detection of imaging features of pneumonia in hemato-oncology patients. The secondary objectives are to explore the time required to analyze a TT and compare the radiation dose and subjective image quality of TT and SOC-CT.
Materials and Methods
Patients
This study was approved by the institutional Research Ethics Board. Patients from the hemato-oncology clinic (Table 1), in which pneumonia was the diagnosis of exclusion, were prospectively recruited between September and November 2020. All patients had been previously scheduled for a chest SOC-CT. Potential candidates were identified at the time of protocoling based on the information provided on their medical requisition. Informed consent was obtained from all participants. The participants’ relevant history, clinical question, age, and body mass index were taken from the electronic patient records.
Patients Characteristics.
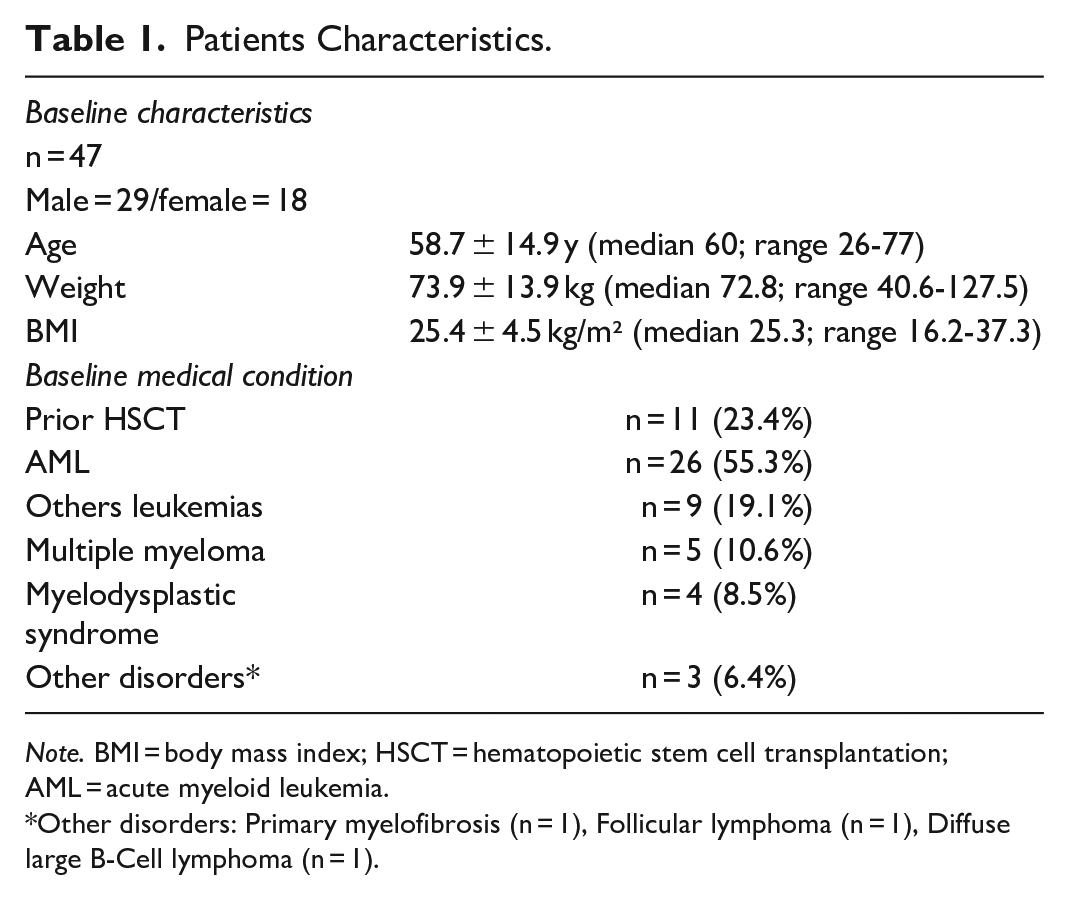
Note. BMI = body mass index; HSCT = hematopoietic stem cell transplantation; AML = acute myeloid leukemia.
Other disorders: Primary myelofibrosis (n = 1), Follicular lymphoma (n = 1), Diffuse large B-Cell lymphoma (n = 1).
CT Protocol
Participants underwent the requested non-contrast SOC-CT, immediately followed by an ULDCT from which the thoracic Tomograms were reconstructed. All examinations were performed on a Canon Aquilion One scanner (physical beam collimation of 160 mm × 0.5 mm; rotation time 0.35 seconds). The SOC-CT was obtained with a tube voltage of 135 kV, automatic tube current modulation (Sure Exposure 3D, min mA 20, max mA 200, SD 30 mA) and a pitch factor of 0.813. Images were reconstructed with a slice thickness of 3 mm (slice interval of 2.4 mm), using a soft tissue and lung kernel. Coronal and sagittal reformations were also generated with 3 mm slice thickness; maximum-intensity-projection (MIP) and minimum-intensity projections (MinIP) with 8 mm thickness and 1 mm increment (sliding MIPs and MinIPs) were routinely generated as part of the SOC-CT protocol.
The ULDCT protocol aimed for a dose of 0.18 mSv for a 75 kg patient. The protocol comprised of a tube voltage of 135 kV with a fixed tube current of 10 mA for patients <90 kg or 15 mA for patients >90 kg, and a pitch factor of 1.388.
ULDCT Image Post-Processing
The ULDCT images were post-processed using a weighted projection function to generate the thoracic tomograms. Essentially, for each voxel in the output image, the contributing voxels from the input image were sorted by increasing CT number to produce a vector V. The CT number of each voxel in V is multiplied by a normalized weight coefficient according to its position in V. As in maximum intensity projections, the voxels with the largest CT numbers in V receive the largest weight. The voxels with the lowest CT numbers also receive a relatively higher weight than the middle voxels (15). The post-processing technique was tailored to generate 2 cm thick slices with 1 cm overlap in axial, coronal, and sagittal orientation with typical lung window settings (width: 1500, level: −600). An additional 10 cm thick-slab average projection was generated to emulate a conventional X-ray (Figure 1, Video 1). All images were sent to PACS under a new accession number.
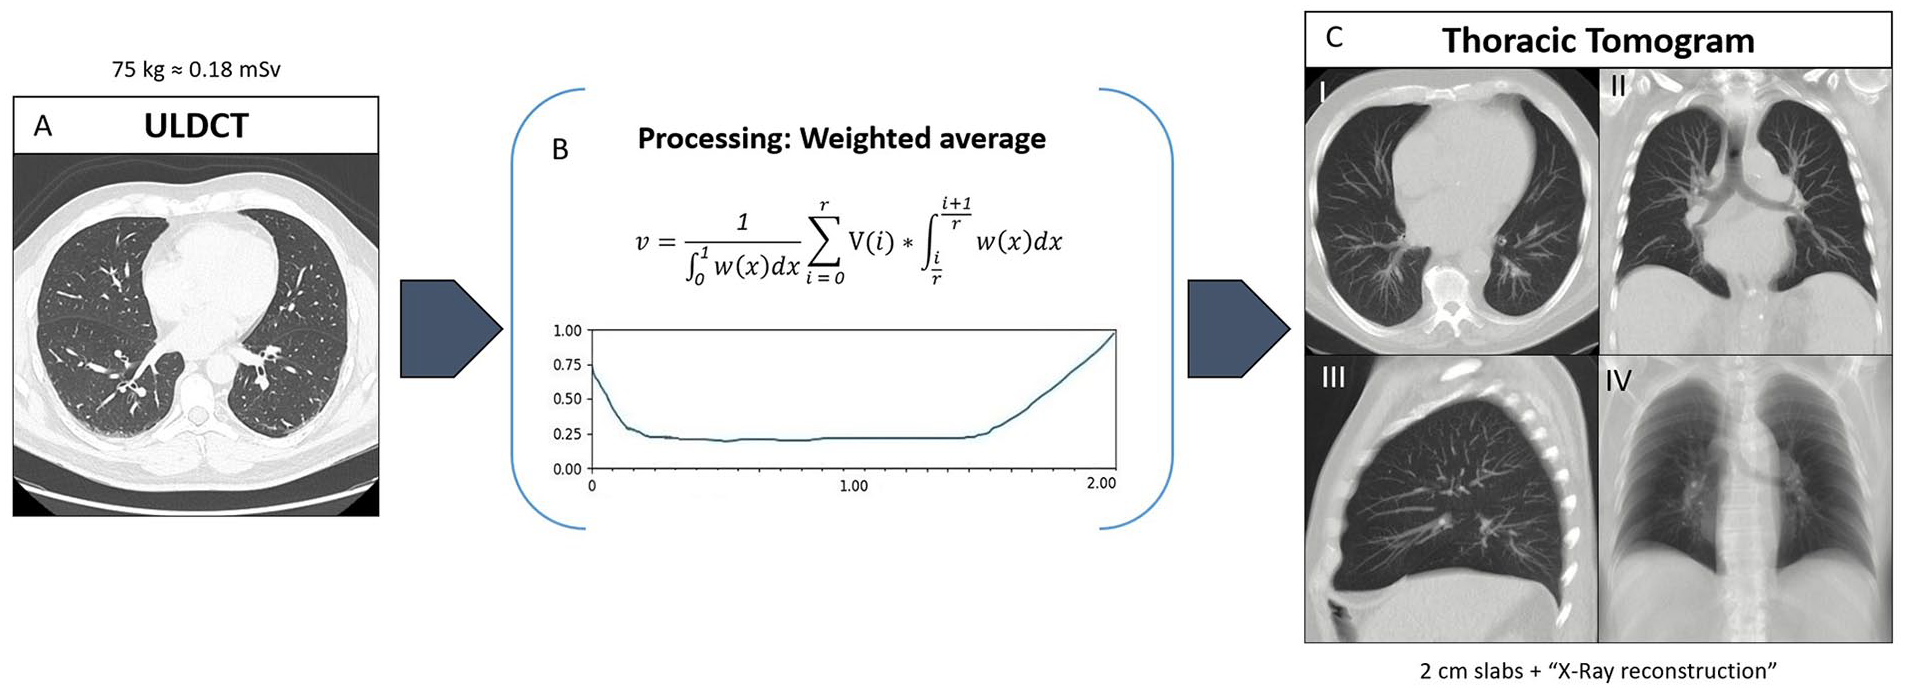
Creation of a thoracic tomogram. (A) First, an ultra-low-dose CT (ULDCT) is acquired with a target effective dose of approximately 0.18 mSv/75 kg body weight. (B) The images are then processed using a weighted projection function, creating the thoracic tomogram. (C) The post-processing results in thick-slice images (2 cm slab) that are reconstructed in an axial (I), coronal (II), and sagittal (III) plane (thoracic tomogram). An “X-ray” reconstruction similar to a frontal chest radiograph is also provided (IV).
Image Interpretation
The TT (ie, the processed images) and SOC-CT images were available for review on a clinically used PACS workstation. Three chest radiologists (R1 = 15 years of experience, R2 = 10 years of experience, R3 = 8 years of experience) blinded to the SOC-CT images independently evaluated the TTs in the following imaging patterns: (I) infectious/inflammatory opacities (ie, consolidation, ground-glass opacities, and large nodules), (II) small airways infectious/inflammatory changes (i.e., tree-in-bud opacities and centrilobular nodules), (III) atelectasis, (IV) pleural effusions, and (V) interstitial abnormalities (ie, pulmonary edema, fibrosis) (Figure 2). A scale of −4 = confidently absent to +4 = confidently present was used to assess each category. Any positive score was considered as positive, and any negative score was considered as negative. We excluded the “0” value to avoid ambiguity. The time required to assess each TT was measured by an external observer and recorded as the interpretation time. Readers were only given the processed thoracic tomogram images, no native ULDCT images.
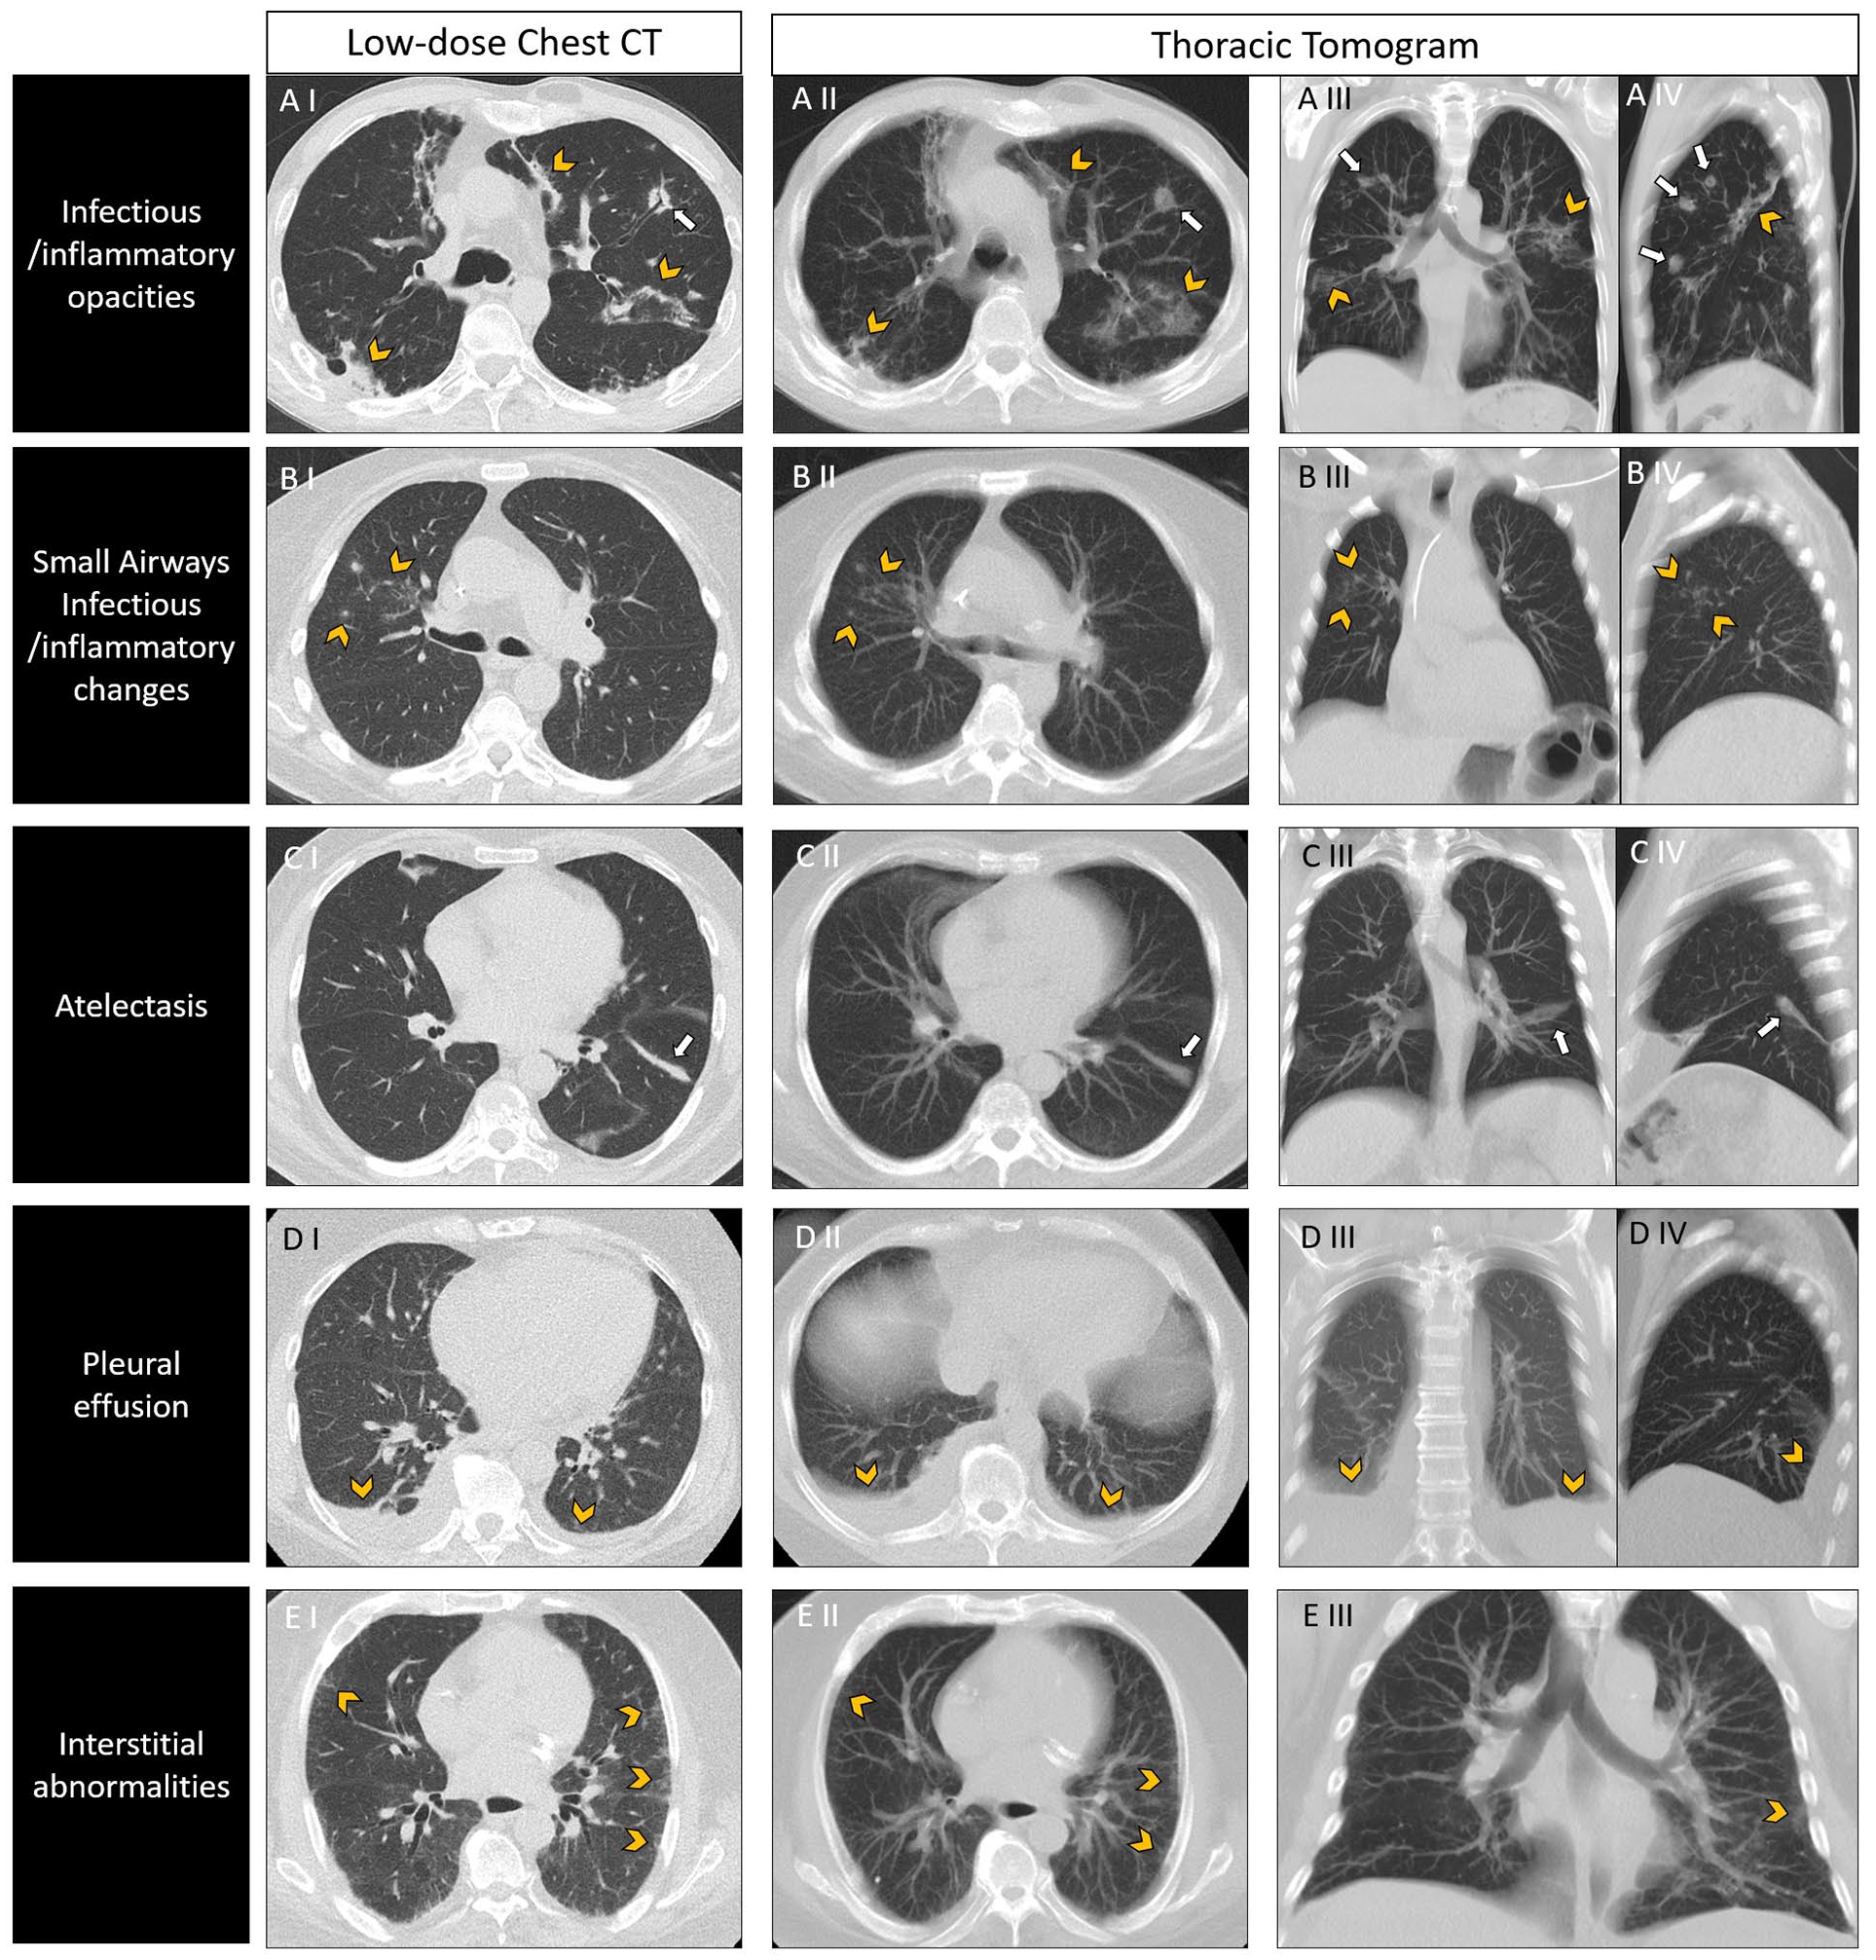
Different imaging patterns in low-dose chest CT and thoracic tomograms. (A) Infectious/inflammatory opacities in a 52-year-old male with biphenotypic acute leukemia and fever. Axial SOC-CT (A I) demonstrates patchy consolidation (arrowheads) and infectious nodules (arrows). Findings are easily depicted in axial (A II), coronal (A III), and sagittal (A IV) TT reformats. (B) Small airways Infectious/inflammatory changes in a 77-year-old female with AML. Axial SOC-CT (B I) shows clustered ill-defined centrilobular nodules in the right upper lobe (arrowheads). Clustered opacities were also identified in the corresponding axial (B II), coronal (B III), and sagittal (B IV) TT reformats (arrowheads). The patient had a chest radiograph from the same day, which was reported as normal (not shown). (C) Atelectasis in a 29-year-old female with ALL. SOC-CT (C I) revealed focal subsegmental atelectasis in the left lower lobe (arrow). TT reformats (C II, CII, C IV) clearly demonstrate the presence of the atelectatic band (arrows). (D) Pleural effusions in a 71-year-old male with AML. SOC-CT (D I) shows bilateral layering pleural effusions, which were correctly identified in the TT reformats (D II, D III, D IV) (arrowheads). (E) Interstitial abnormalities in a 70-year-old male with AML. Axial SOC-CT shows faint subpleural reticulation in the mid-lung (arrowheads). This appearance is inconspicuous in axial (E II) and coronal (E III) TT reformats. Of note, 2 out of 3 readers labelled the TT as a false negative.
After the evaluation of the TT, the corresponding SOC-CT images were unblinded, and the same imaging patterns were evaluated. The result of this evaluation was used as the individual reference standard for each reader separately. The purpose of this design was to diminish the effect of interobserver variability in diagnostic accuracy for the different categories.16,17 The readers ranked the subjective image quality of each TT and SOC-CT using a numerical scale ranging from 1 = non-diagnostic to 10 = best.
Radiation Dose Evaluation
The dose length product (DLP) of each series (SOC-CT and ULDCT) was obtained from the summary report. The effective dose was estimated for each acquisition by multiplying the DLP by a specific conversion coefficient for the chest (0.014 mSv mGy−1 cm−1). 18
Statistical Analysis
Statistical analyses were carried out using SAS 9.4 software (Cary, NC, USA). Continuous variables were reported as means ± standard deviation or medians and range, as appropriate. For the confidence score average, absolute values were used. Paired differences were compared using linear mixed models while accounting for the correlations between repeated measures within the same subject. Counts and proportions were provided for categorical variables.
Using the diagnosis provided on SOC-CT as a binary outcome (positive or negative confidence score value), sensitivity, specificity, and diagnostic accuracy were calculated for all readers combined and for each reader separately, and for every image interpretation category. Confidence receiver operating characteristic (ROC) curves (TT vs binary SOC-CT) and area under the curve (AUC) were generated, and the corresponding power analyses were performed (with a significance level of .01 to adjust for multiple comparisons). Using the continuous TT confidence score as the predictor variable, logistic regressions were conducted, and results were presented in the form of odds ratio (OR) (95% CI).
To assess the agreements between continuous confidence scores of TT and SOC-CT, the correlation coefficient for repeated measurements (CCRM) for all three readers combined were calculated and classified as follows: very high correlation (.9-1), high correlation (.7-.9), moderate correlation (.5-.7), low correlation (.3-.5), and negligible correlation (0-.3). Bland-Altman plots were generated for visual assessment.
The Shrout-Fleiss intra-class correlations (ICC) test was used to calculate inter-rater agreement using continuous TT and SOC-CT scores and classified as excellent agreement (>.9), good agreement (.75-.9), moderate agreement (.5-.75), and poor agreement (<.5). There was no missing data, and no patients were excluded from the analysis after their initial inclusion.
Results
Patient Characteristics
Forty-seven patients (29 male and 18 female) were recruited with a mean age of 58.7 ± 14.9 years. Their mean body mass index (BMI) was 25.4 ± 4.5 kg/m².
The most prevalent hematologic baseline condition was acute myeloid leukemia (n = 26, 55.3%), followed by other leukemias (n = 9, 19.1%), multiple myeloma (n = 5, 10.6%), myelodysplastic syndrome (n = 4, 8.5%), and other disorders (n = 3, 6.4%). Eleven patients (23.4%) had a history of hematopoietic stem-cell transplant. The prevalence of infectious/inflammatory opacities of any size in SOC-CT (i.e., prevalence of pneumonia, including categories I and II) ranged between 44.7% and 53.2% for the different readers. Patient characteristics are summarized in Table 1.
Image Interpretation
TT showed excellent diagnostic performance for inflammatory/infectious opacities (Video 2). For all observations from the 3 readers (n = 141), the sensitivity, specificity, and AUC were 94.9%, 99%, and 0.971, respectively, with a calculated power of 100% (Figure 3). Only 3 out of 141 observations were misclassified in this category (2 false positives and one false negative).
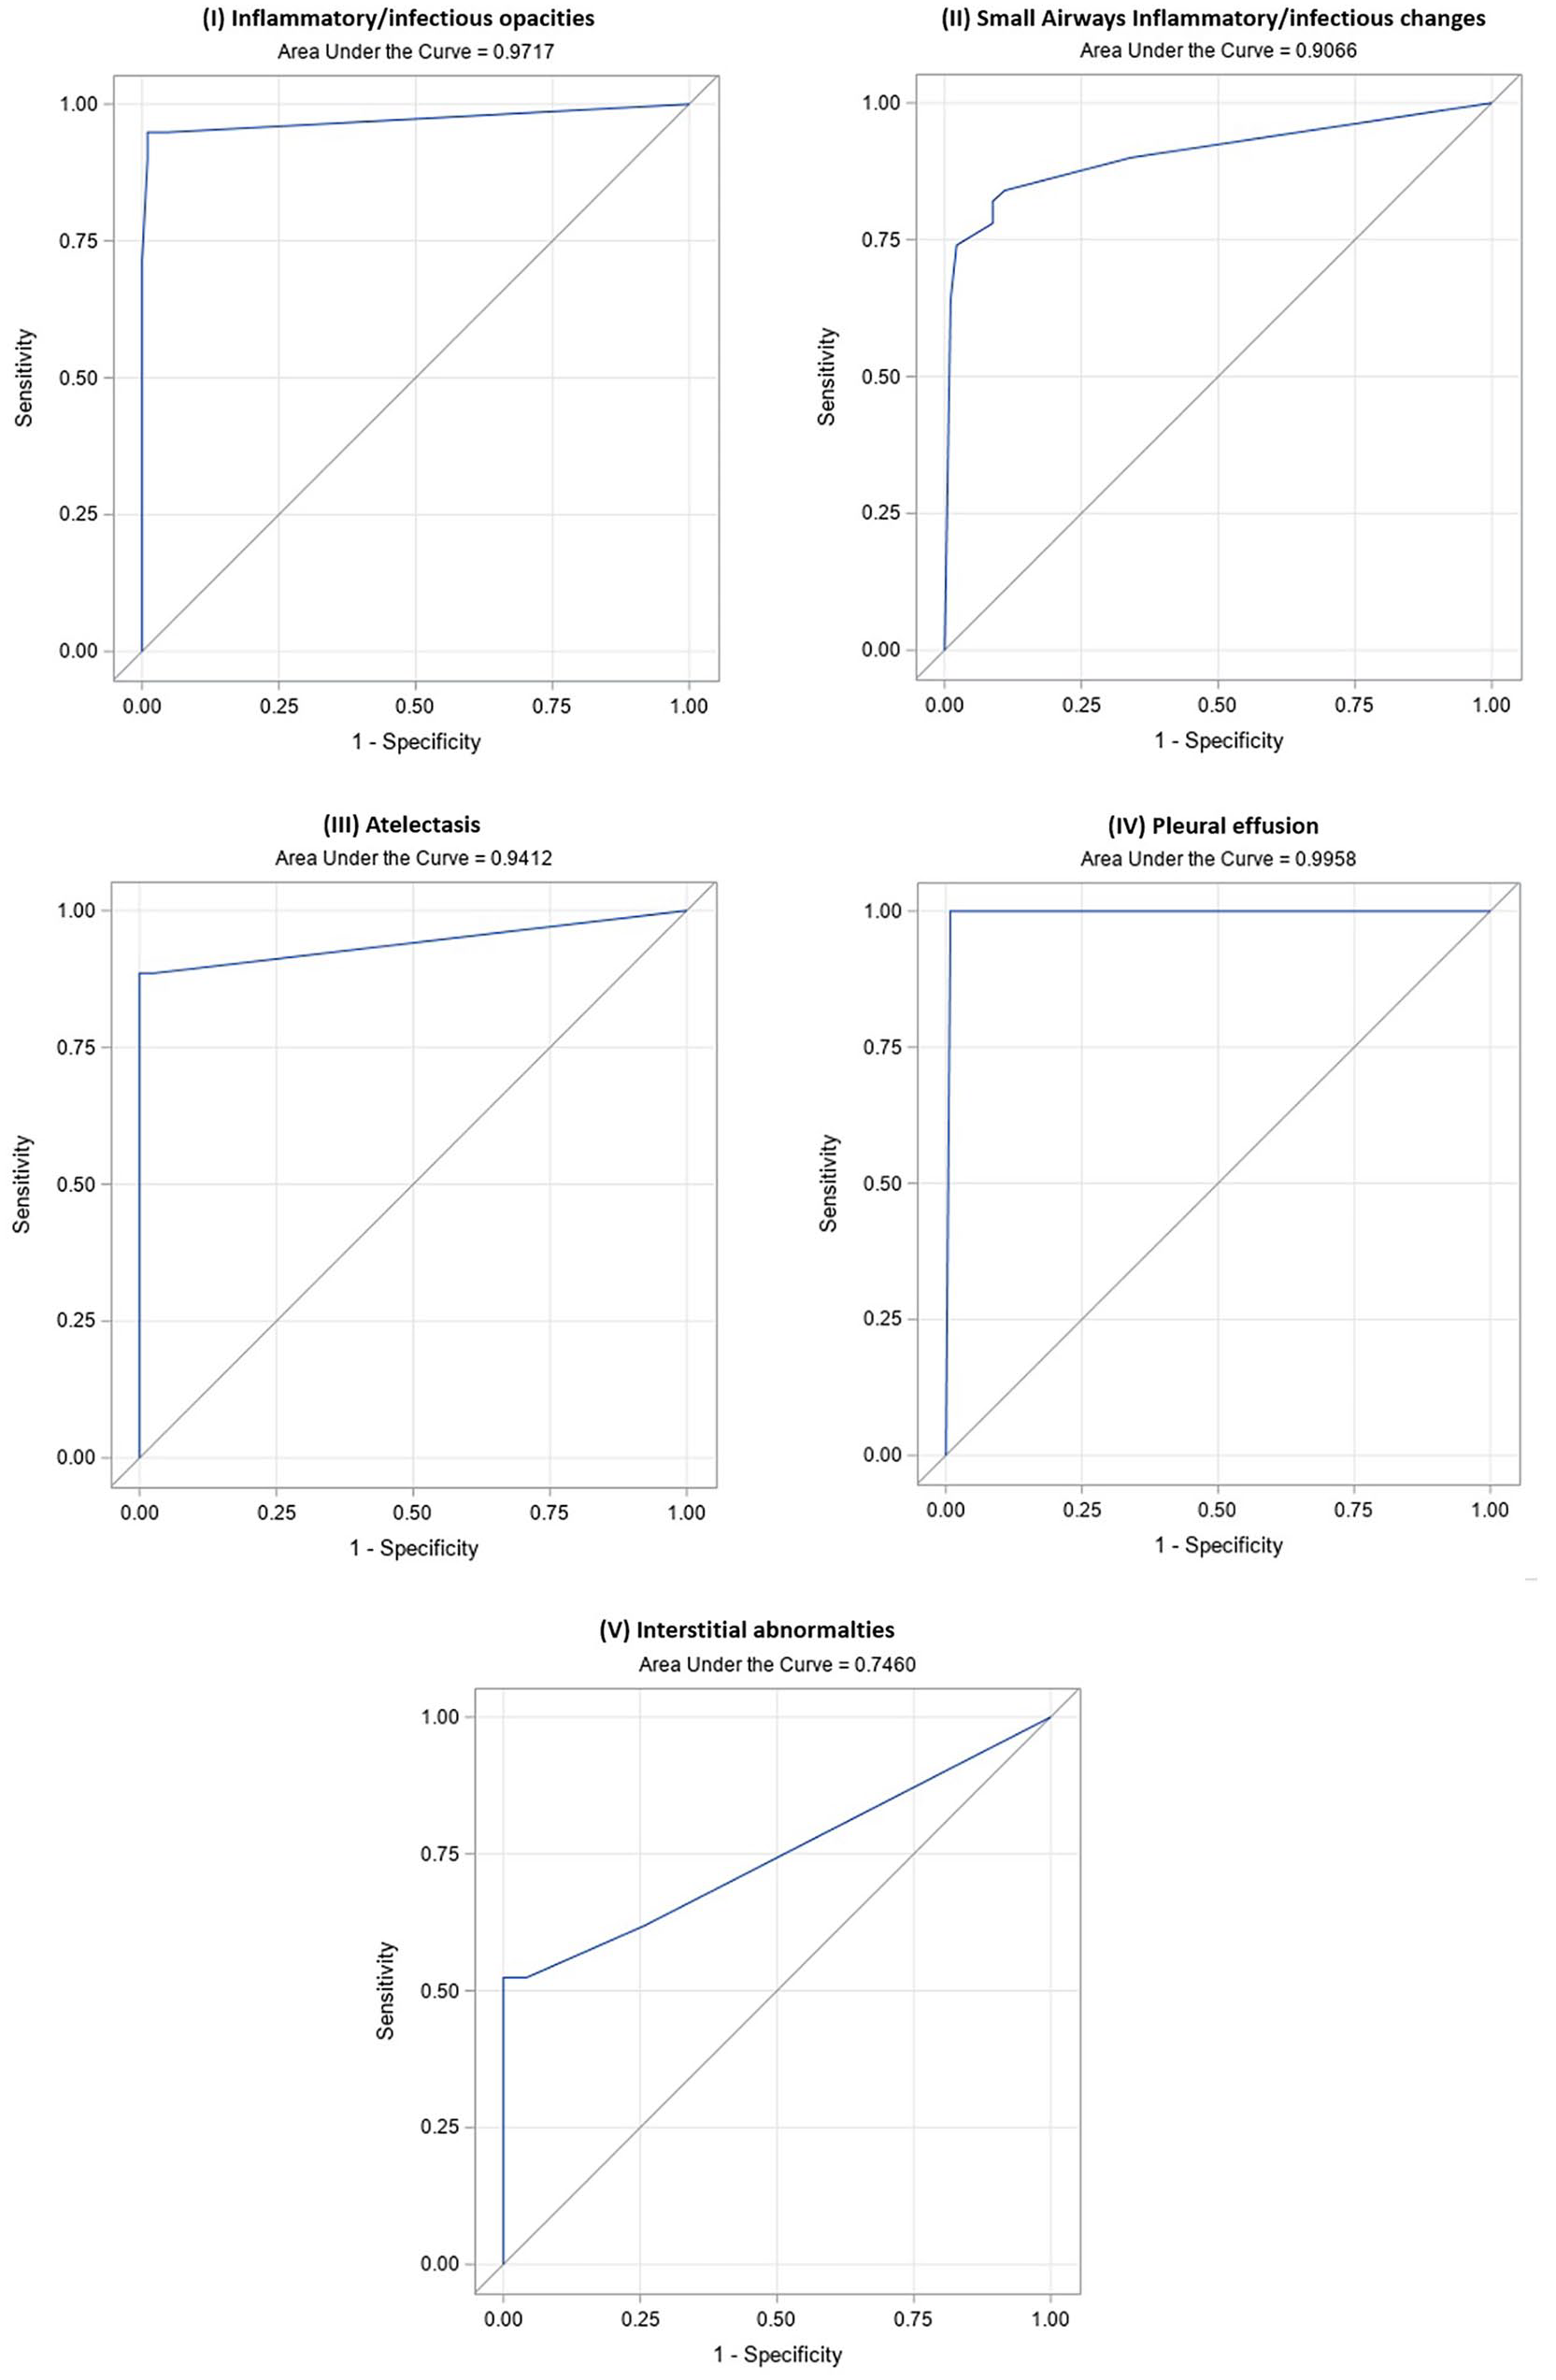
Thoracic tomograms ROC curves and respective AUC for (A) Inflammatory/infectious opacities, (B) Small airways infectious/inflammatory changes, (C) Atelectasis, (D) Pleural effusion, and (E) Interstitial abnormalities for all the observations combined (3 readers). AUC was high (>0.9) for all categories except for (E) Interstitial pattern (AUC 0.74).
The OR for the TT confidence score was 2.76 (P < .001): as the TT confidence score increased by 1 unit, the chances of inflammatory/infectious opacities increased 2.76 times. The average confidence score was 3.89 ± 0.36 for TT and 3.93 ± 0.33 for SOC-CT. There was a very high CCRM between TT and SOC-CT (.97), and interrater agreement was excellent (ICC .93) (Figure 4).
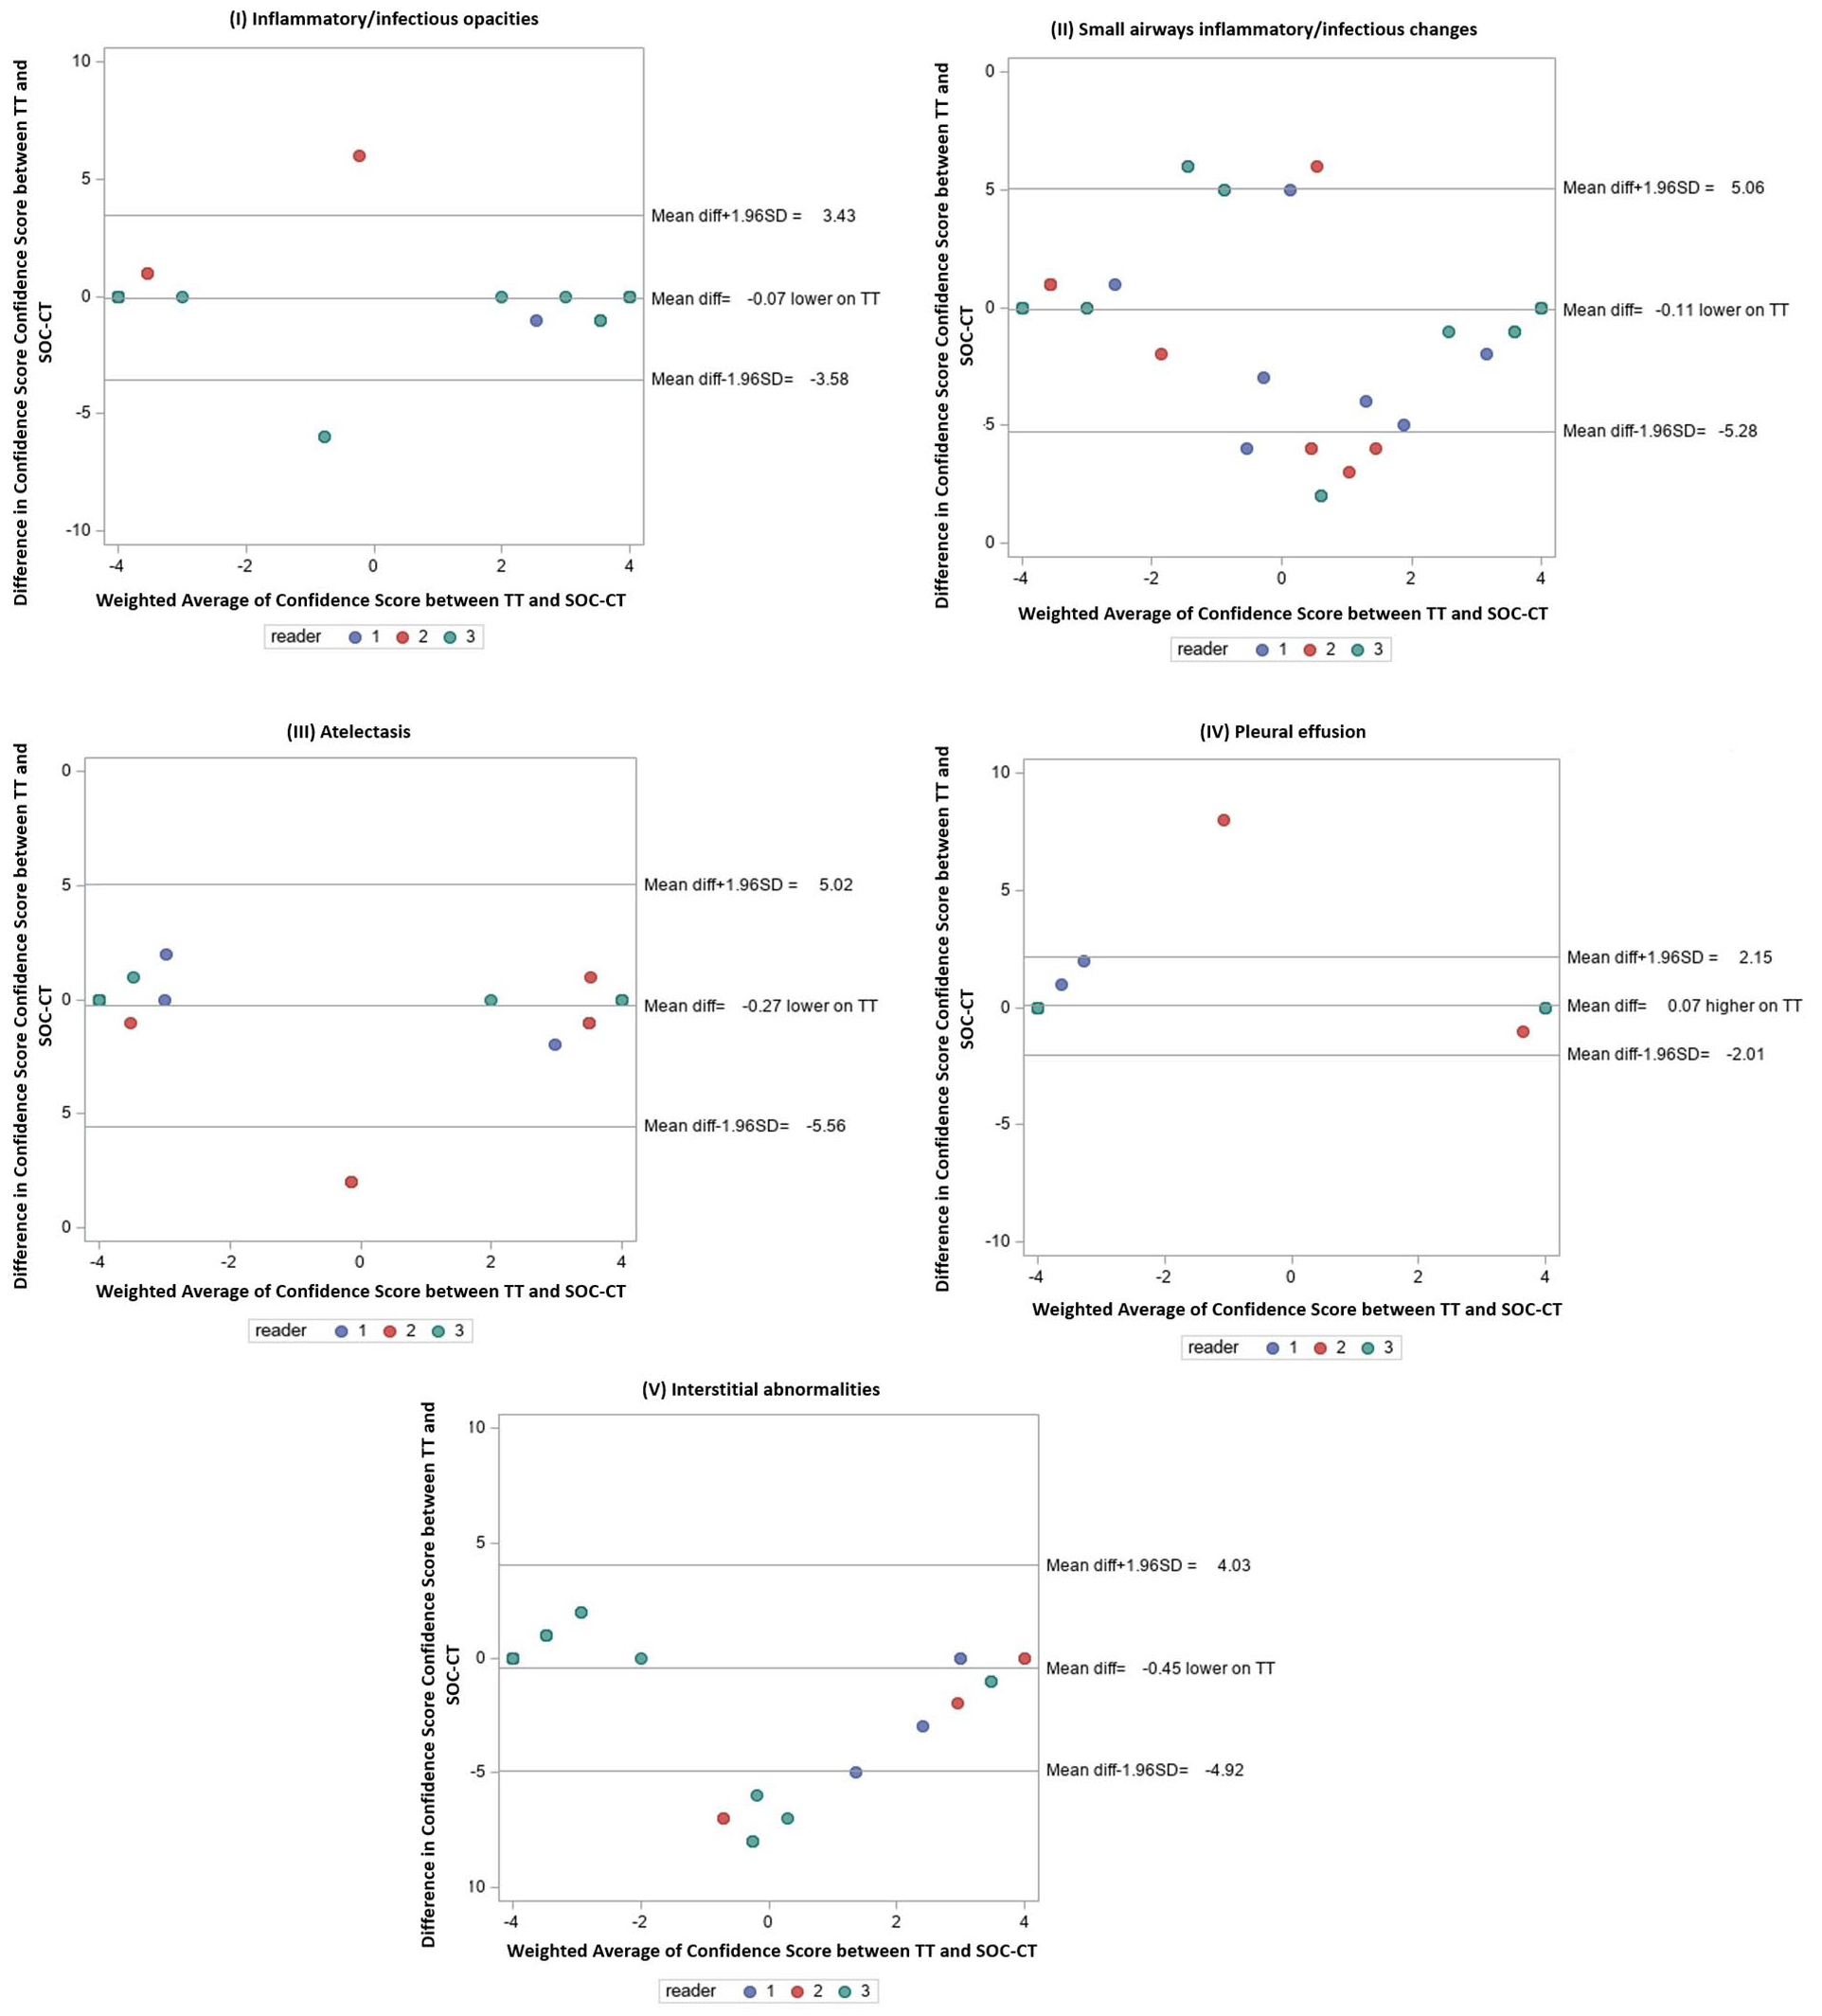
Bland-Altman plots of confidence scores from TT and SOC-CT, displaying mean bias and limits of agreement for (A) Inflammatory/infectious opacities, (B) Small airways infectious/inflammatory changes, (C) Atelectasis, (D) Pleural effusion, and (E) Interstitial abnormalities.
The diagnostic performance dropped for small airways infectious/inflammatory changes (sensitivity = 78%, specificity = 91.2%, AUC = 0.906, power = 100%), and CCRM between TT and SOC-CT, and the interobserver agreement were slightly lower as well (CCRM .81—high correlation; ICC .88—good interrater agreement).
The diagnostic performance was high for ancillary findings, including atelectasis and pleural effusions (atelectasis: sensitivity = 88.6%, specificity = 100%, AUC = 0.941, power = 100%; pleural effusions: sensitivity = 100%, specificity = 99.2%, AUC = 0.995, power = 100%). Of note, all the pleural effusions were classified as small in the SOC-CT report. There was very high CCRM between TT and SOC-CT for the latter imaging categories (CCRM atelectasis: .92; pleural effusion: .96). Interobserver agreement was good for atelectasis (ICC: .82) and excellent for pleural effusions (ICC: .96).
Diagnostic performance for interstitial abnormalities was lower than for the other categories (sensitivity = 47.6%, specificity = 100%, AUC = 0.746, power = 87.3%). Additionally, there were disparities between the different readers. CCRM between TT and SOC-CT (.62) and interrater agreement (.61) was only moderate for this category. All results are summarized in Table 2.
Results Summary.
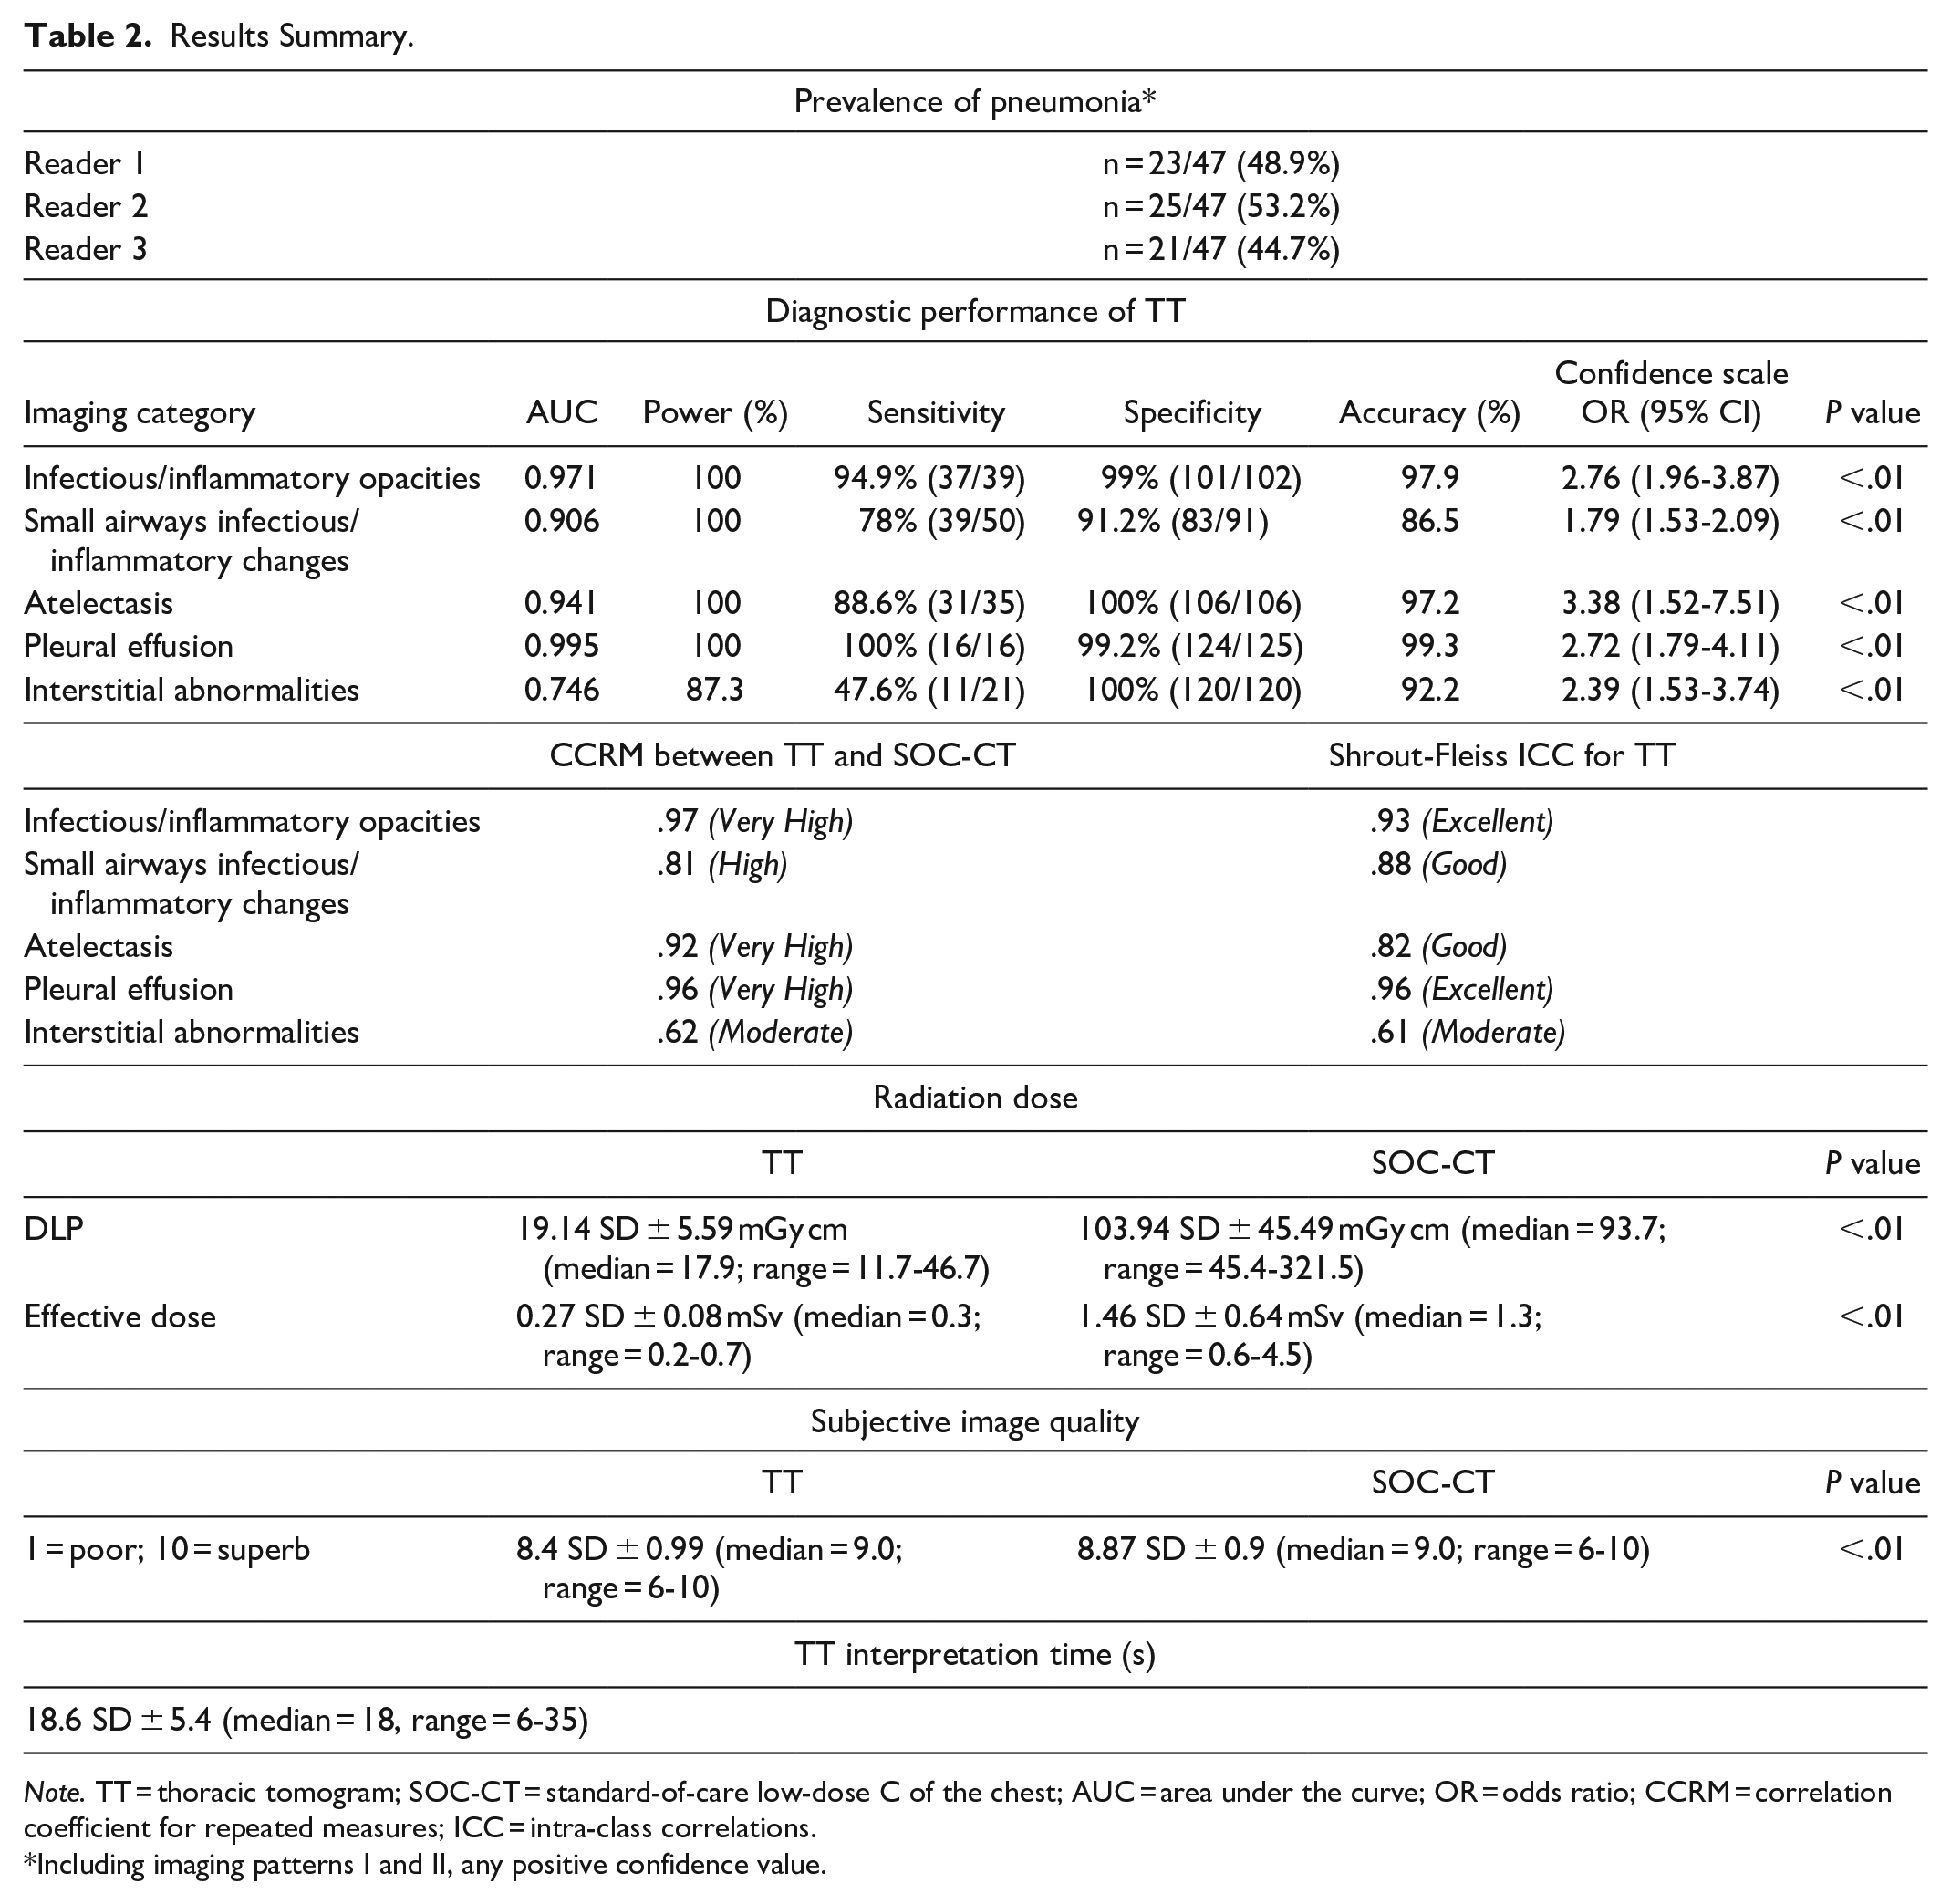
Note. TT = thoracic tomogram; SOC-CT = standard-of-care low-dose C of the chest; AUC = area under the curve; OR = odds ratio; CCRM = correlation coefficient for repeated measures; ICC = intra-class correlations.
Including imaging patterns I and II, any positive confidence value.
Interpretation Time, Radiation Dose, and Image Quality
The average interpretation time required for TTs, excluding the time for dictation, was 18.6 ± 5.4 seconds (median = 18; range = 6-35). The radiation dose deployed by the ULDCT from which the TT was reconstructed was approximately one-fifth of the dose deployed by the SOC-CT. The mean DLP of ULDCT was 19.14 ± 5.59 mGy cm with an estimated effective dose of 0.27 ± 0.08 mSv versus 103.94 ± 45.49 mGy cm and 1.46 ± 0.64 mSv for SOC-CT (P < .0001). As expected, the subjective image quality was slightly better for SOC-CT (mean 8.87 ± 0.9) than TT (mean 8.4 ± 0.99; <.0001) (Table 2).
Discussion
Multiple studies show that chest X-ray has a suboptimal diagnostic performance for pneumonia, especially for atypical pulmonary infections, which are frequent in the immunocompromised population.19-21 In patients affected by hematologic malignancies, an early diagnosis and treatment of pneumonia is of crucial importance to improve patient outcomes.22,23 Our results support that thoracic tomograms based on ultra-low-dose CT images may be a suitable imaging alternative for the detection and follow-up of pneumonia in this population, as it provides a high diagnostic yield that is comparable to a chest CT, but without incurring its higher radiation exposure level. In fact, the radiation dose deployed by the ULDCT, from which the thoracic tomograms were reconstructed, was comparable to that of a standard-of-care frontal and lateral chest radiograph (0.05-0.24 mSv for each projection).4,6,24
Previous studies demonstrated the diagnostic utility of ULDCT per se for the detection of respiratory infections and varied pulmonary conditions.25-27 van den Berk et al. 25 found a sensitivity of 93% for ULDCT for the diagnosis of pneumonia versus 50% for chest X-ray, while a systematic review conducted by Tækker et al. 27 reported a sensitivity of 90% to 100% for consolidations and ground-glass opacities when compared to standard dose CT. While thoracic tomograms appear viable for detecting pneumonia in hemato-oncology patients, an important consideration would be whether it is a better alternative to native ULDCT. We hypothesize that the main advantages of TTs will lie in mitigating the potentially detrimental impact on the radiologists’ workload. Incorporating routine ULDCT without a processing tool instead of chest X-ray would imply additional burden to the ever increasing work load challenges in diagnostic imaging department. 28 The time required to analyze a thoracic tomogram (which does not include time for dictation) appears short enough to mitigate the concern of an unmanageable increased workload for the radiologist, and in our experience, it is similar to the interpretation time of a conventional chest X-ray. Furthermore, a synoptic reporting template may be considered to help avoid wordy reports and facilitate communication with the requesting physicians.
Although scanning time was not measured, a non-contrast chest CT can be obtained within the same timeframe as a frontal and lateral chest X-ray with patient flow optimization. Therefore, the main technical limiting factor would rely upon the CT department’s capacity.29,30
Thoracic tomograms showed an overall poor diagnostic performance for interstitial abnormalities. This can possibly be attributed to the nature of the post-processing algorithm, as the algorithm behind thoracic tomograms highlights differences in attenuation in the lung by means of a weighted average. The output results in an image with less well-defined edges than native CT images, which might not be adequate for the evaluation of the pulmonary interstitium. 15 As this may represent a major drawback to the thoracic tomogram technique, the assessment of interstitial lung abnormalities is not the primary concern in hemato-oncology patients. Furthermore, the thoracic tomograms were not intended to replace a SOC-CT and its ability to evaluate the chest comprehensively but rather to become a better alternative to a chest X-rays in detecting pneumonia. It is worth noting that chest X-ray is also considered a suboptimal technique for a detailed evaluation of the pulmonary interstitium. As in the latter, radiologists may be able to refer the patient to a dedicated SOC-CT if further assessment of a specific finding is needed.
Our study has some limitations. First, the number of participants is limited, though the results demonstrated that our cohort had enough power for a proper evaluation of the different proposed imaging categories.
Second, we failed to assess the time required to generate a report. Although this will undoubtedly increase the time required to finalize a study in a real-world scenario, using a concise, structured report might aid in maintaining short examination turn-around times. Additionally, we were not able to measure the reference of standard for the interpretation time of a SOC-CT as this was used as a comparison after the TT images had been interpreted. Therefore, measuring the time to interpret a SOC-CT would have been biased and not reflect current clinical practice.
Third, although readers were strictly instructed to do an independent evaluation of the different imaging categories, the sequential unblinding of the SOC-CT after the interpretation of the thoracic tomogram might have contributed to an “overcall” bias. The prevalence of pneumonia in our cohort was higher than what has been reported in immunocompromised patients in an outpatient setting, although this is most likely because the participants had a high pre-test probability. 31
Lastly, thoracic tomogram reconstructions are a novel presentation technique, and none of the readers had prior exposure or clinical experience at the time of the image interpretation. It is uncertain how diagnostic performance and reporting times will evolve once readers are more confident with the “look and feel” of this technique.
Future efforts should aim to assess thoracic tomograms in a real-life scenario with a broader spectrum of patient conditions and clinical indications and to assess the impact on patient management and workflow. Furthermore, comparing thoracic tomograms to native ULDCT reconstructions would also provide valuable insights into whether thoracic tomograms offer an advantage over the native ULDCT images from which they are processed.
Conclusion
Thoracic tomograms provide comparable diagnostic information to a low-dose chest CT for the detection of pneumonia in immunocompromised patients at a radiation dose similar to a chest X-ray, with high diagnostic confidence and low interpretation times.
Footnotes
Declaration of Conflicting Interests
The author(s) declared no potential conflicts of interest concerning the research, authorship, and/or publication of this article.
Funding
The author(s) disclosed receipt of the following financial support for the research, authorship, and/or publication of this article: This study was funded internally.
Supplemental Material
Supplemental material for this article is available online.
References
Supplementary Material
Please find the following supplemental material available below.
For Open Access articles published under a Creative Commons License, all supplemental material carries the same license as the article it is associated with.
For non-Open Access articles published, all supplemental material carries a non-exclusive license, and permission requests for re-use of supplemental material or any part of supplemental material shall be sent directly to the copyright owner as specified in the copyright notice associated with the article.