
Abstract
Academic theses at the bachelor’s and master’s levels in nursing, physiotherapy, occupational therapy, public health and related fields often take the form of general reviews of published research on a relevant clinical issue. While there are many guides to doing literature searches and evaluating article quality, there are to our knowledge no published detailed guides of how to do the actual data analysis in such general literature reviews, particularly that are applicable to students. This article seeks to describe a systematic method of data analysis appropriate for undergraduate research theses, where the data consists of the results from available published research. We present a step-by-step guide with authentic examples and practical tips.
Introduction
This article is a practical guide to conducting data analysis in general literature reviews. The general literature review is a synthesis and analysis of published research on a relevant clinical issue, and is a common format for academic theses at the bachelor’s and master’s levels in nursing, physiotherapy, occupational therapy, public health and other related fields. Examples of research questions are: What barriers to successful self-care do patients with heart failure describe? What are the effects of physical activity on individuals’ experienced stress? How can mindfulness be used in occupational therapy? What strategies work best to prevent postoperative shivering in patients? How do patients experience isolation in infectious disease wards? What strategies are effective for inserting peripheral venous catheters in patients with difficult intravenous access?
The central task for the author of any general literature review is to analyse the results of multiple scientific studies in order to describe the state of knowledge about a particular topic, in order to draw conclusions with clinical applications. This article seeks to describe a systematic method of data analysis appropriate for undergraduate theses, where the data consists of the results from available published research. Although the methods described here are usable by any researchers conducting a general literature review, the article is addressed to students (and their supervisors) in the health sciences.
A general literature review starts with formulating a research question, defining the population, and conducting a systematic search in scientific databases, steps that are well-described elsewhere.1,2,3 Once students feel confident that they have thoroughly combed through relevant databases and found the most relevant research on the topic, however, what is arguably the hardest part of the process remains.
How should one go about synthesizing, analysing and presenting the results of different studies on a topic? This is an especially challenging task when these studies may not themselves ask the exact same research question you the student are asking, even if they contain findings that answer your research question. That the studies may use vastly varying methodologies, from interview studies to randomized trials, also poses a challenge to the task of synthesising and analysing the data.
We have discovered that students lack a structured guide to the actual analysis that a general literature review requires. Below we present a step-by-step guide for analysing data for two different types of research questions. The data analysis methods described here are based on basic content analysis as described by Elo and Kyngäs 4 and Graneheim and Lundman, 5 and the integrative review as described by Whittemore and Knafl, 6 but modified to be applicable to analysing the results of published studies, rather than empirical data. The methods described here are inductive, that is, they do not describe how to use a pre-existing model or theory to analyse data, but instead describe how to find patterns and answers in the data without preconceived theories or frameworks for analysis.
First step: Making an article matrix
Once you have completed searches of the databases and identified all studies that answer your research question and fit within the inclusion and exclusion criteria you have chosen (for example only studies on people aged over 65 years, or no studies of people with disabilities), it is time to get started on the data analysis. The first step is to get an overview of all identified studies by making an article matrix where you describe each study’s aim, methods and results, especially those results that are relevant to your particular research question. Table 1 shows examples of how this might look for an experimental, randomized controlled trial study; for an interview study; and for a study based on a questionnaire. All of these studies will be used in examples later in this article; the first article for a study about inserting peripheral vein catheters (PVCs), and the second two for a study about patient experiences of isolation wards.
Example of an article matrix summarizing studies for use in a general literature review.
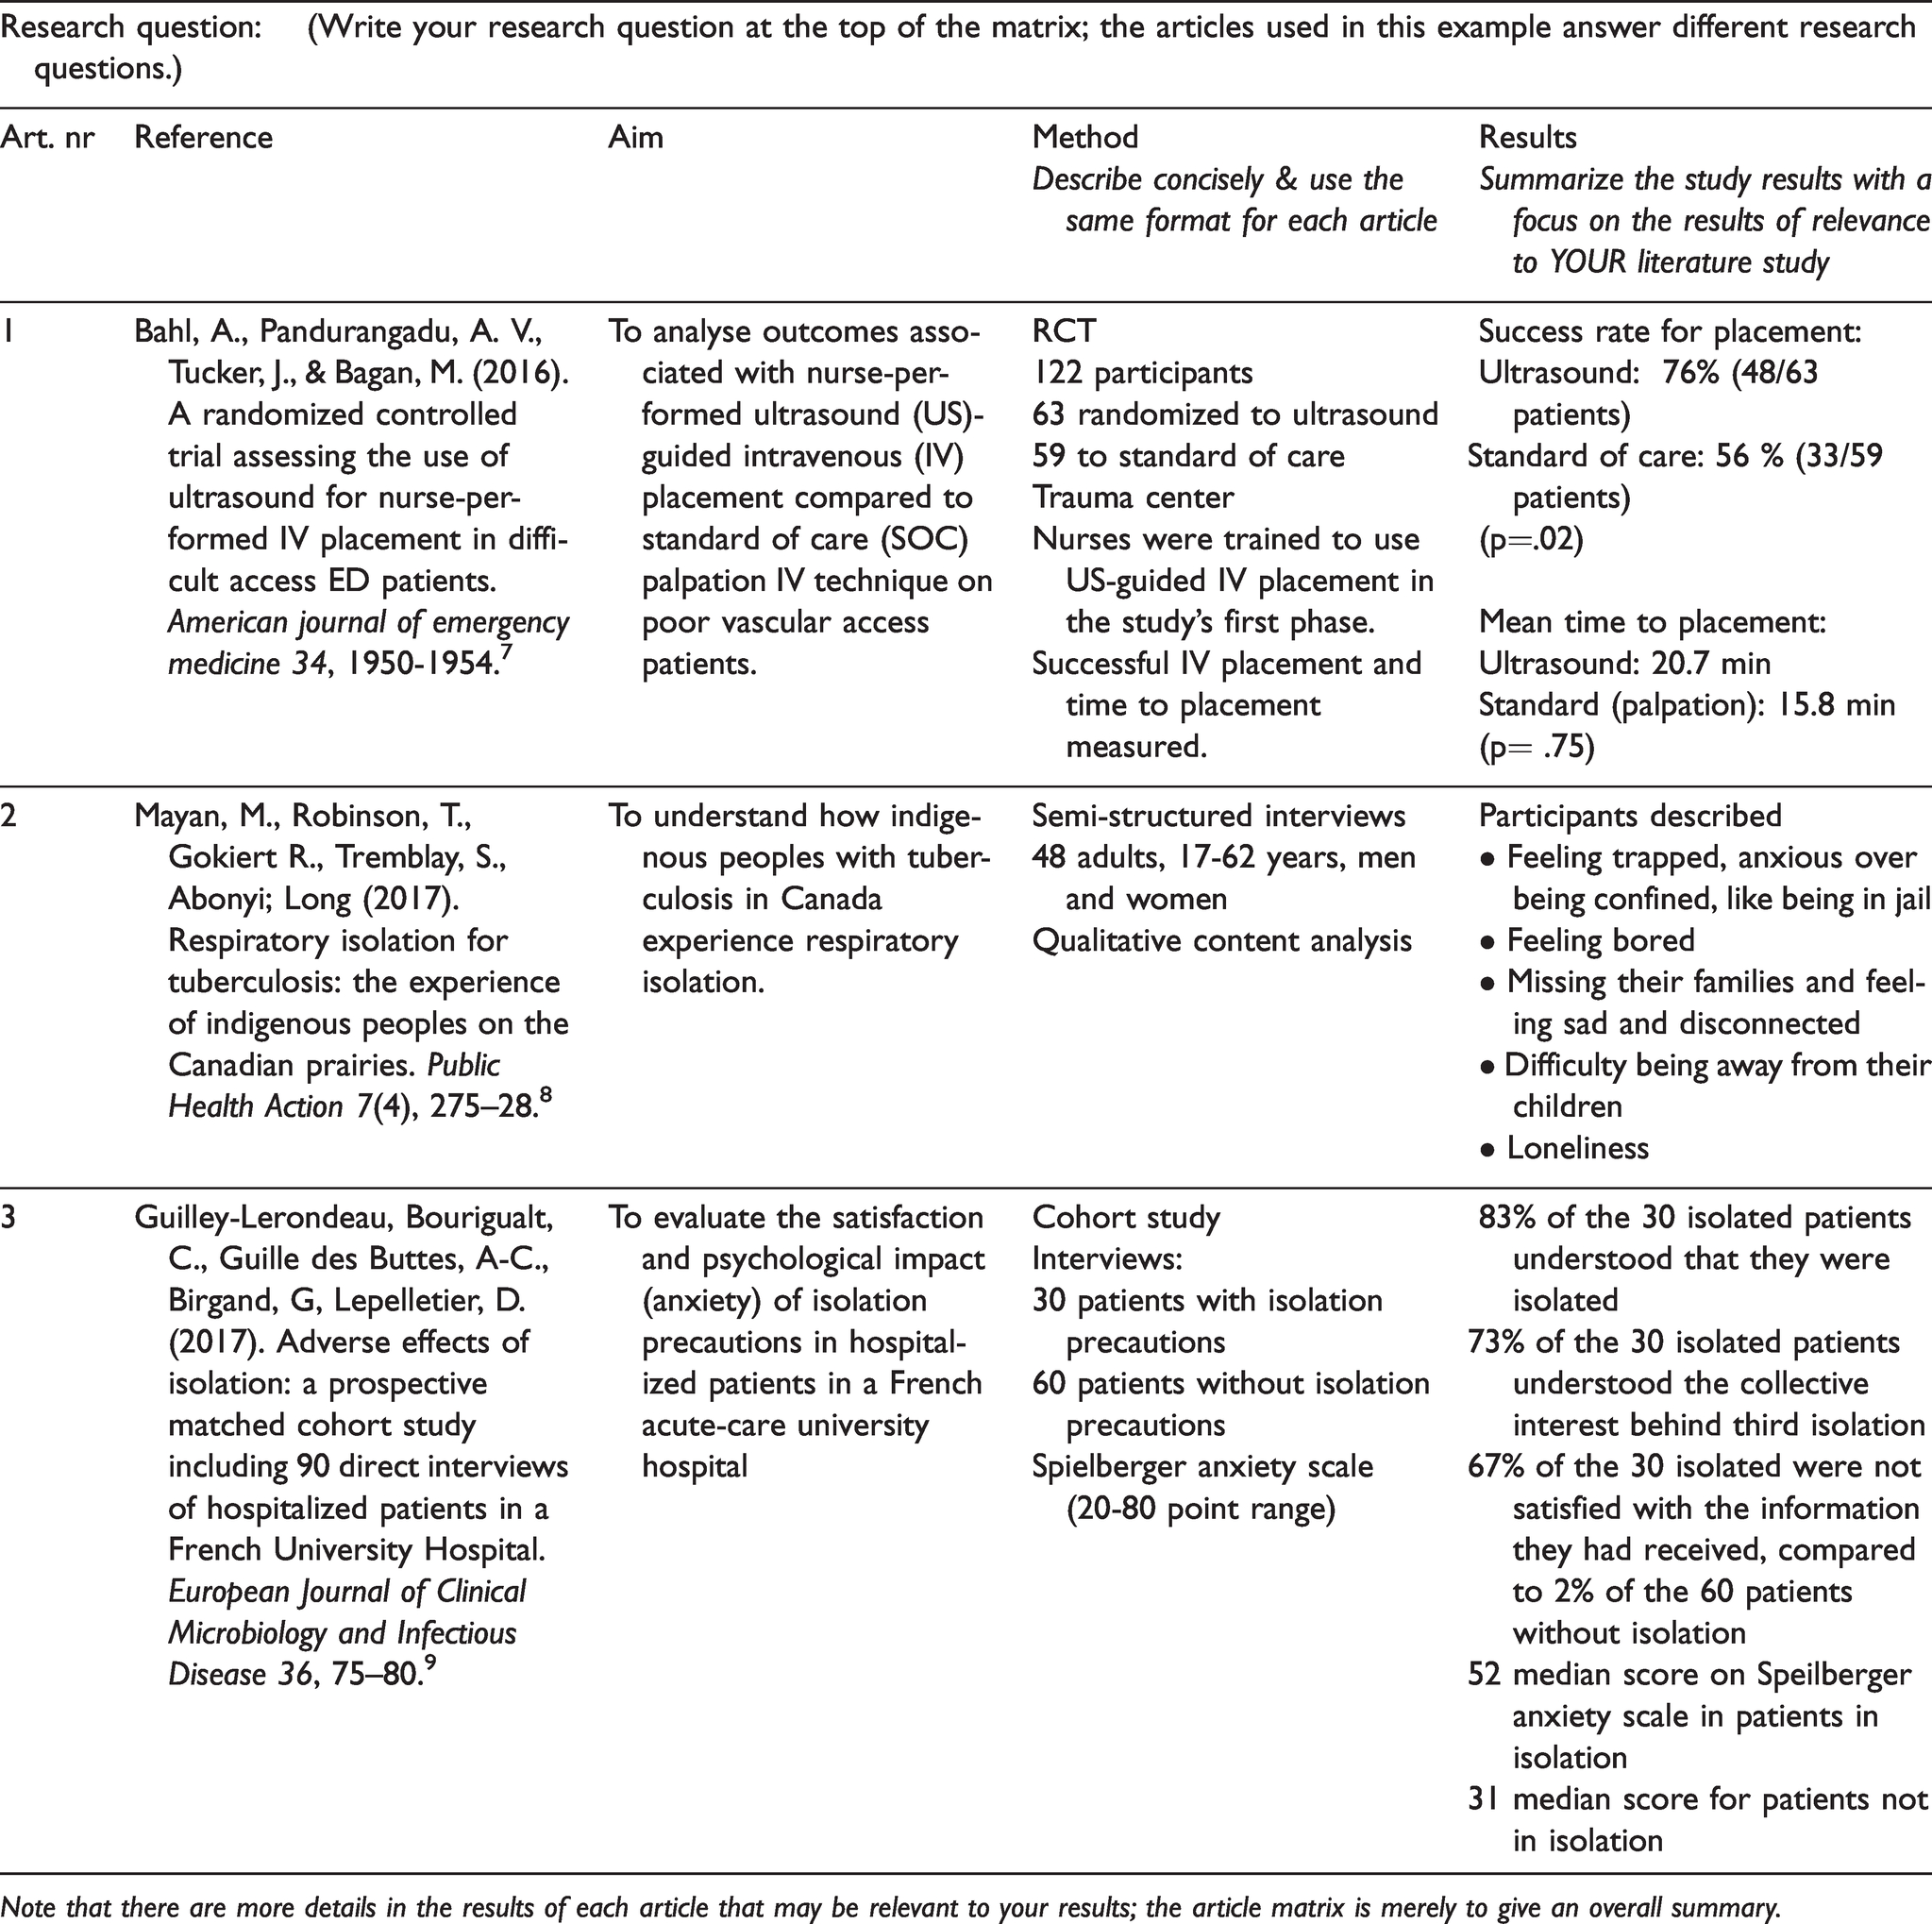
Note that there are more details in the results of each article that may be relevant to your results; the article matrix is merely to give an overall summary.
The next steps in the data analysis process differ depending upon the type of research question you have and the designs of the studies you will be analysing.
When your research question (aim) is about effect, risk, association or prevalence
Research questions about whether or not a certain treatment, intervention or approach is effective are answered primarily by experimental studies, including randomized controlled trials (RCT) and quasi-experimental studies. Research questions about risk factors, associations and prevalence are answered primarily by cross-sectional and longitudinal studies. The data analysis process for these kinds of quantitative studies involves three steps:
Identifying data that answers your research question (aim), in this case largely numerical data that must be ‘dug’ out of each study’s results. Organizing the data in a thematic way. Synthesizing, analysing, and presenting the data.
This section will now go through each of these steps, using the example of the following research question: What strategies are effective for inserting peripheral venous catheters in patients with difficult intravenous access? In the development of this research question you have hopefully already determined whether you only want to examine strategies that lead to success in insertion of a PVC, or whether you also want to include findings about patient experiences of pain during the procedure, how the skill of the provider affects insertion success, or other aspects of what ‘success’ means for a PVC insertion.
Identifying results that answer your research question
With your research question and its exact terms in mind, you begin the process of data analysis by clearly identifying the actual results of each study that answer your research question. This entails separating the wheat from the chaff; that is, picking out the study results that are relevant to your research question, and ignoring results that are not. Practical tip: Tape your research question to your computer so that you don’t lose sight of it. You can also write it on the top margin of your draft during the writing period so that it is visible on every page (just don’t forget to remove it at the end).
Box 1 shows an example of text from the results section of an article with the information that answers your research question about effective strategies for inserting PVCs in people with difficult intravenous access. The parts of the text that answer your research question are underlined. Identifying data that answers your specific research question.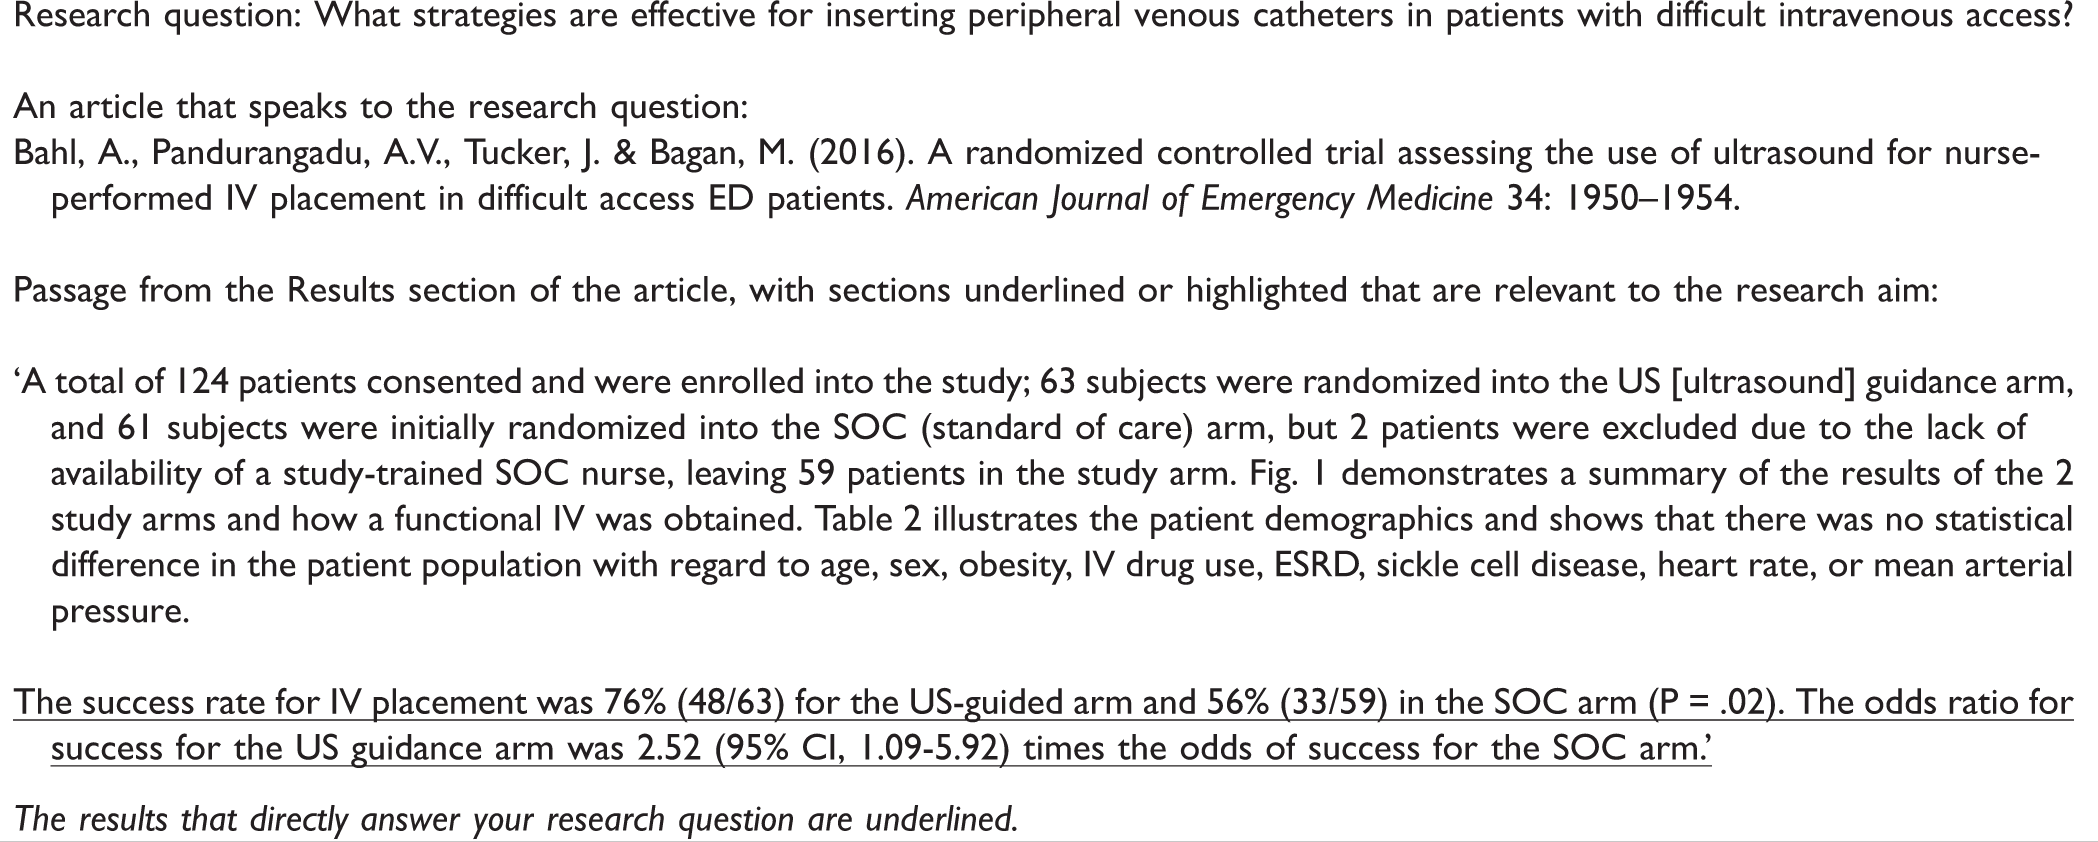
Note that figuring out which data is relevant can be difficult. The relevant data will be presented in the Results section, may be mentioned in the Abstract, and is often summarized at the very beginning of the Discussion section of an article. (If you find results conveniently summarized at the beginning of a Discussion section, just make sure to avoid including the actual ‘discussion’ of these results by the authors, where they compare their results to those of other studies or give their own interpretations and opinions about their results.)
The Abstract seldom describes findings in enough detail; sometimes the very results that are key to answering your particular research question are not even mentioned in the Abstract. Sometimes the findings are explained clearly in the text in the Results section of a study, but sometimes one may need to look at tables, graphs and figures to find the relevant information.
Quantitative studies tend to contain a lot of statistical data, and not all of it is relevant in a general literature review, especially at the undergraduate level. Tables that show the baseline characteristics of the population studied, for example, are important for providing the study with validity (roughly, accuracy and trustworthiness), but may not be relevant to your synthesis of the study’s findings.
In general, authors focus on results that are statistically significant. But sometimes they report results where a difference or an effect was found, but the p-value is far above 0.05. For example, in Table 2 you can see that Bahl et al. 7 report that the time it took to insert a PVC was on average 20.7 minutes using ultrasound compared to 15.8 minutes when only palpation and a tourniquet were used. But then the authors note that the p-value for this finding was 0.75; in other words, the probability that this difference was due merely to chance is 75%. So the difference in the time it took for the two different procedures was very probably due to chance, and not indicative of the ultrasound method being slower. Why would they then write this finding? It may be that they believed that if the study had had many more participants the time difference would have reached statistical significance. In any case, you cannot write in your review that ‘using ultrasound was slower than using traditional methods for inserting a PVC’, unless you add that ‘but this difference did not reach statistical significance’.
Example of data analysis table for use in synthesis of data from randomized controlled trials (RCTs) and other quantitative studies.
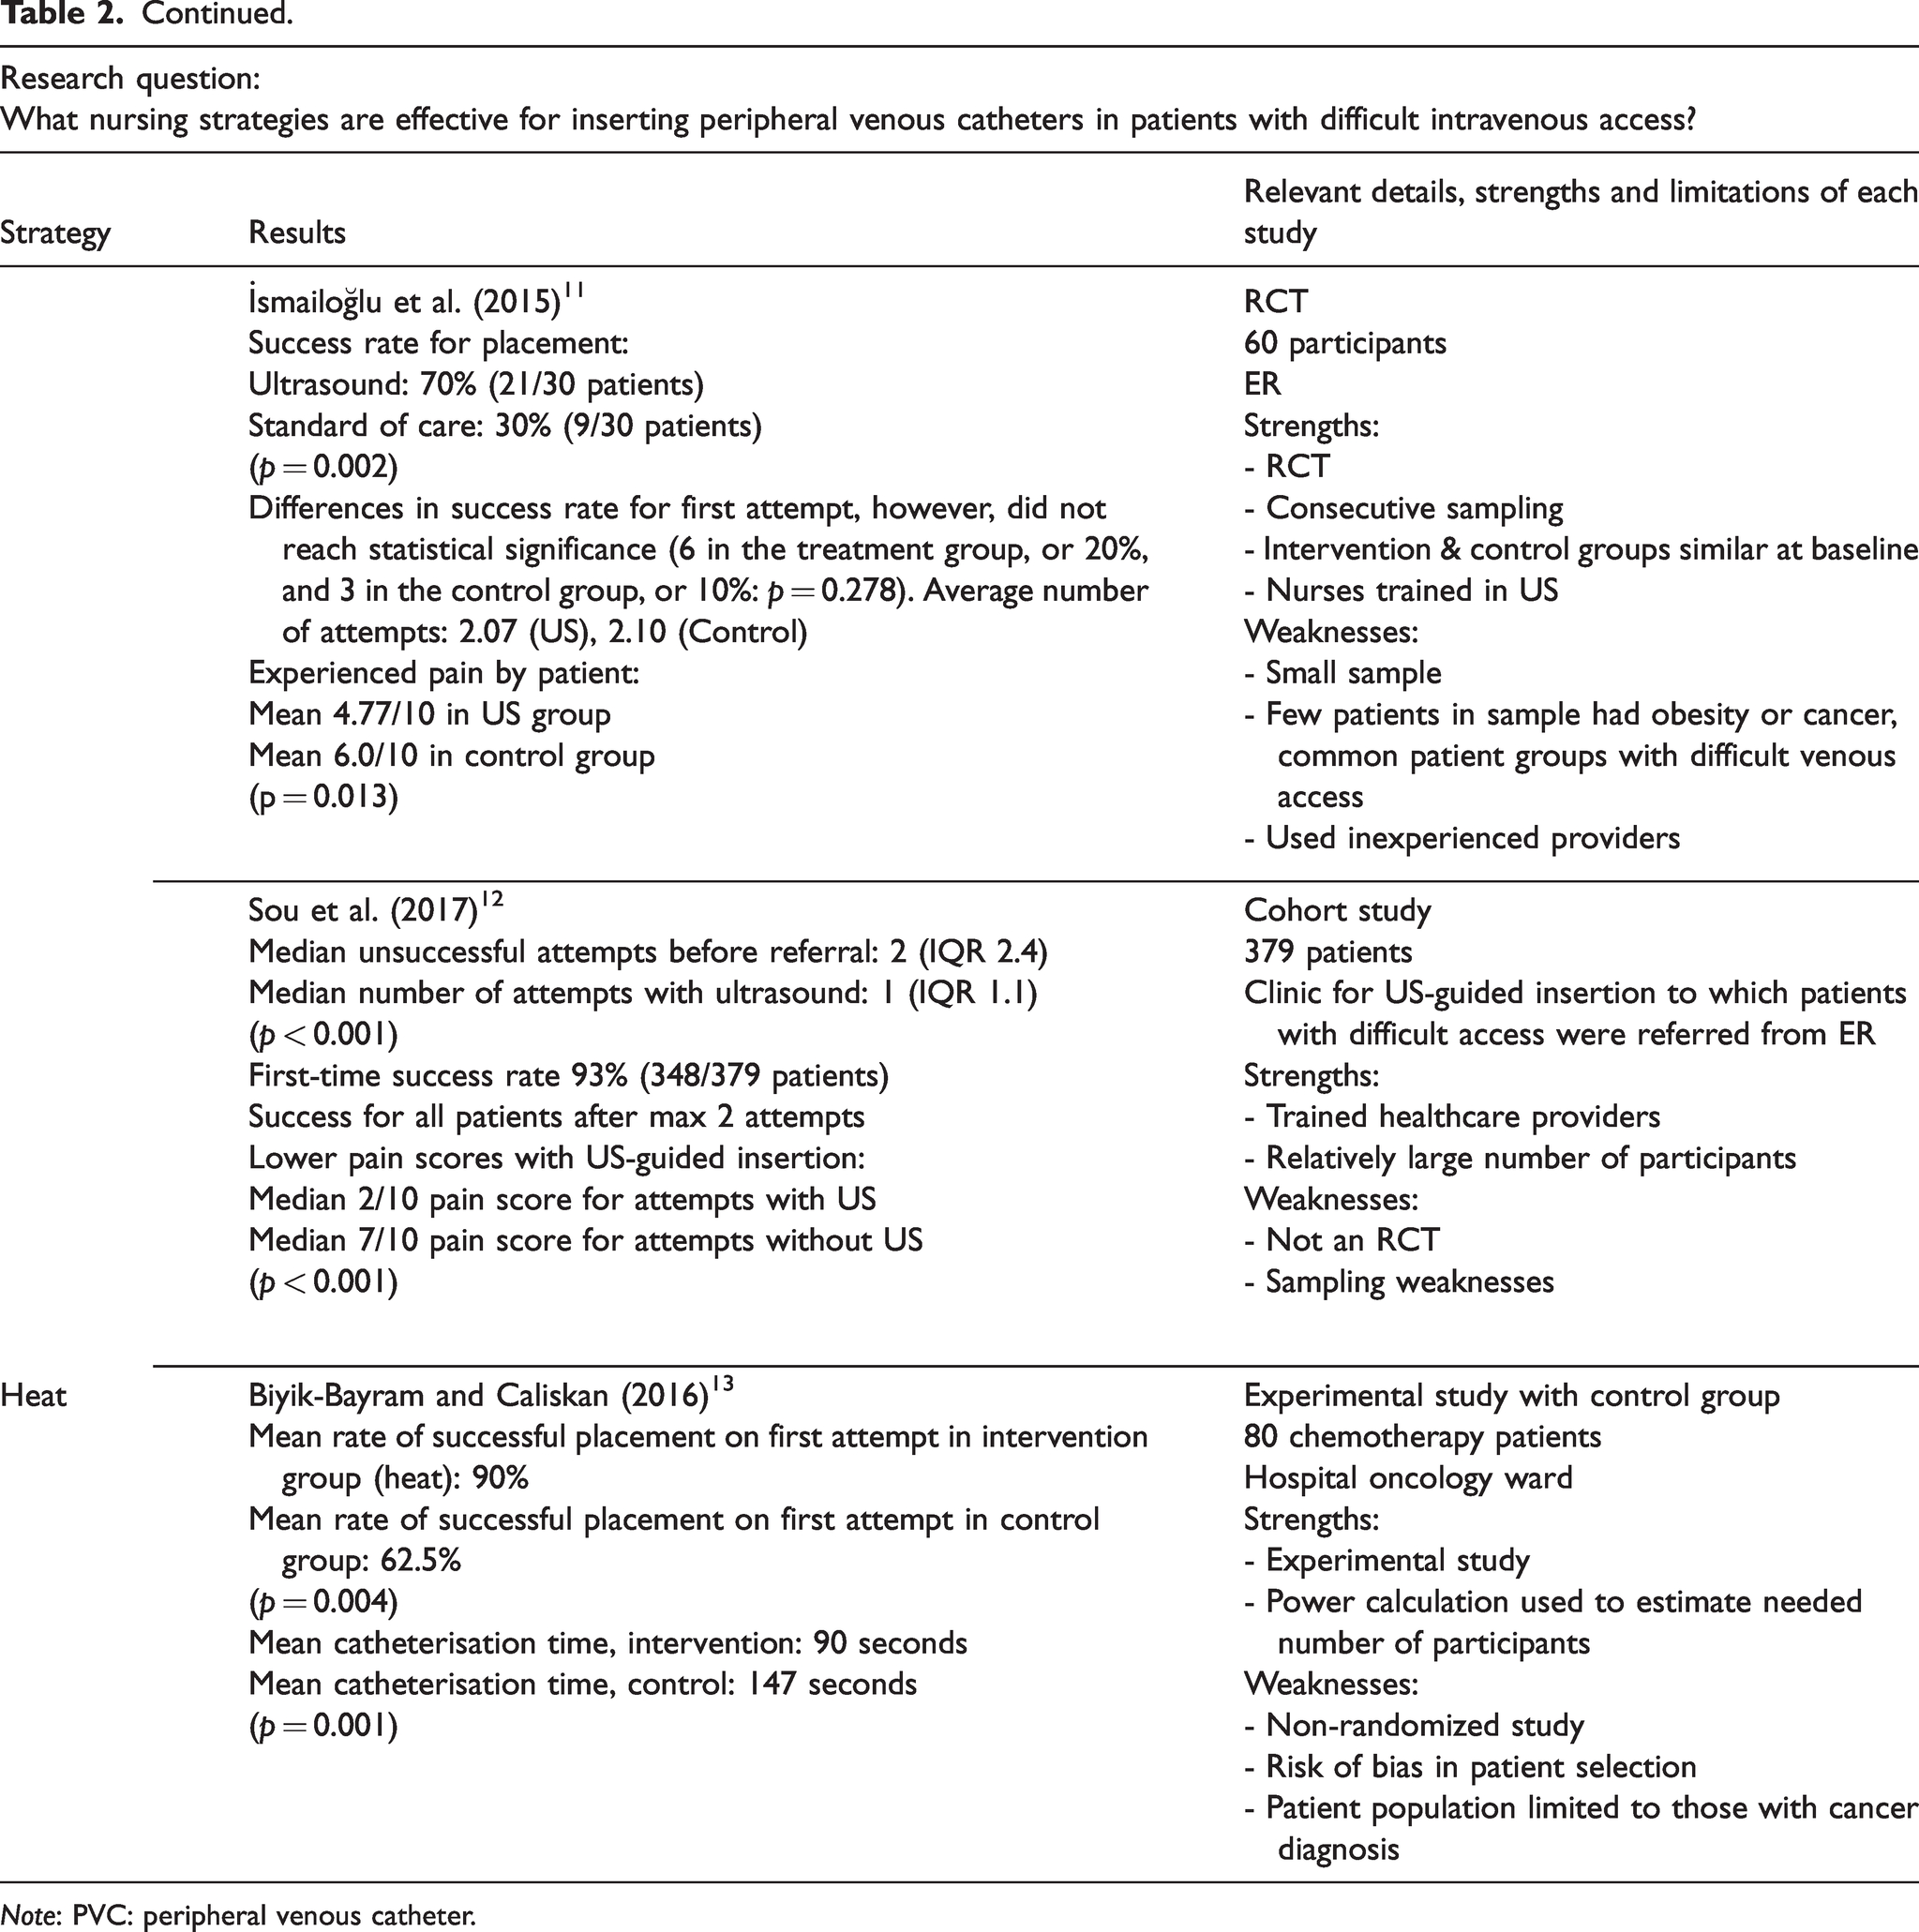
Note: PVC: peripheral venous catheter.
Answers to your research question may also be expressed in risk ratios, odds ratios, effect sizes, confidence intervals, or a number of other statistical measures. If you need help understanding and interpreting these findings you can consult the literature, search for answers online, or discuss them with your supervisor.
Once you have gone through each article and highlighted or underlined all sentences and all data that seems to answer your research question (Box 1) it is time to organize and evaluate this information.
Organizing quantitative data in a thematic way
Some types of quantitative data lend themselves easily to one kind of organization. For example, in our review of research on PVC insertion, it makes sense to divide studies according to the strategy they focused on: 1) ultrasound, 2) heat, or 3) alternative therapeutic methods (Table 2). In other kinds of studies the organizing principle may be less obvious. If one is measuring the effect of nurse-led interventions to reduce smoking, for example, one could organize the data by the type of intervention (individual counselling vs. group counselling), by the type of study (RCTs vs. cohort studies), by how long the follow-up period was (studies with longer follow-up are, as a rule, more clinically meaningful), or by another relevant factor.
The other type of information that should now be taken into account and recorded in the data analysis table (Table 2) is information relating to the strengths and weaknesses of each study, which you will need for the next step in the analysis process. A study’s strengths and weaknesses might relate to the number of participants in the study, how randomization was carried out, or confounders (factors ‘outside’ the study that might have affected the results, such as if poor quality catheters were used in a study, potentially explaining the study’s poor results). A study’s strengths and weaknesses are usually described in a study’s Discussion section, but you can also look for aspects of a study that the authors themselves do not specifically mention, but that you notice may have had an effect on their results. A weakness could be, for example, that a high number of participants had multiple health problems affecting the results, or that a company that sold ultrasound equipment financed the study, or other aspects that might detract from (or add to) the validity and reliability (roughly, accuracy of measurement) of the results.
Table 2 shows an example of how data from our PVC study could be organized into a table to create a good overview of the studies’ results as well as the studies’ strengths and weaknesses.
Synthesising, analysing and presenting quantitative data
The challenge of synthesising and analysing quantitative data is that studies of the same phenomenon tend to study the phenomenon in different ways and to measure their results in different ways. For example, to measure outcomes, two studies measured the percentage of successful attempts,7,11 whereas another study divided patients into groups with different degrees of difficulty of access. 10 Yet another study, a cohort study, lacking a control group, found merely that 93% of patients, deemed to have difficult access, were able to have an IV line inserted when ultrasound was used.12 We do not know what the success rate would have been for a matched control group where ultrasound was not used; only that previous studies have rarely found such a high success-of-insertion rate for patients with difficult intravenous access when ultrasound is not used.
In cases where studies do have similar designs and ways of measuring outcomes, the results can easily be summarized. For example, ‘In three RCT studies insertion of an IV line using ultrasound was found to be successful in between 64% and 81% of patients with difficult venous access, compared to only 39% to 45% of similar patients in a control group where palpation with or without a tourniquet was used’. But the more common situation is that you have to summarize disparate types of results. In these cases, you can summarize the overarching results in your own words, and then describe the results of each study one by one. For example, to summarize what the research shows about the use of ultrasound to insert IV catheters in people with difficult intravenous access, the summary could be as shown in Box 2. Example of how to synthesize results from quantitative studies.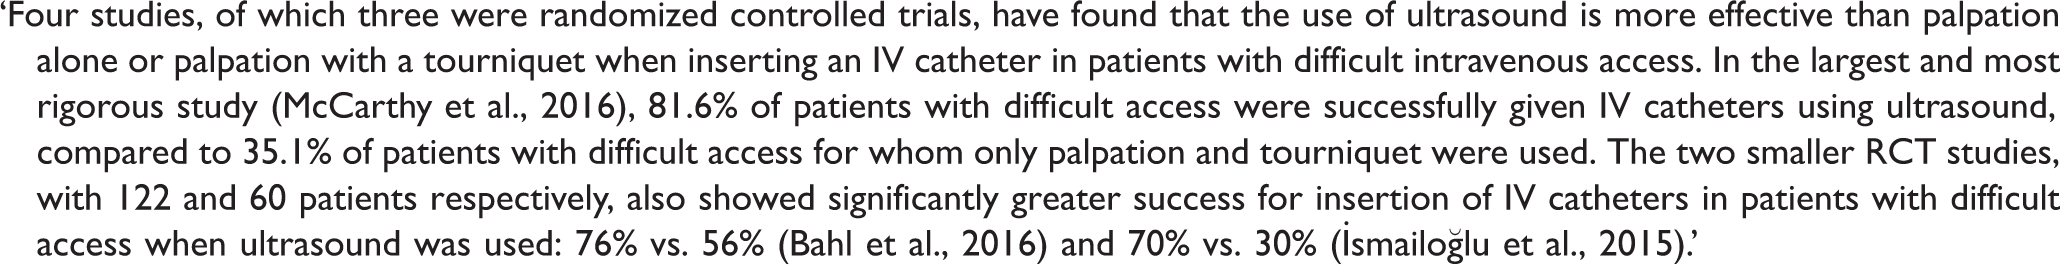
The same process is followed for each of the studied procedures: heat, alternative therapies, etc. That is, the overall results of the studies of heat’s effects on easing catheter insertion, for example, are presented, and then the specifics of each study that examined heat’s effects are presented. Depending on the wording of your research aim, you might want to include other types of results, such as how much pain patients felt when different procedures were used, or whether the use of ultrasound was more successful with experienced and trained providers, which some studies examined.
It is also important to note each study’s validity, that is, the validity of the study’s results. Not all results are equal, because some studies are better than others. For example, a study with a large sample, careful randomization, and few confounding factors, will produce a more trustworthy result than a study with a smaller sample, selection bias, no randomization, and many confounding factors. The validity and reliability of particular studies can be woven into your synthesis of results, as in the example in Box 2, or discussed separately at the end of your results section.
When your research question (aim) is about experiences, attitudes or perceptions
Research questions about experiences, attitudes and perceptions can be answered by primarily two types of studies: 1) qualitative studies (based on interviews, focus-group discussions, or observations) and 2) questionnaire-based studies. Occasionally other types of quantitative studies use qualitative methods to assess participants’ experiences and results from such studies can also be used when answering research questions about experiences, attitudes and perceptions. For example, for a general literature review on patient experiences of diabetes support groups a student might find an RCT study that investigated whether group support sessions in diabetes self-care were more motivating for patients than individual appointments with a healthcare provider. This study used a questionnaire to gauge participants’ experiences, and the results regarding experiences of group support sessions could be relevant to the literature review.
As with data from experimental, longitudinal and cross-sectional studies, the data analysis process in studies about subjective experiences involves three steps:
Identifying the findings in each study that answer your research question (aim). Condensing and summarizing these findings. Grouping the findings thematically into categories that speak to your research question.
This section will now go through each of these steps, using the example of the following research question: How do adult patients experience living in isolation in an infectious disease ward?
Identifying results that answer your research question
The first task, again, is to identify what each study actually found. This sounds easy but it is not always. Practical tip: Tape your research question to your computer so that you don’t lose sight of it. You can also write it on the top margin of your draft during the writing period so that it is visible on every page (just don’t forget to remove it at the end).
As you search through the Method and Results sections of your articles, keep in mind your inclusion and exclusion criteria. If you have chosen to write about adults, for example, but an article discusses experiences of both children and adults, you will need to ignore the results that only relate to children. Or, if your research question is about patient experiences of living in isolation in an infectious disease ward, you need to be careful not to include descriptions of other family members’ experiences, or their experiences of the disease itself, or their experiences of being released from isolation. As you search for answers to your research question you need to be strict with yourself and remember that, however interesting the patients’ descriptions of the disease itself are, or how it felt to be released from isolation, that is not what you are interested in now.
Another factor to watch out for when you identify data that answers your research question is your own biases and preconceived ideas of what you may find. You may expect, for example, that people find living in isolation to be very difficult, but if a participant in one study states that they appreciated the break from the daily grind, you have to include that as well! Being clear with yourself about your own assumptions and subjectivity before embarking on the analysis will help you to maintain your objectivity.
In practical terms, a good way to identify study results that answer your research question is to use a pencil or highlighter pen to mark all relevant findings. Again, keeping your specific research question as well as your inclusion and exclusion criteria squarely in front of you, go through each article’s results carefully, marking the phrases, sentences and paragraphs that answer your research question (see Box 3). Identifying data that answers your specific research question. Practical tip: Go through each article in your literature review methodically with a pencil or highlighter pen and underline or highlight the paragraphs, sentences, parts of sentences or survey results that answer your research question specifically.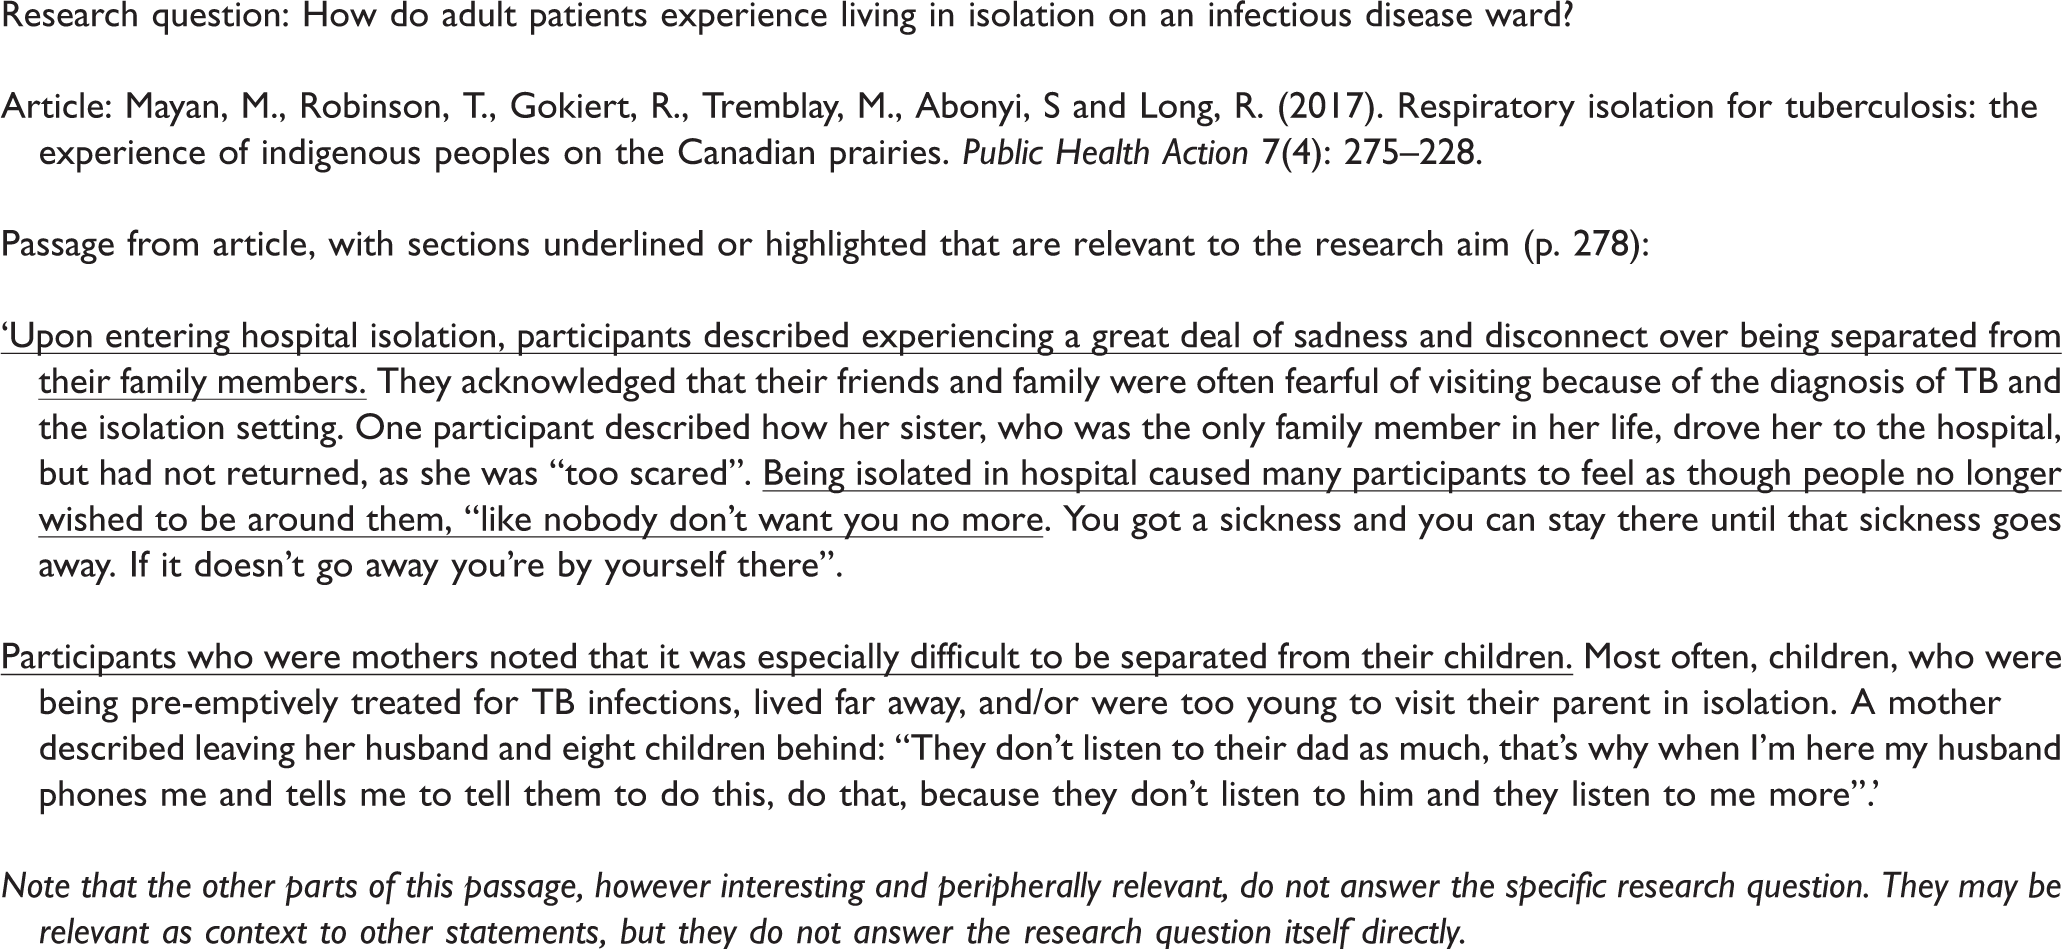
The specific findings of each study that answer your research question can be called ‘data units’. (In qualitative studies these are often called ‘meaning units’.) Note that several types of data or information may be included that answer your research question (see Table 3, column 1):
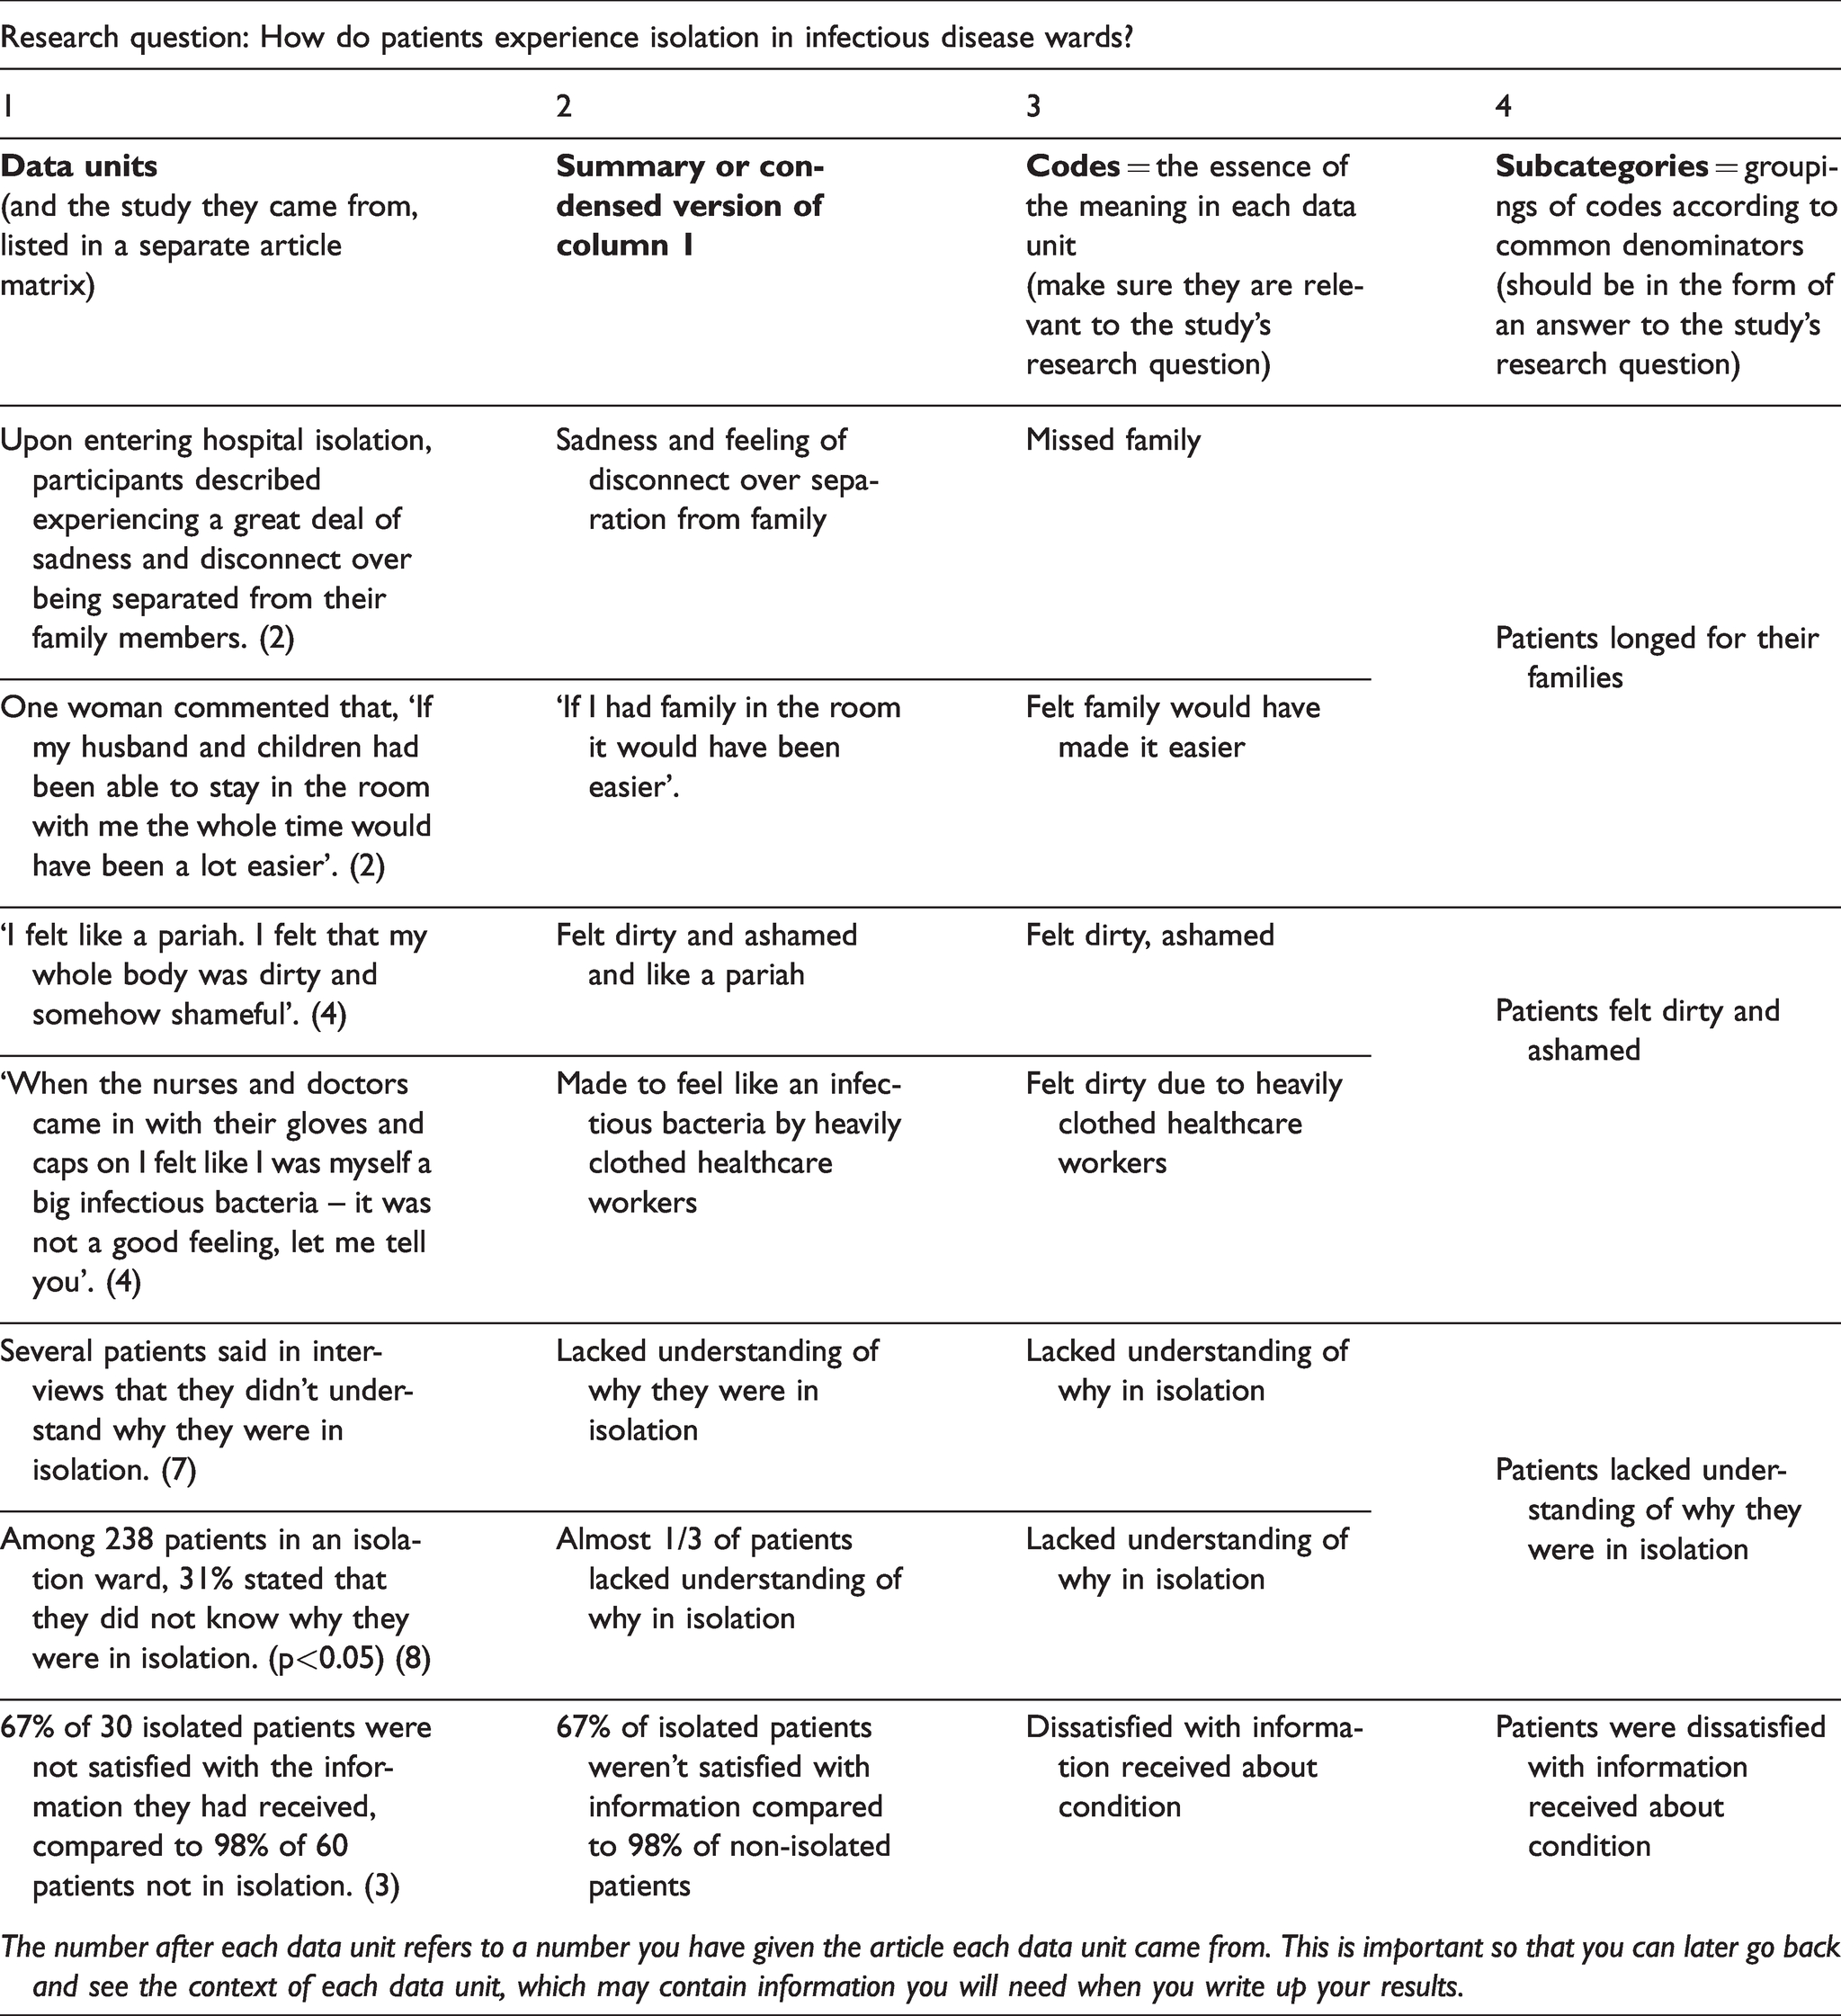
Example of data analysis table.
Direct quotations from participants in a study
The authors’ descriptions, interpretations and summaries of their results
Results from a questionnaire or survey (including tables and/or figures; see the last two data units in Table 3, column 1)
Condensing and coding: Figuring out the ‘gist’ of each data unit
It would be lovely if the human brain could synthesize data all by itself, but unfortunately our brains like to play tricks on us. If you think after marking up all your articles that you have the ‘gist’ of what they say and what the answer to your research question is, think again. The only way to do research with integrity and according to ethical guidelines, and to faithfully represent research findings from multiple studies, is to systematically tabulate and summarize, and sometimes even count, your data: on your computer, on paper, using post-it notes, or even on a whiteboard if you want a large overview.
Start by making a table with several columns and many rows and copying over all the relevant results you have highlighted or underlined in your articles to the left-most column (see Table 3, column 1). These are the answers to your research question that the studies you are using have found. These are your ‘data units’.
When reviewing studies on a topic, the data units may all be very similar, or they may be very different and even contradictory. For example, perhaps all of the studies you are summarizing found that people in isolation on infectious disease wards missed their family and friends. But perhaps some patients felt secure and protexted by being in isolation, while others felt anxious and in danger. Your job is to record what the studies showed and what people said as faithfully as possible, without skipping over any data units because they do not agree with others, or because they are just like all the others.
Once you have filled a long column with all the findings or data units from the published studies that speak to your research question (keeping track of which study each data unit comes from), it is time to simplify what you have written in each square so that you can easily group together your data into overarching categories. If your data units consist of long descriptions you should have a column that condenses their content, as in Table 3, column 2, so that you can get an easy overview. If the data units are brief, however, you can go directly to the next column, where you ‘code’ your data. This means that you write a word or brief phrase that summarizes each piece of data and tries to capture its essence. Depending on what kind of research question you have these may be phrases like ‘Felt anxiety’ or ‘Wanted more information’ or ‘Appreciated when nurses used humour’ or ‘Found mobilization after surgery to be scary’.
Note that a table for data analysis should always include the research question at the top of the page. Otherwise it is too easy to start listing data that is interesting, but not relevant to your research question.
The actual analysis of data really begins when you begin to code the data, and questions of interpretation come into play. For example, should ‘participants described experiencing a great deal of sadness and disconnect over being separated from their family members’ be separated into two codes, one that has to do with sadness and one that has to do with feeling disconnected? Another example is determining whether the essence of ‘I felt like I was myself a big infectious bacteria’ is that the person felt ‘dirty and ashamed’, or whether the person just had a vivid imagination and the description had nothing to do with feeling ashamed. Which is the accurate way to interpret the patient’s statement? One way to make these judgements is to look at the context of the quotation in the original article. Another is to discuss with others how they interpret the essence of a data unit.
Synthesis and analysis: Finding patterns in the data
Once you have filled in the ‘code’ column you can move on to the next step of data analysis, which is to find overarching categories in your data. Of course, some patients feel one way, and some feel another, and an isolation ward at one hospital will not be the same as an isolation ward at another hospital. Your goal now is to find both the unifying categories and the variations in patient experiences, and even to take note of the ‘outlier’ findings, that maybe only came up in one study or for one patient.
Now you need to put on your categorizing glasses and step back from the details in the data units in order to start seeing the big picture. In practical terms, look for codes that say essentially the same thing or are about the same general topic, and group them in a first stage into a subcategory. For example, ‘missed family’ and ‘felt family would have made it easier’ are both about the patient’s longing for family. So ‘Patients longed for their families’ might be the subcategory you choose to group these into (see Table 3, column 4).
If two people go through the same set of data codes they will not necessarily arrive at the same ways of coding and then categorizing those data units, just as you might organize your shirts according to sleeve length but someone else might organize theirs according to colour. Two people’s subcategories after analysing the same data might be similar – you might have labelled a number of similar data units as ‘feeling lonely’, whereas I might have summarized them as ‘wishing for more company’. If you do the analysis with another person you can compare notes and discuss and try to come to a consensus about what the best terms are in order to faithfully represent the data.
If you are doing the data analysis alone you should be sure to keep an open mind and to go back and check again and again that the way you are categorizing the data and labelling the categories stays true to the data and reflects what the data says. If, for example, one article found that, ‘patients didn’t like always being touched through gloves’, it is not correct to label this ‘feeling stigma’, if the context doesn’t support this interpretation. It could be that they did not like the actual sensation of being touched by latex gloves. Your categorizing of the data should stay as true to the actual words of study participants and study authors as possible. Do not abstract to too high a level.
The data is king and you have to bow to it at all times. You serve it; not it you. Even if your hunch going into the study was that patients in isolation suffer from stigma, you cannot interpret statements to satisfy your predetermined ideas about what you will find. Objectivity rules, however unkind a dictator it may be. This is true of all inductive research where you do not apply a pre-existing model or theory to your data (deductive methods), but let the data speak for itself.
Usually there will be some categories that come up again and again, whereas maybe some other experience of isolation will be mentioned in only one study. You need to faithfully present all the data, but also give some sense of what experiences were more prevalent and which were less common.
Sometimes your categorizing of the data will require only one level of categorizing or grouping of codes, but sometimes you might want to abstract up one more level, that is, group together categories at an even higher level. For example, you might think it helpful to group together the two subcategories, ‘patients longed for their families’, and ‘patients felt dirty and ashamed’ into the overarching category
Further categorizing and abstracting from the data.
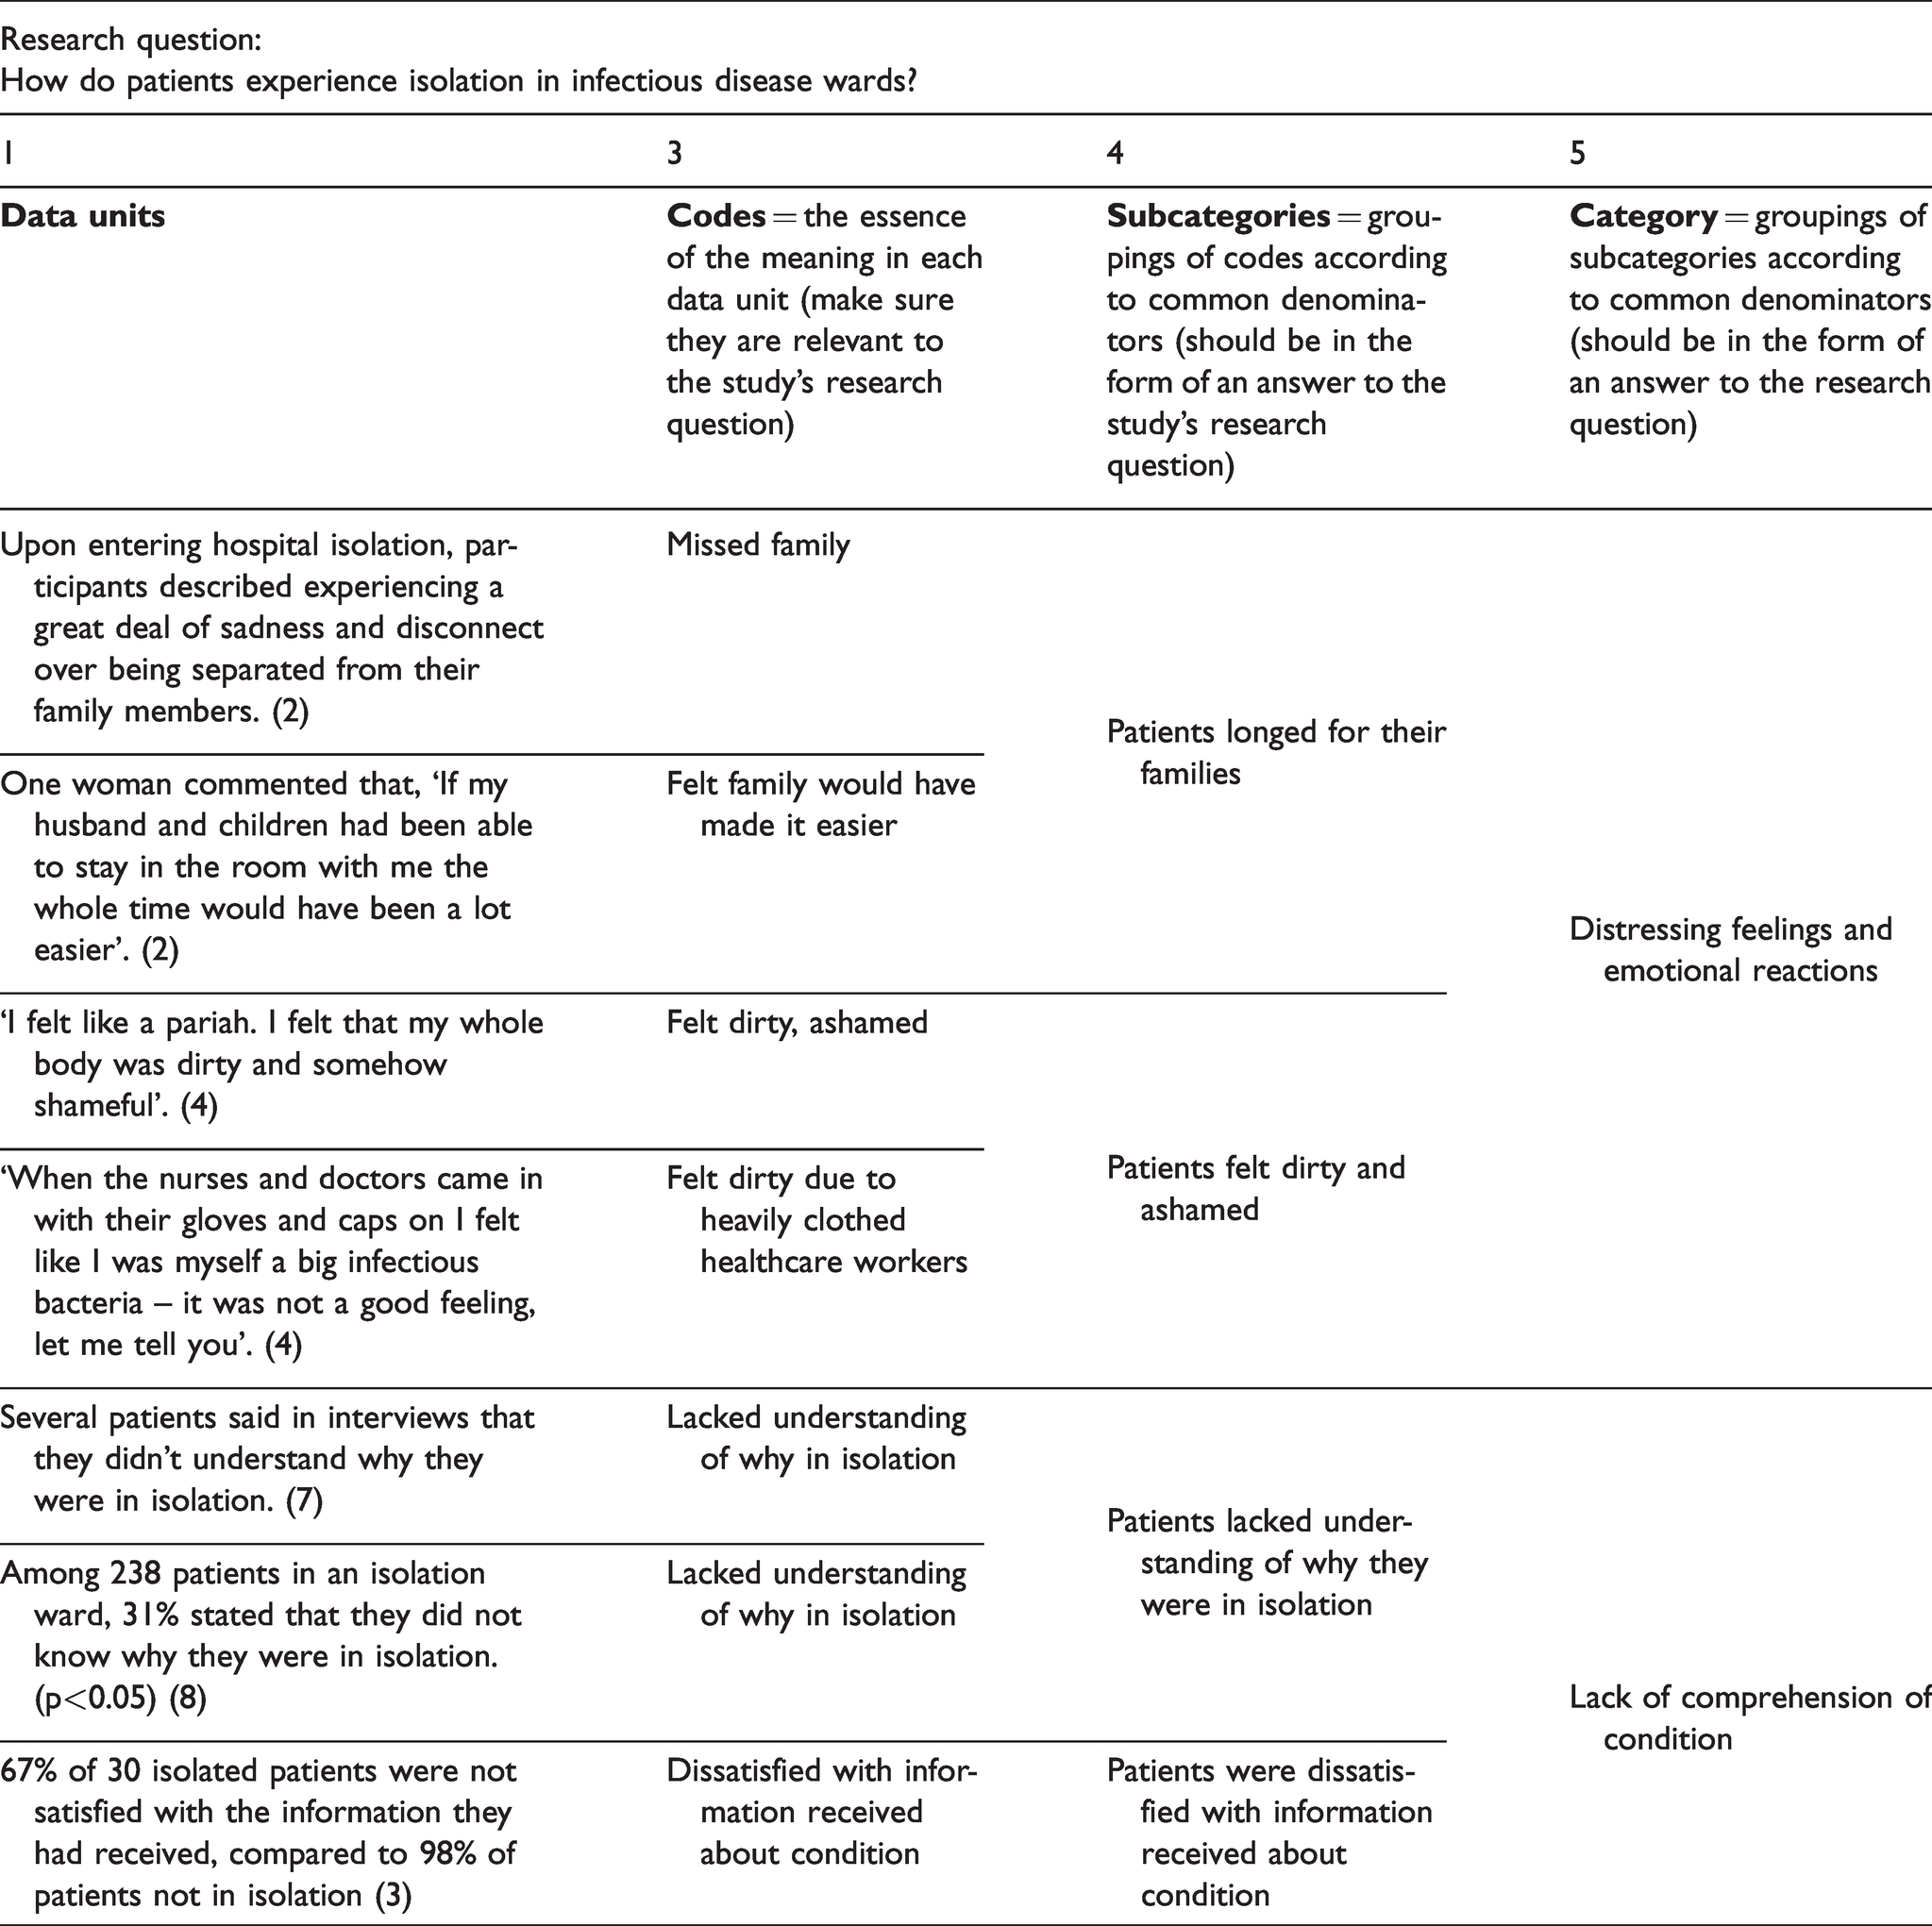
Depending on your data and the scope of your research question, you may even need a fifth column/level of categories to adequately organize your data. There is no pre-set number of columns you should have – the data in conjunction with your particular research question will govern how much synthesizing and abstraction is required. Beware, however, of creating categories that are so overarching and abstract as to be meaningless; for example, grouping ‘social situation’ and ‘fresh air’ into a category ‘environment’. The highest level groupings of data should be both a clear reflection of the concrete data, and in the form of answers to the research question. Practical tip: Let your data be the guide to how many columns – that is how many levels of abstraction – you need. You may have captured adequately what the data says at the subcategory level, or the organization of your data may require a fifth column in your table with a higher level of groupings of categories.
When it is time to write your results, the categories in the final, right-most column will usually form the subheadings in the results section of your literature review. Lower-level categories will form the paragraphs under each subheading.
So the outline of your results might look like the example shown in Box 4. Structure of results.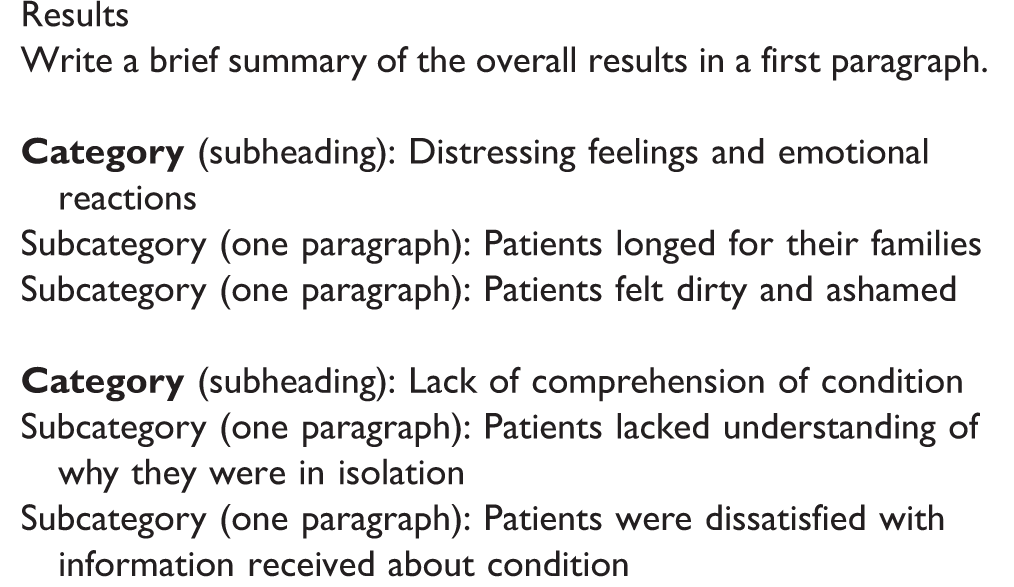
Final advice
One of the biggest challenges in writing a literature review is to actually draw a conclusion, rather than to merely list the results of many different studies. It takes time to synthesize diverse data, to summarize statistical findings, or to draw out key categories of an experience. But keep in mind that the whole point of a literature review is precisely to draw overarching conclusions for the reader, as well as, ultimately, to point out their clinical relevance. Practical tip: Synthesize and draw conclusions – don’t just list studies. Write category by category (‘ultrasound helped reduce pain’ or ‘patients want more information’), rather than study by study.
In practical terms this means that each paragraph in your results section should be about a particular result, for example, that people in isolation often feel they lack understanding of why they are in isolation, rather than about a particular, individual study.
Make sure to describe how you conducted the data analysis in your thesis’ Methods section. It is important that readers understand how you went about the process and what method for data analysis you used. Describe the steps you took in concrete terms. How did you go about extracting key data – underlining, discussing in a group, putting it in a table? How did you go about summarizing quantitative data or coding data units – alone or with another person, according to what organizational scheme? How did you go about categorizing codes and comparing studies? And, ultimately, how did you organize your presentation of your findings?
As you struggle through and coding and the entire data analysis process – and it is usually a struggle! – do not forget to think a bit about the bigger picture. A well-executed general literature review can help you as students, soon-to-be clinicians or experienced clinicians keep abreast of developments in your respective fields, and can be a vital step in increasing the use of evidence-based practice in healthcare, ultimately ensuring that patients get optimal, up-to-date care.
Some final practical tips:
Use the imperfect tense when writing the results: “Three studies show Begin each paragraph with a sentence that summarizes the results you will describe in that paragraph. Keep references at the end of sentences, when possible, so that they do not distract the reader in the text. Instead of writing ‘McCarthy et al. (2015) found that technicians with more experience. . .’ write ‘Technicians with more experience had higher PVC-insertion success rates than technicians with less experience in study at an American emergency department (McCarthy et al., 2015)’. Do not overgeneralize. Instead of writing ‘Patients in isolation missed their families’, write ‘In most studies patients’ most salient experience was missing their families’. Be careful not to draw too large conclusions. That three studies show that X had positive effects does not mean that X works. It means that X ‘may’ work, or ‘can’ work, or ‘might’ work.
Footnotes
Acknowledgements
Thanks to Malin Sandström and Helena Welch for the example research project of PVC insertion in patients with difficult venous access, and to our many students whose struggles and successes with data analysis in general literature reviews have inspired this article.
Declaration of conflicting interests
The authors declare that there is no conflict of interest.
Funding
This research received no specific grant from any funding agency in the public, commercial, or not-for-profit sectors.