
Abstract
Various forms of empirical evidence suggest that parental socioeconomic status (SES) is strongly related to educational outcomes and many countries attempt to close achievement gaps among children. Parenting practice is one important mechanism through which educational inequality emerges across families with different SES. In this paper, we show that the class gap in children’s time use and academic achievements reflects parenting styles and parental practices stratified by parental SES by comparatively investigating the cases of China, Japan, and the USA, drawing on three sets of nationally representative longitudinal data. We find that for children aged 10–15 in China, parental SES has a strong impact on children's homework time and academic performance. Similar patterns are found in the results of 10–15-year-old children in Japan; however, homework time more weakly relates to the parents' education level. Moreover, restricting the samples to 14-year-old children and comparing the three countries, we find that the test score gap among parental SES is the largest in the USA; to fill the gap in math test scores between the first and fourth income quartiles, a sizable number of additional hours spent on homework are needed in the USA, compared to China and Japan.
Introduction
Educational attainment is one of the most important linkages between social origins and social destinations for individuals in Blau-Duncan's status attainment model, as is well documented in the existing literature (Blau and Duncan, 1967; Lucas, 2001; Raftery and Hout, 1993). In a merit-based society, education is the main channel for both upward social mobility and high-status reproduction. It is believed that educational attainment is mainly an achieved factor affecting status attainment in modern societies (Blau and Duncan, 1967). However, it is hard to deny that socioeconomically advantaged families have more economic and cultural capital to invest in children’s education and therefore improve children’s educational performance to maintain high educational status (Schneider, Hastings and LaBriola, 2018). Hence, it is important to know (a) how family background and parental socioeconomic status (SES) affect children’s academic outcomes; (b) what mechanism plays a major role; and (c) the comparative differences between societies.
If we consider children’s achievements to be the output of families’ practices and investments, it is necessary to figure out what kind of input maximizes output (Becker, 1991). Usually, there are two kinds of parental practices, that is, investments of resources in their children’s education: monetary and non-monetary. On the one hand, parents may spend more financial resources on ‘shadow’ education 1 and materials for their children. This kind of parental practice may vary by family SES (Schneider et al., 2018). It has been demonstrated that higher SES families are more likely to spend money on private tutoring for their children (Zhang and Xie, 2016). On the other hand, parents also make non-monetary investments, including spending more time with their children, expressing concern for and patience with them, and providing learning environments at home. This kind of parental practice may depend on families’ cultural capital (Bourdieu, 1984). Prior research offers a rich discussion on the effects of family background on children’s educational outcomes (Alexander, Entwisle and Olson, 2007; Bianchi and Robinson, 1997; Eren and Henderson, 2008; Guryan, Hurst and Kearney, 2008; Heckman, 2006; Kalil, Ryan and Corey, 2012; Liu and Xie, 2015; Lyu, Li and Xie, 2019; Revicki, 1981; Schneider et al., 2018; Zhang and Xie, 2016).
One of our main interests in this paper is the relationship between parental SES and children’s time use. The Organisation for Economic Co-operation and Development (OECD) (2011) reported that socioeconomically advantaged students spend much more time in regular school lessons and individual study than disadvantaged students in most OECD countries (see OECD, 2011: 40). For out-of-school-time lessons, 2 however, evidence of the difference between socioeconomically advantaged and disadvantaged students is not consistent across OECD countries (see OECD, 2011: 46). One explanation for the inconsistency in time spent in out-of-school-time lessons is that these lessons have two different purposes: remediation and enrichment.
Previous research on American children’s time use showed that children in low-income families spend much more time watching television than their counterparts in affluent families (Larson and Verma, 1999) and that children with more-educated parents watch less television and study and read more than their counterparts with less-educated parents (Bianchi and Robinson, 1997; Hofferth and Sandberg, 2001). Gershenson (2013) found that during summer vacations children in low-income families tend to watch for two more hours per day than those in affluent families.
With regard to the research on Japanese children’s time use, Kariya (2013) pointed out that among second-year senior high school students, learning time decreased between 1979 and 1997 and that this tendency is particularly pronounced in lower-social-class families in terms of parental education and occupation. Moreover, Kawaguchi (2016) concluded that differences in students’ learning time in conjunction with the educational background of their parents were especially pronounced on weekends. Nakamuro, Matsuoka and Inui (2013) focused on the relationship between time spent studying and other activities such as watching television. They suggest that reducing the activity time does not necessarily add to study time, while the parental commitment to children’s study does greatly affect study time.
As for parental involvement, Revicki (1981) found that parental SES is related to parents’ involvement in their children's homework. Guryan, Hurst and Kearney (2008) and Ramey and Ramey (2010) indicated that more-educated parents spend more time in childcare, and Evans (2004) noted that high-income parents tend to be more involved in school-related activities, even though their opportunity cost of time is high (i.e., high wages). In addition, higher-income parents are more likely to engage in literary activities with their children, such as reading books or visiting libraries, than their lower-income counterparts (Evans, 2004).
In addition to monetary and non-monetary educational investments, another significant parental practice in China is the universally high educational expectations for children, which reflect special parenting styles in Chinese families. It has been found that parents in China tend to hold high educational expectations for their children whether family SES is low or high (Lyu et al., 2019). Although some families possess less economic and cultural capital, these families believe that education is the best way to achieve intergenerational mobility and therefore encourage their children to go to school. The higher the level of education their children attain, the better. In this case, will such high educational expectations without class differences benefit children’s academic outcomes?
Evidence from comparative studies suggests that unlike in Western countries, parental socioeconomic status is weakly associated with children’s academic performance in East Asia, whereas parenting attitudes matter more for children’s academic outcomes (Liu and Xie, 2015; Lyu et al., 2019). Stevenson and Stigler (1992) provided the cultural explanation that in the Chinese contexts nurtured in Confucian culture, people believe that (a) education is a ladder of success, and (b) people can succeed if they work hard. Therefore, East Asian students from low SES backgrounds have educational expectations that are similar to those from high SES families. At the same time, compared to East Asian students, White students with low SES in the USA have lower educational expectations and lower rating on the importance of good education, and their parents also have lower educational expectations than parents of East Asian students (Liu and Xie, 2016). The arguments in comparative research help us to better understand the differing effects of family SES on children’s academic performance between East Asian and Western societies. However, there is still a logical loophole for understanding the observable class gap in children’s academic outcomes and the mechanism of parental practices influencing children’s academic performance. In this paper, we propose that parental SES affects children’s academic achievements through children’s time use outside of school. Children’s time use is directly associated with children’s achievements. 3 The class gap in children’s time use reflects parenting styles and parental practices stratified by parental SES. That is, even if high educational expectations are universal, how parents manage children’s time may differ by parental SES, which ultimately results in variations in children’s academic performance.
The remainder of this paper is organized as follows: the Data section presents the data employed in the analysis and describes how the variables were formulated; the Empirical Analysis section presents the results of a descriptive analysis through figures; the Estimated Equation section discusses the method of regression analysis; the Estimated Results section presents the results of the estimation; and the Conclusion section summarizes our results.
Data
Overview of dataset.
Note: The US data includes children from a wide range of ages because of repetition and skipping a grade.
Descriptive statistics.
Note: We excluded subjects with any missing values on any of the variables used in the regression analysis of math test scores.
The data we use in the China section is taken from the baseline wave of the CFPS collected in 2010. We use the CFPS baseline survey because the time-use module was only available in CFPS2010 in contrast with other waves (2012/2014/2016). The CFPS is a nationally representative longitudinal social survey conducted by the Institute of Social Science Survey at Peking University in China. CFPS2010 has collected a sample of 19,986 households from 25 provinces in the Chinese mainland. CFPS2010 used Child Questionnaires that collected rich data relating to children’s academic performance (math and word test scores), mental state (self-esteem), educational expectations and their parents’ childrearing practices. In addition, there was a Time Use Module in the Public Modules Section to collect information from each respondent on how they spent time in their daily life. In this way, we can get data on children’s time use on homework and entertainments daily, which makes for easy comparison with that in other societies. When merging children’s data with family data, we can also obtain family background information for our main analysis.
The JCPS is a nationally representative longitudinal survey which targets Japanese children and their parents and has been operated by the Panel Data Research Center at Keio University since 2010. The target of the JCPS is children from ages 7–15, who are in elementary school or junior high school. The survey was carried out in 2010, 2011, 2012, 2013, 2014, 2016, and 2018, and our analysis employed the publicly available waves at the time of writing (that is, waves up until, and including, the 2016 survey). The survey is comprised of questions relating to how children spend their time in terms of ‘learning time outside school’ and time spent watching television, as well as tests of academic achievement (Akabayashi, Naoi and Shikishima, 2016). Such data can be used to show changes in how children spend their time, not for specific ages or school grade, but over the period from the first year of elementary school to the third year of junior high school. The survey also utilizes data on socioeconomic status, giving it the benefit of enabling analyses of changes in how children spend their time over a variety of household types. When we analyzed the samples of the JCPS, we pooled six waves of surveys.
The ECLS program provides national data, including three longitudinal studies that examine child development, school readiness, and early school experiences in the United States. In order to be comparable with the surveys in China and Japan, we focus on the birth cohort of the ECLS-K (the kindergarten class of 1998–99) in the spring 2007 survey following the same children from kindergarten through eighth grade. The children in the ECLS-K were selected from both public and private schools and were attending both full-day and part-day kindergarten programs during the 1998–99 school year. With regard to variables on children’s time use, information about hours spent on homework each week, hours spent watching television, and hours spent playing computer or video games on weekdays was collected. It can be potentially utilized for examining the relationship between children’s time use and family background, school environment, and teacher qualifications.
Children’s time use measure
The CFPS collects various measures of Chinese children's time use by self-description, such as time spent on learning, entertainment, and household chores, etc. In this paper, we focused on the following item to know how many hours children spend on homework and reviewing their class material on weekdays—‘Activities related to formal education, such as doing homework and course review,’ according to the CFPS user's manual. Based on our descriptive statistics (Table 2), the mean amount of time spent on homework is about 90 minutes per day at ages 10–15.
Next, the JCPS sheds light on how children spend their time after coming home from school on weekdays. The JCPS examines time spent on homework assigned by the school; total learning time, including time spent in cram school; watching television/video alone; playing video games alone; etc. For children in grade 4 (10 years old) and above the questions are included in the child questionnaire and the child themself provides the relevant answers. Except for total learning time, there are five answer options for how time is usually spent: ‘Do not do,’ ‘About 30 minutes,’ ‘About 1 hour,’ ‘About 2 hours,’ and ‘3 or more hours.’ This study transformed these options into the following values for use in the analysis: ‘0 minutes,’ ‘30 minutes,’ ‘60 minutes,’ ‘120 minutes,’ and ‘180 minutes.’ 4 Our observations’ mean of time spent on homework is about 55 minutes at ages 10–15, as shown in Table 2.
Finally, the ECLS-K children's time spent on homework, watching television, and playing computer or video games by self-description. The wording of the homework question is as follows: ‘Overall, about how many hours do you spend on homework each week both in and out of school combined?’ 5 We calculated the daily time spent on homework based on this questionnaire. The mean time spent on homework is about 80 minutes at age 14, as shown in Table 2.
Although it is better to use the same index of time use, we could not do that because the contents of the questionnaires in each country were not exactly the same. This is a limitation of our research.
Test scores
Three datasets include achievement test scores. The CFPS conducts standard word and math tests for children from different grades to generate comparable variables measuring cognitive skills. The JCPS also conducts tests in math and Japanese language every survey year. The math test includes both calculation and written questions, and the Japanese language test contains questions on aspects such as kanji (Chinese characters) and idioms. The ECLS-K also includes math and reading tests. The CFPS and the ECLS-K provide IRT scaled test scores for each subject, and we standardized these scores with a mean of zero and standard deviation of one. The JCPS does not produce the IRT scaled score by itself, but we used the IRT scaled test score that Yamaguchi et al. (2019) calculated with the authors’ permission.
Household income
Household income is one of our socioeconomic status indexes. Both the CFPS and the JCPS provide household income as a continuous variable, while the ECLS-K measures it as a categorical variable. We transformed each category of household income in the ECLS-K to the midpoint of the respective bracket ranges. To avoid comparing different currency units among the three countries, we converted the household income to the quartile. 6
Parental education level
Another household socioeconomic index is parental education level. We used the highest academic achievement among parents as the household's education level. If either parent's education level was missing, we used the non-missing value as the household's education level. If both parents' education levels were missing, we excluded the families from our analysis.
Theoretically, parental education can have an independent effect on the child's behavior and outcomes after controlling for household income, for at least two reasons. First, parental education can serve as a proxy for the direct impact of the genetic transmission of innate ability, which is not completely captured by household income. Second, parental education can have a direct effect on the child's time allocation and educational outcomes through family education and cultural influences on behavior. This is especially true when the mother does not work outside the household and mainly takes care of the children.
The first reason, based on purely biological mechanisms, is unlikely to vary across countries except for a possible gender gap in education of the parental generation due to cultural bias. The impact of the second reason, however, is likely to differ across countries because social norms regarding childrearing and education can vary greatly across cultures, stages of social development, and economic conditions (Doepke and Zilibotti, 2017). The cross-country differences in the effects of parental education on children would summarize the non-monetary, non-genetic influences of parental background, depending on the degree of gender-role bias in family education. Thus, it would be of great interest to see how the effects of mother's and father's education on children's time use and outcomes within the similar income group vary across the three different countries.
Since the distribution of academic background in China is significantly different from that in the other two countries, we divided education levels into three groups: high, middle, and low. Unlike the high education levels in Japan and the USA, China has a low education level overall and a more skewed distribution. In China, more than 80% of parents graduated from junior high school, and only 5% graduated from college and above. Women’s education is lower than that of men overall. In other words, parents in China are more polarized in educational attainments and mothers’ social status is lower than fathers’ social status.
In the CFPS, low, middle, and high education levels refer to those who have primary school degrees and below, those who graduated from junior high school, and those who have senior high school diplomas and above, including those with college degrees. In the case of Japan and the USA, we classified education levels as follows: the low education level refers to those who graduated from high school and below; the middle level applies to those who graduated from college or a vocational or technical program; and the high level refers to those who graduated from university or graduate school.
We note here that in the survey of PISA scores, parental SES is a composite index of the highest education level of parents, the highest occupational status of parents, and possessions in the home. Dornbusch (1986) found that in family background information parents' education level is the strongest predictor of student achievement. Thus, we divided students’ socioeconomic background into two variables: household income and the highest education level of parents. This allows us to analyze the effects of these variables on the children’s time spent doing homework and academic performance (math and word test scores).
Ethnicity
Following the approach used in Lyu et al. (2019), we made an ethnic majority dummy for the Chinese and USA data. In a similar fashion to that of Lyu et al. (2019), we considered the Han race as the majority group in China and Whites as the majority group in the USA. The JCPS does not collect the variable about ethnicity. 7
Empirical analysis
Graphical description
In the figures presented in this section, we graphically show the differences in minutes spent doing homework and educational outcomes among socioeconomic levels in China and Japan. We also indicate the timing when the disparities of the child’s time use and outcomes between the household's socioeconomic levels emerge. The socioeconomic level means the household's income level and parental education level. We classified households with children aged 10–15 into four groups by their total annual earning. We also divided the observations into three groups by the parents’ highest educational background.
In these figures, child’s age is on the horizontal axis, while the vertical axis illustrates how much time children spend on homework or their academic achievement. The heights of bars in each figure represent average values by child’s age and parental socioeconomic status. It should be noted that they do not represent changes in how any particular child spent their time. However, the fact that neither the CFPS nor the JCPS is restricted to any particular school grade (unlike the PISA international test of academic achievement) does mean that this approach has the advantage of showing generally how time spent changes as children grow and at what stages differences stemming from household attributes begin to emerge.
China (CFPS)
Figures 1A and 1B show how Chinese children’s time use on doing homework varies by family background. In general, the older the children were, the more time they spent on homework, as academic pressure increases in higher grades. If we divide this trend by parents’ educations and household income, we can find that the more educated parents were, the more time children spent on homework. These patterns suggest a positive association between parents’ educational background and children’s academic efforts.
Child's minutes spent doing homework on weekdays by SES in China.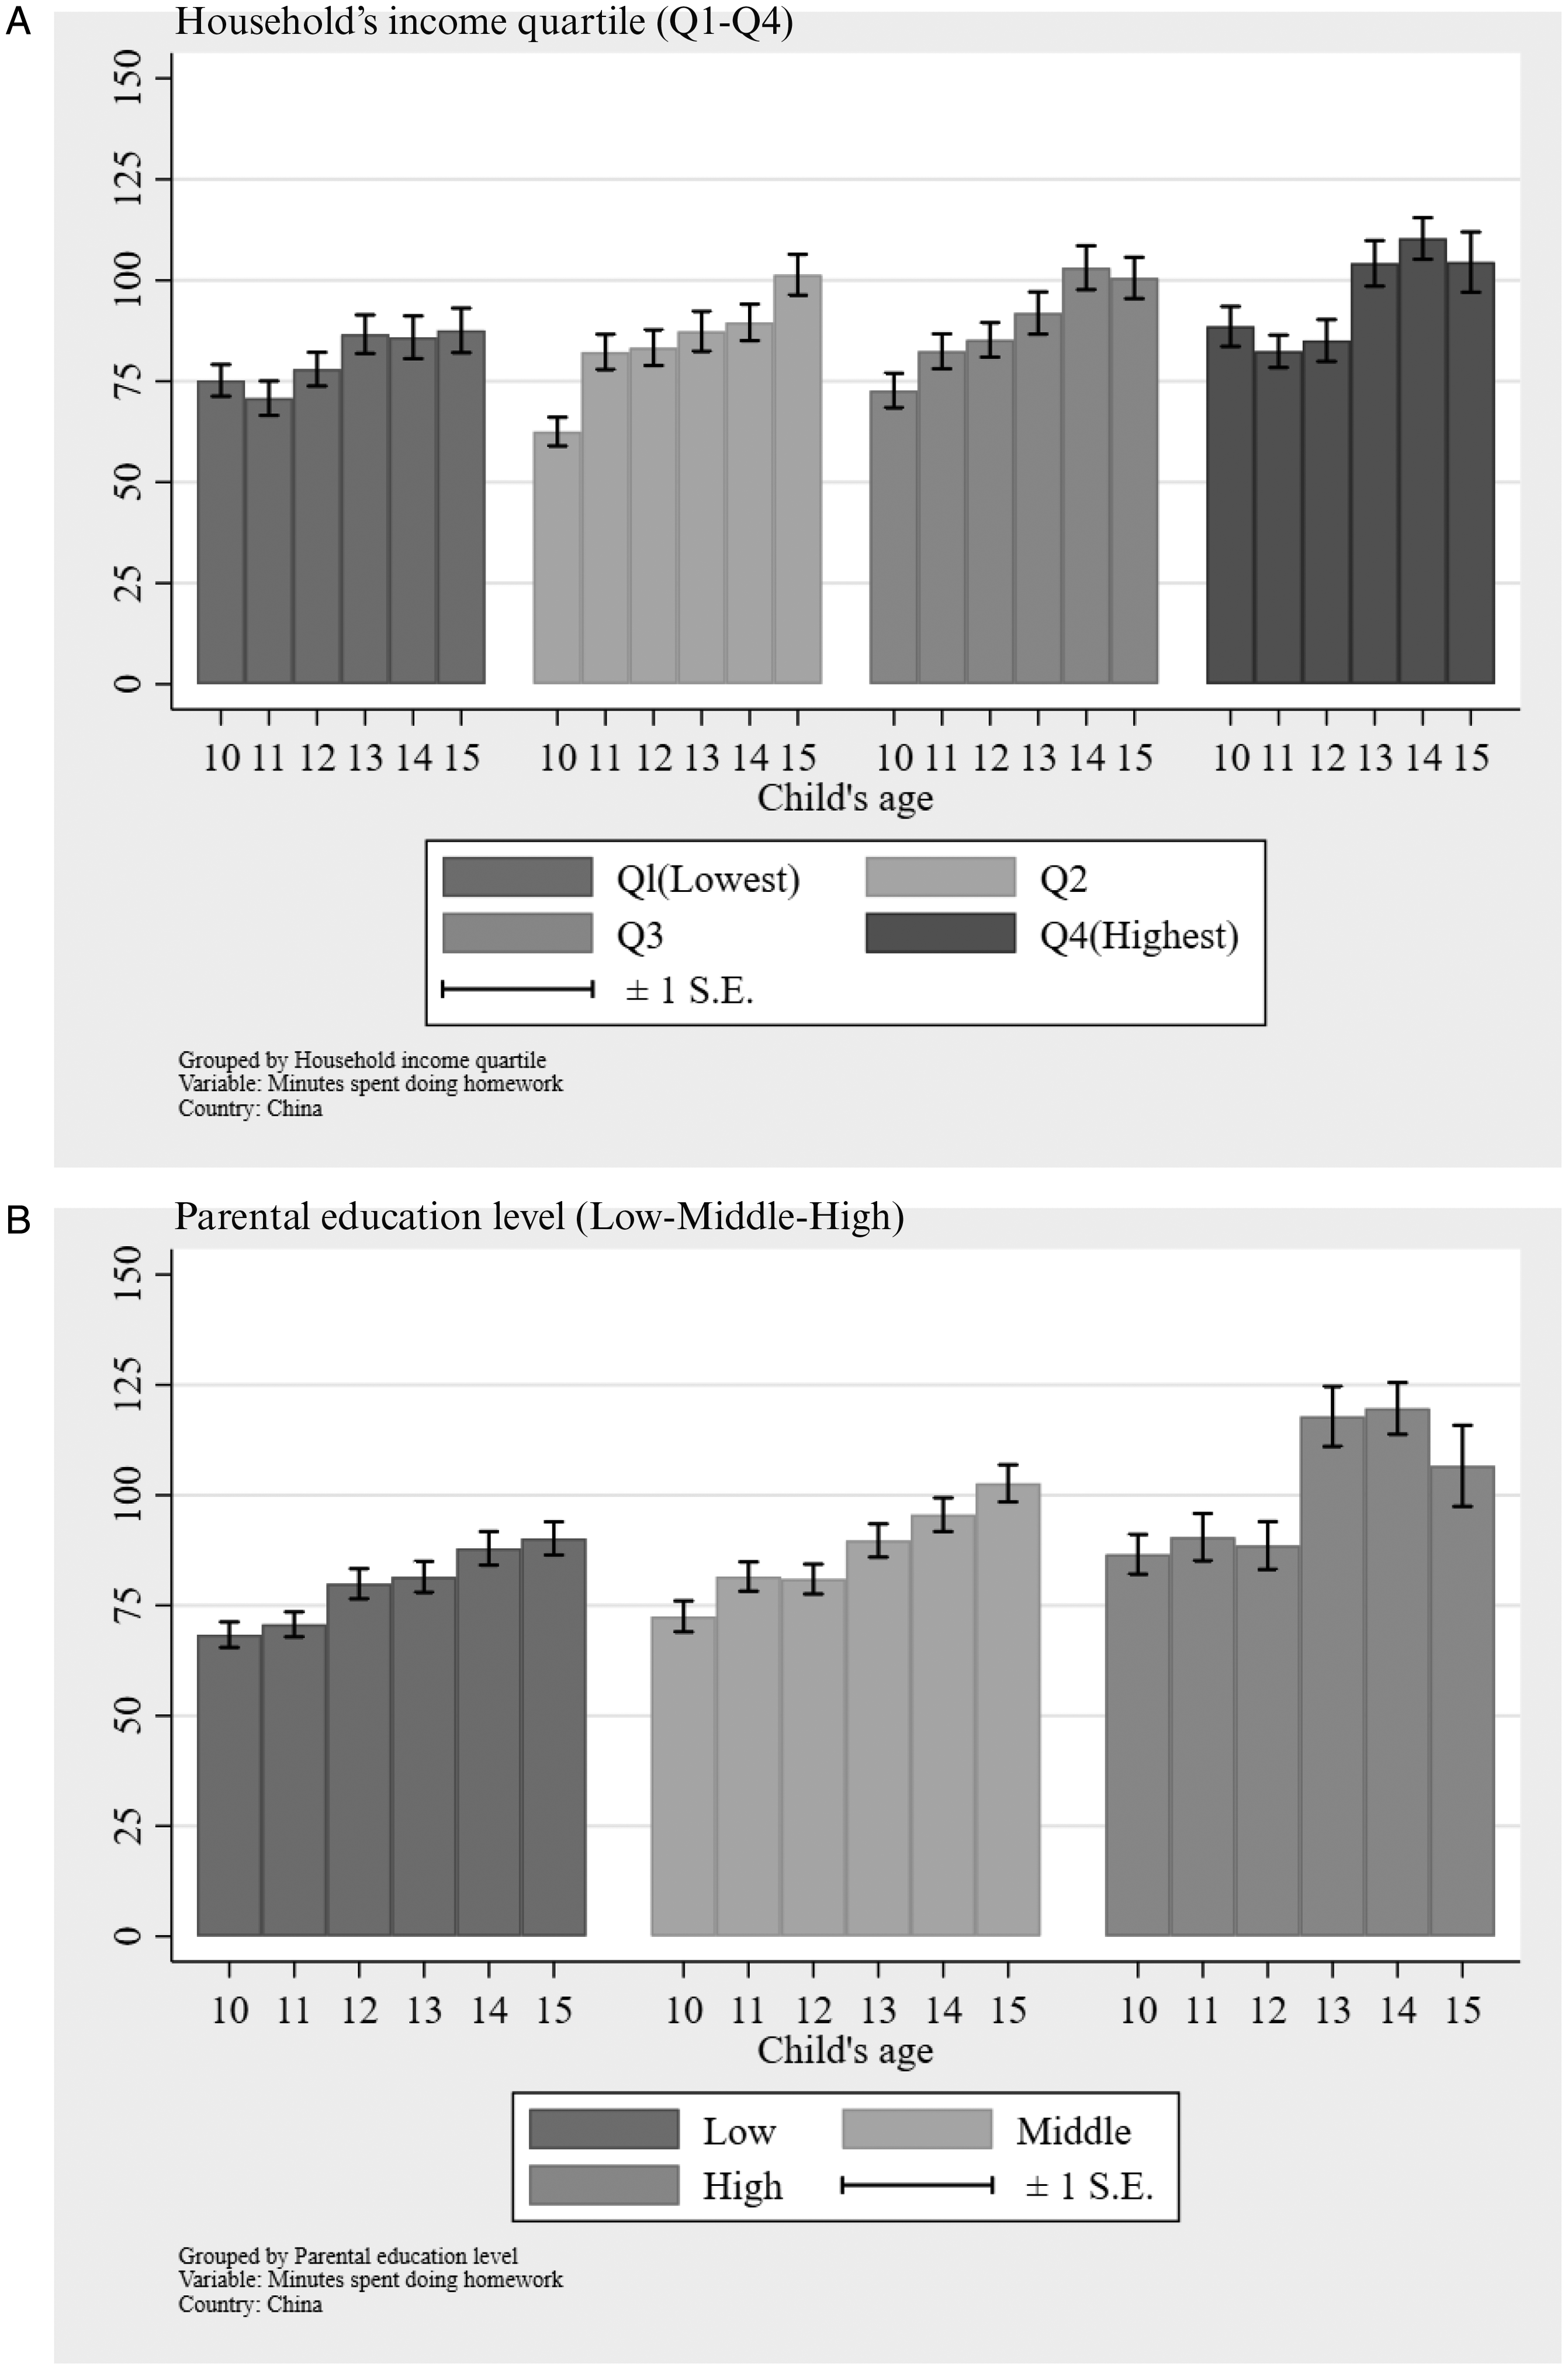
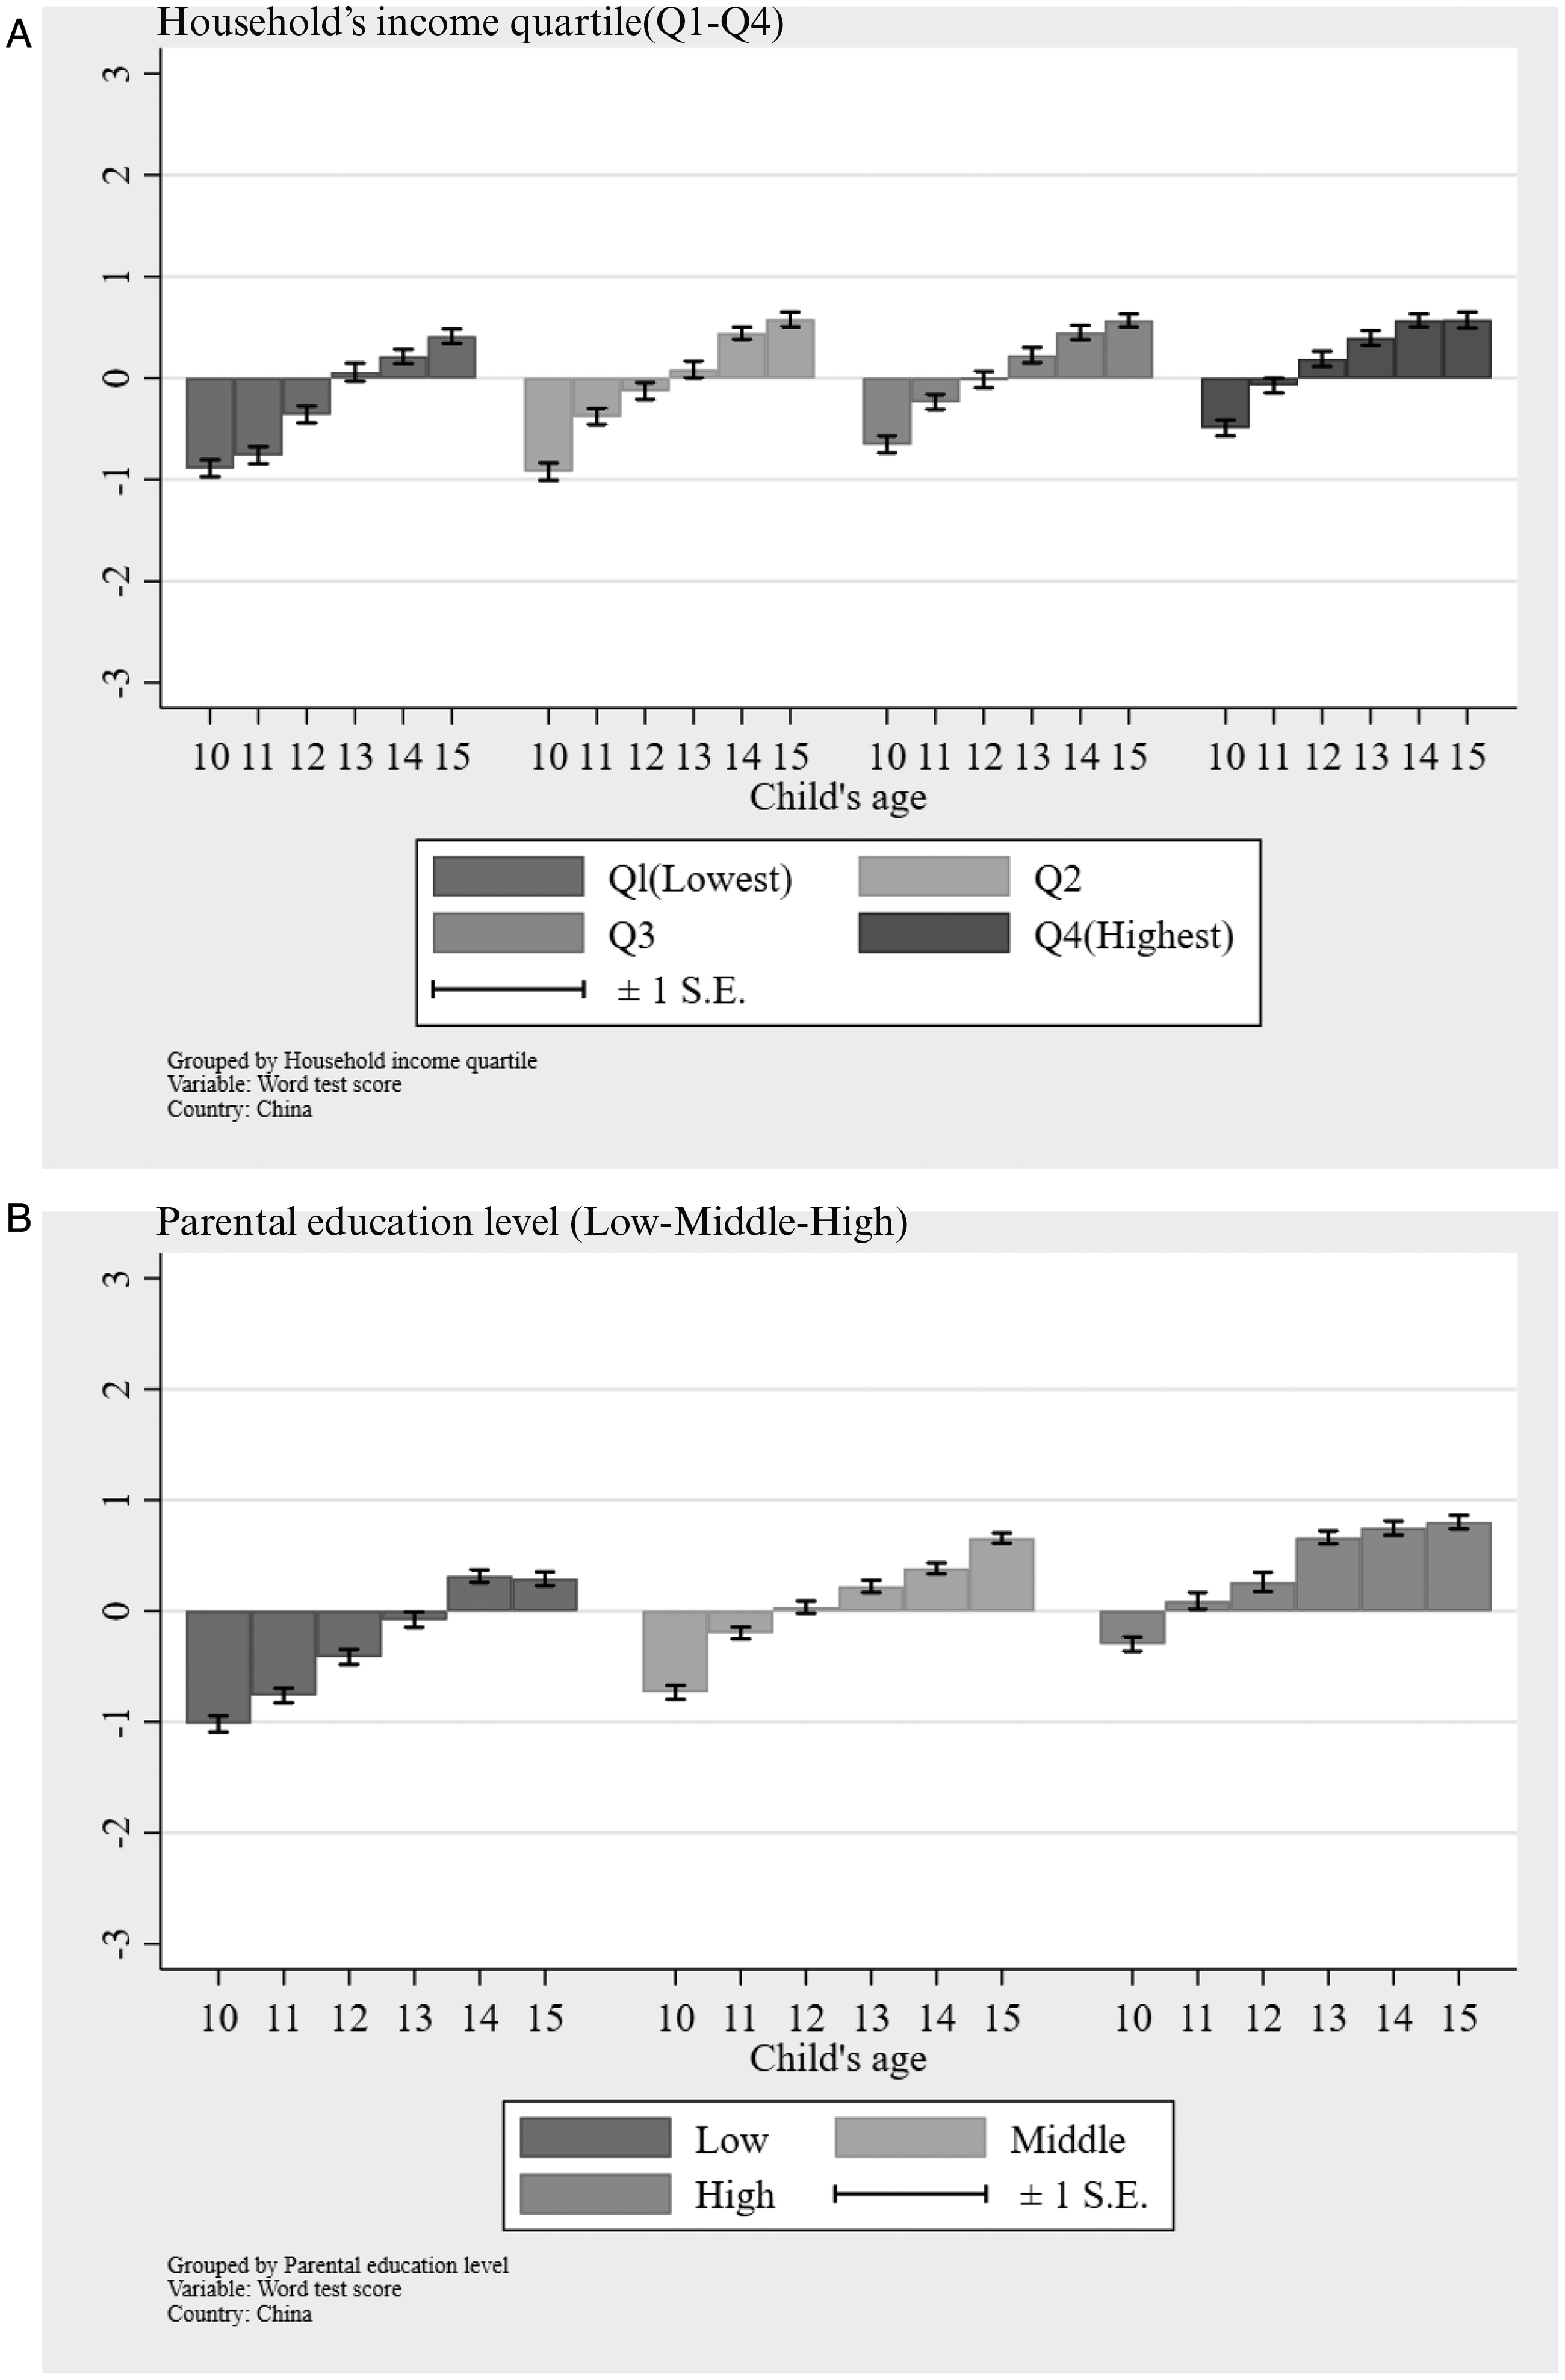
We use children’s math and word test scores as measures of cognitive skills, shown in Figures 2 and 3. Surprisingly, there is small difference in math test scores among families with different social backgrounds. Word test scores may reflect consequences of parenting practices and cultural capital more directly. We can see a moderate positive correlation between parents’ education and children’s word test scores.
Child's math test score by SES in China. Child's word test score by SES in China.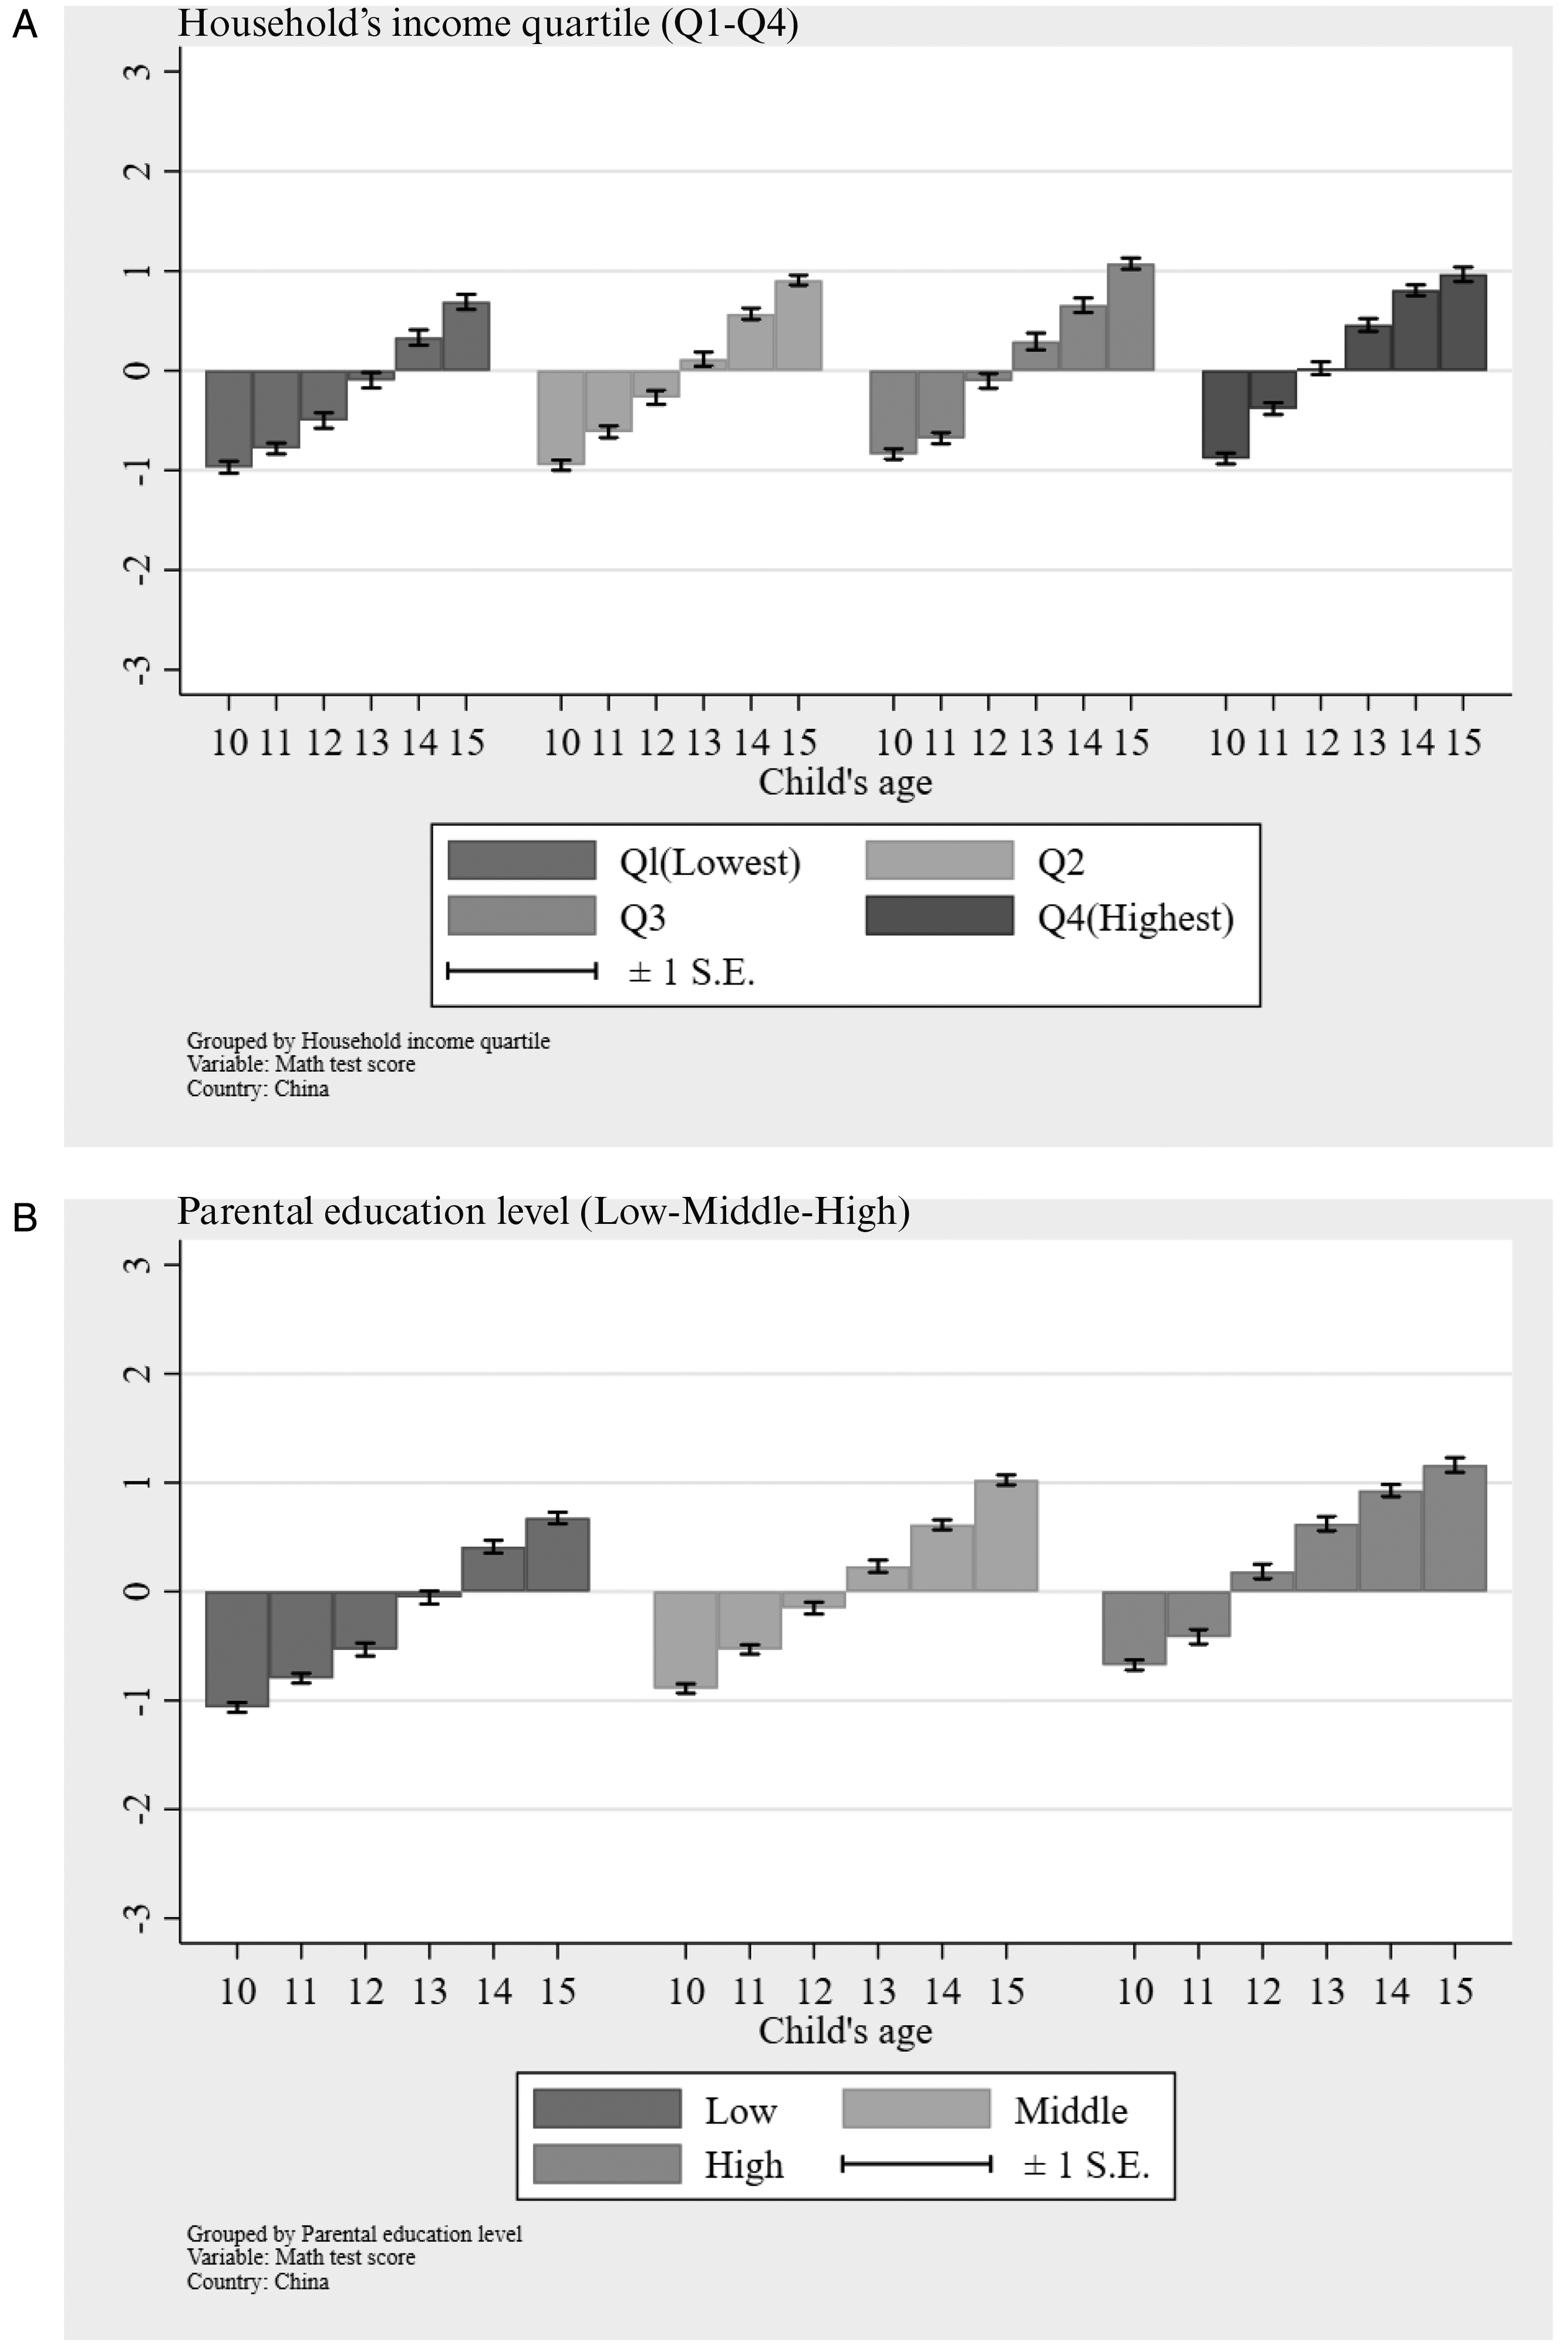
Japan (JCPS)
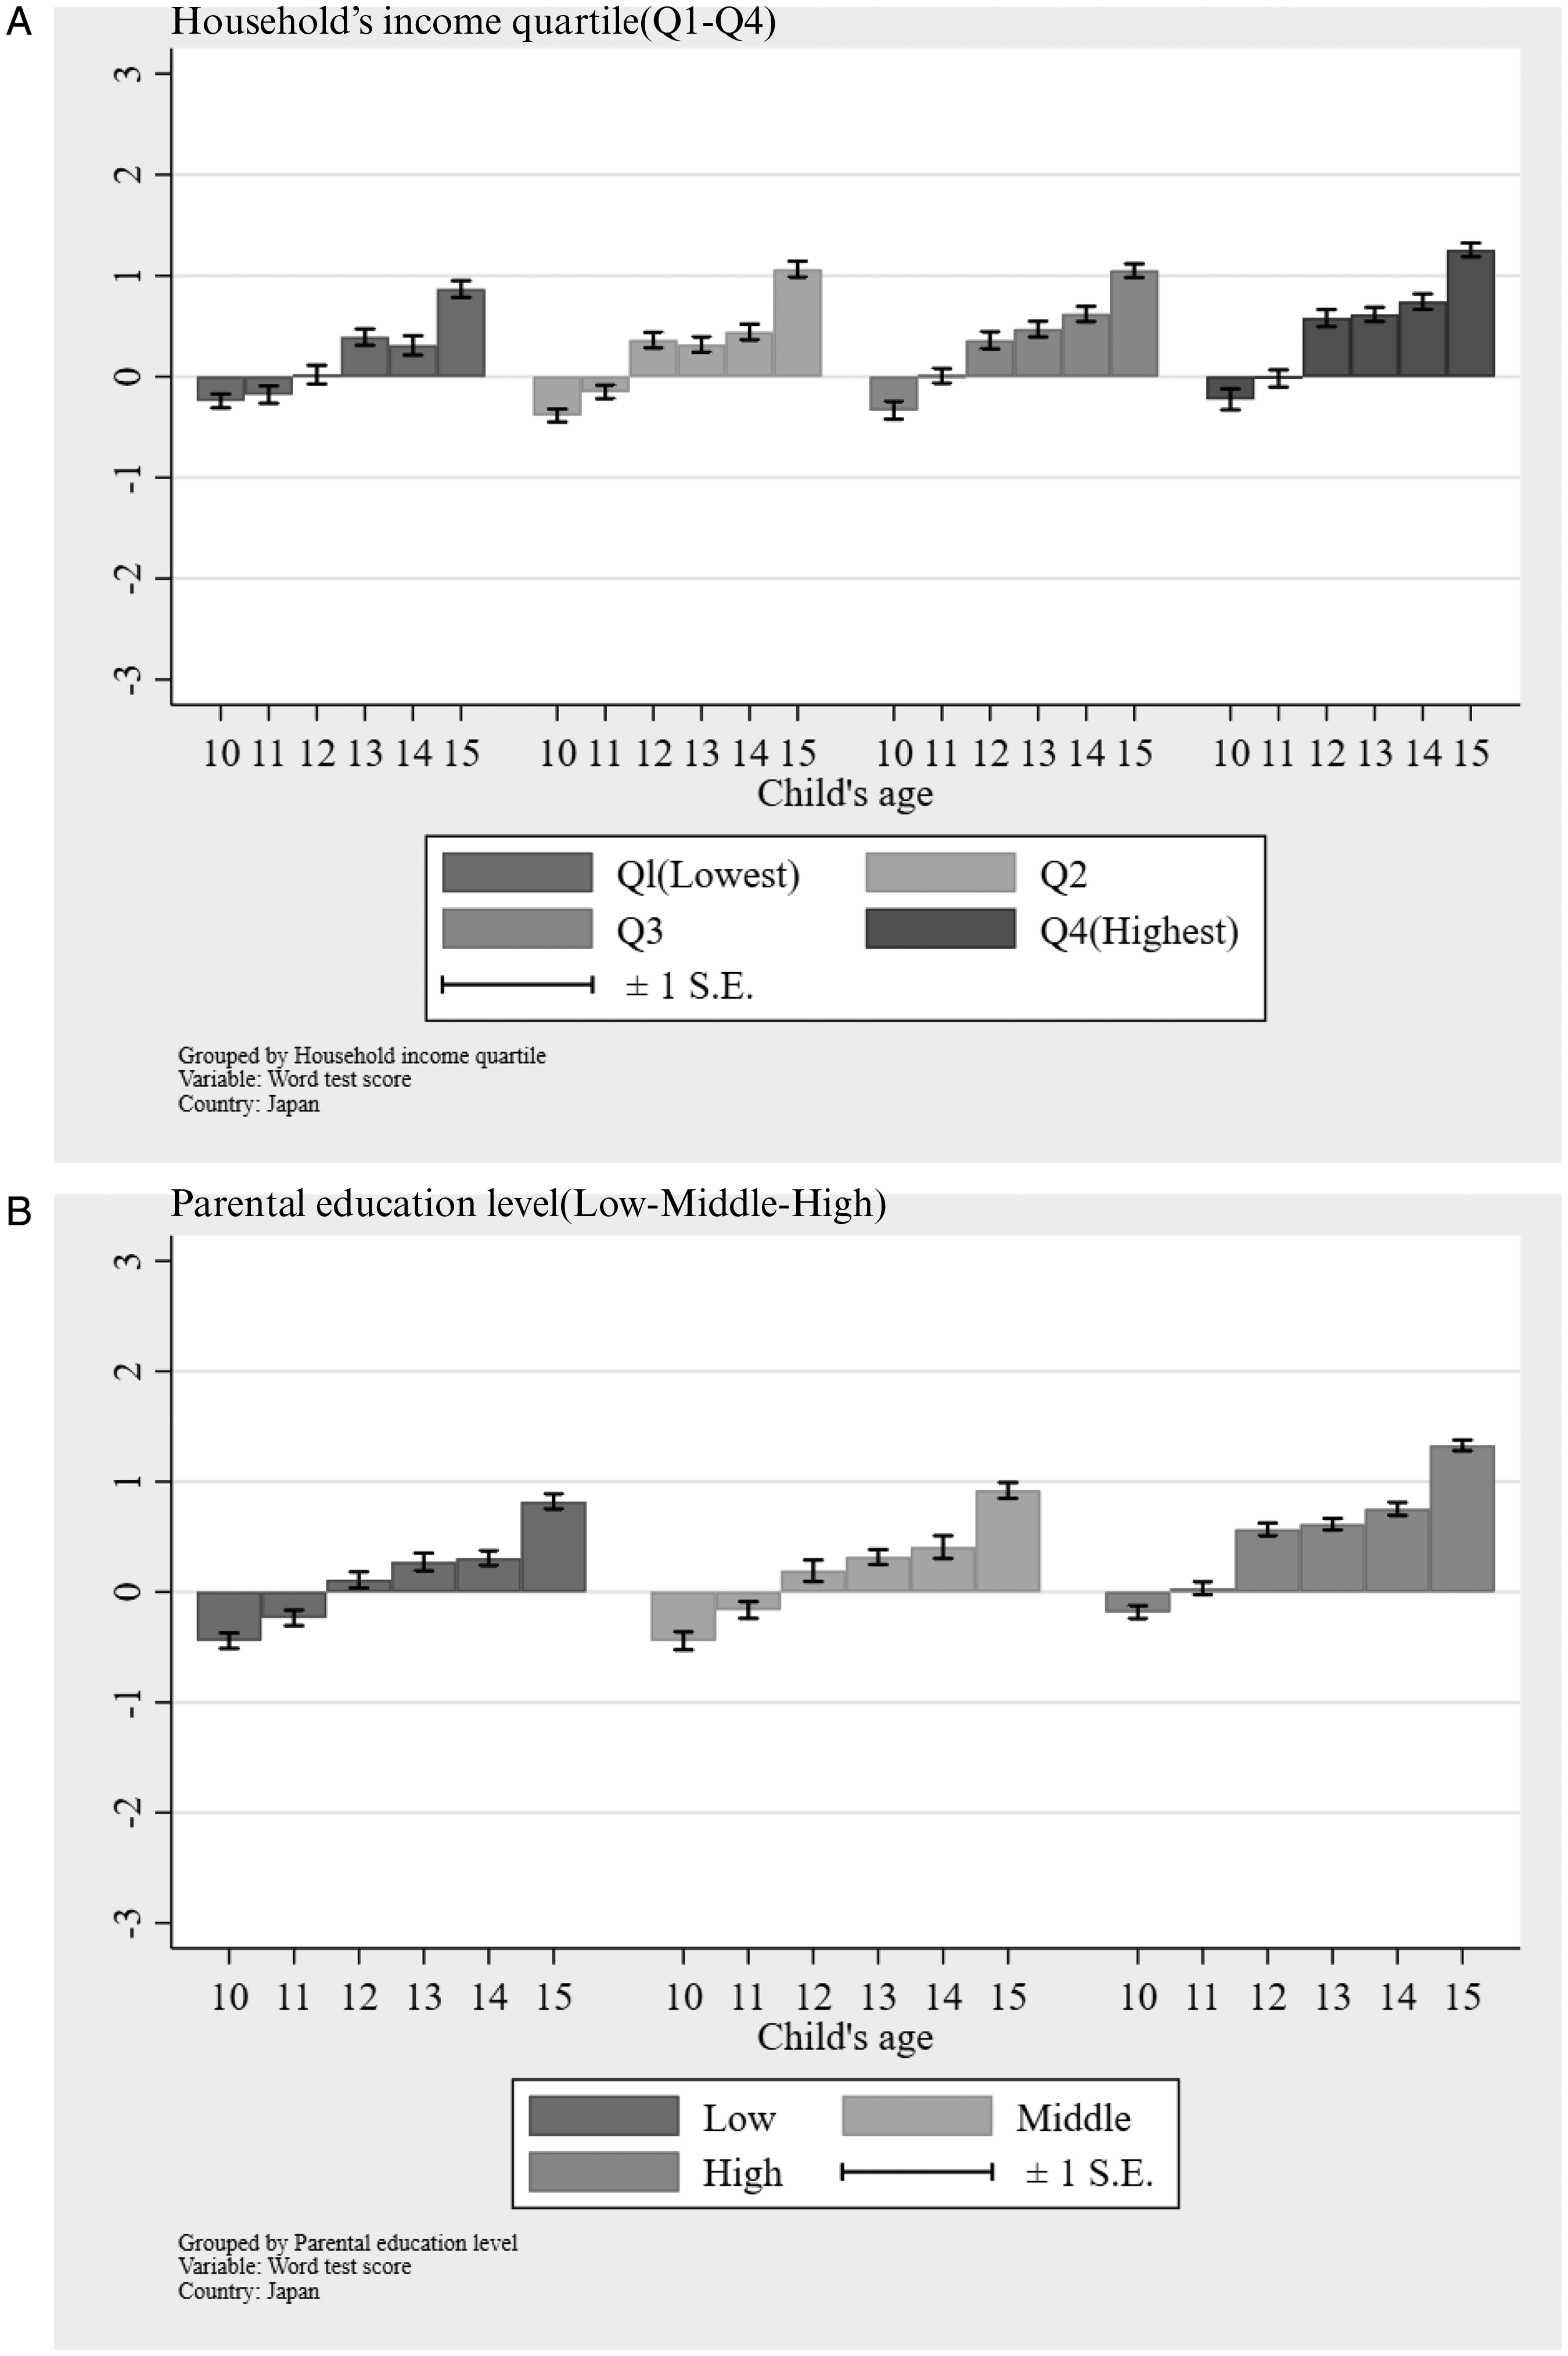
Figure 4 shows trends in time spent doing homework among Japanese children. Although no large differences in time spent doing homework among children of parents with different SES levels are apparent up until age 14, when they reach age 15 or the final year of junior high school, a subtle difference in time spent doing homework attributable to income can be discerned.
Child's minutes spent doing homework on weekdays by SES in Japan.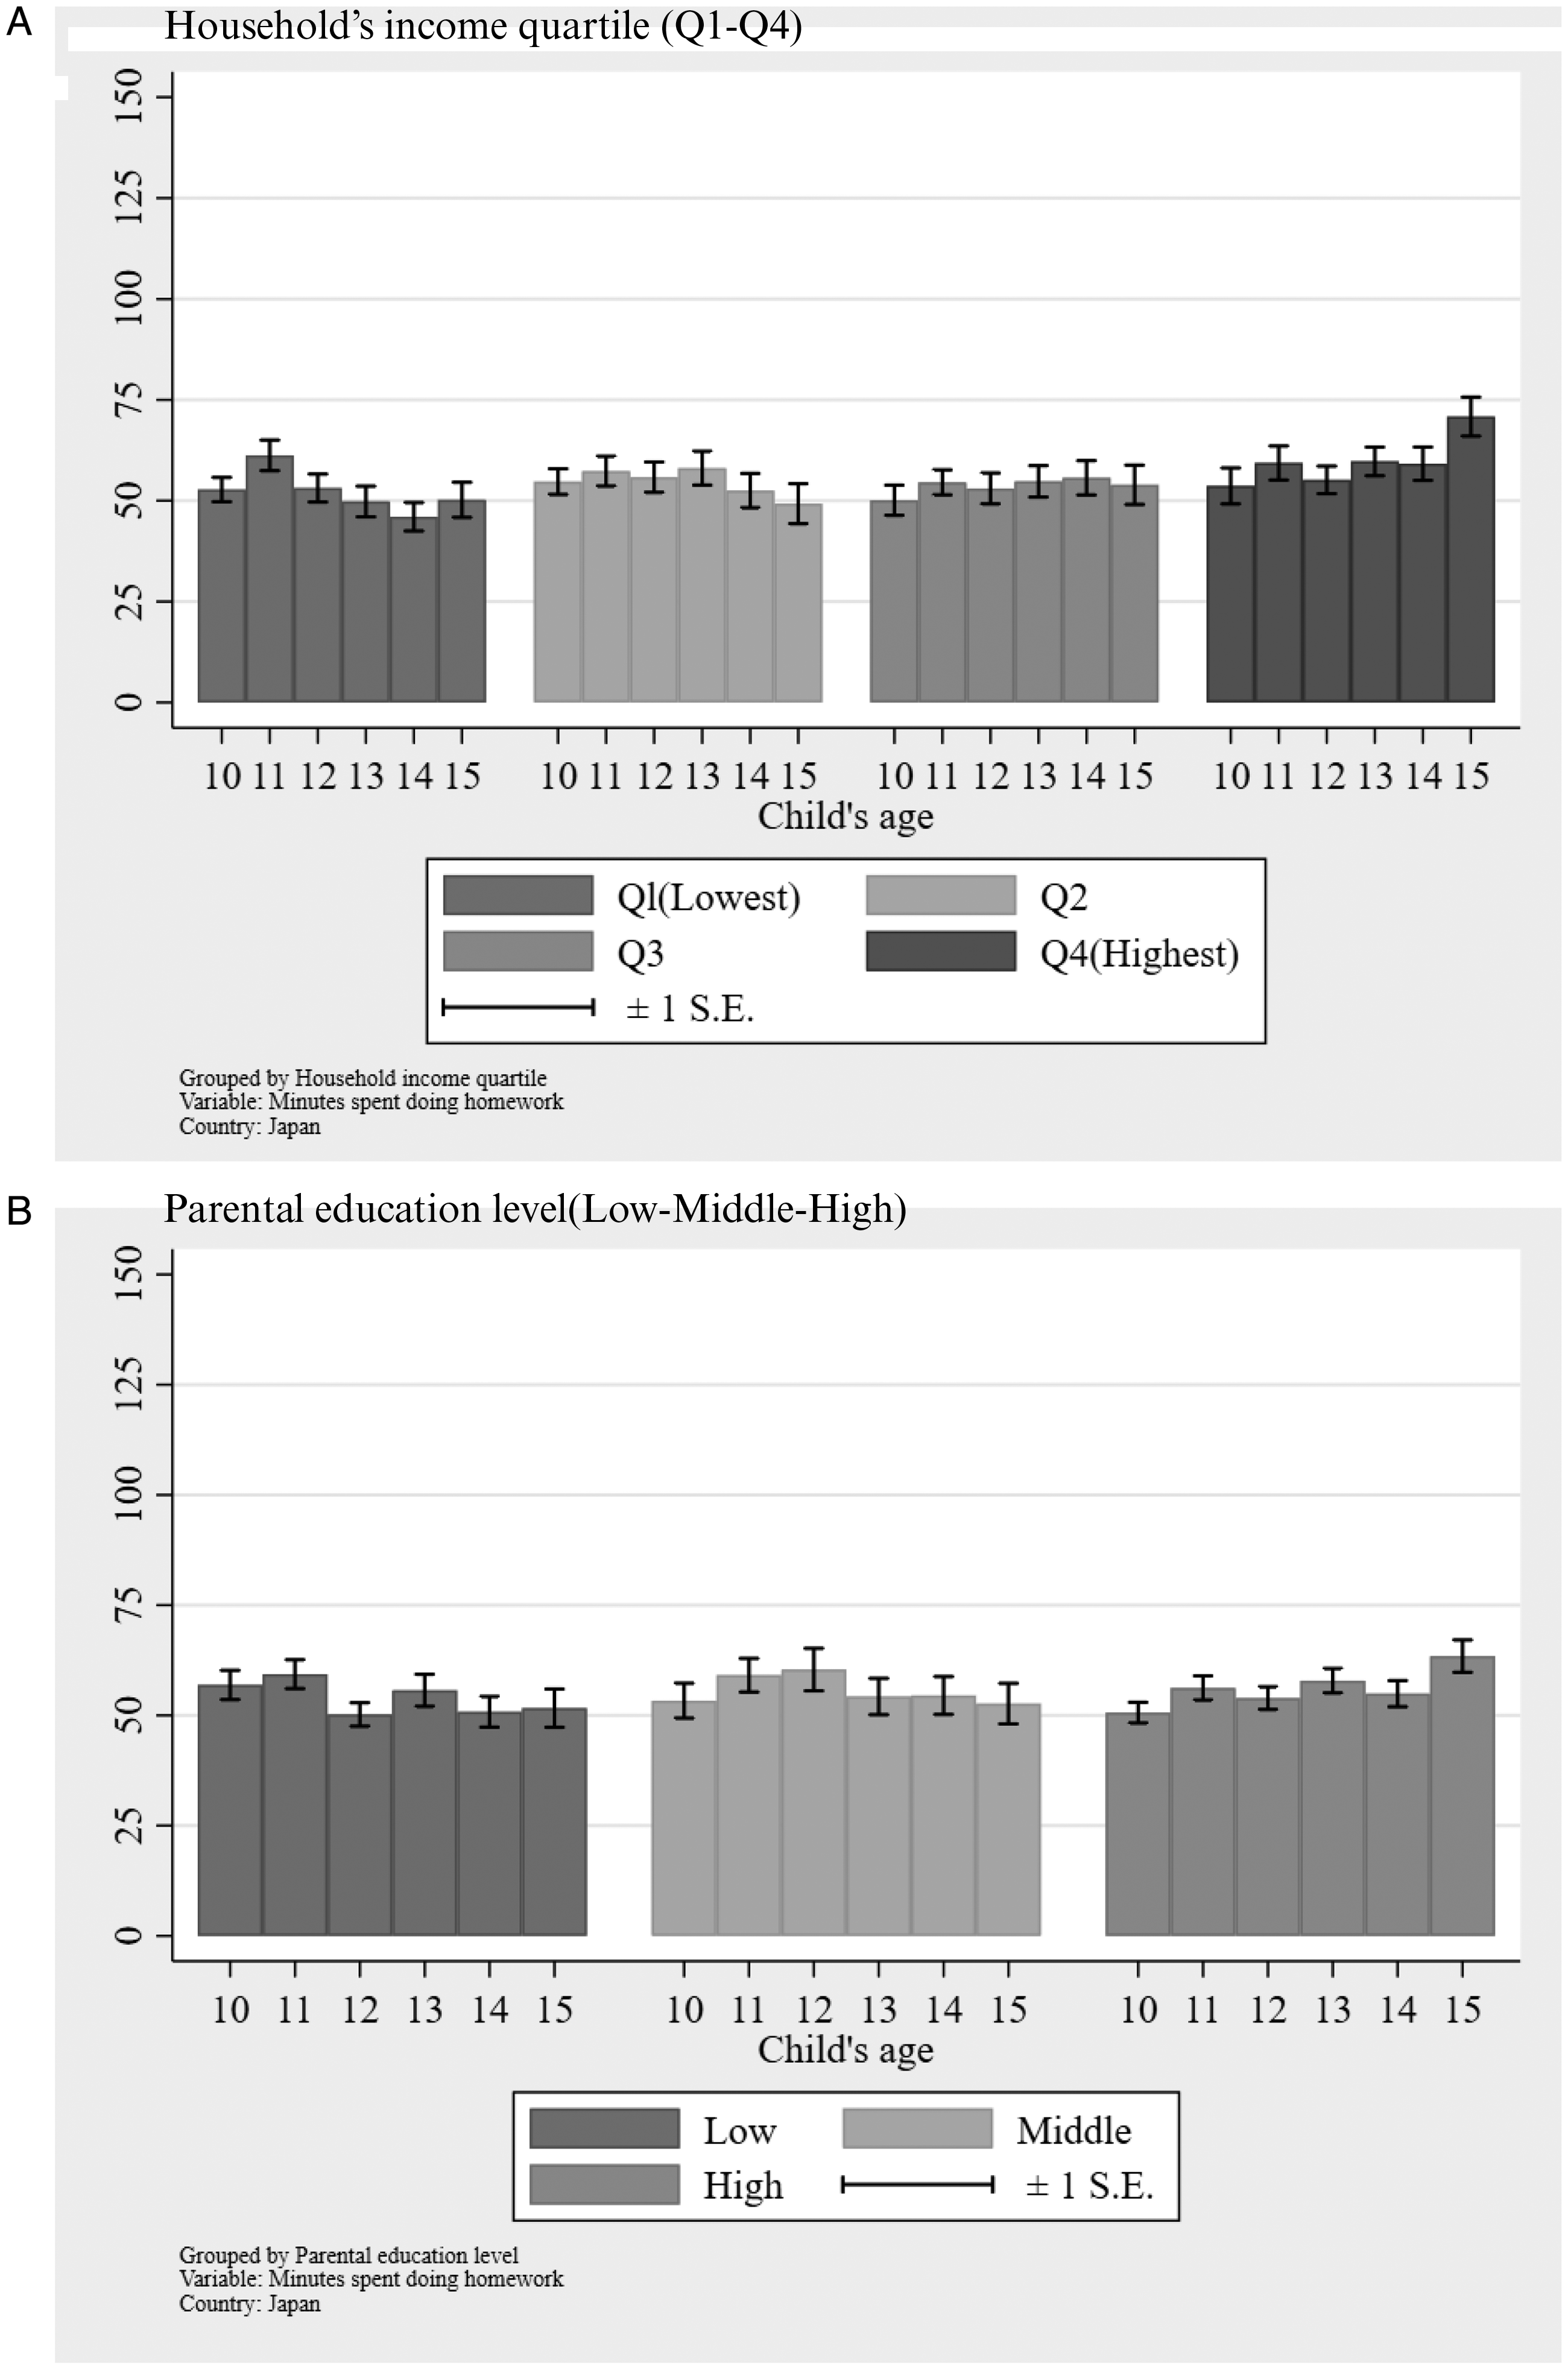
Figures 5 and 6 show when and to what degree differences in academic achievement emerge. With regard to changes due to household income, differences over income levels begin to arise around age 12 or in sixth grade of elementary school. By parental educational background, differences in academic achievement also begin to emerge around age 12. The same trends are apparent for word test, Japanese language, in Figure 6.
Child's math test score by SES in Japan. Child's word test score by SES in Japan.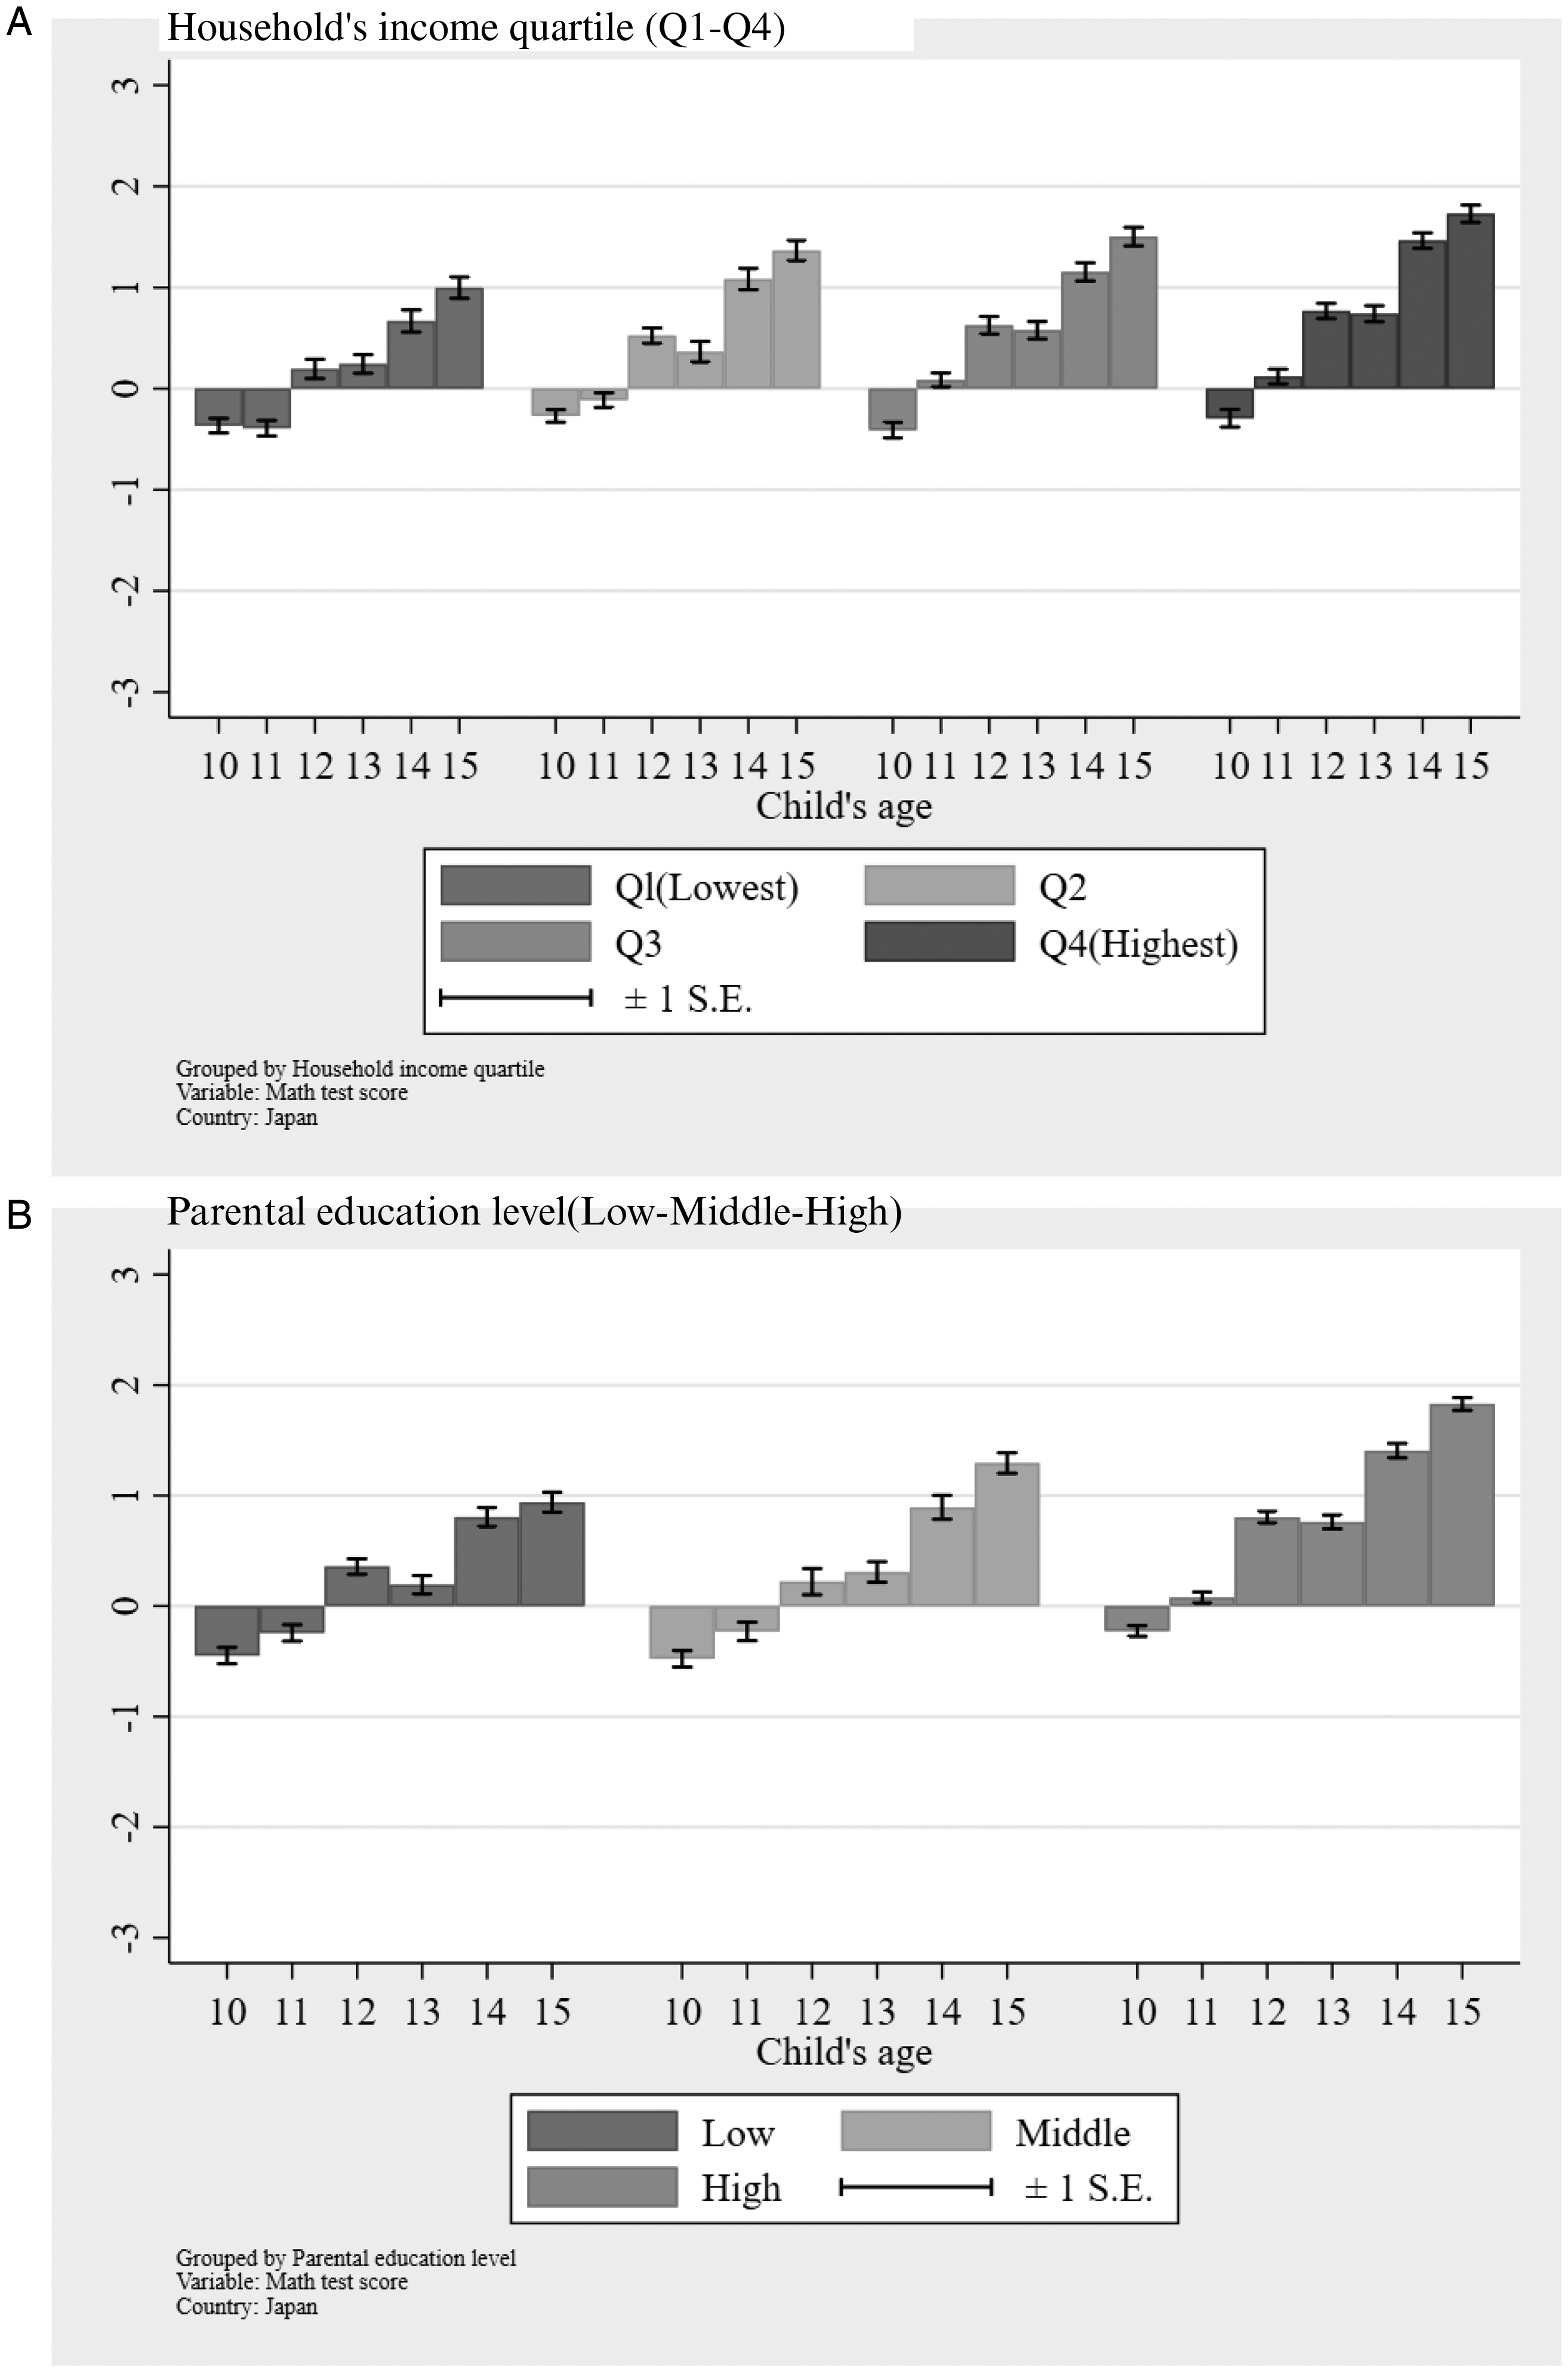
Comparison of child's time use in the eighth grade among the three countries
We now compare the time use of a child in the eighth grade among China, Japan, and the USA. To include the US children in the comparison, we restricted the Chinese and Japanese observations to eighth graders, or age 14. Figure 7 shows how the amount of time spent studying changes by parental SES and country. At a glance, the Chinese children spent more time studying, and the gaps between high SES and low SES families are more substantial than in the other two countries.
8
Surprisingly, the Japanese children’s homework time was the shortest among the three countries, and the gaps among household income and parental education are smaller. These small gradients may be due to the standardized compulsory educational system in Japan.
Comparison of minutes spent doing homework on weekdays by the eighth grade children by SES among three countries.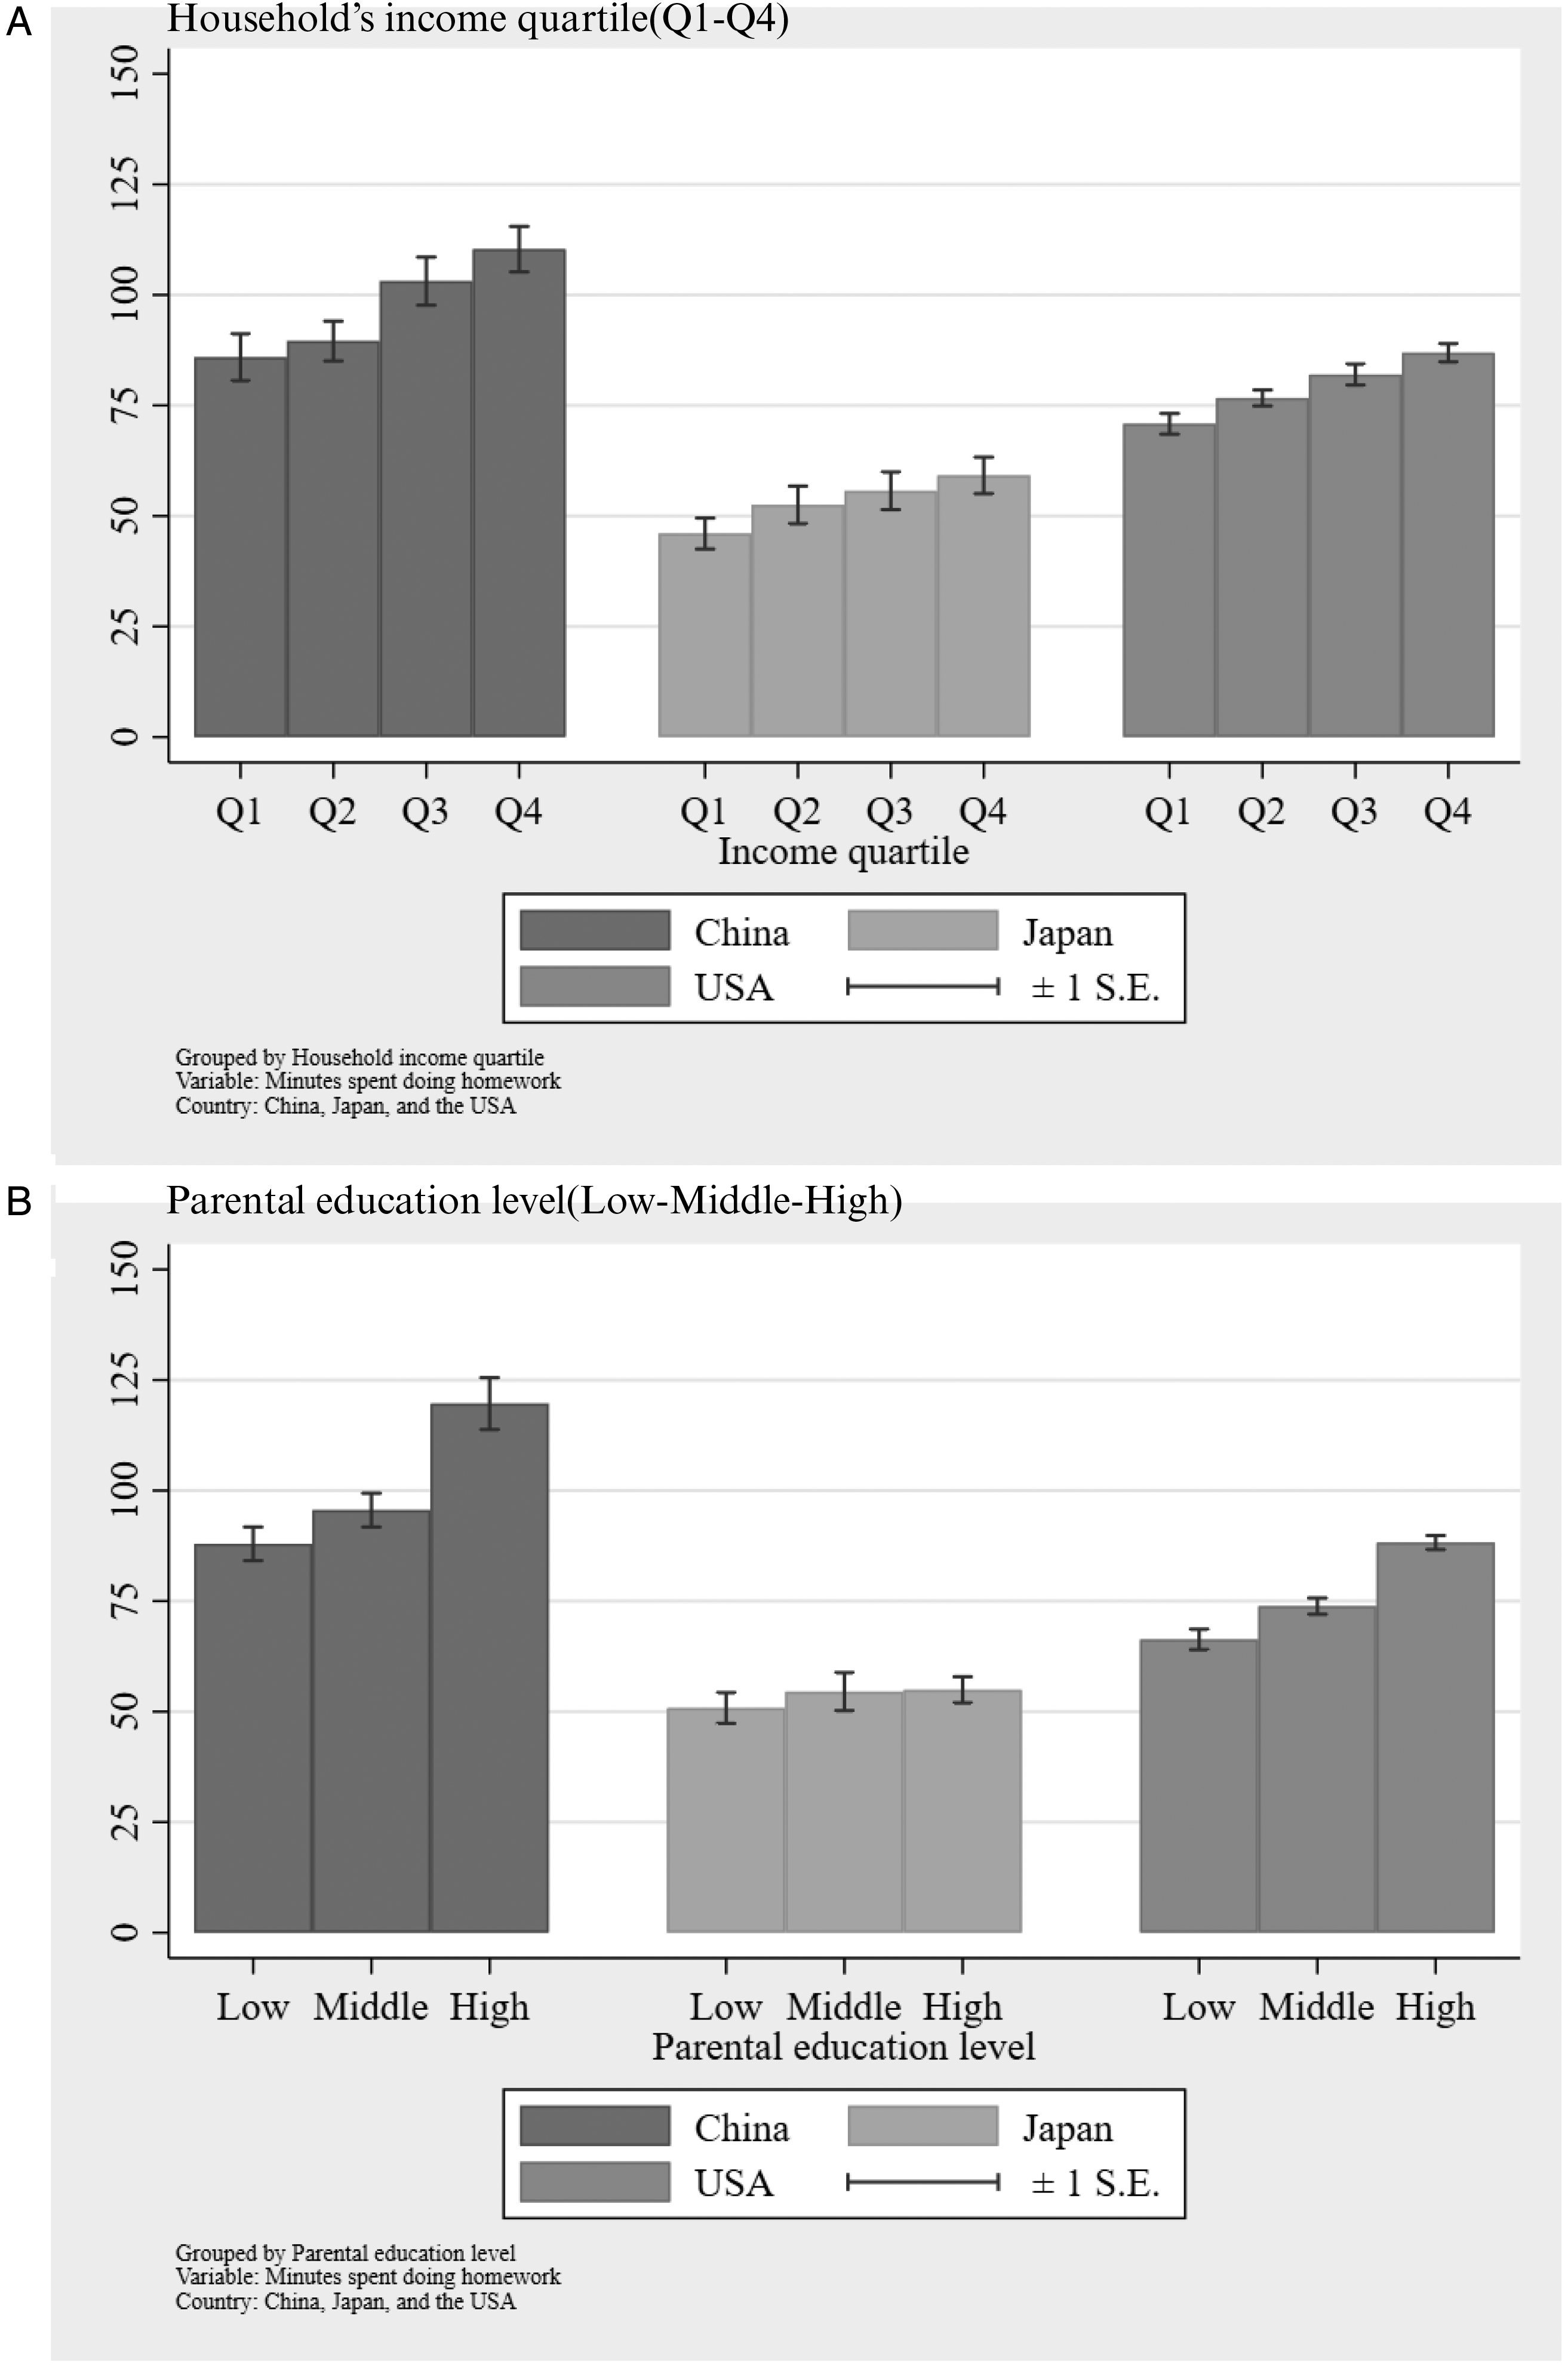
Estimated equation
This section describes the relationship between how children spend their time and parental SES. The basic estimated equation is as follows, and an estimation by the ordinary least squares regression (OLS) method was performed.

Second, we regressed the child’s outcome, IRT scaled test score, on the family SES and child’s demographic variables:

Estimation results
Results of regression analysis of child’s time use.
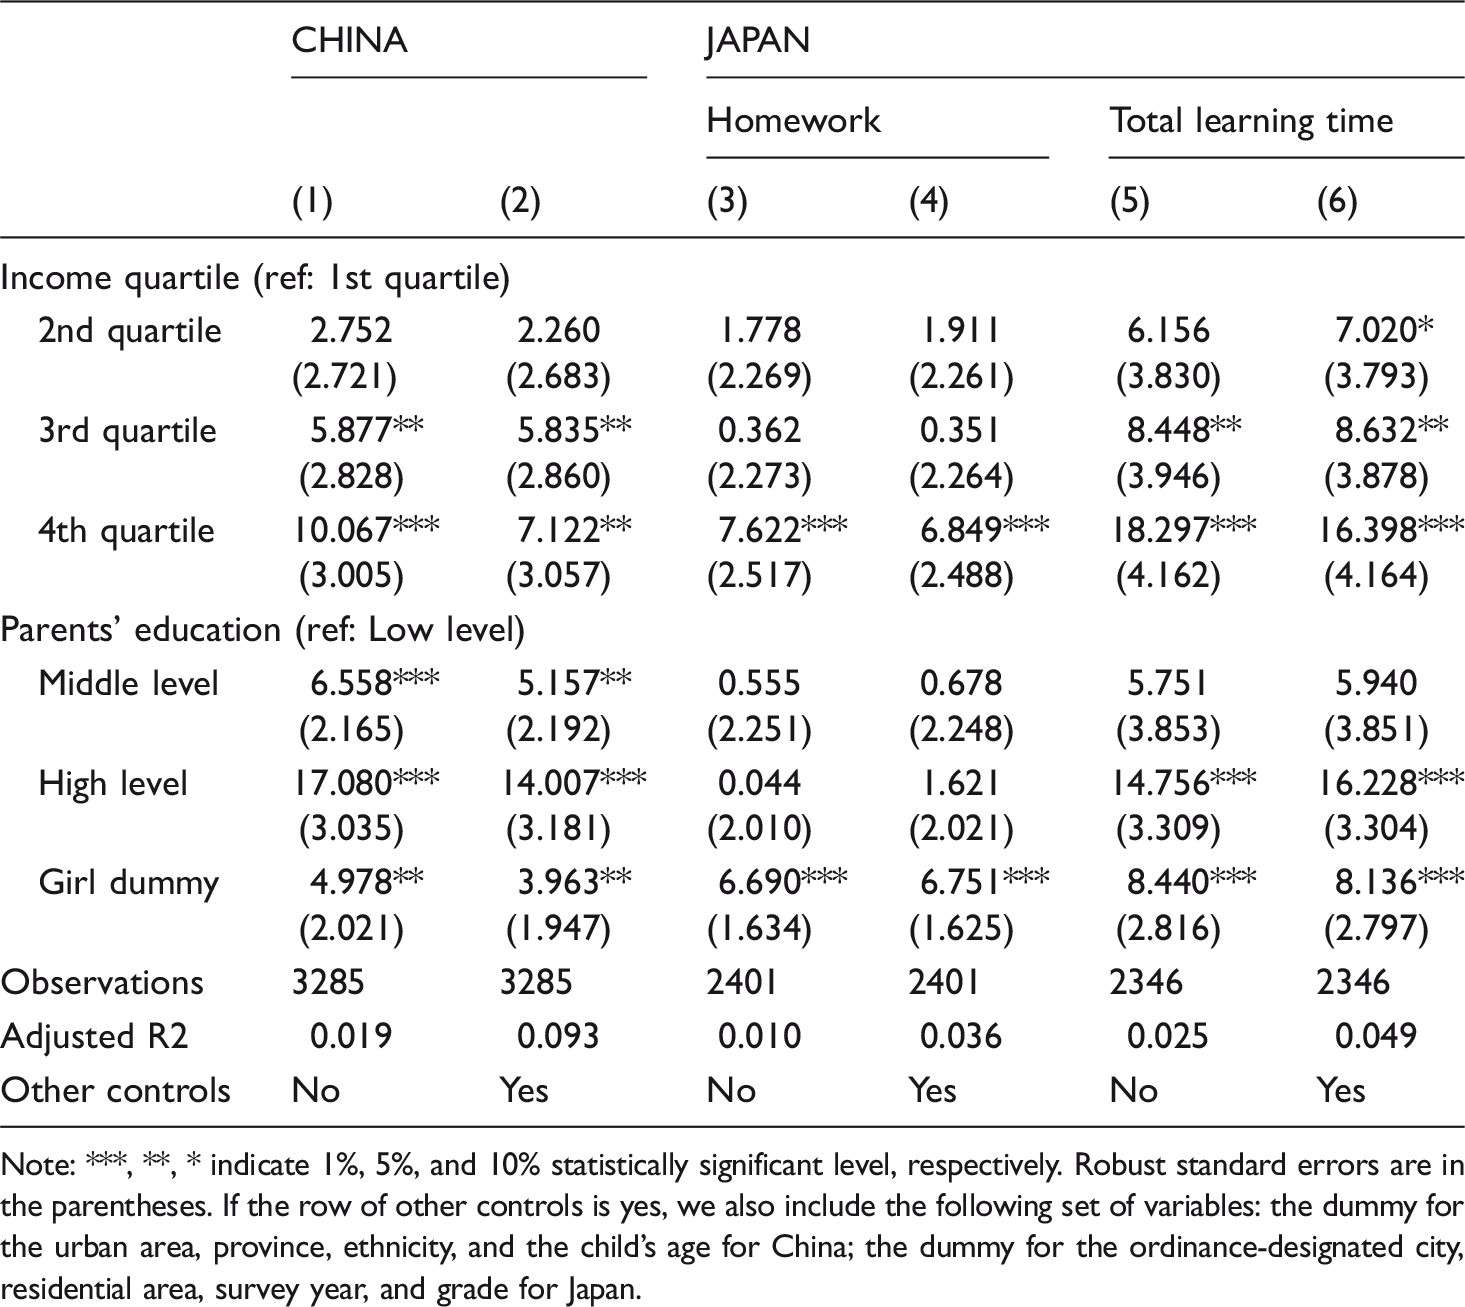
Note: ***, **, * indicate 1%, 5%, and 10% statistically significant level, respectively. Robust standard errors are in the parentheses. If the row of other controls is yes, we also include the following set of variables: the dummy for the urban area, province, ethnicity, and the child's age for China; the dummy for the ordinance-designated city, residential area, survey year, and grade for Japan.
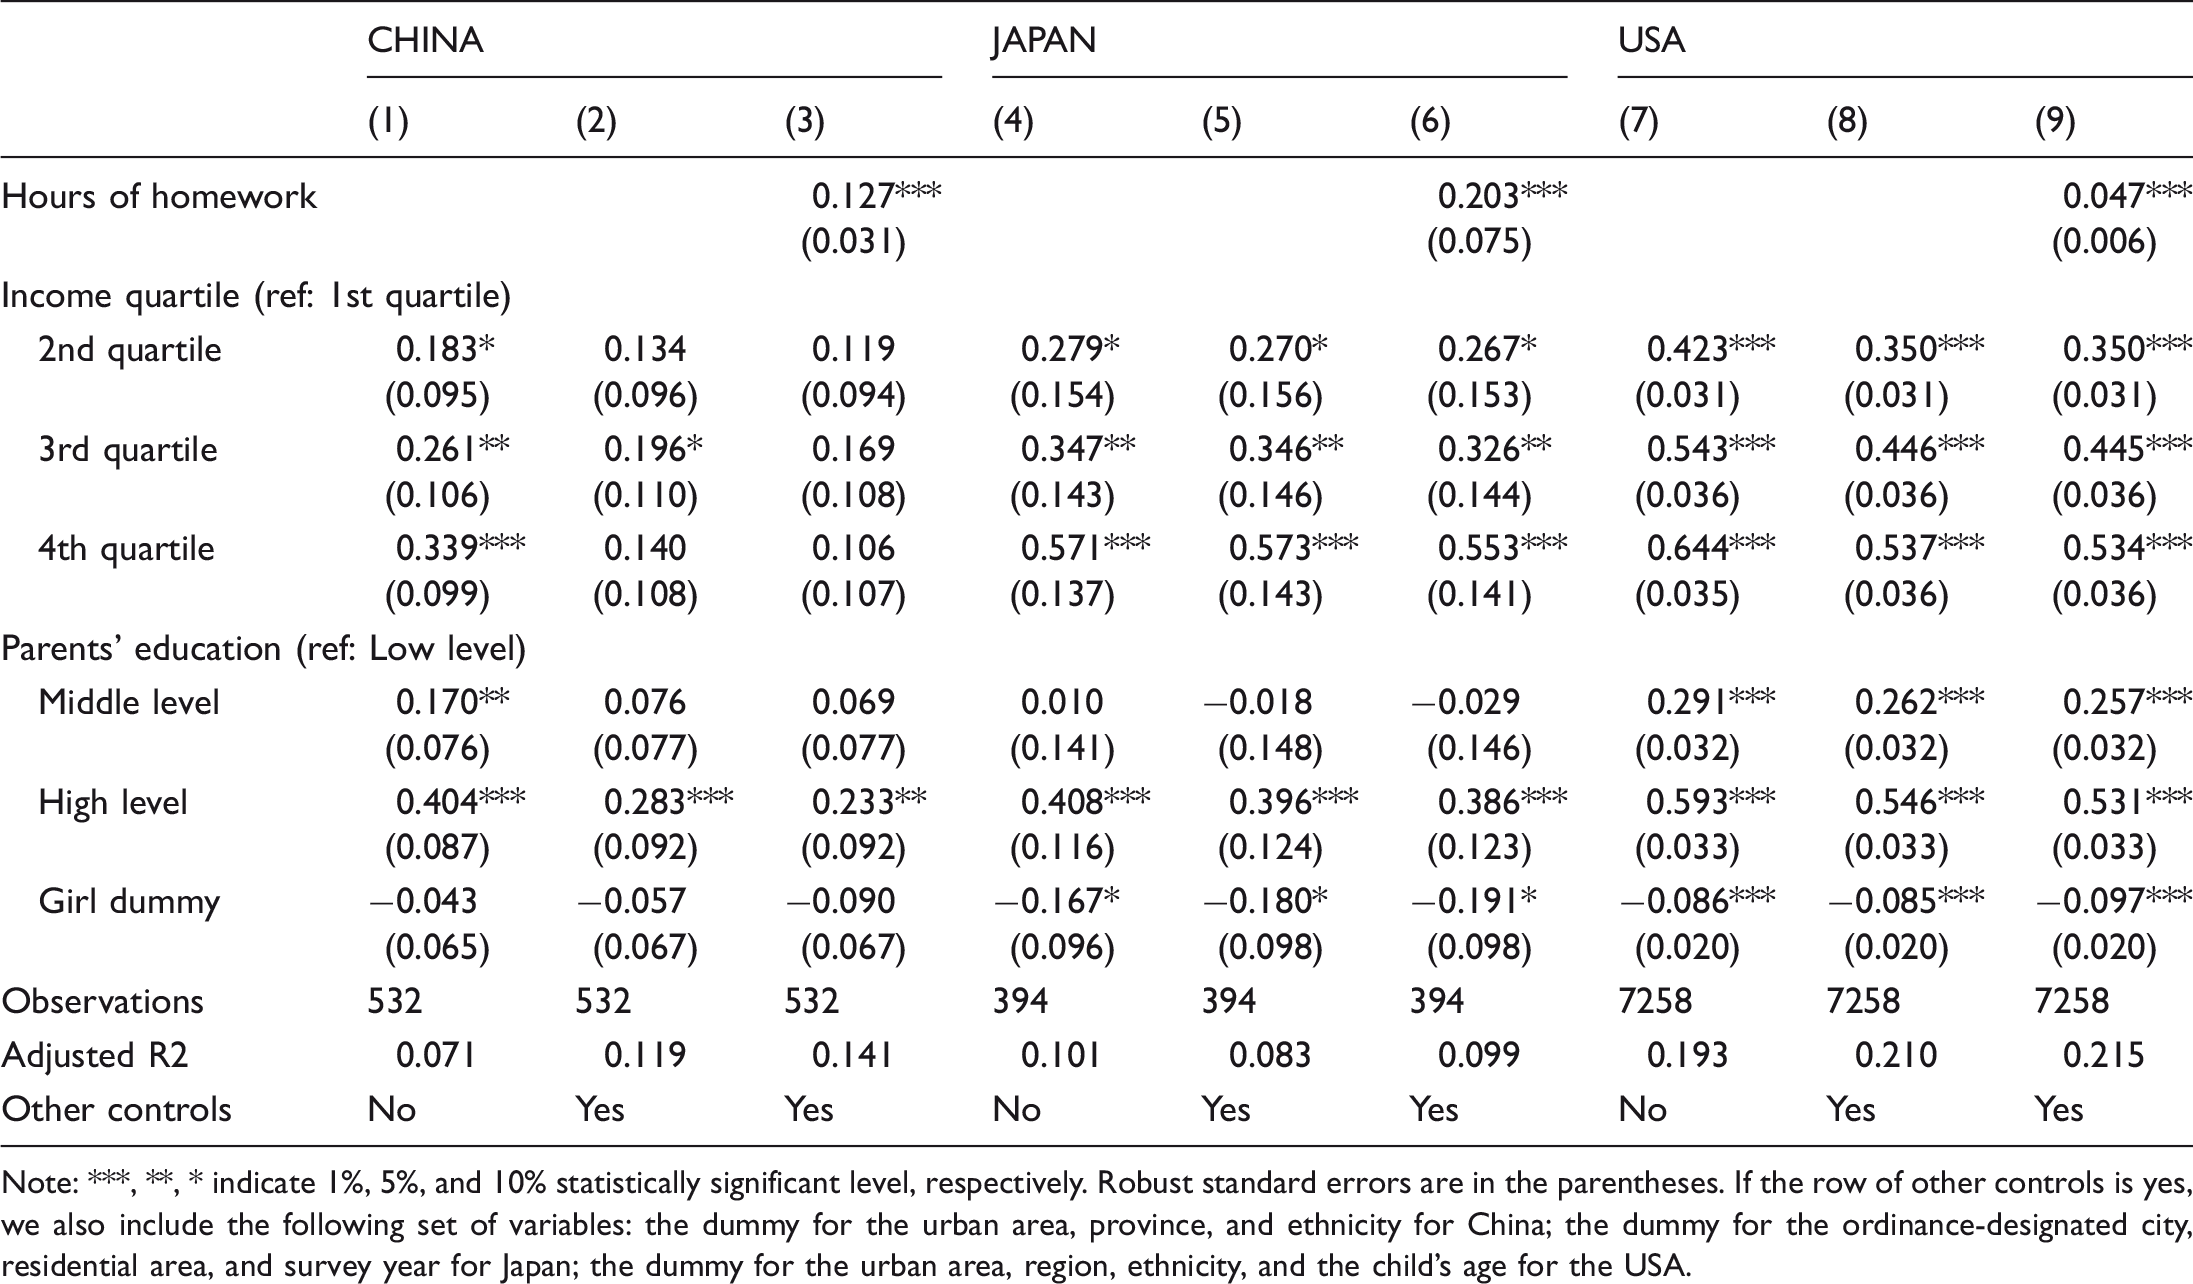
In columns 2 and 4 of Table 3, income quartiles are used to confirm how the effect of income changes. The general findings about the effects of income did not differ between China and Japan. For example, children in the fourth income quartile spent significantly more time doing homework than children in the first income quartile by about seven minutes per day. On the other hand, the total learning time of Japanese children was largely affected by household income (see column 6 of Table 3). This could be because total learning time includes time spent in cram schools—juku in Japanese—which ask parents to pay additional fees.
The effects of parental education background differed between the two countries. In the CFPS, parents’ educational level had a significant positive impact on time spent doing homework. If one of the parents had a high-level educational background, their child dedicated more time to doing homework by 14 minutes than did the child whose parents had low levels of education. In the JCPS, however, parental education background did not have any significant impact, and the size of coefficients was smaller than that of the effect of income quartile. This suggests that the value of study effort outside school is shared among children and encouraged by parents and school teachers more commonly across different income groups in China than in Japan. It may also be because there are fewer paid educational services in China than in Japan. It should be possible, to some extent, to disentangle these demand-supply causes if we had additional information about the regional prevalence of cram schools.
Along with homework time, we also confirmed the effect of parents' education on the minutes of total learning time of children in column 6 of Table 3. We found a significant and positive impact of parental education on the child's time use. This suggests that highly educated parents were more invested in their children through extracurricular activities.
Results of regression analysis of math test scores.
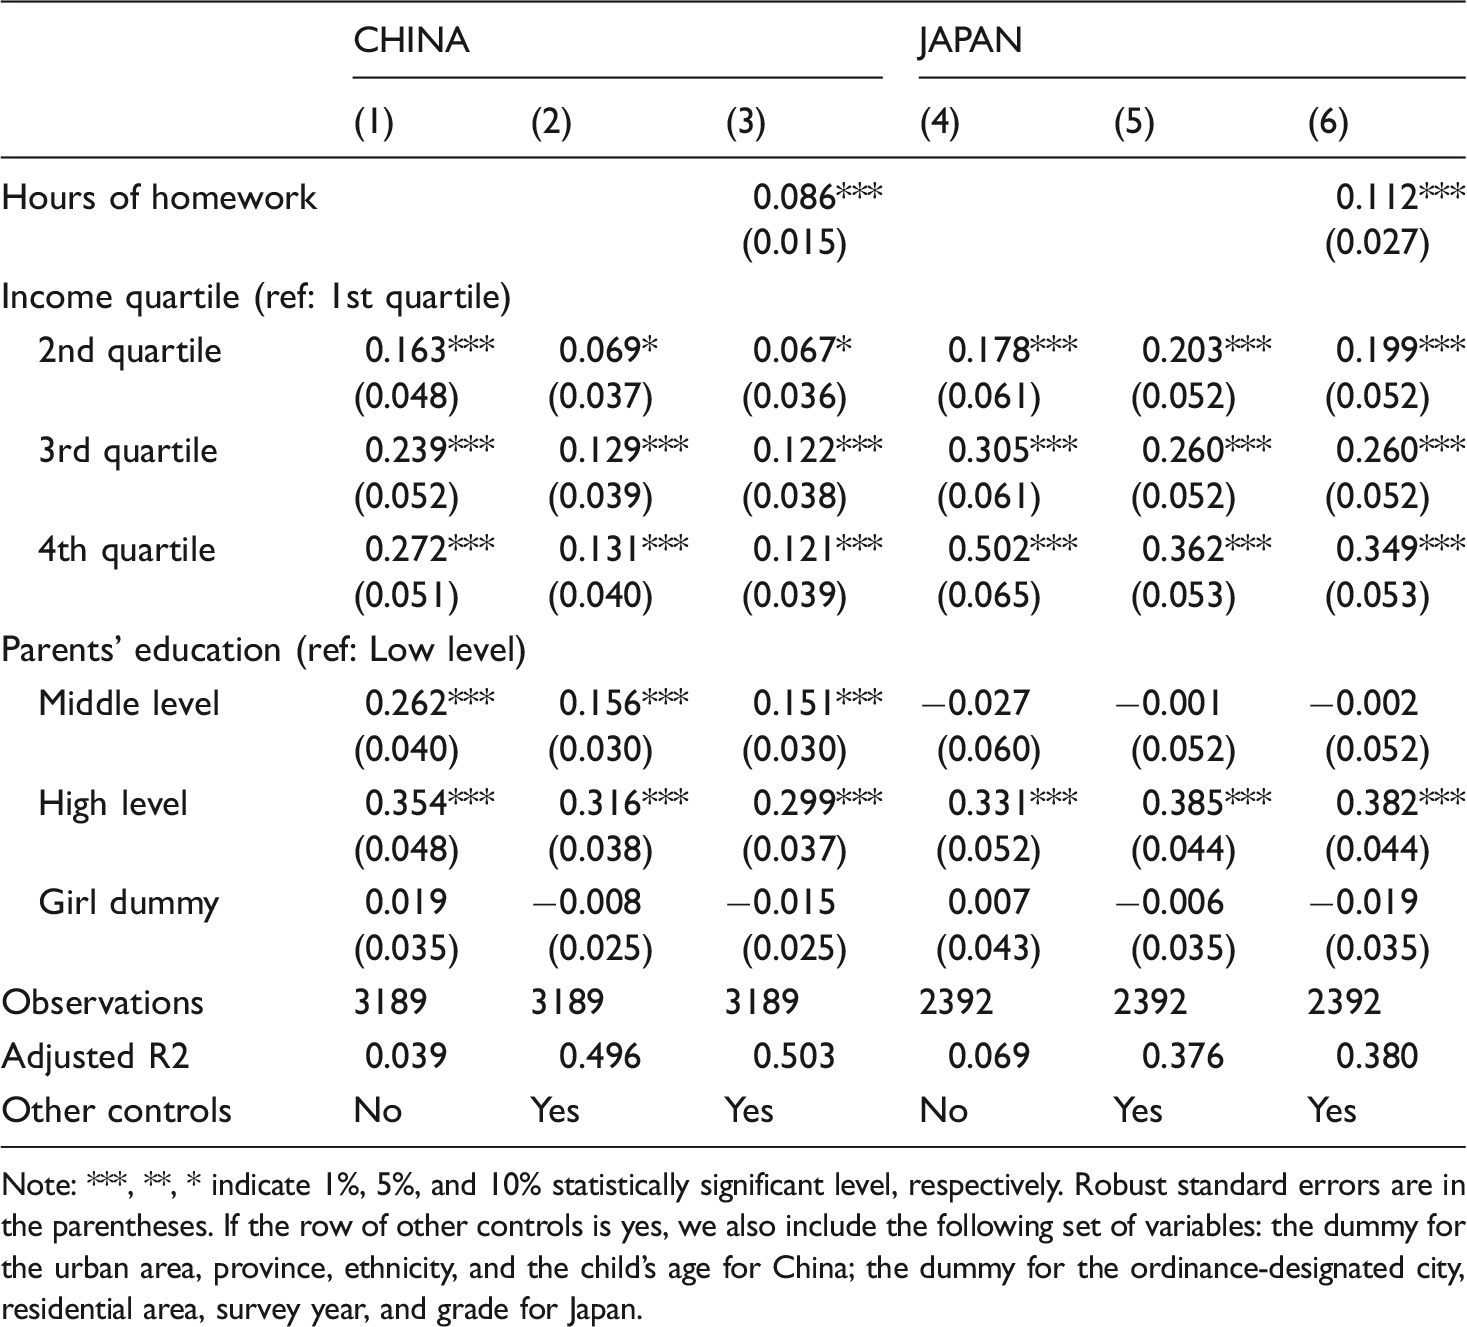
Note: ***, **, * indicate 1%, 5%, and 10% statistically significant level, respectively. Robust standard errors are in the parentheses. If the row of other controls is yes, we also include the following set of variables: the dummy for the urban area, province, ethnicity, and the child's age for China; the dummy for the ordinance-designated city, residential area, survey year, and grade for Japan.
Results of regression analysis of word test scores.
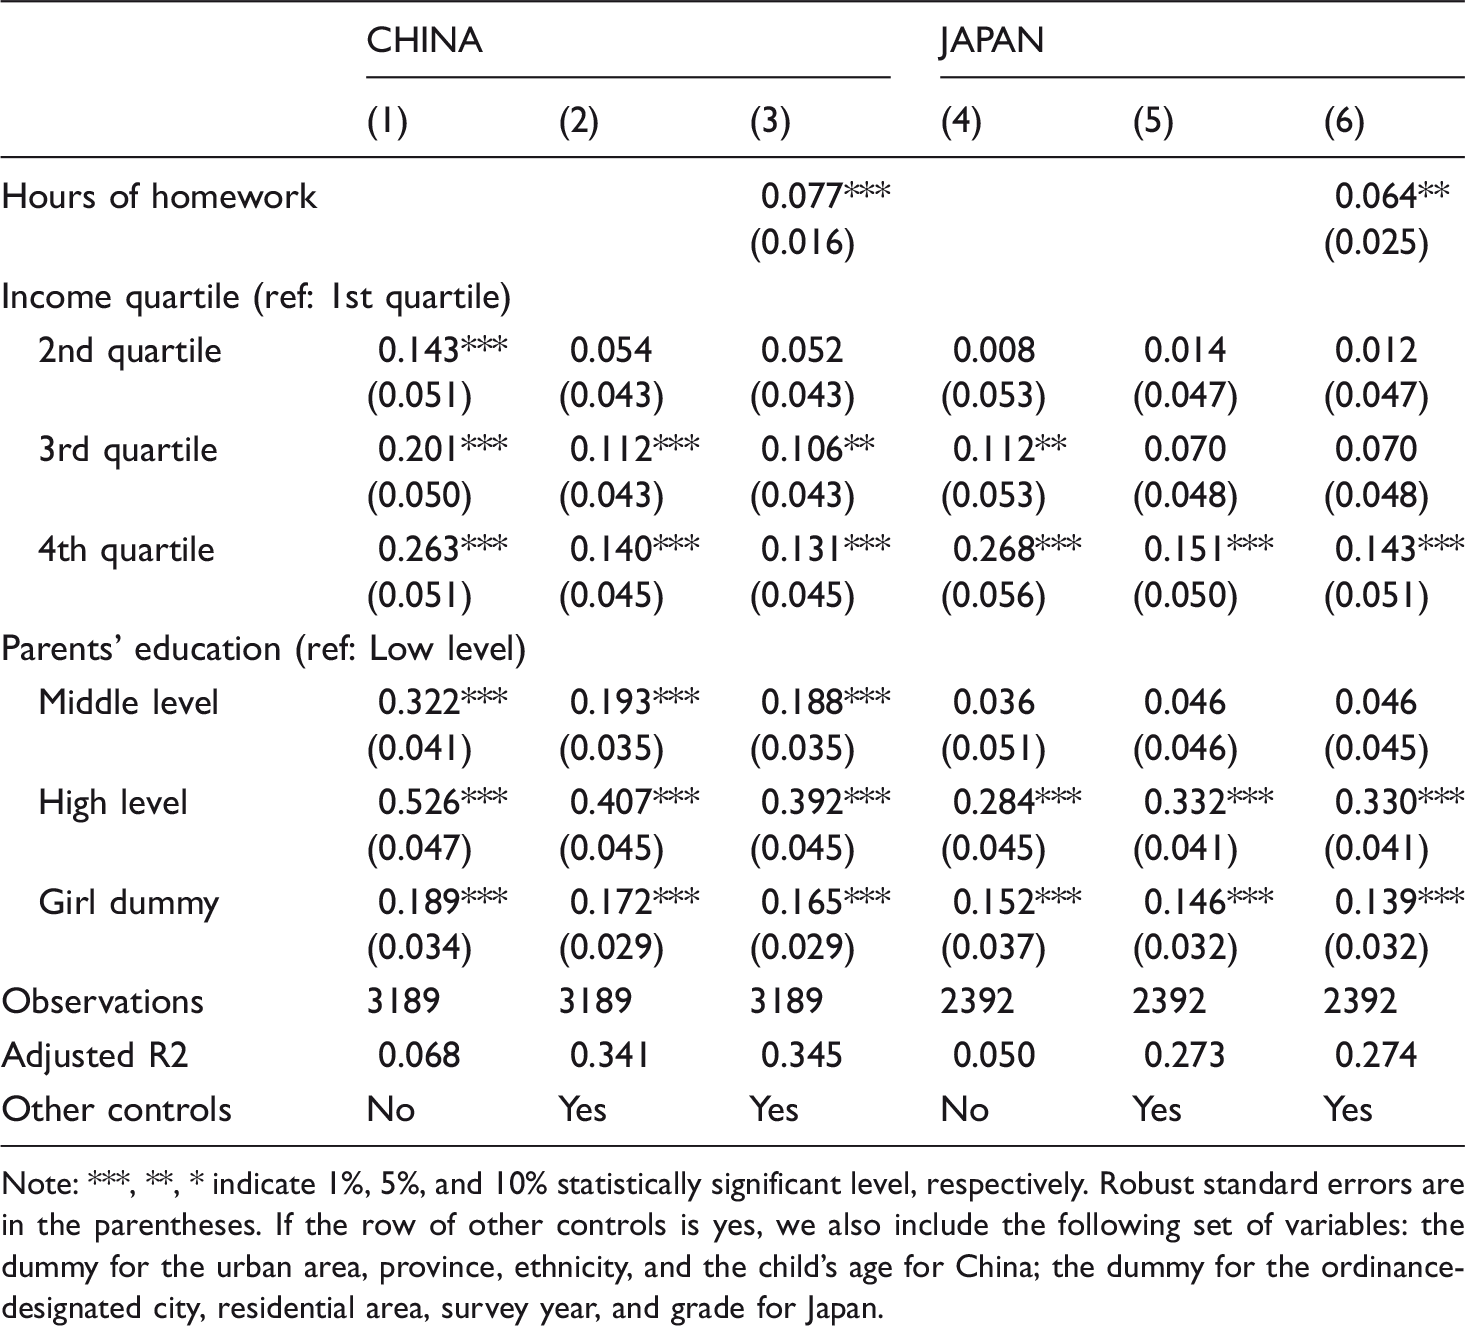
Note: ***, **, * indicate 1%, 5%, and 10% statistically significant level, respectively. Robust standard errors are in the parentheses. If the row of other controls is yes, we also include the following set of variables: the dummy for the urban area, province, ethnicity, and the child's age for China; the dummy for the ordinance-designated city, residential area, survey year, and grade for Japan.
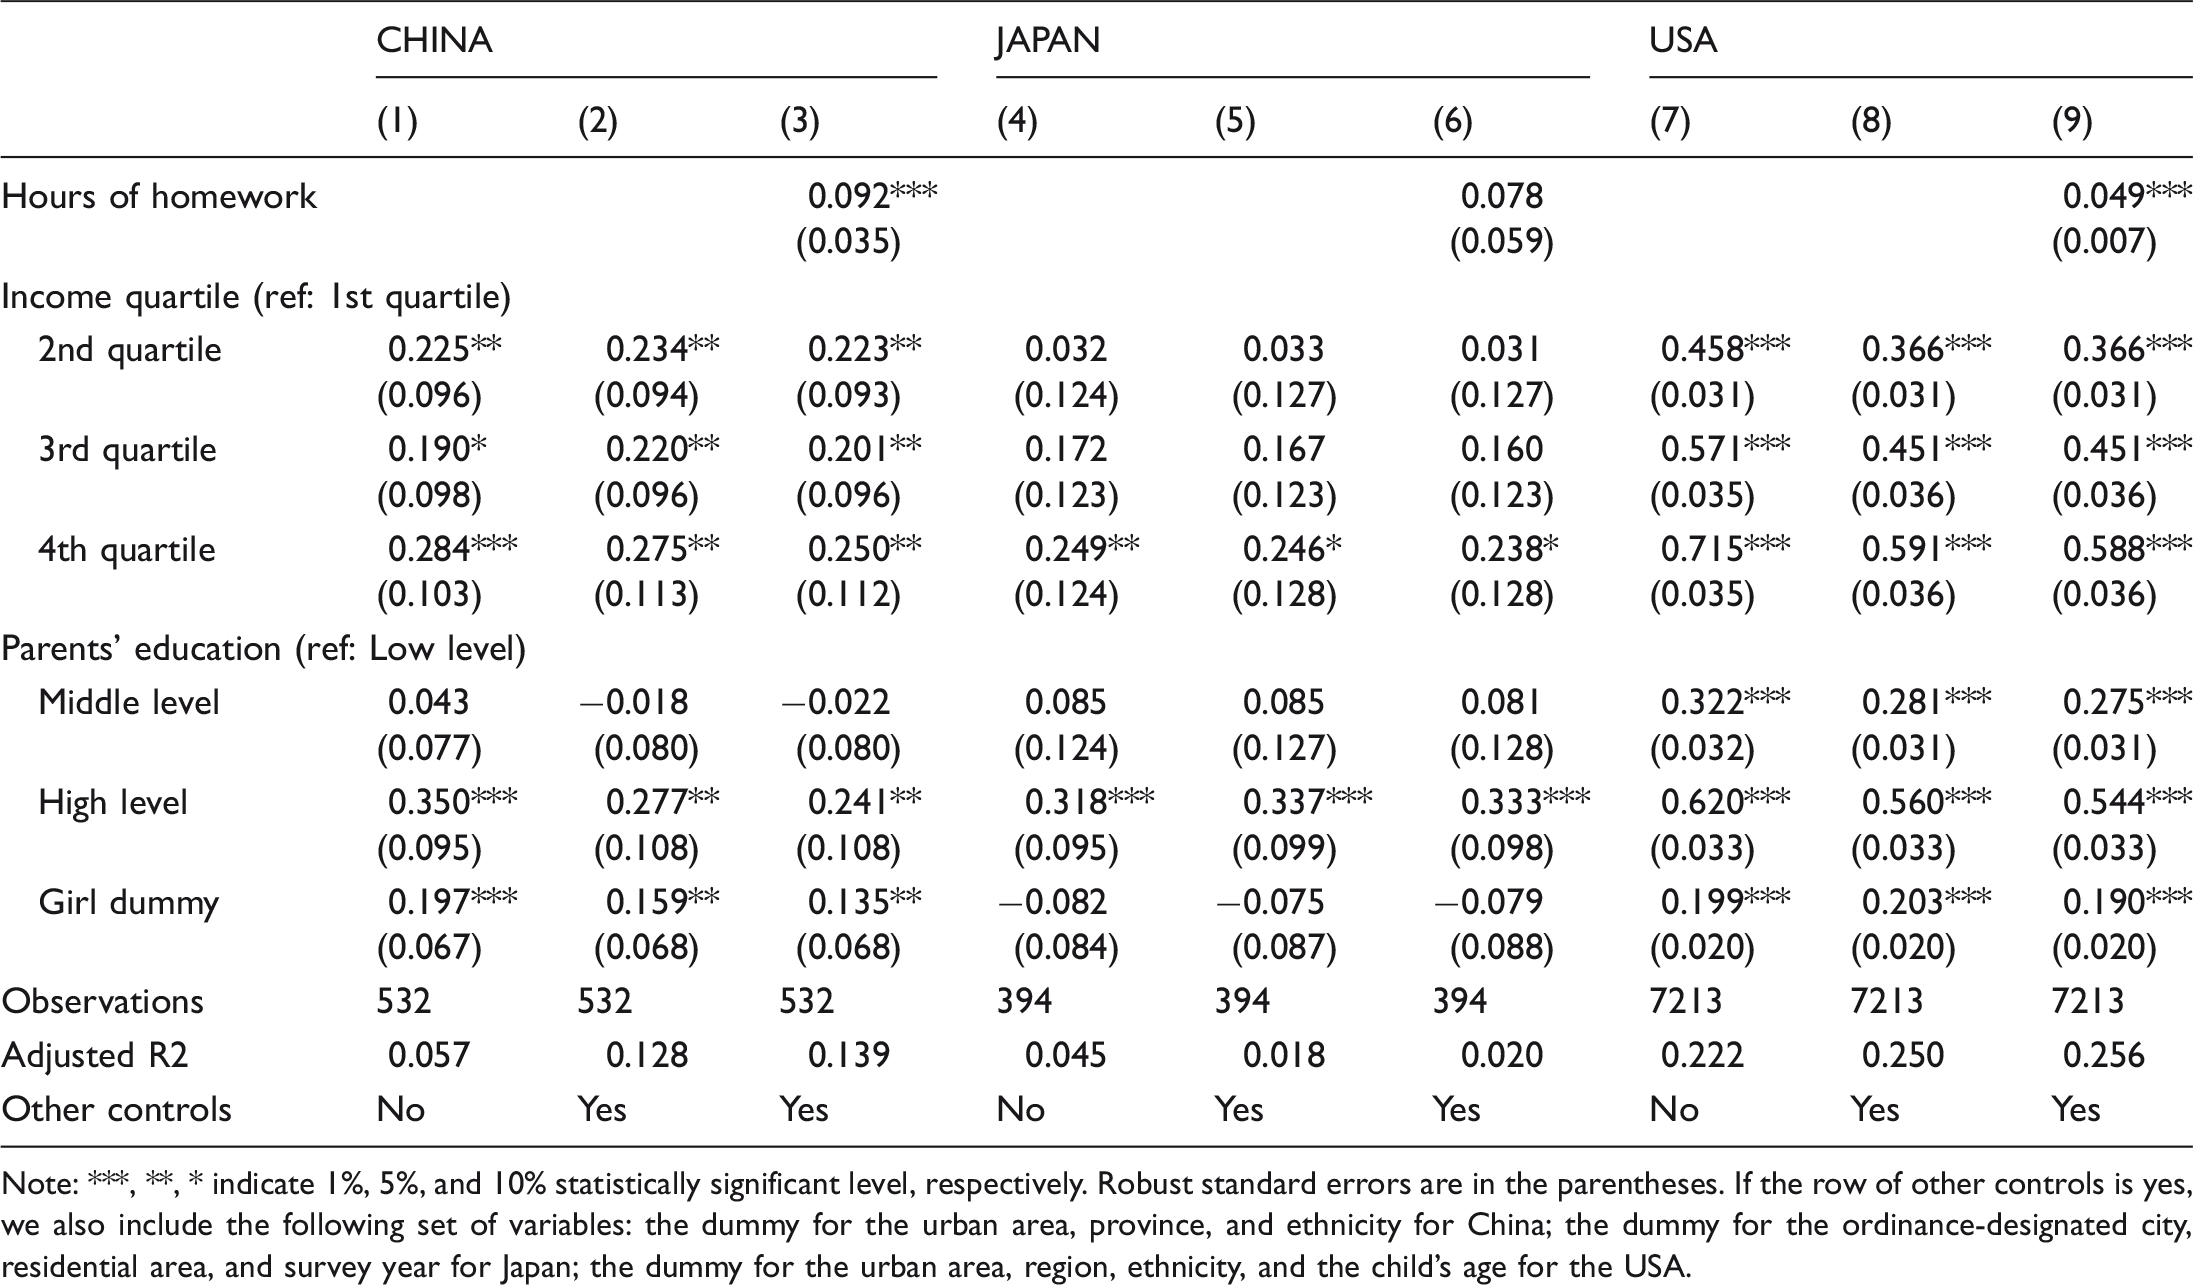
In Table 4, we found that almost all variables for socioeconomic status had significantly positive effects on a math test score in both countries. This result is in line with previous studies which only employ JCPS data (Nakamura et.al., 2016: 59–82). In columns 3 and 6, we added the hours spent doing homework to our estimation equation. The coefficients of hours spent doing homework showed a significant and positive impact on the score, but the magnitude of the coefficient is smaller than that of socioeconomic indices. This means that the inclusion of hours of study at home attenuated the effects of socioeconomic status on the score; however, the size of the decrease of the coefficients of socioeconomic variables was limited. There were no differences in test scores between girls and boys.
Table 5 shows the results of the word test scores, which raise three interesting points. 10 First, the effects of income on the word test scores were becoming smaller, especially in Japan, when we compared them with the results from Table 4. Second, in the case of China, parental education, particularly high-level education, had more significant effects on word test scores than on math test scores. Third, girls tended to achieve significantly higher scores than boys in both countries.
We shall compare the relationships among child's time use, their cognitive ability, and household's socioeconomic status in three countries: China, Japan, and the USA. To clarify and analyze these links, we additionally used the ECLS-K for the USA, although the targets of the ECLS-K were eighth graders in 2007, which includes children of various ages. Therefore, we added the child's age in our analysis of the USA. To use only children who have similar attributes, we restricted observations to 14-year-old children in the Chinese data and eighth graders in the Japanese data.
Results of regression analysis of child’s time use for eighth graders (14 years old).
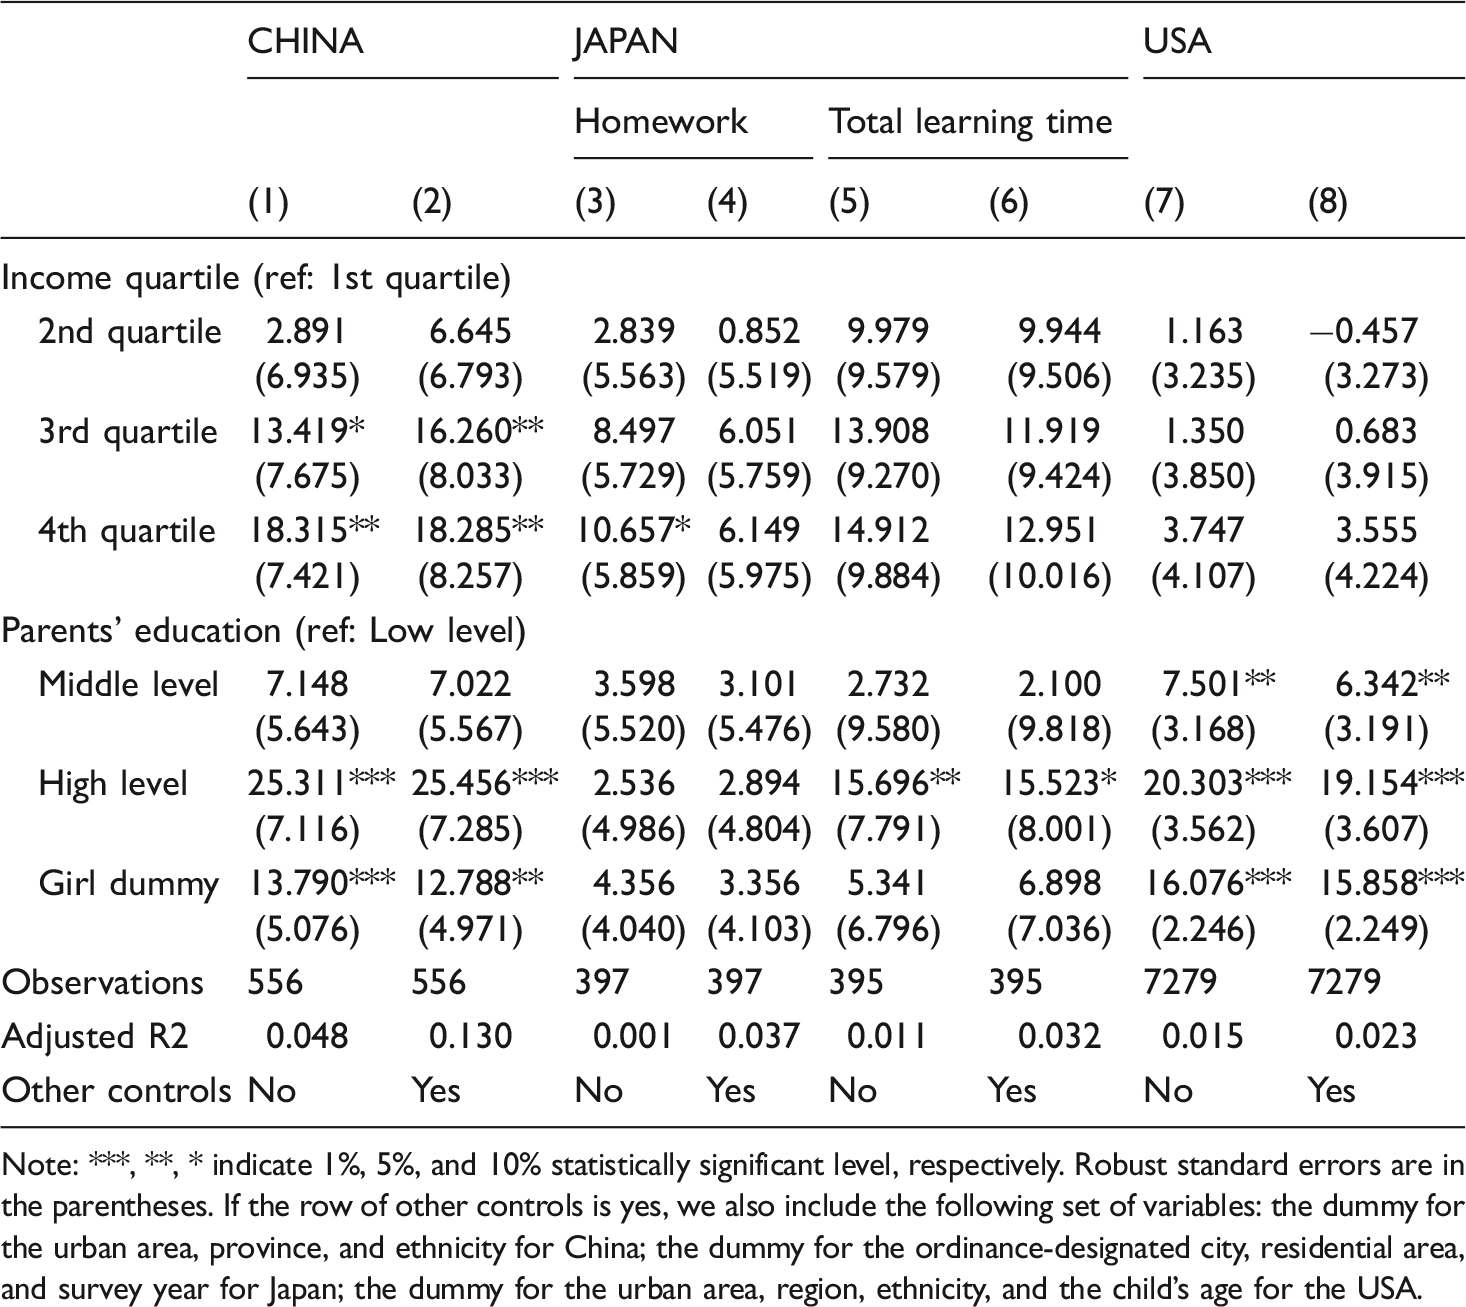
Note: ***, **, * indicate 1%, 5%, and 10% statistically significant level, respectively. Robust standard errors are in the parentheses. If the row of other controls is yes, we also include the following set of variables: the dummy for the urban area, province, and ethnicity for China; the dummy for the ordinance-designated city, residential area, and survey year for Japan; the dummy for the urban area, region, ethnicity, and the child's age for the USA.
Results of regression analysis of math test scores for eighth graders (14 years old).
Note: ***, **, * indicate 1%, 5%, and 10% statistically significant level, respectively. Robust standard errors are in the parentheses. If the row of other controls is yes, we also include the following set of variables: the dummy for the urban area, province, and ethnicity for China; the dummy for the ordinance-designated city, residential area, and survey year for Japan; the dummy for the urban area, region, ethnicity, and the child's age for the USA.
Results of regression analysis of word test scores for eighth graders (14 years old).
Note: ***, **, * indicate 1%, 5%, and 10% statistically significant level, respectively. Robust standard errors are in the parentheses. If the row of other controls is yes, we also include the following set of variables: the dummy for the urban area, province, and ethnicity for China; the dummy for the ordinance-designated city, residential area, and survey year for Japan; the dummy for the urban area, region, ethnicity, and the child's age for the USA.
We shall interpret the sizes of correlations between homework time and academic achievement based on the results from Tables 7 and 8. As we mentioned before, homework time positively and significantly correlated with math test score in the three countries. We calculated the hours of homework required to overcome the differences in test scores between the first and fourth income quartiles. These figures may show how much time children need to invest in homework to clear the financial hurdles. It should be noted that these calculations are based on specific assumptions: the effects of hours of homework are the same among children from different socioeconomic backgrounds. In Japan, Table 7 shows that an increment of one hour in homework time increases the math test score by 0.203, and the coefficient of the fourth income quartile dummy is 0.553. The ratio of the coefficient of the fourth income quartile dummy to that of homework time means that an increment of 2.7 hours of homework time per day was needed to overcome the gap in math test scores between the first and fourth income quartiles. In the case of the USA, however, this ratio was 11.3, which meant 11.3 hours of homework per day was needed to overcome the gap in math test scores between the lowest and the highest income groups. 11 On the other hand, we calculated the same ratio based on the results of the word test score, and the ratios were 2.7 and 12 in China and the USA, respectively. These figures show that children in the USA need to spend more time on homework than Chinese children do to clear the economic hurdle. 12
Conclusions
Comparing nationally representative data for China, Japan, and the USA, we attempted to investigate the following three research questions. First, regarding the relationship between parental SES (household income and parental education level) and children’s time spent on homework, our results show that both parents’ SES have significantly positive effects on homework time in China among children aged 10–15. However, only household income has significant positive effects on homework time in Japan among children aged 10–15; and parental education level has a significant positive effect on the homework time of 14-year-old children in the USA. In Japan, instead of homework time, total learning time—including time spent in cram school (juku)—is significantly and positively associated with both parents’ SES among children aged 10–15. This is because the Japanese education system has features of centralization of the Ministry of Education, which controls curriculum, school administration, and educational content in textbooks (see LeTendre, 2002: 19–32), and school homework is also homogenized in Japan. Therefore, differences in parental SES may be detected in the ‘total learning time’ that includes hours of studying in cram school, but not homework time. 13
Second, concerning the relationship between parental SES and academic achievement, both parents’ SES significantly improved children’s math and word test scores among children aged 10–15 in China. In Japan, both parents’ SES have significantly positive effects on scores for both tests but are limited on word test scores. Regarding 14-year-old children from the USA, both parents’ SES have strongly positive effects on both test scores. Moreover, as mentioned in the empirical analysis section, children age 14 would need to spend an additional 11.3 hours per day on homework in the USA (0.8 hours in China and 2.7 hours in Japan are needed, respectively) to fill a gap between the first and fourth income quartiles. These results imply that in the USA, parental SES influences school choices, which affects teacher and homework quality. Therefore, many additional homework hours are needed. It is suggested that as students advance through the grades, the learning time required to close the educational gap due to economic disparity increases, and thus, it is no longer possible to fill the gap through individual effort. In China, both parents’ SES strongly impact children's homework time and test scores, but child labor limits learning time depending on residential areas (Tang, Zhao and Zhao, 2018). Hence, parents’ SES may strongly influence the child.
Finally, homework time has significant positive effects on math test scores in all three countries at 14 years old, which is consistent with some previous research (Aksoy and Link, 2000; Eren and Henderson, 2008, 2011). On the other hand, there is no significant relationship between homework time and word test scores in 14-year-old children in Japan. Overall, our empirical results suggest that children’s time use, which varies by family background and reflects the class gap in parenting practices, is an important mechanism resulting in differential academic achievements among different social contexts, although the effect is greater in East Asian countries.
Footnotes
Acknowledgements
We would like to thank the Institute of Social Science Survey at Peking University, the Panel Data Research Center at Keio University, and the National Center for Education Statistics for providing their data. We also thank Airan Liu and Wangyang Li for preparing the data on China and the USA, respectively. We appreciate comments from Sachiko Kuroda, Hiroshi Ishida, Hyunjoon Park, James Raymo, and Yu Xie, and the participants of workshops at Peking University and Keio University, SLLS 2018 at the University of Milano-Bicocca, WEAI 2019 at Keio University and RC 28 at Princeton University. The contents related to the Japanese sections are partially based on our discussion paper: Nakamura R, Yamashita J and Akabayashi H (2019).
Declaration of conflicting interests
The author(s) declared no potential conflicts of interest with respect to the research, authorship, and/or publication of this article.
Funding
The author(s) disclosed receipt of the following financial support for the research, authorship, and/or publication of this article: This research was financially supported by JSPS KAKENHI Grant Numbers JP16H06323, JP24000003 and JP17H06086.