
Abstract
Keywords
Introduction
There are an estimated 3.3 million wheeled mobility users in the United States, many of whom use manual wheelchairs. 1 Upper limb (UL) pain and injury are common for manual wheelchair users (MWU),2,3 and clinical practice guidelines (CPG) provide recommendations for preserving UL function following spinal cord injury, including minimizing repetitive strain by minimizing both the frequency and force required for UL tasks, (e.g., wheelchair propulsion). 4 Rolling resistance (RR) is the force countering propulsion, and as RR increases, the force required to propel the wheelchair increases.5,6 RR is caused by energy loss at the wheel/surface interface, and varies based on load, tire or caster type, and surface.5–7 Considering that the average MWU propels 1 to 1.5 miles per day,8,9 the combined frequency and force from propulsion is a concern relative to CPGs. For all these reasons, the selection of wheelchair components should take into consideration their influence on RR to minimize repetitive strain and adhere to CPGs, with the goal of reducing the force of propulsion.
Rolling resistance test methods
System and component-level methods quantify RR using either direct measurement of force or indirect measurements such as coast down time or power production. System-level RR methods include drag, 10 deceleration, 11 cart,12,13 SmartWheel 14 or robotic system15,16 and are conducted either over-ground or on a treadmill. These methods measure RR indirectly (with time of deceleration for coast down, power output for SmartWheel or power consumption for robotic system). Component-level methods include direct force measurements with drum-based testing, 17 and tests that provide indirect component-level estimates by testing coast down using either four wheels (cart),12,18 or two wheels (dynamometer or ergometer).11,19,20 System-level testing can be used to evaluate MWU’s propulsion, biomechanical inputs and energy utilized in a wide range of environments, including outdoors and on ramps. 21 Each test method has different capabilities, benefits and limitations, which guides selection and rationale for use of different RR test methods.
Benefits of component-level Drum testing
Component-level drum-based testing (Drum) allow researchers to: 1) evaluate individual rear wheels, casters and other factors (such as camber, toe angle/rear wheel misalignment, surfaces, or tire pressure) and quantify their individual contribution to RR; 2) construct multiple system-level RR estimates to evaluate equipment tradeoffs for client characteristics and environment; 3) rapidly test to optimize products during product development; and 4) provide researchers RR when evaluating other performance characteristics, such as durability or vibration. The limitations of Drum testing include difficulty simulating some outdoor surfaces like grass or gravel, difficulty simulating the effect of MWU propulsion (both the cyclical forces from propulsion 22 and associated postural changes resulting in shifting weight distribution 23 ), and differences between RR on a curved drum versus flat surface.
Rationale for comparison to SmartWheel
The SmartWheel is an instrumented push rim for manual wheelchairs which quantifies propulsion forces by measuring push rim forces and moments in x, y and z directions, angular position via an encoder, and time using a sampling counter, wirelessly transmitting data (Figure 1)
24
(Three Rivers, Mesa, AZ). The SmartWheel has three beams which extend from push rim to hub, which measure these forces and moments. SmartWheel directly measures forces during propulsion and can be used over-ground on multiple surfaces and at different speeds, and the results are generalizable to real-world wheelchair propulsion (e.g., has ecological validity). SmartWheel data can be processed to calculate variables of interest, such as RR, propulsion torque, power, number of pushes, push length, speed, push frequency and resultant force (Fres).14,24–26 SmartWheel
24
(Image from SmartWheel user guide).
SmartWheel has quantified and correlated peak forces, biomechanics, and equipment set-up with UL injury, 27 and measured RR, 14 with findings that: a) increased weight and height of MWUs are correlated to higher peak force and greater median nerve pathology22,27; b) forward axle position reduces the rate of push rim loading (rate of rise), reducing risk of injury to median nerve22,28; and c) propelling with a greater percentage of force on the push rim or rapid loading of force leads to increased risk of progression of magnetic resonance imaging findings related to UL injury.27,29 Because of these benefits, the SmartWheel may be considered a gold-standard for evaluating propulsion and was used as a clinical decision support system to guide wheelchair setup and training in wheelchair clinics before the product was discontinued.26,30 For these reasons, SmartWheel was selected as the comparison test method for the next step in validating consistency and accuracy of the Drum RR test.
Previous validation of Drum RR testing
Our previous validation study compared RR estimates generated by Drum to treadmill drag test estimates (for a range of rear wheels, casters, load and load distribution), and found excellent consistency (intraclass correlation coefficient (ICC) = 0.94, 95% confidence interval (CI) [0.91 to 0.95]) and accuracy-based Bland Altman (BA) limits of agreement (LOA) [−2.5 to 0.8 N (N)]. Drum RR estimates were 1.1 N lower than system-level RR. 31 BA plots by factor (load, load distribution, rear wheel size/type, caster size/type) did not show bias for the difference between methods. Mean differences for two of six factors (front-rear load distribution, caster diameter) were statistically significant (p < .001) whereas other factors (user weight, caster type, rear wheel type and diameter) were not. Although a first step in establishing validity of this test method, further work is needed to evaluate and validate Drum RR testing versus over-ground propulsion testing and across other rear wheel and caster equipment and/or set-up conditions.
Study goals
The objective is to assess the external validity of the Drum RR measurement approach. The specific aims are to evaluate accuracy and consistency of Drum RR to predict over-ground and treadmill RR and resultant force (Fres) as measured by the SmartWheel. We hypothesize that Drum RR test results will 1) accurately predict SmartWheel RR based on BA LOA and with excellent reliability and consistently based on ICC 95% CI > 0.9 32 ; and 2) accurately predict Fres based on coefficient of determination R2 > 0.7, confirm relationship is not due to chance based on F-ratio significance (p < .05), and with good reliability and consistently based on ICC 95% CI >0.75.
Methods
SmartWheel testing
SmartWheel testing was completed with four equipment configurations on four surfaces at two speeds (0.5 and 1.0 m/s). The surfaces included three over-ground surfaces (indoor carpet, outdoor brick, indoor tile) and a treadmill with a small incline (Max Mobility LLC, Antioch, TN). The four equipment configurations had 24″ diameter by 1″ width rear wheels (Primo V-track 110 psi, Shox solid polyurethane) and 4″ diameter Tilite casters (4″ x 1.5″ soft roll, 4″ x 0.75″ polyurethane), tested in the following equipment configurations: 1 = pneumatic with soft roll caster; 2 = pneumatic with polyurethane caster; 3 = solid polyurethane with soft roll caster; 4 = solid polyurethane with polyurethane caster.
A Quickie GP box frame wheelchair with fixed rear wheel position (rear wheels in the most rearward position), swing away footrests, seat dump of approximately 0.5 to 1.0 inches, a 2 inch foam cushion, and no seat height adjustment was used for testing. The average wheelchair weight was 34.9 to 36.3 pounds (lbs.) (which included one SmartWheel and one standard wheel), depending on equipment configuration. Weight distribution anterior/posterior was measured for each wheelchair configuration for each participant using one scale under each wheel and summing the weights for anterior and posterior. SmartWheel measures data at 240 Hz (Hz), which is saved in comma separated value (CSV) file format.
Number of trials
Participant information and number of equipment configurations.
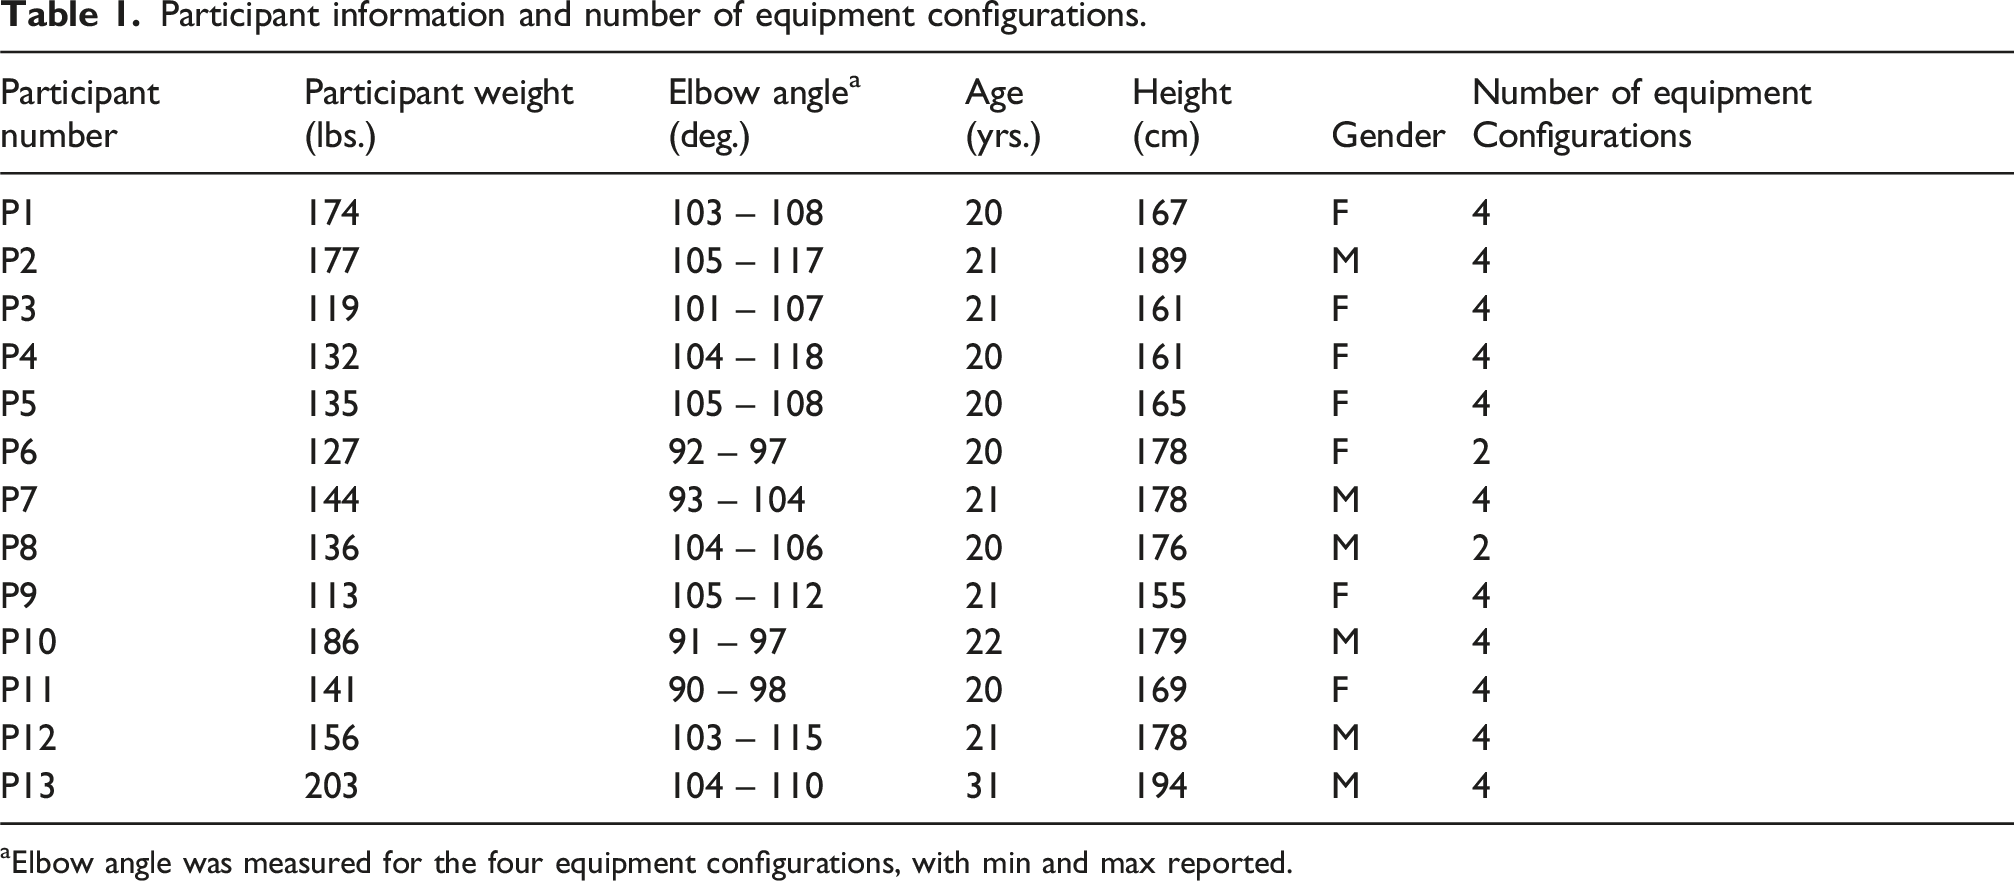
aElbow angle was measured for the four equipment configurations, with min and max reported.
Number of SmartWheel trials for each equipment configuration.
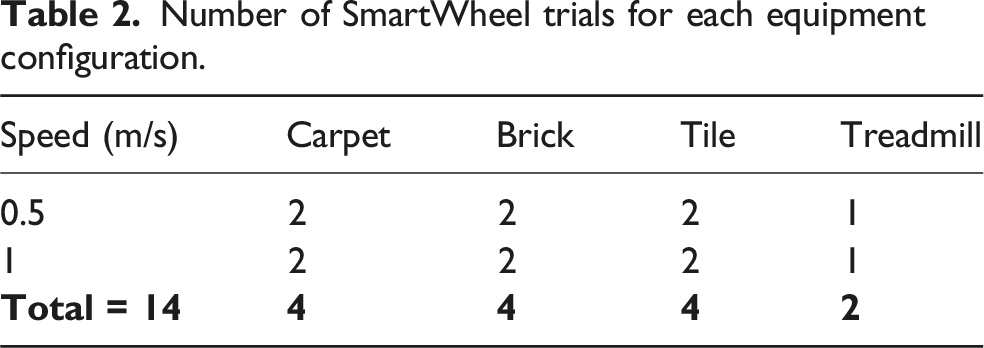
Equipment configuration test order was designed to minimize tire changes with the SmartWheel. One tire type was used on the first day of testing, with the order of the two caster options alternated between participants. On the second day of testing, the tire was switched, and the casters sequence of tests were re-run for the participants. Participant details are summarized in Table 1. Two participants could not return for the second day of testing. The sequence of surfaces was fixed. The only coaching provided was to push on the push rim, there was no coaching on propulsion style or recovery patterns. In total, 11 participants completed 56 trials and 2 participants completed 28 trials, for 672 total trials (576 over-ground and 96 on treadmill).
Drum RR testing
The Drum RR test utilizes a 4-foot rotating drum, and directly measures the RR for individual rear wheels, casters, and factors (Figure 2).17,31,33 The wheel or caster is mounted on the air bearings and positioned with the axle hub centered at the top of the drum. While the drum is rotating, the wheel or caster is held in place on top of the drum with a one-pound backload. The drum rotates and RR forces are measured using a primary load cell, and backload measured by a secondary load cell, and level of the air bearings measured using a Digi-pass 2-axis machinist digital level to measure residual load.
31
Testing was conducted at the University of Pittsburgh. Drum RR test equipment.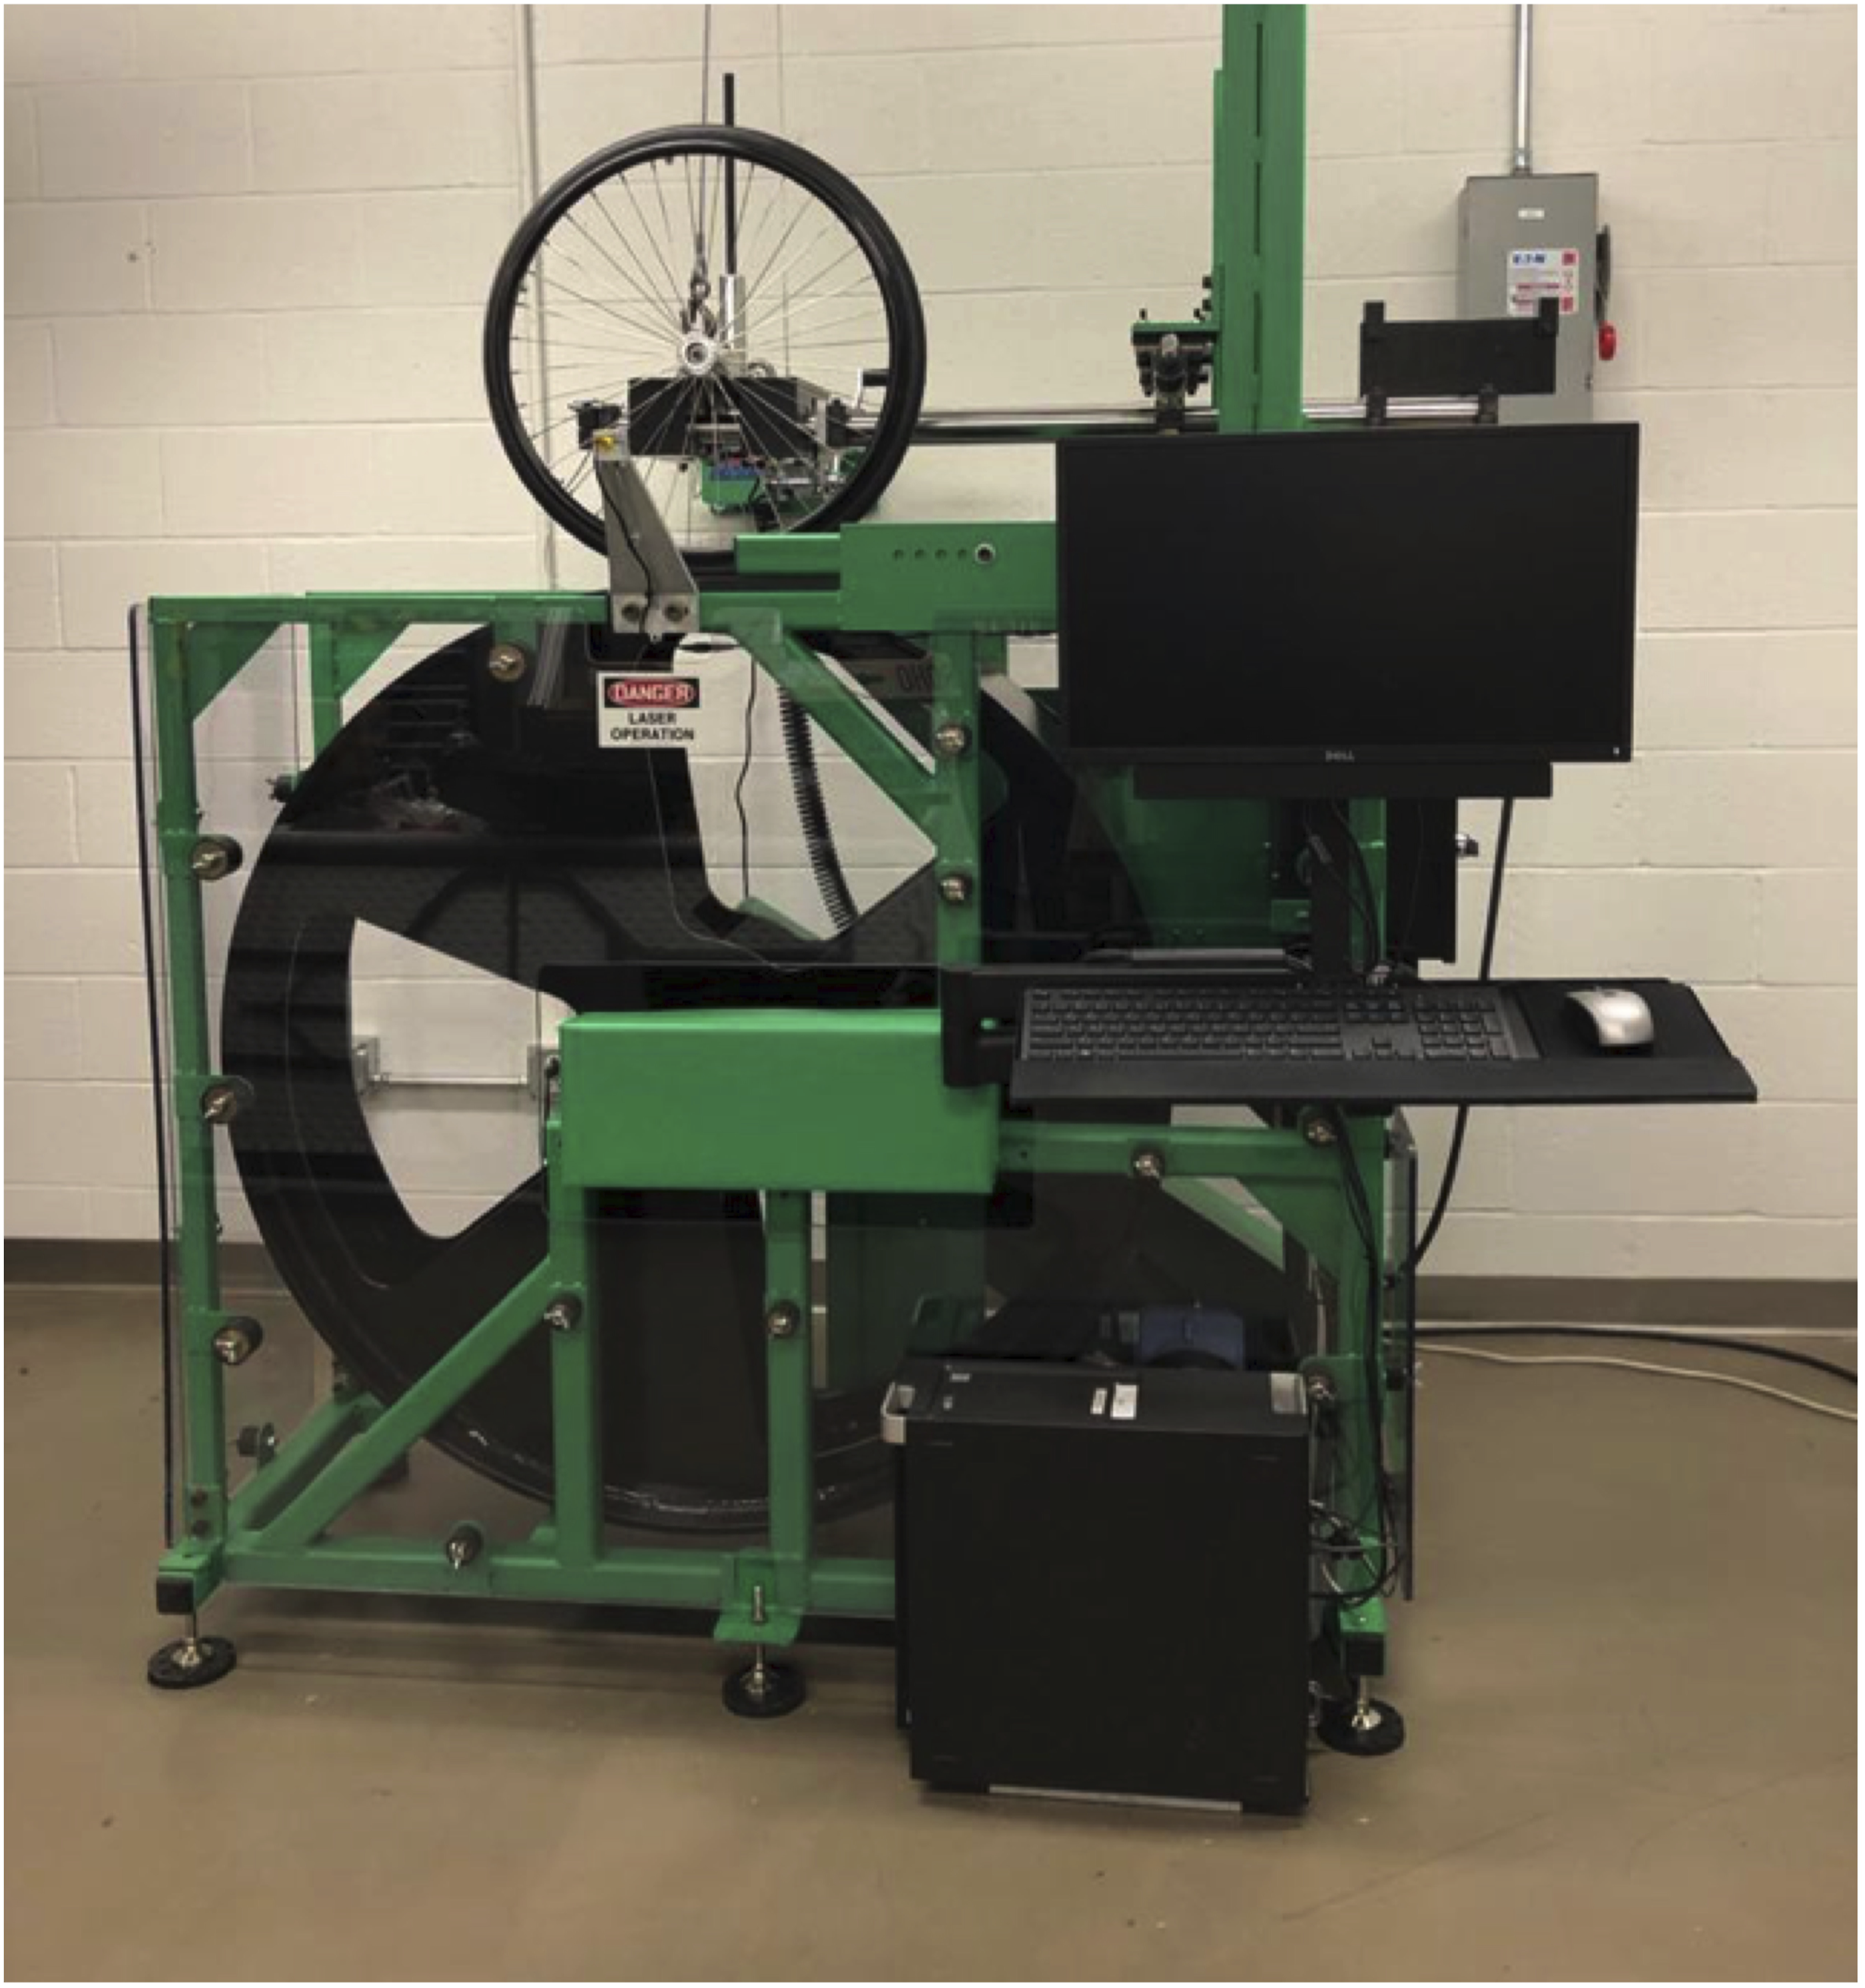
Rear wheels and casters were identical to the SmartWheel testing. Drum RR testing was conducted on linoleum (Forbo) and treadmill belt (Bertec) at 1.0 m/s, and on low pile carpet with felt carpet pad (1/4″ thick) and simulated brick at a slower speed (0.5 m/s) due to bouncing of the RR equipment arm.
31
Drum testing does not show significant differences in RR at 0.5 and 1.0 m/s,
17
so only one speed was tested. A comparison of over-ground and Drum RR testing surfaces are shown in Figure 3. Three repeated trials of 30 seconds were completed at 35, 55, 75, 95 and 115 lb. load for each rear wheel and 15, 20, 30, 40, 50 and 60 lb. for each caster. Test methods are the same as previously reported
31
with the exception that a higher backload (2 lbs.) was necessary for simulated brick testing, due to bouncing and offloading of the primary load cell using a 1 lb. backload. Surfaces from over-ground and Drum RR testing.
The brick pathway used in SmartWheel testing was comprised of 4″ x 8″ bricks with alternating directions (Figure 3), which was simulated with wood paint stirrers (12″ by 1″) with slight beveled edges, applied to the drum in groups of 4 (representing a 4″ brick) with 5 mm gaps. 3M safety-walk heavy duty tread (Americans with Disability Act (ADA) compliant) adhesive tape (1″ wide) was applied to each wood stick (Figure 3) to simulate the roughness and texture of the brick. The gap size of 5 mm was selected based on expert consultation (typical brick pathway gaps of 3 to 6 mm) and previously measured pathway roughness index for a brick pattern stamped concrete corresponding to a 4.3-mm gap).34–36 Pathway roughness index was used to determine an appropriate gap because it correlates vibration to surface roughness, 35 and can be measured using specialized equipment or be calculated using gap size, bevel dimension and frequency of gaps.
Data analysis
SmartWheel measured variables 24 .


Example of SmartWheel measured forces and moments.
Variables and equations which use SmartWheel data 14 .

During each propulsion cycle, SmartWheel measures forces and moments over the entire propulsion cycle. Because RR is the resistance to propulsion for the entire cycle, SmartWheel RR is derived from the average power, which is computed from average propulsion torque (Mz) and velocity for the entire propulsion cycle (push+recovery), defined from one ‘push start’ to the next ‘push start’. Cooper et al. found that SmartWheel Mz is comprised of both tangential force and wrist moment
Fres is calculated from forces during the push part of the propulsion cycle, defined as ‘push start’ to ‘push stop’. Two values are analyzed: FresAverage is the average Fres during push portion of the propulsion cycle, and FresPeak is the maximum Fres measured during the push portion of the propulsion cycle.
Because Drum RR is measured at steady state, SmartWheel data was processed to include only the steady state velocity portion of each trial, and exclude initial start-up pushes and the associated higher forces required to reach the target speed. 38 An initial analysis of SmartWheel push data indicated that steady state was obtained after the first three pushes, similar to other researchers who reported steady state after four pushes. 38 The raw data was processed to calculate RR, FresAverage, and FresPeak after excluding the first three pushes. SmartWheel trials (0.5 and 1.0 m/s) were averaged for comparison to Drum RR
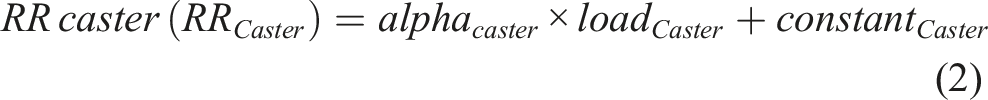
For Drum RR calculations, caster and rear wheel RR were calculated using the anterior and posterior weight measured for each participant in each wheelchair. Average weight distribution during SmartWheel testing was 36% anterior (range 26 to 50%) and 64% posterior (range 50 to 74%).
Drum RR estimates were calculated using best-fit lines generated from Drum RR testing
31
(Equations (1) and (2), with alpha = slope, constant = intercept) and the anterior/posterior weight (load in Equations (1) and (2)) for each participant/wheelchair equipment to estimate the RR for each rear wheel and caster, with system level RR calculated using Equation (3).

Data processing
In total, 665 of 672 SmartWheel trials were included in the RR analysis. Of the seven excluded trials, four did not have more than three push cycles (i.e., no steady-state) and three trials had missing data files (see Supplemental File). SmartWheel trials were averaged for comparison to Drum RR for a total of 192 comparisons (participant-surface-configuration combinations). The rationale for averaging is that Drum testing does not show significant differences in RR at 0.5 and 1.0 m/s, 17 so only one speed was tested, and then compared with the average of SmartWheel trials at 0.5 and 1.0 m/s.
Statistical analysis
SmartWheel RR, Drum RR, difference between methods, Fres – mean, SD.

Indicates exceptions to normal distribution.
askewed distribution.
boutlier present in the distribution.
To assess the consistency of Drum RR as a predictor of SmartWheel RR, we use ICC (3,1 - two way mixed-effects model, consistency, average measures), where <0.5 indicates poor reliability, 0.5 to 0.75 indicates moderate reliability, 0.75 to 0.9 indicates good reliability and greater than 0.9 indicates excellent reliability.
32
The ICC model compares the fixed effect of two test methods and random effect of participants, to evaluate consistency of how one score relates to another score.
32
Average measures were selected because the comparison is to the mean of four SmartWheel trials.
40
To evaluate accuracy between Drum and SmartWheel RR we used BA 95% LOA plots, coefficient of determination (R2), and F-test significance (


Results
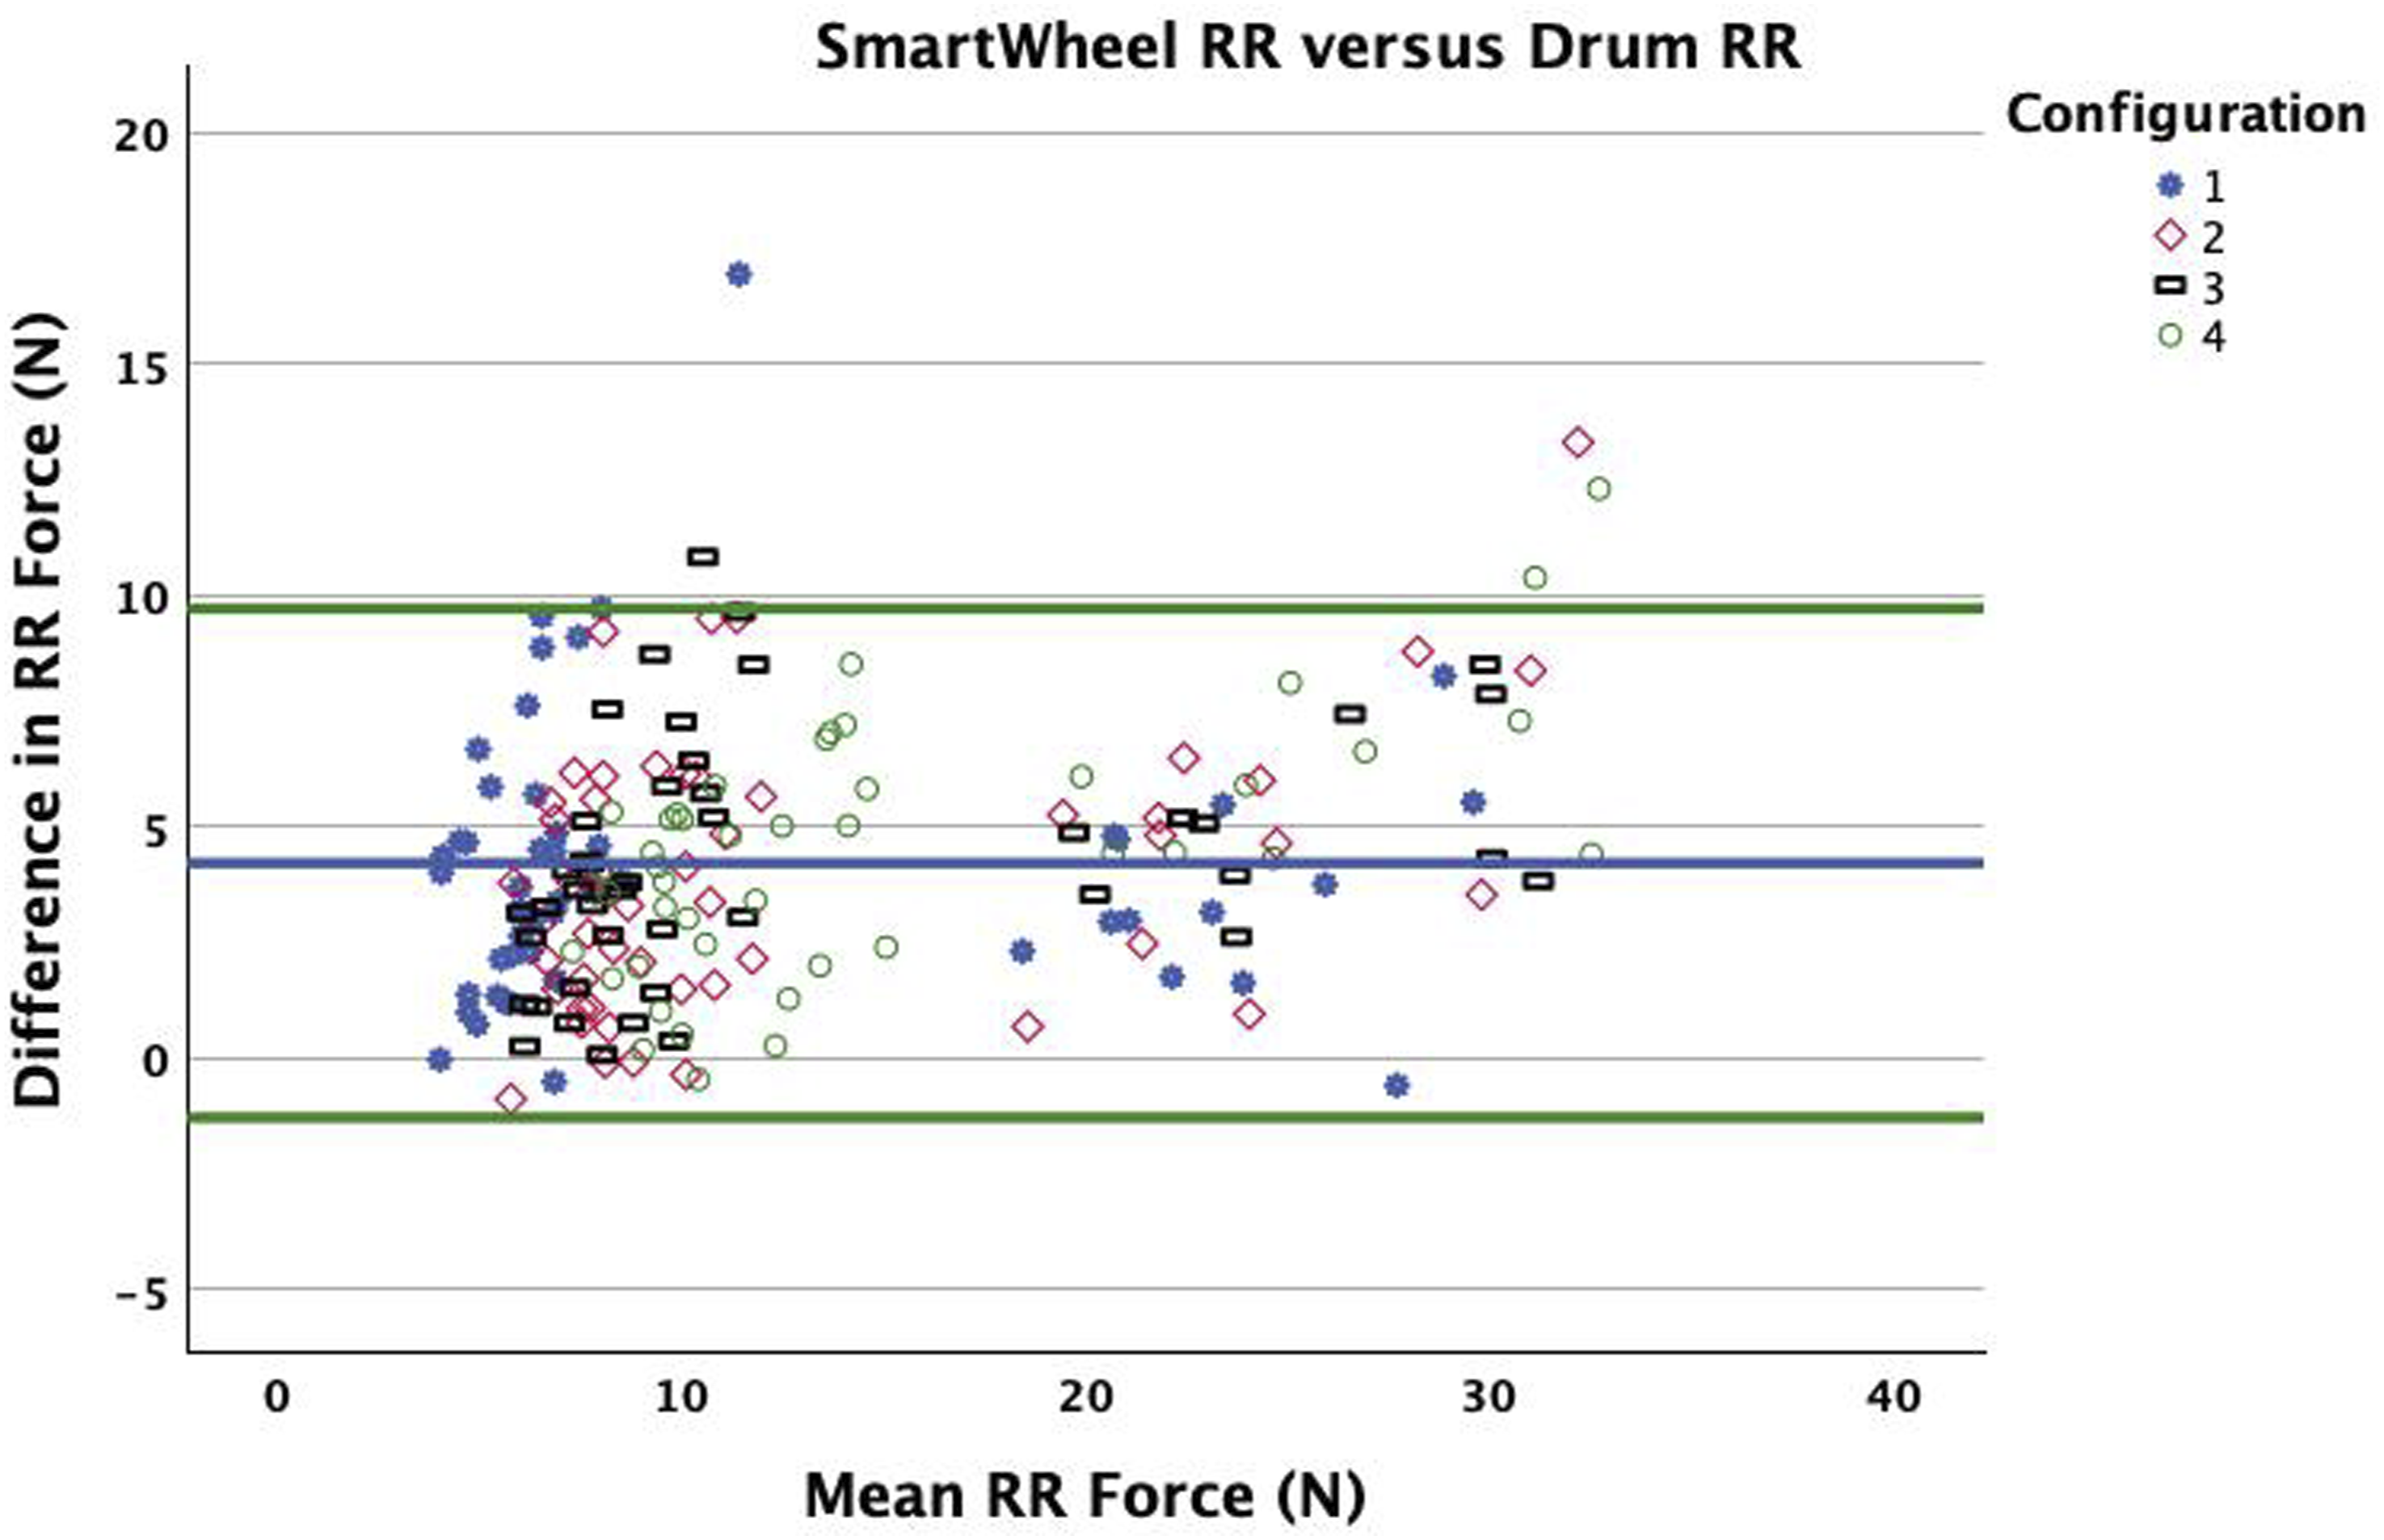
SmartWheel and Drum RR forces were 14.7 N (range 4.0 to 38.9 N) and 10.5 N (range 1.7 to 30.3 N) respectively. The mean difference between methods was 4.2 N with 95% CI [3.8 to 4.6 N]. Table 5 provides mean and SD overall and by factor (surface, equipment) for RR (SmartWheel, Drum, Difference) and Fres. The SD for difference was smaller than SD for SmartWheel or Drum RR. By surface, SD was highest for carpet and lowest for tile and brick.
The ICC comparing RR between methods was 0.966, with 95% CI [0.955 to 0.975], where >0.9 represents excellent reliability/consistency. The hypothesis that Drum RR would consistently predict SmartWheel RR based on ICC 95% CI is confirmed. Drum RR explained 88% (R2) of the variability of SmartWheel RR (F1,190 = 1457, p < .001, R2 = 0.885) with best-fit equation SmartWheel RR versus Drum RR system estimates.
Accuracy of Drum RR versus SmartWheel RR (BA)
The mean difference between methods and LOA was 4.2 N +/− 5.5 [−1.3 to 9.7], with Drum RR underestimating SmartWheel RR. By surface, the mean difference between methods varied: tile (1.4 N), brick (3.7 N), carpet (5.1 N), treadmill (6.6 N), with SD 1.2, 1.4, 2.8 and 2.6 respectively (Figure 6 and Table 5). By equipment type, the mean difference varied (4.0 to 4.5 N), with similar SD (2.7 to 3.1) (Figure 7 and Table 5). The mean difference between SmartWheel and Drum RR on a percentage basis is 31%, with range −17% to 85%, and frequency illustrated in Figure 8. BA by surface. BA by equipment. Frequency of percent difference between methods.

Consistency and accuracy of Drum RR versus SmartWheel Fres
The ICC comparing Drum RR and SmartWheel FresAverage was 0.83 with 95% CI [0.77 to 0.87] indicating good reliability. ICC comparing Drum RR to SmartWheel FresPeak was 0.71 with 95% CI [0.62 to 0.78] indicating moderate reliability. The hypothesis that Drum RR would consistently predict SmartWheel Fres based on ICC 95% CI >0.75 is confirmed for FresAverage which had good reliability, but not confirmed for FresPeak, which had moderate reliability. Drum RR explained 60% (R2) of the variability of FresAverage and 58% of the variability of FresPeak. For FresAverge: F1,190 = 287, p < .001, R2 = 0.60 with best-fit equation SmartWheel average fres versus Drum RR system estimates. SmartWheel peak Fres versus Drum RR system estimates.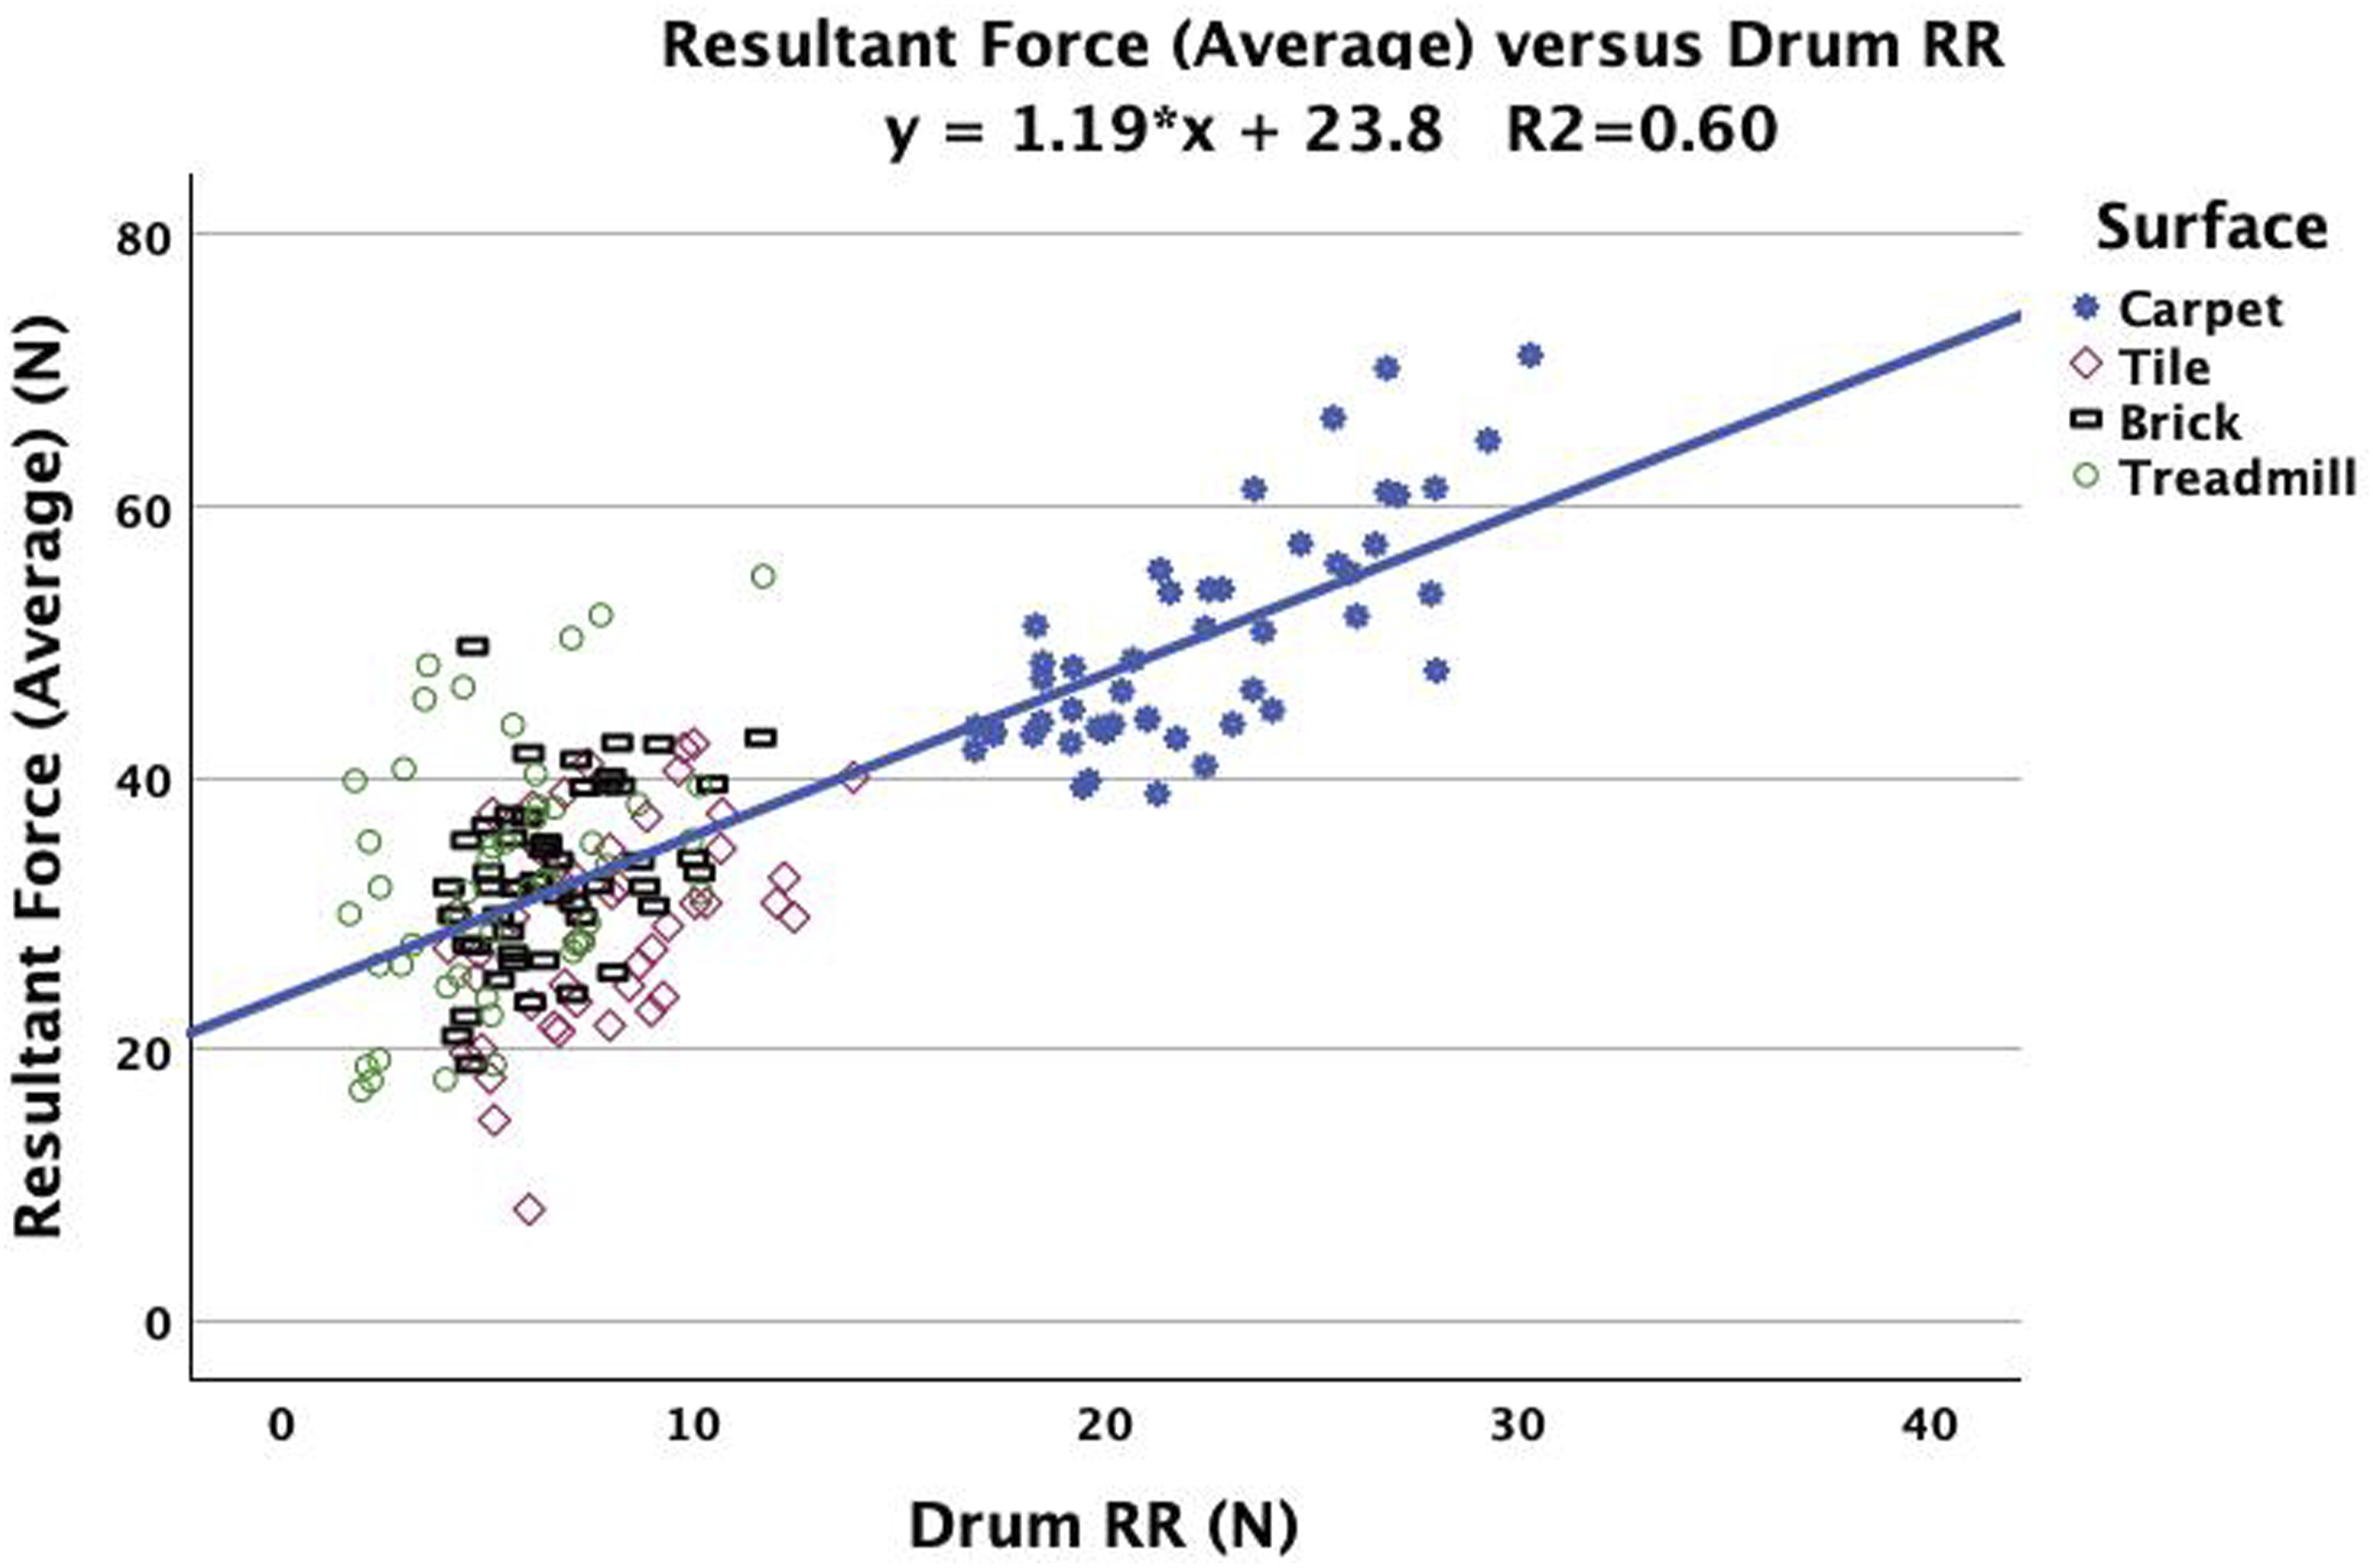

Discussion
We found excellent reliability between Drum and SmartWheel RR based on ICC. The hypothesis that Drum RR consistently predicts SmartWheel RR is accepted, and the hypothesis for accuracy of Drum RR was confirmed based on BA LOA, but with larger LOA than observed in our prior study (discussed further below). Drum RR is consistently lower than SmartWheel measurements (4.2 N). Smaller mean differences and SD were observed for tile and brick compared to carpet and treadmill. Although the absolute difference between methods varied by surface, there was no systematic bias observed in the BA plots.
Drum RR consistently predicts average Fres with good reliability, and peak Fres with moderate reliability based on ICC. The hypothesis that Drum RR consistently predicts FresAverage is accepted. Accuracy was evaluated based on criteria of coefficient of determination and significance of F-ratio, where drum RR explained 60% and 58% of the variability (R2) respectively (FresAverage, FresPeak), lower than our arbitrarily determined threshold of 70%, and with F-ratio significance (p < .001). The hypothesis that Drum RR will predict Fres is confirmed, but with lower reliability and accuracy than predictions of SmartWheel RR.
Accuracy based on BA LOA
Our evaluation of accuracy is based on BA LOA, and we observed a larger range of LOA compared to our prior study (5.5 N vs 1.3 N), 31 due to higher SD (2.8 vs 0.7). The increased SD is thought to be due to test-retest variation from participants during propulsion, specifically differences in propulsion technique, lack of propulsion experience/training and dynamic weight shift. 23 Variation in RR (test-retest) between SmartWheel trials at equivalent conditions (same surface or equipment) were commonly observed and is reflected in the higher SD. These results are consistent with other SmartWheel studies which have reported high variance related to participant propulsion.42,43 One approach to address the test-retest inconsistency issues related to measuring dynamic RR was development of a robotic system test method, to provide repeatable propulsion and controlled input torque to evaluate RR including during wheelchair maneuvers and acceleration/deceleration.15,16,44
Difference between methods
Drum RR underestimates SmartWheel RR, with the difference varying by surface. The mean difference between methods was higher compared to our prior study (4.2 N vs 1.1 N), 31 which had similar ranges of user weight and anterior/posterior weight distribution. 31 The difference between methods is likely due to sub-optimal matching of Drum and SmartWheel test conditions, including surface matching, treadmill incline, SmartWheel internal frictional resistance and weight shift during propulsion. Drum RR test-retest variance likely contributes a small amount to bias. Ott et al. reported Drum RR test-retest coefficient of variation as 1.5 to 2.7% (2.1% average) (SD/mean). 45
The variation by surface is likely due to the difficulty of duplicating existing installed surfaces. Although carpet looked similar, the installed carpet may have been thicker or used more resilient or thicker padding, and the treadmill used a small incline and different treadmill belt material, which could explain the larger difference between methods on these surfaces. No bias in the BA plots was observed, indicating consistency across the range of factors evaluated (equipment, surface). The Drum RR predictions were consistent for different types of equipment (pneumatic and solid tires, polyurethane, and soft roll casters) when averaged across surfaces. Although the absolute mean difference varied by the specific surface, Drum RR is able to consistently predict relative RR (i.e., which configurations have the lowest RR, moderate RR, and highest RR).
SW internal friction could partly explain the difference between test methods. It has been reported that the SmartWheel has higher resistance to propulsion compared to a standard wheel, 46 which is thought to be due to frictional resistance and greater weight of the SmartWheel (+7 lbs. vs. standard wheel). Sprigle et al. used a robotic system coast down test to compare RR for two SmartWheels versus two standard wheels, and measured a higher RR force, with a difference of 2.8 to 4.2 N for two SmartWheels, (or 1.4 to 2.1 N for one SmartWheel). 46 The average rear wheel weight for our study was similar to this study (59.4 vs 70.7 lbs.).
The effect of weight shift during propulsion may also contribute to the difference between methods. SmartWheel RR was higher than Drum RR, even after removing the first three pushes, so that only steady state SmartWheel RR was compared to Drum RR. Propulsion involves applying force to the push rim, and as the hand moves from rearward to forward on the push rim, there is simultaneous upper body movement and anterior weight shift with each push. 23 The biomechanics of propulsion, including weight shift and upper body movement, are not captured or measured with steady state Drum RR tests, but it is plausible that weight shift could contribute to the differences in RR between methods. Able-bodied participants could have more easily shifted their weight during propulsion, thus amplifying that effect.
Some of the difference between methods may be caused by differences in wheel contact patch area between Drum versus over-ground testing as contact patch area influences RR. Contact patch area is a function of multiple factors, 47 including dimensions of the tire/caster, material characteristics of both the tire/caster and surface, the shape of the contacting surfaces (e.g. cylinder-cylinder or cylinder-plane), and interactions among these factors. These complex relationships make it difficult to predict the effect of contact area differences between test methods. Our Drum method likely results in a smaller contact patch than over-ground movement, which may result in a lower predicted RR. The relationship of contact patch and RR has been explored and estimated by others for commercial tires, but requires simplifying conditions (i.e. identical tire pressure and load) to be applied. 48 Our test method evaluates a range of tire types, sizes, materials, loads and surfaces, which adds complexity and prevents us from using these estimates. Future work could explore the effect of contact patch for Drum versus over-ground testing and its relationship to RR.
Drum RR prediction of Fres
The best-fit equations correlating RR to FresAverage (R2 = 0.60) and FresPeak (R2 = 0.58) had lower accuracy than hypothesized based on coefficient of variation (R2 = 0.7), due to high SD for both FresAverage and FresPeak (shown in Table 5). Cooper et al. evaluated SmartWheel uncertainty, and found the maximum uncertainty as Fx = 2.5 N, Fy = 2.5 N and Fz = 0.5 N, 49 which if used to calculate maximum uncertainty in Fres (equation provided in Table 4, Fres = 2.52 + 2.52+0.52) is 3.57 N, which may partly explain the lower correlation. Richter et al. found peak Fres can vary widely as a function of propulsion technique, even when speed and power output are fixed, and that minimizing push frequency increased peak Fres by 154%. 50 This high variance related to propulsion technique affects the ability to predict Fres using Drum RR. The importance of Fres related to UL injury and pain has been studied by Boninger et al. and others, with results indicating that higher weight leads to higher risk of injury as well as higher push rim forces having higher risk of injury.22,27–29 Soleymani et al. found a strong relationship between RR and peak Fres force, 14 with peak Fres force increasing linearly with increased RR force, which supports reducing RR as a pathway to reduce propulsion force. The ability to predict measured Fres (average, peak) from Drum RR testing can help guide equipment choices to minimize propulsion forces at the push rim and potentially minimize longer term risk of UL injury and pain. Fres is affected by factors including surface 21 and propulsion technique,14,27 and reduced RR translates to reduced Fres. 14
Implications of Drum RR testing
By predicting push rim forces, Drum RR testing provides data which enables a more personalized and precision approach to individual wheelchair prescription, supplementing the current focus on prescription for the user’s size and specific functional needs, by expanding into rear wheel and caster selection optimization for the user. Drum RR can help to optimize equipment in a way that is much less time and resource intensive compared with existing RR test methods. By measuring RR at a component-level, Drum testing provides data which can be applied individually for client decision making in clinical settings. In support of this objective, an online clinical decision tool (RightWheel) has been developed to provide client-specific RR predictions for multiple wheelchair set-ups in an easy-to-understand format, allowing clinicians to quantify effects of different equipment and educate their clients. 51 Clinician feedback has confirmed that RightWheel is easy to use, and is perceived as a useful tool. 51 For product development engineers and manufacturers, Drum RR provides an efficient test and objective measure to compare products and guide decision making. Drum RR could also be used to develop a test standard to guide equipment selection for manual wheelchairs.
Conclusions
Drum RR consistently predicts SmartWheel RR with excellent reliability based on ICC >0.9 (ICC = 0.966) and accuracy based on BA LOA of +/− 5.5 N. The overall mean difference and SD between methods was greater (mean 4.2 N vs 1.1 N), (SD 2.8 vs 0.7) and LOA was wider (+/−5.5 N vs +/−1.3 N) in this over-ground propulsion study vs our previous treadmill drag test study. 31 Smaller mean differences and SD were observed for tile and brick compared to carpet and treadmill. Although the absolute difference between methods varied by surface, there was no systematic bias observed in the BA plots. Difference between methods is attributed to multiple factors: 1) less than perfect matching of the surface attached to the Drum vs the actual over-ground surface tested; 2) weight and internal resistance of the SmartWheel; and 3) participant related factors, including propulsion technique, propulsion experience/training and dynamic weight shifts during propulsion. Drum RR predicts SmartWheel FresAverage with good reliability based on ICC 95% CI between 0.75 and 0.9 (ICC = 0.83), and lower than hypothesized accuracy based on coefficient of determination R2 > 0.7 (R2 = 0.60). Drum RR predicts SmartWheel FresPeak with moderate reliability based on ICC 95% CI between 0.5 and 0.75 (ICC = 0.71) and lower than hypothesized accuracy based on coefficient of determination R2 > 0.7 (R2 = 0.58). The relationship between RR and Fres is not due to chance based on F-ratio significance (p < .001). This study is another step toward validating Drum RR and ultimately providing the ability to use RR to guide wheel and caster selection.
Limitations
Able-body participants were recruited without any propulsion training, and the wheelchair was not fitted to the participants, which may have affected propulsion force. The SmartWheel is heavier than a standard wheel, and it has internal resistance, which can affect propulsion patterns. 46 The SmartWheel and similar devices (OptiPush) are no longer commercially available, and there are a limited number of researchers with access to these devices, making this work difficult to expand on or replicate. For future research, there is a lack of available commercial devices to measure propulsion forces. A limited number of rear wheels and casters were included, and additional equipment could be evaluated. Simulating installed real-world surfaces on the drum is challenging, and similar looking surfaces can have different RR. The installed surfaces could not be exactly duplicated on the Drum.
Supplemental Material
Supplemental Material - Drum rolling resistance consistently predicts SmartWheel rolling resistance and resultant force for manual wheelchair wheels and casters
Supplemental Material for Drum rolling resistance consistently predicts SmartWheel rolling resistance and resultant force for manual wheelchair wheels and casters by Holly Wilson-Jene, Rachel Cowan, Rachel Post, Jon Pearlman in Journal of Rehabilitation and Assistive Technologies Engineering
Footnotes
Acknowledgements
We would like to thank the International Society of Wheelchair Professionals (ISWP) Standards Working Group for their continued support of this research, and the Miami Project to Cure Paralysis for completing the SmartWheel testing.
Ethics approval
The study was approved by the Institutional Review Board.
Funding
The authors disclosed receipt of the following financial support for the research, authorship, and/or publication of this article: This work was supported by the Improving Health and Function Through Use of Performance Standards in Wheelchair Selection Grant #90REGE0001-02-00, U.S. Agency for International Development through Agreement Nos. APC-GM-00068, SPANS-037, APC-GM-0107, FY19-A01-6024, National Institute of Neurological Disorders and Stroke (NINDS) R25NS083064, and The Miami Project to Cure Paralysis.
Declaration of conflicting interests
The authors declared no potential conflicts of interest with respect to the research, authorship, and/or publication of this article.
Supplemental Material
Supplemental material for this article is available online.
Contributorship
JP and REC conceived of the manuscript. HWJ conducted Drum RR testing. REC developed MATLAB program to analyze SmartWheel data, and HWJ further modified MATLAB program for this analysis. RP processed and analyzed SmartWheel data. HWJ analyzed SmartWheel and Drum RR data and conducted statistical analysis. HWJ wrote the first draft of the manuscript. All authors reviewed and edited the manuscript and approved the final version of the manuscript.
References
Supplementary Material
Please find the following supplemental material available below.
For Open Access articles published under a Creative Commons License, all supplemental material carries the same license as the article it is associated with.
For non-Open Access articles published, all supplemental material carries a non-exclusive license, and permission requests for re-use of supplemental material or any part of supplemental material shall be sent directly to the copyright owner as specified in the copyright notice associated with the article.