
Abstract
Aim
Maneuvering manual wheelchairs is defined by changes in momentum. The amount of effort required to maneuver a wheelchair is dependent on many factors, some of which reflect the design and configuration of the wheelchair.
Objective
The objective of this study was to measure the work required to propel a manual wheelchair configured with three weight distributions, three drive wheels and four casters.
Methods
A novel wheelchair-propelling robot was used as the test platform to measure work while traversing two surfaces using three different maneuvers which were defined to highlight different kinetic energies and energy loss mechanisms.
Results
Overall, propulsion cost decreased with an increase in load on the drive wheels. Pneumatic drive wheels exhibited lower propulsion costs compared to a solid tire. Two casters, a 4″ dia × 1.5″ and a 5″ dia × 1″, exhibited better overall performance compared to 5″ dia × 1.5″ solid and 6″ dia × 1″ pneumatic casters.
Discussion
The results indicate that drive wheel load and types of drive wheels and casters impact propulsion cost and their influences differ across maneuvers and surfaces. The approach is well suited to assess equivalency in components and configurations. Assessment of performance equivalency would empower clinicians and users with important knowledge when selecting components.
Keywords
Introduction
Maneuvering manual wheelchairs is defined by changes in momentum. A user must exert effort to impart different speeds and/or directions to maneuver throughout the day. The amount of effort required to maneuver a wheelchair is dependent on many factors, including both mechanical and biomechanical influences. From a mechanical design standpoint, the major factor influencing wheelchair control and maneuverability is the efficiency of the wheelchair system. Efficiency is a straightforward construct that can be characterized as using less energy to perform the same task. For a wheelchair user, this translates into using less energy while performing maneuvers throughout the day. Unfortunately, wheelchair propulsion has been shown to be inefficient1–4 meaning that the amount of work performed by the user does not efficiently translate into distance traveled. Mechanical efficiency can vary across mechanical designs and configurations. Compared with the use of a more efficient wheelchair, an individual will need to exert greater instantaneous force and total effort for accomplishing desired travel when using a less efficient wheelchair. The greater effort to propel a less efficient wheelchair can lead to difficulty in achieving desired speeds, a higher probability of fatigue over long bouts of mobility, and difficulty negotiating inclines. Overtime, the accumulation of this greater effort can also increase the potential for injury in the upper extremities.5–7
The desire to improve wheelchair propulsion efficiency has motivated a substantial body of research. Systems-level testing with human operators has been dominated by focus on steady state velocity often using treadmills and rollers.8–13 Studies using straight trajectories with steady-state velocity can provide useful information on kinematics and some general assessment of kinetics but are not designed to assess the propulsion effort required to maneuver a wheelchair. The effort required to maneuver a wheelchair will reflect the inertial and energy loss parameters of the wheelchair system relative to the maneuver. Effort will reflect changes in the translational, yaw and rotational kinetic energies14,15 and the energy losses resulting from straight and turning trajectories.16,17
A few studies have included over ground maneuvering endowed with changes in momentum (i.e., speed and/or direction) that can reflect both the inertial and energy loss during wheelchair maneuvers. Sawatzky et al. 12 found increased energy expenditure when propelling wheelchairs with tires inflated to 25% and 50% of their recommended levels over a linoleum floor track, but detected no differences when tires were inflated to 75% inflation. Cowan et al. 18 found increased forces required to propel wheelchairs weighing 27.15 kg (60 lb) compared to 18.10 kg (40 lb) and that surface type has a significant effect on propulsion kinematics and kinetics. Lin and Sprigle assessed propulsion effort as persons performed a Figure 8 maneuver while using various wheelchair designs and configurations. The resulting regression model entered system mass, weight distribution, and frictional loss as potential predictors and identified weight distribution as the sole wheelchair factor affecting effort. 19
Other over-ground wheelchair studies appear to have lacked the sensitivity to detect differences in propulsion effort across wheelchair parameters. Beekman et al. 20 evaluated wheelchairs with different mass, mass distribution, and tire type using propulsion around a track and found different metabolic demand in persons with paraplegia but no differences in persons with tetraplegia. Bednarczyk and Sanderson 8 studied adult and child wheelchair users propelling a 9.3 kg wheelchair with 0, 5, and 10 kg of added mass and found no differences in the kinematics of the propulsion stroke. Hughes et al. 21 evaluated Spinergy and standard spoke drive wheels in over-ground wheeling and found no differences in propulsion effort. Sagawa et al. 22 used a variety of maneuvers including over ground slalom and acceleration tasks. They found no differences in energy expenditure after adding 1, 2, and 5 kg to the wheelchair. These results indicate a need for testing that has greater sensitivity to define magnitudes of differences in propulsion force or effort across different wheelchair configurations.
Testing manual wheelchairs as mechanical systems permits assessment of performance without influences of human subject variability and affords the opportunity to test many more conditions than is possible with human operators. The study of mechanical performance has included measurement of energy loss and propulsion torque of wheelchair systems. Mechanical testing has documented rolling resistance23,24 and turning deceleration 16 across different wheelchair configurations and propulsion torque 25 across differences in mass and mass distribution. For example, Sauret et al. 24 performed 5280 deceleration tests on 33 manual wheelchairs, each with 4 weight and weight distribution configurations to document changes in system’s level performance.
The objective of this study was to measure the propulsion cost required to propel a manual wheelchair configured with different weight distributions, drive wheels and casters, on both tile and carpet surfaces. Within this wheelchair application, mechanical efficiency is embodied by propulsion cost, a parameter calculated using propulsion work normalized against the distance traveled. A novel wheelchair-propelling robot (anatomical model propulsion system (AMPS)) was used as the test platform to measure propulsion cost during three different straight and turning maneuvers. The project sought to address two research questions: (a) how much does propulsion cost change during straight and turning trajectories with different weight distributions on the wheelchair’s drive wheels and (b) how much does wheelchair propulsion cost differ when configured with different drive wheels and casters?
Methods
A wheelchair-propelling robot, the AMPS, was used to maneuver the test wheelchairs. The AMPS was designed to permit the study of repeatable and realistic maneuvers of an occupied wheelchair. The robot mimics a seated person with an analogous mass distribution to ensure realistic loads on the wheelchair frame, wheels, and bearings. For this study, AMPS was configured based on a 95th-percentile adult 26 with a mass of 100 kg distributed according to body segment parameters and ISO 7176-11. 27 A full description of design and validation has been previously reported 28 but will be briefly repeated here. The AMPS is driven by two direct-current (DC) motors via a ring gear and pinion gear system (Figure 1). The only modification to the tested wheelchair is the use of the ring gear which replaces the handrim. A motor controller operating under closed-loop speed control sends a command profile that is defined to reflect the desired trajectory. For example, for a straight run, the controller sends a velocity profile that defines a constant acceleration phase followed by steady-state velocity and ending with a deceleration phase. Sensors measure the motor currents and the corresponding propulsion torque is calculated using a combination of the torque-current constant provided by the DC motor manufacturer and an experimentally-populated calibration curve.

The anatomical model propulsion system (AMPS).
Validation included both component and systems testing. Specifically, the current sensor and load cells were individually calibrated, followed by system-level validation to investigate the repeatability of the commanded trajectory and measured propulsion torque during over-ground wheelchair maneuvers. System validation used a straight trajectory at two different velocities, 1.4 and 0.7 m/s. The maneuver was conducted ten times at each speed while measuring wheel velocity, current, and force data.
Control system accuracy was characterized by comparing the programmed velocity profile to the measured velocity profile and computing the error between the two waveforms. Furthermore, the repeatability of the profile was characterized by determining the coefficient of variation of the entire maneuver for both the left and right wheels at both speeds. Wheel velocities were within 0.1 m/s of programmed values and coefficients of variation < 2%. Propulsion torque metrics included peak acceleration, peak deceleration and the average steady state torque. Propulsion torque was repeatable with coefficients of variation <10%.
AMPS was used to evaluate the mechanical work required to perform three wheelchair maneuvers on tile and carpet surfaces under multiple wheelchair configurations including different weight distributions, casters and drive wheels.
Canonical maneuvers
Three distinct maneuvers were defined as unique representations of the paramount elements of wheelchair motion: straight-forward motion and two types of turning movements. Canonical maneuvers, as deployed by AMPS, are not, by themselves, maneuvers performed regularly during everyday mobility. However, they were defined according to the tenets of physics (hence “canonical”) to represent the inertial and energy loss parameters that dictate the effort to propel manual wheelchairs. In other words, the canonical maneuvers can be used, in combination, to configure common everyday maneuvers. To achieve this representation, the maneuvers include a straight trajectory and two turning trajectories embodied by different radii of curvature. They are endowed with varying levels of translational, rotational and yaw kinetic energy (KE),
14
and selectively exhibit different types of energy loss of the wheels and casters, specifically rolling resistance and scrub torque.
17
Descriptions of the maneuvers are found below with fuller descriptions included in the Supplemental Information, including images and graphs that partition the kinetic energies for each maneuver.
Straight trajectory. Starting from rest, with casters aligned forward, accelerate to 1.0 m/s in 2.5 s, maintain this speed for 5 s and then decelerate to a stop in 2.5 s. Total linear distance traveled equates to 7.5 m.
Rationale: This maneuver highlights rectilinear inertia of the system with translational KE being the dominate energy. A minor contribution of rotational inertia of the wheels is also present. Resistive losses are dominated by rolling resistance of the drive wheels and casters, with minor contributions from other resistive losses in the frame and bearings.
2. Fixed-wheel turn. This maneuver is performed by driving one wheel while the opposite drive wheel is locked. Starting from a stop, the unlocked drive wheel is driven to accelerate the system to a 1.56 rad/s yaw rate (90° turn per second) in 2.5 s. Maintain this yaw rate for 5 s, then decelerate to a stop in 2.5 s. Total system yaw displacement equates to 11.7 radians (a 675° turn).
Rationale: This maneuver highlights system translational and yaw inertia with minimal contribution of rotational wheel inertia, Resistive losses are highlighted by drive wheel scrub and rolling resistance and caster rolling resistance. Casters start aligned to the trajectory so they do not swivel.
3. Zero-radius turns. This maneuver involves a series of reciprocating turns that are achieved by driving on wheel forward and the other in reverse. On Tile. Starting from a stop, counter-rotate drive wheels to reach a yaw rate of 1.56 rad/s (90° turn per second) in 1.0 s. Maintain this yaw rate for 1.0 s, then decelerate to a stop in 1.0 s. Pause for 1 s, then repeat the turn in the opposite direction. Repeat until a total of six turns have been completed. System yaw displacement of a single turn equates to 3.14 radians (a 180° turn). Total system yaw displacement equates to 18.84 radians (a 1080° turn). On Carpet. Same maneuver pattern, except the steady-state yaw rate is reduced to 1.17 rad/s (67.5° turn per second) and is maintained for 1.67 s. The reduced velocity and acceleration on carpet was deployed to insure a consistent and repeatable maneuver. The total yaw displacement was identical to the maneuver on tile.
Rationale: This maneuver highlights yaw inertia with relatively minor contributions from translational and rotational inertia. The direction changes highlight caster energy losses. Caster swivel is induced at every direction change before aligning to the direction of travel. Drive wheels exhibit a combination of rolling and scrubbing but their distance traveled is minimized.
Each wheelchair configuration was evaluated using all three canonical maneuvers. Each maneuver was conducted in two sets that differed in direction to minimize the potential impact of surface bias. All tests were conducted on both tile and carpet surfaces.
Propulsion cost
Propulsion cost is defined as the system-level performance metric to study manual wheelchair maneuvering and is based upon the mechanical work required to perform a maneuver normalized to the distance traveled. To calculate work, propulsion torque is directly measured by AMPS using the motor current sensors.
28
Power is determined using torque and the angular wheel velocity as measured by the digital encoders on each drive wheel. Propulsion work is calculated by integrating the combined power from the left and right motors

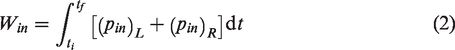
Propulsion cost keys off of the cost of transport concept, which quantifies the energy efficiency of transporting a human, animal or vehicle from one place to another.29,30 Within this wheelchair application, cost is defined as propulsion work normalized against the displacement. Normalizing the AMPS propulsion work by each canonical maneuver’s characteristic displacement minimizes the impact of path differences between each separate AMPS trial. For the straight maneuver, this definition becomes

Components and configurations
A Quickie GT wheelchair (Sunrise Medical, Brierley Hill, UK) was outfitted with combinations of three different types of drive wheels and four different types of casters (Tables 1 and 2). These components are common options available when configuring wheelchairs and embody a diverse range of sizes and design. The casters were the 4 × 1.5″ Froglegs Soft Roll, 5 × 1.5″ Primo Soft Roll, 5 × 1″ Primo, and 6 × 1″ Pneumatic. These casters ranged in diameter from 10.6 to 15.1 cm and widths from 2.2 to 3.6 cm. Two casters were designated as “soft-roll” versions by their manufacturers. The drive wheels were 24″ in diameter and included the 1″ Solid tire on a Mag wheel, 1″ Spinergy wheel with a Schwalbe Marathon Plus tire, and a standard 1 3/8″ Primo Orion pneumatic tire on a spoked wheel. Each of these component pairings were tested with 60%, 70%, and 80% of system load on the drive wheels (%DW load). This weight distribution range was selected based upon its clinical relevance. These different weight distributions were achieved by shifting the weights inside the AMPS system. The total system mass (∼113 kg) for all wheelchair configurations varied < 1.5 kg which was due to the differences in component masses. The single system mass frames the outcome of this study as the impact of casters and drive wheels for a single MWC occupant.
Caster descriptions.

Drive wheel descriptions.

Overall, 36 distinct MWC configurations were evaluated in this study (4 casters × 3 drive wheels × 3 weight distributions). Ten trials (5 in each direction) of each maneuver were performed for each configuration resulting in 2160 total AMPS trials across maneuvers, configurations and surfaces.
Analysis
Propulsion cost performance metrics were calculated for each trial. For the straight and fixed-wheel turn maneuvers, the propulsion cost across the acceleration and steady-state phases was used for analysis (Main cost). The deceleration or braking phases were intentionally omitted as the goal is to highlight energy expended for task propulsion. For the zero-radius turns maneuver, the propulsion cost of each turn’s braking phase is included out of necessity, as the zero-radius turns do not exhibit a distinct and consistent propulsion phase. This metric is referred to as “Total Cost”. Statistical analysis of each canonical maneuver and surface combination was run separately. Within each canonical maneuver and surface combination, two sets of trial averages were formed, one by collapsing data across casters to form drive wheel averages and one by collapsing data across drive wheels to form caster averages.
Analysis consisted to assessing group differences and calculating the magnitude of differences. In a strict sense, configuring the same wheelchair with multiple components may not fully meet the assumption of independence required of ANOVA, but it does control for any variance across frame type as a confounder, and isolates the main factors. However, in deference to convention, a three-way ANOVA was run to assess only the main effects for each task and surface. Three drive wheels, four casters and three weight distributions on the drive wheels (%WD) were entered into the analysis. A prior decision was made to report all p values and discuss levels at the p ≤ 0.1 levels.
Normality of the dependent measures were assessed using Kolmogorov-Smirnov analysis. Main cost as measured during the straight trajectory was found to violate the assumption of normality. ANOVA was run using a Box-Cox transformation of this data.
Differences in cost across the levels of each factor are represented using effect size. Effect size, as calculated using Cohen’s d is a measure of the magnitude of difference between two samples. Cohen’s d is calculated using the differences in the means and the pooled standard deviations of the parameters of interest. 31 Effect size provides the most direct evaluation of differences with the ability to judge meaningfulness. Cohen suggested general guidelines that d = 0.2 be considered a “small” effect size, 0.5 represents a “medium” effect size and 0.8 a “large” effect size. A reference level was used for each factor. The Std Pneumatic drive wheel and the 5 × 1Primo caster represented options that are considered standard configurations and 60% WD load was used as the reference for that factor.
Results
For the straight trajectory, the mean Main Cost values within all three factors (%WD, drive wheel, and caster) were significantly different on both tile and carpet (Table 3). For fixed wheel turns, Main Cost significantly differed across both Drive Wheel and Caster type on both tile and carpet with %WD only significantly differing on carpet. For zero radius turns, the mean Main Cost values within all three factors were significantly different on both tile and carpet. Full ANOVA tables are included in the Supplemental Information.
Analysis of variance results.

WD = weight distributions on the drive wheels; DF = degrees of freedom.
Propulsion cost metric averages, standard deviations and relative effect sizes are tabulated in Tables 4 to 6. For straight trajectories, an 80% DW load provided the lowest propulsion cost on both tile and carpet. Within this maneuver, as the weight shifts to the drive wheels, the overall cost of propulsion decreased. Drive wheel influences were also consistent across surfaces but with small effect sizes on tile but large on carpet. The Solid Mag tire exhibited markedly higher cost compared to the Spinergy and Std Pneumatic. The 4 × 1.5FLSR caster demonstrated a slightly lower cost on tile compared to the 5 × 1Primo caster with a small effect size. On carpet these casters were essentially equal in cost. The 6 × 1Pneumatic caster exhibited a moderate increase in cost on tile but a small decrease on carpet compared to the 5 × 1Primo. The 5 × 1.5PrimoSR caster exhibited slightly greater cost on both surfaces with small effect sizes compared to the 5 × 1Primo caster.
Propulsion cost during straight trajectory.

Propulsion cost during fixed wheel turns.

Propulsion cost during zero radius turns

The fixed wheel drive maneuver is embodied by substantial scrub of the drive wheels while casters roll without swiveling. During the fixed wheel maneuver, %DW loading had a low influence on tile as evidenced by the very small effect sizes. The Solid Mag tire exhibited the lowest cost during this maneuver and had a large effect size difference from the Std Pneumatic, especially when turning on tile. The Spinergy tire also exhibited large effect size differences with the Std Pneumatic but with disparate influences on the different surfaces. Spinergy tires had a lower cost on tile but a higher cost on carpet. The 4 × 1.5FLSR casters exhibited lower cost compared to the 5 × 1Primo with moderate to small differences on tile and carpet, respectively. The 5 × 1.5PrimoSR and 6 × 1Ppneumatic casters had opposite differences compared the 5 × 1Primo depending on surface. The 5 × 1.5PrimoSR exhibited a lower cost on tile and a greater cost on carpet, both with a moderate effect size. The 6 × 1Pneumatic caster exhibited a moderate increase in cost on tile, but a large decrease in cost on carpet, compared to the 5 × 1Primo caster. The 6 × 1Pneumatic caster exhibited the lowest cost of all casters when performing the fixed wheel maneuver on carpet.
During zero radius turns, the cost of propulsion decreased with greater %DW load with large effect sizes on both tile and carpet. The Spinergy wheel exhibited the lowest cost on both surfaces with a small effect size on tile and a large effect size on carpet. The Solid Mag had the highest propulsion cost on both surfaces. The 4 × 1.5FLSR caster was essentially equivalent to the 5 × 1Primo caster on both surfaces. The 5 ×1.5PrimoSR caster demonstrated greater cost on both surfaces with a high effect size on tile and a moderate effect size on carpet. The 6 × 1Pneumatic caster also demonstrated higher cost compared to the 5 × 1Primo with a large effect size on tile and a small effect size on carpet.
Discussion
The data on propulsion costs across different wheelchair configurations shows differences across all three factors: weight distribution, drive wheel and caster, as well as surface. Traveling on carpet increases propulsion cost due its greater energy loss characteristics. Greater propulsion effort on carpet was documented over 35 years ago 32 and has been corroborated more recently.18,19 This study documented the magnitude of the greater mechanical effort. On average across configurations, the propulsion cost increased 48% for the straight trajectory, 63% during fixed wheel turns and 37% for zero radius turns. This is intuitive because carpet is a higher friction surface so has more energy loss, but it also highlights the differential effects of the surface according the task or, in this case, the canonical maneuver. Because the system inertial influences remain constant across surfaces, this differential effect highlights the influence of energy loss. This result also corroborates the assertion that propulsion cost should be measured using maneuvers with different trajectories. The value of incorporating different trajectories is also evident when considering the influences of drive wheel load, drive wheel and casters. The cost of propulsion also differed across these parameters during all three canonical maneuvers and on both surfaces.
Influence of drive wheel load across all maneuvers and surfaces
The 60%–80% span in %WD load impacted propulsion cost during all three maneuvers with different magnitudes of effect on the different surfaces. The 70% and 80% conditions exhibited large effect size decreases compared to the 60% condition during straight maneuver and fixed wheel turn on carpet and the zero radius turns on both carpet and tile. Fixed wheel turns on tile was the only maneuver not demonstrating a difference across the weight distributions (ANOVA p = 0.113; effect size ≤0.07). This may be attributed to an equal and opposite tradeoff between two influencing parameters as weight distribution increases from 60% to 80% on drive wheels: (a) an increase of drive wheel scrub and rolling resistance and (b) a decrease in system turning inertia and caster rolling resistance. Overall, the relative propulsion costs decrease when increasing loading on the drive wheels from 60% to 70% to 80%. The influence of %DW load was more pronounced on carpet compared to tile which is consistent with the higher friction carpet surface. This result is consistent with a prior study on mass and drive wheel load effects on mechanical propulsion torque 25 and two studies using human operators propelling overground.18,19
Overall, despite the fact that increasing load on the drive wheels increases the rolling resistance and scrub on the drive wheels, the overall system propulsion costs decreases. These results can be inferred to mean that one incurs a penalty when loading the casters- as embodied by lower drive wheel load- during all three maneuvers and the penalty is greater on carpet compared to tile. By extension, the choice of casters becomes more important when caster load increases (i.e., a decrease in %DW load). This concept is illustrated by propulsion cost during zero radius turns, the maneuver which highlights caster energy loss (Figure 2). The spread of propulsion cost values is much greater with a 60% DW load compared to the spread with an 80% DW load. Because weight distribution also impacts pitch stability, the choice of %DW load is not limited to mechanical efficiency and must also reflect the needs of the user and his or her postural stability and control.

Propulsion cost of casters across %DW load during zero radius turns on tile.
Drive wheel influence on propulsion effort
Differences in drive wheel performance is best illustrated by the straight trajectory and fixed wheel turns. The straight trajectory highlights rolling resistance and the fixed wheel turn reflects both rolling resistance and scrub. Of the three tested drive wheels, the Solid Mag tire was associated with a much greater propulsion cost during straight trajectory (effect size ≤ –4.5) but was associated with the lowest cost during fixed wheel turns (effect size ≥ 0.75) (Figure 3). Averaging over all maneuvers and configurations, the Solid Mag tire required 17% more propulsion cost compared to the other drive wheels. The relative differences between the Std Pneumatic and Spinergy varied across maneuvers and surfaces which highlights the fact that drive wheel influences on propulsion cost can vary according to the context of use. The Std Pneumatic tile exhibited lower cost while traversing straight on tile and during the fixed wheel turn on carpet. The Spinergy exhibited lower cost during fixed wheel maneuvers on carpet and during ZRT on both surfaces. When considering all maneuvers and drive wheel loads, the difference in propulsion cost between the Std Pneumatic and Spinergy drive wheels <1%. As a result, drawing a conclusion about performance for an individual would require an assessment of the relative surfaces and trajectories encountered during daily activity. Additional discussion of this issue is addressed below.
Caster influence on propulsion effort
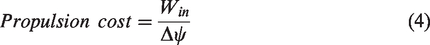
The influence of specific casters under the different conditions varied substantially. The straight and zero-radius turning maneuvers can be used to draw inferences about overall performance since these maneuvers highlight caster performance (Figure 4). The straight trajectory highlights performance while rolling and the zero-radius turns highlights the influences of caster swivel. Propulsion cost of the 4 × 1.5FLSR exhibited small effect size differences with the 5 ×1Primo for both maneuvers. In distinction, the 5 × 1.5PrimoSR and 6 × 1Pneumatic exhibited greater propulsion cost during zero radius turns as reflected in their large effect sizes. Performances of the four casters were much more similar on the higher friction carpet compared to tile. Overall, no consistent relationship was found between caster diameter and propulsion cost across drive wheels and weight distributions. On tile, the 6″ casters had the greatest cost while on carpet, they resulted in the lowest cost. While predicate work has not measured cost of propulsion, studies of overground rolling resistance on carpet found larger diameter casters exhibited lower rolling resistance.33,34 Since rolling resistance has a direct impact on propulsion cost, this finding would be consistent with an increase in cost. In distinction, during the zero radius turns the 6″ caster exhibited relatively high cost on both tile and carpet which highlights its caster scrub on these surfaces.

Scatter plot of propulsion cost during straight and fixed wheel maneuvers across drive wheels.
Scatter plot of propulsion cost during straight and zero radius maneuvers across casters.
Taken together, these results can be applied to the provision of wheelchairs and to inform the selection of wheelchair drive wheels and casters. Firstly, the results suggest that wheels and casters impact the cost of propulsion. The use of different maneuvers and surfaces highlights the different influences of wheelchair components. Most wheelchair bouts of movements will be dominated by straight or near-straight trajectories. This can be deduced by considering the KE measured during overground maneuvers. The Supplemental Information includes graphs of the KE during the three maneuvers. The straight trajectory reflects translational KE. The fixed wheel turn is endowed with over 50% of translational KE while the zero radius turn is dominated by turning KE. Medola et al. 14 partitioned KE during 4 different maneuvers, including straight and three curvilinear maneuvers. A slalom maneuver and 2-m radius turn consisted of 78% and 82% translational KE, respectively. Conversely, a zero radius turn was endowed with only 16% translational KE. These KE partitions reflect the relative amounts of straight and turning within these maneuvers and demonstrate that even within multiple curvilinear maneuvers, the dominant KE is translational in nature and the energy losses will be greatly impacted by rolling resistance of the wheels and casters.
As such, the straight canonical maneuver can be inferred to be the most important as it reflects the influences of translational KE and rolling resistance on propulsion cost. However, bouts of mobility are also endowed by curvilinear motion of varying radii so the propulsion costs of fixed wheel and zero radius turns should also be considered since they add the influences of turning KE and scrub torque to the assessment of propulsion cost. Overall the performance of the two pneumatic drive wheels exhibited better performance than the sold tire with a mag wheel. The Std Pneumatic and Spinergy wheels performed essentially the same when considering all trajectories, surfaces and drive wheel loads. With respect to casters, the 5 ×1Primo and 4 × 1.5 FLSR exhibited better overall performance than the 5 × 1.5 PrimoSR and 6 × 1Pneumatic casters. Despite the smaller diameter and wider width, the 4 × 1.5 FLSR exhibited a surprising good performance. This may reflect a beneficial material construction and overall design. Since a 5 × 1Primo caster appears to be a fairly common standard choice in casters, its performance indicates that it can be considered a good option.
The described approach of using the AMPS to measure propulsion cost appears to be a valid and reliable technique to assess wheelchair configurations. System reliability was assessed and reported previously. 28 Moreover, reliability in measuring the differences in components and configurations is illustrated by the standard deviations of propulsion costs as reflected in Tables 4 to 6. The use of propulsion cost reflects construct validity when applied to the mechanical assessment of manual wheelchairs. Propulsion cost reflects a valid measure of the primary construct related to wheelchair propulsion, namely the work required to maneuver the wheelchair. Because it can measure the influences of both inertial and energy loss parameters at a systems level, this approach also has a higher ecological validity compared to component-level testing.
Reporting propulsion cost in the units of work/distance is able to distinguish components and wheelchair configurations in realistic terms with respect to everyday mobility by defining assumptions and maneuvering profiles. For example, in a recent study, the average distance traveled in a day by 69 users of ultralight manual wheelchairs was 1.7 km. 35 By defining hypothetical distributions of surfaces and trajectories using the canonical maneuvers, calculations of daily work per distance can be calculated and compared across configurations. The three canonical maneuvers used in this study represent trajectories that are endowed with different types of inertias and energy loss. The straight trajectory reflects straight or high-radius turns that are dominated by translational inertia and rolling resistance. The fixed wheel turn reflects trajectories with translational inertia, drive wheel scrub and rolling resistance of the casters and drive wheels. Finally, the fixed wheel turn reflects very tight turns including caster swivel that highlights caster scrub, but with lower levels of inertial influences. For the sake of an example, we define a usage profile that 70% of distance wheeled over the day occurred on tile or another hard, flat surface with the remaining on carpet or other high friction surfaces. In addition, we define 90% distance being traveling in straight or high radius curvilinear motion represented by the Straight trajectory maneuver, 8% distance traveled in tighter turns represented by the Fixed wheel turn maneuver and 2% distance travelled using very tight changes in direction represented by the zero radius turn maneuver. By applying these assumptions to the costs of propulsion, a wheelchair traveling 1.7 km will require an approximate baseline of 38.6 kJ if using a Std Pneumatic drive wheel but 54.1 kJ if using the Solid Mag wheel. That is a difference in 15.5 kJ or a 40% increase in work over the day. Other usage profiles can be defined to estimate the impact of configurations. For example, a person who spends nearly all of his or her time indoors might have a greater percentage of maneuvers represented by fixed wheel and zero radius turns, and possibly, a greater percent of wheeling on carpet.
Limitations
This testing used a single occupant mass (100 kg) that represented a single operator. As such, it does not fully represent the inertial influences of occupants with different masses. Component influences may change when considering occupants of different mass because the system would have different inertia and energy loss characteristics. Testing was limited to four casters, three drive wheels, and three weight distributions. Components were selected, in part, by their variability in design as a means to represent a range of performance. As such, we cannot draw inferences about how these components compare to the myriad other components available on the market. Finally, the canonical maneuvers were defined to represent discrete maneuvers that, when combined, reflect maneuvering of manual wheelchairs. Other canonical maneuvers could have been defined. For instance, a 1 m radius turn (or any radius turn) could have been programmed into AMPs. Indeed, there are an infinite number of canonical maneuvers that could be defined so it is unclear if the ones used in this study were more or less representative than other possibilities. That being said, the selected canonical maneuvers demonstrated a sensitivity to detect and quantify differences in propulsion costs across wheelchair configuration and component selection, which was the objective of this study.
Conclusion
The use of a wheelchair-propelling robot provided precise measurement of propulsion cost of manual wheelchairs. The level of precision and repeatability identified magnitudes of differences across 36 MWC configurations while performing 3 maneuvers on two surfaces. Propulsion cost decreased as the load on the drive wheels increased from 60% to 80% and this decrease was more pronounced on carpet compared to tile. The results clearly indicate that the selection of drive wheels and casters influences the propulsion cost of manual wheelchairs on high and low friction surfaces during tasks that involve both pure rolling (straight trajectory) as well as maneuvers that involve turning trajectories. The relative performance of drive wheels and casters are impacted by the maneuver and surface which illustrates the complex interactions of energy loss under different contexts of use. This finding highlights the utility of using cost measurements during the different maneuvers to model different use scenarios. In other words, one cannot use a single type of maneuver on a single surface to fully describe the performance of drive wheels and casters. Based upon the propulsion costs across weight distributions, one can deduce that the choice of casters is more important when loaded with more weight, that is, in the 60% drive wheel load configuration. Moreover, the results are able to define the magnitude of these differences across different surfaces and trajectories of motion. Specifically, the two pneumatic tires offered overall lower propulsion cost than the low profile solid tire, with the differences between the pneumatic tires being minimal overall while reflecting different cost performance according to surface and trajectory. Two casters, the 4 × 1.5FLSR and 5 × 1 Primo provided the best overall performance during straight and ZRT maneuvers, which highlight rolling resistance and scrub impacts of casters, respectively. The approach is useful in defining differences in cost across different wheelchair configurations that can then be used to define tests using human operators to assess clinical meaningful differences. Simply put, if the AMPS cannot detect a difference in configuration, it is highly unlikely that human operators could do so. As such, AMPS is well-suited to assess equivalency in components and configurations. Assessment of performance equivalency would empower clinicians and users with important knowledge when selecting components. For instance, if two drive wheels were deemed to have equivalent performance—as was found in this study—then the selection could be based upon other subjective factors with the confidence that the decision will not incur a penalty in propulsion effort. This knowledge of performance is currently unavailable to clinicians and users.
Supplemental Material
JRT907819 Supplemental Material - Supplemental material for Manual wheelchair propulsion cost across different components and configurations during straight and turning maneuvers
Supplemental material, JRT907819 Supplemental Material for Manual wheelchair propulsion cost across different components and configurations during straight and turning maneuvers by Stephen Sprigle Morris Huang in Journal of Rehabilitation and Assistive Technologies Engineering
Footnotes
Declaration of conflicting interests
The author(s) declared no potential conflicts of interest with respect to the research, authorship, and/or publication of this article.
Funding
The author(s) disclosed receipt of the following financial support for the research, authorship, and/or publication of this article: This work was supported by the Rehabilitation Engineering and Applied Research Lab at Georgia Institute of Technology and from funding by the National Institute on Disability, Independent Living, and Rehabilitation Research (NIDILRR) of the U.S. Department of Health and Human Services under grant 90RE5000-01-00. The opinions contained in this paper are those of the grantee and do not necessarily reflect those of the U.S. Department of Health and Human Services.
Supplemental material
Supplemental material for this article is available online.
References
Supplementary Material
Please find the following supplemental material available below.
For Open Access articles published under a Creative Commons License, all supplemental material carries the same license as the article it is associated with.
For non-Open Access articles published, all supplemental material carries a non-exclusive license, and permission requests for re-use of supplemental material or any part of supplemental material shall be sent directly to the copyright owner as specified in the copyright notice associated with the article.