
Abstract
Introduction
Clinical practice guidelines for preservation of upper extremity recommend minimizing wheelchair propulsion forces. Our ability to make quantitative recommendations about the effects of wheelchair configuration changes is limited by system-level tests to measure rolling resistance (RR). We developed a method that directly measures caster and propulsion wheel RR at a component-level. The study purpose is to assess accuracy and consistency of component-level estimates of system-level RR.
Methods
The RR of N = 144 simulated unique wheelchair-user systems were estimated using our novel component-level method and compared to system-level RR measured by treadmill drag tests, representing combinations of caster types/diameters, rear wheel types/diameters, loads, and front-rear load distributions. Accuracy was assessed by Bland-Altman limits of agreement (LOA) and consistency by intraclass correlation (ICC).
Results
Overall ICC was 0.94, 95% CI [0.91–0.95]. Component-level estimates were systematically lower than system-level (−1.1 N), with LOA +/−1.3 N. RR force differences between methods were constant over the range of test conditions.
Conclusion
Component-level estimates of wheelchair-user system RR are accurate and consistent when compared to a system-level test method, evidenced by small absolute LOA and high ICC. Combined with a prior study on precision, this study helps to establish validity for this RR test method.
Keywords
Introduction
Importance of RR on UE pain and injury
In the United States, there are over 250,000 individuals with a spinal cord injury (SCI), and annually, there are an estimated 12,000 new injuries. 1 Manual wheelchair users (MWU) with SCI often experience upper extremity (UE) pain and injury.2,3 UE pain and injury can lead to functional limitations 4 that affect participation and activities of daily living. Clinical practice guidelines to preserve UE health after SCI recommend minimizing the force required to complete upper limb tasks, which includes propelling the wheelchair. 5 The force required to propel a wheelchair is strongly affected by rolling resistance (RR), which is the force opposing wheelchair movement and due primarily to energy loss from tires and casters.6–9 RR is affected by many facets of wheelchair configuration, including, but not limited to weight of the wheelchair and user, front-rear load distribution of user plus wheelchair weight, and rear wheel and caster characteristics.7,8,10 Wheelchair configuration recommendations in the clinical practice guidelines focus on minimizing weight, optimizing weight distribution and optimizing user propulsion biomechanics in order to reduce repetitive forces on the UE 5 but provide only general directional guidance. These recommended approaches to minimize repetitive forces directly influence RR, which is a primary contributor to the repetitive force. However, the ability to estimate RR for a specific client weight, wheelchair setup and environment and compare RR forces and tradeoffs for equipment and configuration options for that user during their clinical appointment has been limited by multiple factors. First, most RR test methods measure RR of the entire user-wheelchair system or measure individual components but do not assess combinations of effects, such as surface, misalignment and camber. Second, there is limited availability of data on a wide range of equipment and the lack of an easy to use, user-friendly data format for use in clinical settings.
Testing options
Two strategies for measuring RR are reported in the literature—system and component-level tests. 8 System-level testing evaluates RR of an entire manual wheelchair-user system, whereas component-level testing evaluates RR of either the caster or rear wheel. System-level methods for measuring manual wheelchair RR include drag, deceleration, cart or robotic rig tests, which are conducted using treadmill equipment or over-ground.9,11–15 Component-level methods for measuring manual wheelchair RR includes drum-based testing, which can measure RR forces for one rear wheel or caster, with varying surfaces, camber and toe angle. 16 In addition, system-level ergometer17,18 and dynamometer9,19 tests can be used to generate component-level estimates, by measuring RR of two rear wheels at one time, or cart test 14 measuring four identical wheels at one time. RR test methods can either directly measure RR forces (e.g. drag, drum) or indirectly by quantifying a proxy such as deceleration or power consumption. 16 Direct measurement of RR force allows a more direct comparison across studies (by comparing a measured force rather than proxy measurements) and is thought to be more accurate than indirect measurement,8,20 although each test method has benefits and limitations. 8 Drum-based component level testing was developed to improve test accuracy by directly measuring forces in a controlled environment where potential confounders (caster trail, alignment, camber, etc.) are controlled and measured. The methods compared in this study (drum versus treadmill drag test) both use direct measurement of RR forces.
Benefits and gaps
A benefit of system-level testing is it can be used to evaluate biomechanical inputs relative to propulsion by MWUs, and to compute the external energetic demand of propulsion (i.e. external power output). An important limitation of system-level testing is that the individual effects of wheelchair-user system characteristics, such as rear wheel/caster choice, rear wheel/caster misalignment, and front-rear load distribution, on RR cannot easily be separated. This limitation is why the current clinical practice guidelines can only provide general guidance on what wheelchair configuration changes can help “minimize the force required to complete upper limb tasks” 5 (e.g. moving the rear axle as far forward as possible, which optimizes weight distribution). It is also why clinicians and consumers cannot make fully informed decisions about how to minimize RR when selecting options on a wheelchair order form that clearly impact RR (e.g. rear wheels, casters). This limitation is where component-level RR testing provides a significant benefit. Component-level results could be used to support personalized evidence-based equipment selection decisions during the wheelchair provision process.
Measuring accuracy and precision
It is important to confirm that component-level RR measurements can be used to predict system-level RR before this information can be used to minimize RR. Accuracy is a measure of exactness, the closeness to a true value, often compared to a ‘gold-standard’ which is also referred to as criterion validity, whereas precision is the capability of a test to provide consistent, repeatable results, 21 often evaluated using test-retest methods. The combination of accuracy and precision is required to validate a new test method. Precision was previously evaluated for component-level testing using coefficient of variation (standard deviation (SD)/mean) through test-retest and randomized repeated trials and demonstrated highly repeatable results. 16 The test-retest repeatability for component-level RR was previously evaluated using a reference trial randomly repeated during testing. The test-retest coefficient of variation (SD/mean) ranged from 1.5% to 2.7% for six rear wheels and 0.5%–2.5% for six casters. 16 Accuracy of component-level RR testing still needs to be evaluated. Accuracy, or agreement between methods, is reported by Zaki et al. 22 as most often evaluated using the Bland Altman method with limits of agreement (LOA) and reliability is evaluated using intraclass correlation coefficient (ICC). 23 This study uses both Bland Altman to assess accuracy and ICC to assess reliability and consistency between the two test methods
The goal of this study is to evaluate accuracy, reliability and consistency of component-level drum-based RR testing against system-level treadmill drag tests for a series of simulated user-wheelchair-systems. We hypothesized that component-level test results would accurately predict system-level treadmill tests based on Bland-Altman LOA, with excellent reliability and consistency based on intraclass correlation coefficient (ICC) and 95% confidence intervals greater than 0.9. 23
Methods
Factors and levels.

aTilite.
bPrimoV-track (24″) and Racer (25″).
cShox (24″ and 25″).
dLoad per wheel: Casters 12.3 to 40.6, rear wheels 36.9–81.2 lbs.
Caster dimensions.

Test equipment and methods
Component-level RR
The equipment and method described by Ott et al.
16
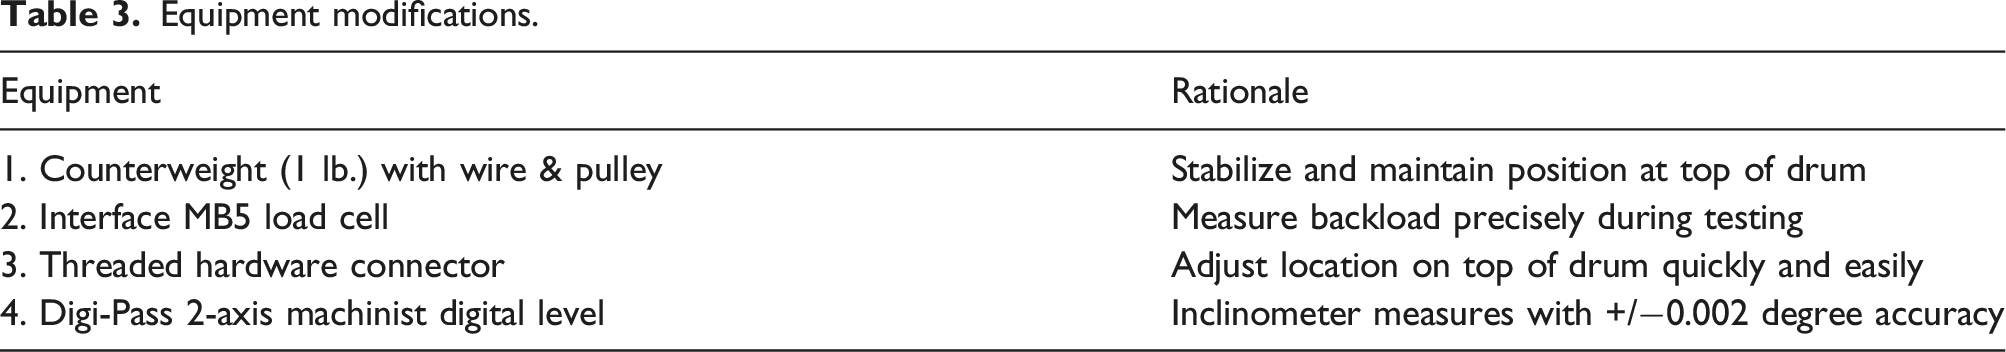
(Figure 1) utilize a four foot diameter rotating drum with arm assembly consisting of four air bearings mounted on parallel rods, connected to the primary load cell to measure RR force. Modifications to improve accuracy (Table 3) include precisely positioning the rear wheels and casters at the top of the drum, and adding a 1 lb. counterweight attached with a wire and a pulley mounted separately from the air bearings, to stabilize the system and maintain top of drum positioning. (Figure 2). The first load cell measures the pullback (RR) force due to energy loss from the rear wheel or caster (referred to as primary force) while a second load cell measures the counterweight force (referred to as backload force). A small residual load (due to the backload) is calculated from the measured angle of the arm assembly, Component-level test equipment 1) rotating drum 2) arm assembly 3) air bearings 4) primary load cell. Equipment modifications. Top down view 1) backload 2) pulley 3) inclinometer 4) load cell for backload. Free body diagram of component-level test where Fp = primary load cell force, Fb = backload load cell force, θ = angle caused by arm deflection from varying applied test weight, A = arm supporting air bearings, B = vertical support for arm, pivot point, C = axle sled (frictionless contact because of air bearings), D = rotating drum, E = propulsion wheel (caster wheel shown with dotted line), W = user and wheelchair weight applied to that wheel.


The RR of each caster and rear wheel were measured under multiple loads (Casters (15, 20, 30, 40, 50 and 60 lbs.) and rear wheels (35, 55, 75 and 95 lbs.)) to generate load versus RR force best fit lines, similar to previously published component level testing.
16
A propulsion speed of 1.0 m/s was previously selected as a standard test speed and was used for this testing.
16
Previous component-level testing evaluated speeds of 0.5 and 1 m/s to assess if speed affected RR force, and found minimal to no effect.
16
For each load, three 60 s trials were completed. During each trial, primary and backload forces were recorded at 150 Hz during seconds 25 to 50, and were averaged to compute primary force and backload force. Residual load was calculated based on one pre-test static inclinometer measurement for each trial using equation (1). The RR force for each rear wheel or caster at each load was calculated with equation (2). A best fit line to predict RR force from load was then generated in excel (using three trial results) with equation (3), where i represents a caster or rear wheel, CT represents component test and 


System-level RR
Wheelchair treadmill drag testing
24
quantified the RR of each of the 144 unique wheelchair systems (Figure 4). For each unique system, the drag force (Fd in Figure 3) required to hold the system in place at five slopes (10%, 8.3%, 6.3%, 4.2%, 2.1%) at 0.44 m/s was measured. The sloped treadmill uses the force of gravity to hold the wheelchair in place and maintain a stable position. The slope of the treadmill bed and cable were measured before each test and the attachment point and/or load cell was adjusted as needed to achieve a parallel slope. At each target slope, the actual grade (deg.) and drag force (N) was documented. Drag force was the 20 s running average measured by the strain gauge. The actual caster and rear wheel load (% and lbs.) were measured before each drag test. User weight was simulated with cast iron weights fixed to the wheelchair seat and footrest. Treadmill testing followed the established standard approach of measuring drag force at multiple slopes and performing linear regression to determine the force at zero degree slope.
24
For each wheelchair system (i) tested, the relationship between slope and drag force was modeled with linear regression using equation (5), where subscript TM indicates treadmill and Free body diagram of system level wheelchair treadmill drag testing equipment, where Fd = drag force, s = slope angle, mg = wheelchair and user weight, Ncos(s) = normal force at angle s, and v = velocity.

Statistical analysis
Mean RR for each method, differences in RR between methods, and SD for mean and difference between methods are reported overall and for all factors evaluated. Apriori criteria for removing outliers included removing data related to testing errors. Five tests were removed based on operator error that impacted sequential test runs on one test date (25″ solid tire with 5″ polyurethane caster at 140 lbs. (30, 40%) and 180 lbs. (20, 30 and 40%). Normal distribution was met for each of the 16 wheelchair equipment configurations for system and component testing, with the exception of 24 inch pneumatic/4 inch soft roll combination with system level testing (p = 0.031) based on Sharpio Wilk. Analysis of variance (ANOVA) is used to compare mean differences between test methods for six factors from Table 1 (α = 0.05). Accuracy between methods is determined using 95% LOA from Bland Altman (BA) plots.
22
Mean and SD for each method and difference between methods are reported. Consistency between methods is determined using intraclass correlation coefficient (ICC). ICC (3,1 - two-way mixed effects, consistency, single rater/measurement) and 95% confidence intervals are reported, with 0.75–0.9 indicating good reliability and greater than 0.9 indicating excellent reliability.
23
This ICC model compares two raters (two test methods) as a fixed effect and subjects (n = 144 simulated systems) as a random effect, and evaluates consistency of results, where consistency evaluates how one score correlates to another score including a systematic error or bias.
23
The BA plots illustrate the RR difference (y axis) versus mean RR force between methods (x axis) for all conditions (N = 144). Mean difference was computed as difference = Component-System and mean RR as (Component + System)/2. LOA are calculated using LOA = mean difference +/−1.96
Results
System RR, component RR and difference between methods - mean (N), SD.

aSignificant differences observed.
Accuracy of component-level versus system-level - BA by factor
Results by factor are detailed below. The RR mean difference (−1.1 N) and 95% LOA +/−1.3 [-2.4 to 0.2 N], which are displayed as lines on the BA plots, and indicate predictions of system-level RR, are within +/−1.3 N of system RR force. On a percentage basis, the mean difference between component and system level tests is −28% with range of 19% to −97%, with frequency illustrated in (Figure 5). Frequency of percent difference between methods.
Load
RR forces increase as load increases from 100 to 180 lbs. Mean difference between methods and SD remain constant across load (Figure 6, Table 4). BA load.
Front-rear load distribution
RR forces are similar for the three load distributions evaluated. Mean difference between methods is statistically significant (p < 0.001). As front caster load is increased (20–40%), the mean difference in RR force increases. Variation (SD) remains constant (Figure 7, Table 4). BA front-rear load distribution.
Rear wheel type
RR forces for pneumatic tires are lower than for solid tires. Mean difference between methods and SD remain constant across rear wheel type (Figure 8, Table 4). BA rear wheel type.
Rear wheel size
RR forces are similar for both rear wheel sizes. Mean difference between methods and variance (SD) remains constant across rear wheel size (Figure 9, Table 4). BA rear wheel size.
Caster type
RR forces are similar for polyurethane and soft roll casters. Mean difference between methods and variance (SD) remain constant across caster type (Figure 10, Table 4). BA caster type.
Caster diameter
RR forces are lower for 5″ diameter casters. Mean difference between methods is statistically significant (p < 0.001). 5″ diameter casters have a larger mean difference (−1.4 N) compared to four″ casters (−0.9 N). Variance (SD) remains constant across caster size (Figure 11, Table 4). BA caster diameter.
All factors
A linear relationship for component-level system estimates versus system-level drag force is shown in Figure 12, with reference line with slope = 1 (Figure 12). Component-level system estimates versus system-level drag force (N).
Discussion
We found excellent consistency between the component-level and system-level testing based on ICC, indicating that component-level estimates of system-level RR are very similar to system-level RR measurements on a drag test. Component-level estimates are systematically lower than system-level measurements. The extent of accuracy is reflected in the systematic bias (−1.1 N) and prediction intervals (+/− 1.3 N LOA). Determining acceptability of LOA for this study requires an understanding of how much precision and accuracy are needed, and should be assessed relative to clinical or biological considerations and determined a priori. 25 It is unclear if this level of accuracy is sufficient. We first need to define what changes in RR are meaningful to the user and then determine if our component based method can identify wheelchair configuration changes that would achieve meaningful changes in RR. Understanding the minimal clinically important difference in RR, which is the smallest difference perceived by the patient to be beneficial, 26 would also help determine the if the observed LOA is acceptable. Although the minimum clinically important differences in RR forces for manual wheelchair propulsion are not reported in the literature, physiologically significant differences have been studied, where tire pressure differences produce measurable changes in oxygen consumption. DeGroot et al. 11 found a significant difference in oxygen uptake comparing tires inflated at 25 and 100 psi, which equated to 3.3 N difference in RR force, and others found similar results. 27 Our LOA of +/−1.3 N (range of 2.6 N), is somewhat smaller than the 3.3 N difference in RR force from DeGroot.
Although more research is needed to define the minimum clinically important differences to compare with our LOA measurement, this very limited data indicates the LOA may be near or below the range of a minimum clinically important difference for manual wheelchair users. Our hypothesis that component-level tests would consistently and accurately predict system-level tests was partially confirmed, with consistency between methods confirmed and accuracy requiring further study to determine the degree of accuracy required. This study is, to the best of our knowledge, the first component level versus system level test comparison between two independent research groups. To determine if this level of accuracy is sufficient or not, more research is required.
A previous study on component-level RR evaluated test-retest repeatability using coefficient of variation (SD/mean) of RR forces, and found the coefficient of variance ranged from 1.5% to 2.7%. 28 Variance was evaluated by randomized repetition of a standard test condition during testing (rear wheels at 75 lb. load, casters at 50 lb. load). These results indicate the high precision capability of this equipment. Combining results for precision and accuracy begins to establish the validity for this RR test method.
Implications for researchers, manufacturers and clinicians
Component-level testing provides several benefits for researchers, manufacturers, and clinicians. First, for researchers, component-level RR testing provides a quick, highly reliable lab test that can accurately predict system RR and evaluate various surfaces and factors (load, misalignment, tire inflation levels, camber). The test equipment design is publicly available 29 and can be replicated by any testing facility. Second, for manufacturers, it can provide the ability to incrementally test new products and provide performance-based feedback to designers to improve products. The rapid testing of new designs and equipment could quickly and efficiently improve available equipment options and support advancement in the design and development of lower RR tires and casters for manual wheelchairs. Third, for clinicians, it can provide actionable information to guide equipment selection and reduce RR of custom manual wheelchairs in daily practice and enable MWU’s to be more engaged in assessing tradeoffs and determining the RR performance of their equipment. For example, consider an individual who weighs 180 pounds and is considering either a pneumatic tire/soft roll caster or airless insert tire/polyurethane caster for their wheelchair. The RR of the airless insert setup (8.6 N) compared to the pneumatic tire setup (3.2 N), (based on testing from this study), is 168% higher, which is a large difference, especially when considering the average wheelchair user propels 1.3 miles per day. 30 Component-level testing enables system-level equipment decision making by providing the data necessary to evaluate individual decisions. Currently there are no specific system predictions available to estimate RR for specific user plus manual wheelchair combinations, and the potential improvement for equipment selection is thought to be substantial.
We considered if the accuracy of the component-level test is sufficient for meaningful system-level predictions. Considering the previous example, for a system RR of 3.2 N, accuracy of +/−1.3 N represents +/−40% of the system RR force, whereas for a system RR of 8.6 N, +/− 1.3 N represents +/−15%. Clearly for higher system RR force, the variation of +/−1.3 N has a smaller impact on the accuracy in percentage terms. It is important to provide accurate estimates for higher RR systems, because this represents elevated and potentially damaging UE repetitive strain. In addition, the ability to predict system RR for each individual MWU, even with +/− error range of prediction, is an improvement versus what is currently available. The development and validation of this test provides the capability to assess and optimize equipment selection for each individual MWU to improve wheelchair prescription, which could result in reduced UE pain and injuries.
Differences between methods
Front-rear load distribution was the factor with the largest differences between methods. As the wheelchair load distribution on the casters increased from 20% to 40%, the mean difference between methods increased (−0.7, −1.1 -1.6 N) respectively. The bias observed may be due to a shift in front-rear load distribution from front casters to rear wheels during the system-level treadmill test due to the incline of the treadmill. This shift in load would decrease the impact of caster characteristics and increase the impact of rear wheel characteristics on estimated system-level RR. For predicting actual RR, component-level testing may be more accurate than treadmill-based system tests because no load shifting can occur. Caster diameter had a statistically significant difference between methods, with −0.9 N for 4″ and −1.3 N for 5″ diameter casters, but the reason for this difference is not known. Factors that may contribute to the −1.1 N mean difference include: 1) differences in the treadmill material and texture between the component-level and system-level tests, and 2) caster misalignment of the wheelchair system used in system-level testing, which was not measured, and which can increase RR compared to the perfect alignment we used and verified in each component-level test.
System-level test-retest repeatability between test centers
There are few studies evaluating precision or accuracy between RR test methods. In a multi-center study by DeGroot et al. 24 , system-level testing had a measurement error objective of 0.5 N or less during testing, with six of eight centers meeting this standard. In this study, DeGroot et al. 24 evaluated wheelchair drag test (the system-level test used in this study) on identical equipment at eight different testing centers and found test variation was due to differences in treadmill slope (target vs actual), as well as wheelchair and test set-up differences (load transducer height, rope attachment). The mean RR drag force (10N) from eight test centers had standard deviation (SD) of 3.2 N and range of 6.7–16.3 N. The DeGroot study highlights that small differences in equipment, setup and calibration can impact the consistency of results. Our variation of +/−1.3 N is well within their testing range.
A study by van der Woude et al. 31 compared two different RR test methods in a manner similar to our study. They compared push force versus treadmill drag test methods, and found +1.3 N higher push force versus treadmill, with SD of 2.1 N (push force) and 0.8 N (drag tests). Our results were similar to van der Woude, both for difference between methods (−1.1 N) and SD (1.9 N, 1.8 N). This indicates that the differences we found comparing RR test methods are within the range that other researchers have found, further validating our findings. It also indicates that over-ground drag testing might be more accurate than treadmill drag testing for measuring system level RR.
Misch et al. 32 modeled mechanical propulsion cost with straight and curved trajectories using cart deceleration RR force compared with robotic system-level tests. For straight line propulsion, RR was a predictor of propulsion cost (R2 = 0.96), and for combined straight and curved trajectories, RR and inertial forces were predictors of propulsion cost (R2 = 0.84), both indicating RR forces are directly correlated to propulsion effort for a robotically controlled propulsion scenario. No differences in predicted forces were reported that can be compared with this study.
There is variation inherent in system and component testing methods. For system-level testing, shifting of front-rear load distribution from casters to rear wheels on an inclined treadmill, alignment between the height of the force transducer and attachment to the wheelchair and accurate control of treadmill angle are important for consistency. 24 For component-level testing, positioning of the wheel or caster relative to top center of the drum and positioning of the inclinometer are important for consistency. Tightly controlling these variables and using a reference standard during testing have provided repeatable results and a method for quality control for component-level testing. One benefit of component-level testing is eliminating sources of variation inherent in system-level testing, such as differences in treadmill angle24,33 and wheelchair test set-up. 24
Equipment selection
Ott et al. 34 surveyed two hundred MWU’s and found that about half of manual wheelchairs utilized solid or airless insert tires, despite higher RR. There are many possible reasons, including concerns about stranding if a pneumatic tire went flat, user history that carries over to new wheelchair orders, default options on equipment order forms, difficulty with air pressure maintenance, lack of awareness of importance by clinicians or suppliers, or lack of time during clinic visit to discuss options to minimize RR. Ott et al. 34 also found that pneumatic tires were significantly underinflated, with average inflation of 40%, but that RR for underinflated tires was still significantly lower than for airless insert tires. Component-level test results would help clinicians, suppliers and MWU’s to quantify equipment options relative to clinical practice guidelines and help inform choices for minimizing RR, which may result in optimized equipment selection and/or development of lower RR solid tires and casters.
Study limitations
The equipment evaluated was limited (4 rear wheels, 4 casters), all of which have smooth tread. A broader range of rear wheels (knobby tires, low pressure tires) and casters (other sizes and types) should be evaluated to verify the results. The highest wheelchair-user system estimated RR forces were for the scenario of a 180 lb. MWU, so MWU weight greater than 180 pounds should also be evaluated. Wheelchair load distribution for system-level tests on inclined treadmills are subject to weight shift, which effects the RR comparison. A limitation is that treadmill based testing does not allow surface testing. Additional work needs to be done to evaluate consistency component-level tests to predict system level tests.
Conclusions
Component level estimates of wheelchair-user system RR are consistent when compared to a criterion system-level method, evidenced by high ICCs, and small mean differences. The mean difference in RR forces between the two methods indicate there is a bias (−1.1 N), as higher scores are consistently measured with system-level versus component-level testing. Component-level results predicted system-level RR within +/− 1.3 N of system RR force, and were consistent across most factors evaluated, except load distribution and caster diameter. This study is one step in evaluating the accuracy and consistency of component-level versus system-level tests. This study builds on prior test-retest repeatability evaluations of component-level precision, and combined, begins to establish the validity for this RR test method. Further work to validate across other rear wheels and casters, other equipment setup conditions, over-ground drag testing, and during propulsion would further establish the accuracy and validity of this component-level test method.
Footnotes
Acknowledgements
We would like to thank the ISWP-Standards Working Group for their continued support of this research, Andrew Mudreac for conducting system-level testing, and Fusion Medical for donating some of the casters and tires used in the system-level testing. All system-level testing occurred at the University of Miami.
Declaration of conflicting interests
The author(s) declared no potential conflicts of interest with respect to the research, authorship, and/or publication of this article.
Funding
The author(s) disclosed receipt of the following financial support for the research, authorship, and/or publication of this article: This work was supported by the Improving Health and Function Through Use of Performance Standards in Wheelchair Selection Grant # 90REGE0001-02-00, U.S. Agency for International Development through Agreement Nos. APC-GM-0068, SPANS-037, APC-GM-0107, and FY19-A01-6024, National Institute of Neurological Disorders and Stroke (NINDS) R25NS083064 and The Miami Project to Cure Paralysis.
Guarantor
JP
Contributorship
JP and REC conceived of the manuscript. HWJ conducted drum based component-level test method development, testing and data analysis. REC conducted the system-level data analysis. JP and REC secured funding for the study. HWJ wrote the first draft of the manuscript. All authors reviewed and edited the manuscript and approved the final version of the manuscript.