
Abstract
Regular use of standardized observational tools to assess nonverbal pain behaviors results in improved pain care for older adults with severe dementia. While frequent monitoring of pain behaviors in long-term care (LTC) is constrained by resource limitations, computer vision technology has the potential to mitigate these challenges. A computerized algorithm designed to assess pain behavior in older adults with and without dementia was recently developed and validated using video recordings. This study was the first live, real-time evaluation of the algorithm incorporated in an automated system with community-dwelling older adults in a laboratory. Three safely-administered thermal pain tasks were completed while the system automatically processed facial activity. Receiver Operating Characteristic curves were used to determine the sensitivity and specificity of the system in identifying facial pain expressions using gold standard manual coding. The relationship between scoring methods was analyzed and gender differences were explored. Results supported the potential viability of the system for use with older adults. System performance improved when more intense facial pain expressiveness was considered. While average pain scores remained homogenous between genders, system performance was better for women. Findings will be used to further refine the system prior to future field testing in LTC.
Introduction
It is estimated that over half of older adults with dementia suffer from pain.1,2 Pain in people with dementia however, remains underassessed and undermanaged compared to pain in individuals without cognitive impairments.3–7 One of the main contributors to underassessed and undertreated pain in people with dementia is a frequent reliance on traditional methods of pain assessment, specifically the self-report of pain which requires a certain level of cognitive and linguistic ability. 8 As many individuals with severe dementia have difficulties in the ability to communicate verbally, self-report methods may not always be suitable for their pain assessment.9–11 To address this problem, standardized observational approaches focusing on non-verbal expressive behaviors, such as facial expressions, have been developed and validated in the assessment of pain of older adults with dementia. 9
Considering the high prevalence of pain among residents of long-term care (LTC) facilities,12,13 standardized pain assessments completed regularly by health care professionals have been shown to be associated with beneficial outcomes for residents (e.g., improved pain management practices) and reduced stress for staff.14,15 Limited staffing and resources as well as insufficient continuing staff education have often interfered with the implementation of effective pain assessment methods in LTC settings.16,17
Technology has the potential to benefit the lives of older adults while also mitigating the impacts of staffing and resource limitations in health-care. 18 Smart technologies that rely on machine learning and artificial intelligence designed for residents with dementia have shown considerable promise.19–22 In particular, computer vision systems have been explored to address the limitations of continuous direct observation by staff, which in turn could guide interventions tailored to the specific needs of LTC residents.23,24
In the area of pain, computer vision algorithms have been developed to detect and recognize specific pain behaviors including facial expressions of pain. 25 Facial analysis algorithms have been developed using datasets of young and middle-aged adults.25–28 Consequently, such algorithms do not tend to perform well in investigations of older adults due to a lack of available training data that include older populations with facial wrinkling that may be misinterpreted as facial expressions. 29 Moreover, biases in algorithm performance have been found for a number of variables including: age, gender, ethnicity, and cognitive ability.30,31 These biases largely stem from the datasets that were used to develop the algorithm as video recordings used for training purposes often are largely homogenous. 32
Recently, an automated pain behavior detection algorithm has been developed, using advanced machine learning and deep learning techniques, to detect and monitor facial expressions of pain in older adults with and without dementia. 33 In contrast to prior methods, a significant modification of the algorithm was that it uses pairwise pain detection where a target frame is compared to a reference frame from the same individual, thus reducing sensitivity to wrinkles and other idiosyncrocies. 33 This also increases the number of frames within a sample that can be used to train the algorithm and account for changes in facial expression and provides more context for analysis. Another modification included introduction of a contrastive training method and allowing for the algorithm to be trained based on multiple datasets, resulting in a more generalizable and clinically useful system.33,34 This modified algorithm is the first fully automated system to be validated using a large video dataset depicting faces of older adults with dementia.
The performance of the Rezaei et al. algorithm 33 has been evaluated based on annotations of video datasets depicting older adults displaying facial pain expressions. Based on Receiver Operating Characteristic (ROC) curve analyses, the algorithm achieved an area under the curve (AUC) of 0.83 (per frame) for faces of older adults with dementia and an AUC of 0.86 (per frame) for faces of older adults without dementia. 33 Performance of the algorithm increased when rolling windows were considered.
The primary objective of this study was to conduct the first real time evaluation of the automated pain behavior detection algorithm in a laboratory setting. The efficacy of the system in detecting and analyzing facial expressions of pain was examined using ROC curve analyses and specifically investigated for possible gender-based differences. The relationship between the analysis of facial expressions by the system, trained coder annotations, and self-report pain ratings was also examined. An additional objective was to determine the relative ability of specific pain-related facial movements to predict system performance and self-report pain intensity ratings. Finally, this study investigated the covariation of nonverbal pain cues with continuous self-report pain intensity ratings rather than single retrospective self-report ratings.
Method
Participant selection
Summary of demographic variables.

Measures
Demographic questionnaire
Participants completed a demographic questionnaire which included questions regarding age, gender, ethnicity, education, any medical diagnoses, medications, and chronic pain.
Facial action coding system (FACS)
The FACS35,36 is a fine-grained and objective indicator of anatomically-based facial muscle movements. These movements (e.g., cheek raising, brow lowering) are categorized into discrete action units (AUs) and are systematically coded by trained coders for their intensity and frequency using specified criteria. In total, the FACS evaluates 44 facial AUs. The FACS has been used extensively in research examining nonverbal pain behaviors and is a reliable and valid approach to quantify facial pain expressions.37,38 It has been found to successfully differentiate between genuine and exagerated facial pain expressions as well as between baseline facial activity and pain-related facial activity.37,39 The FACS can be used to assess facial pain expressions in younger and older adults including older adults with dementia.9,39–42
Certain AUs have been consistently found to be related to facial activity during pain including brow lowering (AU4), cheek raising/lid compression (AU6), lid tightening (AU7), nose wrinkling (AU9), upper lip raising (AU10), and eye closure (AU43).43,44 Given the intensive and rigorous requirements of FACS coding, a scoring approach focusing on pain-related AUs has been used in previous research.43,44 This FACS-based scoring approach has been validated and determined to be reliable.25,42,44–48 Using this approach, trained coders watch video recordings and code the frequency and intensity of the pain-related AUs. Certain AUs are combined into a single action due to their co-occurrence. 44 AU6 and AU7 are combined as orbit tightening. AU9 and AU10 are combined as levator contraction. AU4 and AU43 are coded independently as intended through FACS. To score a facial expression, the intensity of brow lowering, orbit tightening, and levator contraction is coded from 0 (i.e., no action) to 5 (i.e., maximal action), while eye closure is coded as either 0 (i.e., absent) or 1 (i.e., present). A global pain score composite for each facial expression is then calculated by summing the scores of the four pain-related facial actions from 0 to 16. 44
Computerized visual analogue scale (CoVAS)
The CoVAS is an electronic measurement device that uses a moveable handle that can slide along a horizontal bar measuring 100 mm in length and signifying a visual analogue scale. Visual analogue scales are single-item, continuous scales that measure an individual’s subjective experience such as pain intensity either on a line anchored by two extreme poles (i.e., no pain to worst pain) defined on a paper. 49 The CoVAS is offered by Medoc Advanced Medical Systems Ltd (Ramat Yishay, Israel) as an accessory assessment tool for the TSA-II NeuroSensory Analyzer. Differing from the conventional paper version, the CoVAS allows for the evaluation of pain intensity from “not intense at all” to “most intense possible” in real time and is measured continuously by handle placement on the bar. The CoVAS has been used in studies to measure pain intensity ratings.50–53
Equipment and software
TSA-II neurosensory analyzer
The TSA-II NeuroSensory Analyzer is an advanced thermal stimulation device developed by Medoc Advanced Medical Systems Ltd (Ramat Yishay, Israel). This device can generate precise thermal stimulation designed to safely administer cold- and heat-induced pain. The TSA-II operates through using a thermode with a 32 mm2 metal plate which is placed on the skin. It can be programmed to deliver specific thermal pain at varying levels and multiple trials. The thermode produces temperatures between 0°C and 55°C at a rate of up to 8°C per second. As a safety feature, a manual trigger allows for the immediate discontinuation of the thermal stimulation with a return to a baseline temperature. The TSA-II has been used in quantitative sensory testing examining pain54–56 and has been safely used with older adult populations.46,57,58 Participants underwent three thermal pain stimulation tasks including pain threshold, pain tolerance, and a 5-trial pain-induction task. Maximum temperatures were in accordance with the thermal stimulation cut-off limits used in other laboratory studies with older adults.57,59
Automated pain behavior detection system
The automated pain behavior detection system uses an algorithm to detect and monitor pain behaviors of older adults with and without dementia.33,42 The specific algorithm 33 that was used is a deep learning model and its training data included videos of older adults with and without dementia expressing movement-exacerbated pain. To the best of our knowledge, this model is the first fully automated system to be validated using faces of older adults with and without dementia. 33
Accuracy, based on recorded front view videos, was evaluated for single frame predictions and rolling window predictions in which a single aggregated maximum pain score was calculated. Based on previous ROC curve analyses, the model achieved an AUC of 0.83 (per frame) and 0.86 (rolling window of 20 s) for a dataset of older adults with dementia and an AUC of 0.86 (per frame) and 0.85 (rolling window of 20 s) for a dataset of older adults without dementia. The model achieved a correlation coefficient of 0.48 (per frame) and 0.82 (rolling window of 20 s) for older adults with dementia and a correlation coefficient of 0.58 (per frame) and 0.70 (rolling window of 20 s) for older adults without dementia in relation to “gold standard” manual annotations by trained FACS coders. 33
The algorithm operates by analyzing facial expressions in real-time from individual frames through pairwise pain detection such that a target frame is compared to a reference frame. 33 A target frame contains the facial expression to be analyzed while a reference frame contains a neutral facial expression of the same individual. Pain detection is achieved by identifying specific AUs associated with pain as indicated by a simplified FACS-based scoring approach.43,44 The model is trained to directly estimate a global composite pain intensity score of 0 (i.e., no pain) to 16 (i.e., extreme pain) for each facial expression on a frame-by-frame basis.
This investigation evaluated the system to accurately detect and monitor facial expressions of pain in real time on individual frames. A high-definition video camera was used to record participants’ facial expressions using front view positioning. As this system is ultimately intended for use in clinical settings (after an additional field study), an optimal pain threshold score for staff notification was needed. This pain threshold score is derived from the FACS-based scoring approach43,44 that the algorithm uses to calculate a pain intensity score ranging from 0 to 16. Based on prior analyses and preliminary testing, the system-generated pain threshold score that was initially used was 0.2.33,44 ROC analyses were conducted and initial results suggested that the recommended corresponding FACS-based pain threshold to be used to classify a frame as pain from no pain would be a score of 2 or 3 out of 16. Of note, while the system uses FACS-based coding in calculations, the system-generated scores do not correspond one-to-one with FACS-based scores in magnitude but trend in a similar manner.
The system was programmed to generate a notification that a pain expression was detected when the algorithm detected a facial pain expression over the system-based pain threshold score of 0.2 in five frames within a three-second timespan. This decision was based on the findings 33 that the algorithm achieved greater accuracy for rolling windows compared to single frames. Additionally, this approach to notification is a more ecologically valid method as this is how observers in clinical settings evaluate pain. 33
Procedure
Recruited primarily through advertisements, eligible participants were invited to the Health Psychology Laboratory to participate in the study. Upon arrival, the purpose and procedure of the study were described. After participants provided written and verbal consent to take part in the study, a demographic questionnaire was completed. They were then asked to sit in front of the video recording equipment and were given a demonstration of the TSA-II. They were provided with the instructions for the three thermal pain tasks and informed that they may immediately discontinue at any point during the pain tasks by verbally indicating to the experimenter. The thermode of the TSA-II was positioned on the participant’s non-dominant forearm at approximately the mid-forearm.
Once participants were positioned to begin testing, the automated pain behavior detection system was turned on and captured three reference images of the participant’s face displaying a neutral facial expression. Participants completed a baseline measurement for 120 s in which the thermode was heated to 32°C and then three thermal pain tasks. Participants completed self-report CoVAS pain intensity ratings during baseline and all thermal pain tasks and were filmed throughout.
For the pain threshold task, the thermode was set at 32°C and increased by 0.7°C per second up to the maximum temperature of 50°C and held for 5 s. Participants were asked to discontinue the task as soon as they felt any pain (i.e., the most minimal level of pain experienced). The temperature at which the task was discontinued was measured as the pain threshold temperature. If the task was not discontinued prior to task completion, the pain threshold was measured as 50°C. This task was repeated three times to calculate an average pain threshold temperature.
60
For the pain tolerance task, the thermode was set at 32°C and increased by 0.7°C per second up to the maximum temperature of 50°C and held for 5 s. Participants were asked to discontinue the task when they could no longer tolerate the pain. The temperature at which the task was discontinued was recorded as the pain tolerance temperature. If the task was not discontinued prior to task completion, the pain tolerance was measured as 50°C. This task was repeated three times to calculate an average pain tolerance temperature.
60
For the 5-trial pain-induction task, the thermode was set at 32°C and increased by 0.7°C per second up to the peak temperature of 49°C. Once the peak temperature was reached, it was held for 10 s before decreasing to the baseline temperature at a rate of 7°C per second where it was held constant for 10 s before increasing again for a total of five repetitions (see Figure 1). Graphical representation of the thermal pain stimulus application.
During the video recording, the algorithm of the system automatically processed the facial expressions of the participants. As the algorithm employs the FACS-based protocol 44 for coding facial pain expressions, the algorithm processed scores ranging from 0 to 16. When the algorithm detected a facial pain expression over the predetermined threshold score of 0.2 (algorithm score) in five frames within a three-second timespan, a light was turned on and an email notification sent to the experimenter. After completing the thermal pain tasks, participants were debriefed on the study.
Following testing, one trained coder examined the video recordings of participants completing the baseline task and the 5-trial pain-induction task and completed frame-by-frame manual FACS-based coding. A second trained coder coded a randomly selected 20% of the video recordings to calculate inter-rater reliability for absolute agreement. For the 5-trial pain-induction task, results demonstrated a high degree of reliability, ricc = 0.845, (95% CI = 0.841-0.849). Inter-rater reliability was assessed using percent agreement for the baseline task due to a lack of variability in the manual coding. Results demonstrated a high degree of reliability with 98.7% agreement.
Analyses
Descriptive statistics were calculated for all dependent variables. The effectiveness of the TSA-II in inducing pain was examined through paired samples t-tests (baseline vs painful stimulation). To estimate system performance, the pain intensity coding by the system was compared against the gold standard FACS-based manual coding. ROC curve analyses were conducted to evaluate the performance of the system. A binary classification was used for all facial expressions (pain or non-pain) dependent on a FACS-based cut-off pain threshold score. The video recordings were re-analyzed retroactively accounting for the adjusted pain threshold cut-off scores. Therefore, sensitivity and specificity indices were calculated using the full range of possible FACS-based pain threshold cut-off scores from 1 to 16. ROC curves were estimated for all possible cut-off pain threshold scores and the AUC was examined. The closer the area’s value is to 1, the better the performance of the system. The significance (p < 0.01) of each AUC value was compared against a null AUC value of 0.5 indicating random chance. Separate ROC curve analyses were conducted as a function of gender.
To evaluate the relationship between the various pain assessment methods used in the study and stimulus temperatures, a series of correlations were calculated from the 5-trial pain-induction task. Pearson correlations were calculated between the gold standard FACS-based manual coding, system-generated scoring, continuous self-report CoVAS pain ratings, and TSA-II temperatures. To determine the relationship between specific pain-related facial AUs with system performance and average self-report CoVAS pain ratings, regression analyses were conducted.
Results
Baseline versus pain task comparisons
Summary of descriptive statistics for baseline and thermal pain tasks.
Note. 1Based on the current study, the maximum pain detection was scored at 5.33 by the algorithm; however, greater scores are possible with greater facial pain expressiveness. CoVAS: computerized visual analogue scale. N = 65.
Comparison of baseline pain scores with thermal task pain scores.

*p < 0.001. N = 65.
ROC curve analyses
Correspondence of manual FACS-based pain scoring and pain scoring by the automated pain behaviour detection system.

Note. FACS: Facial action coding system.
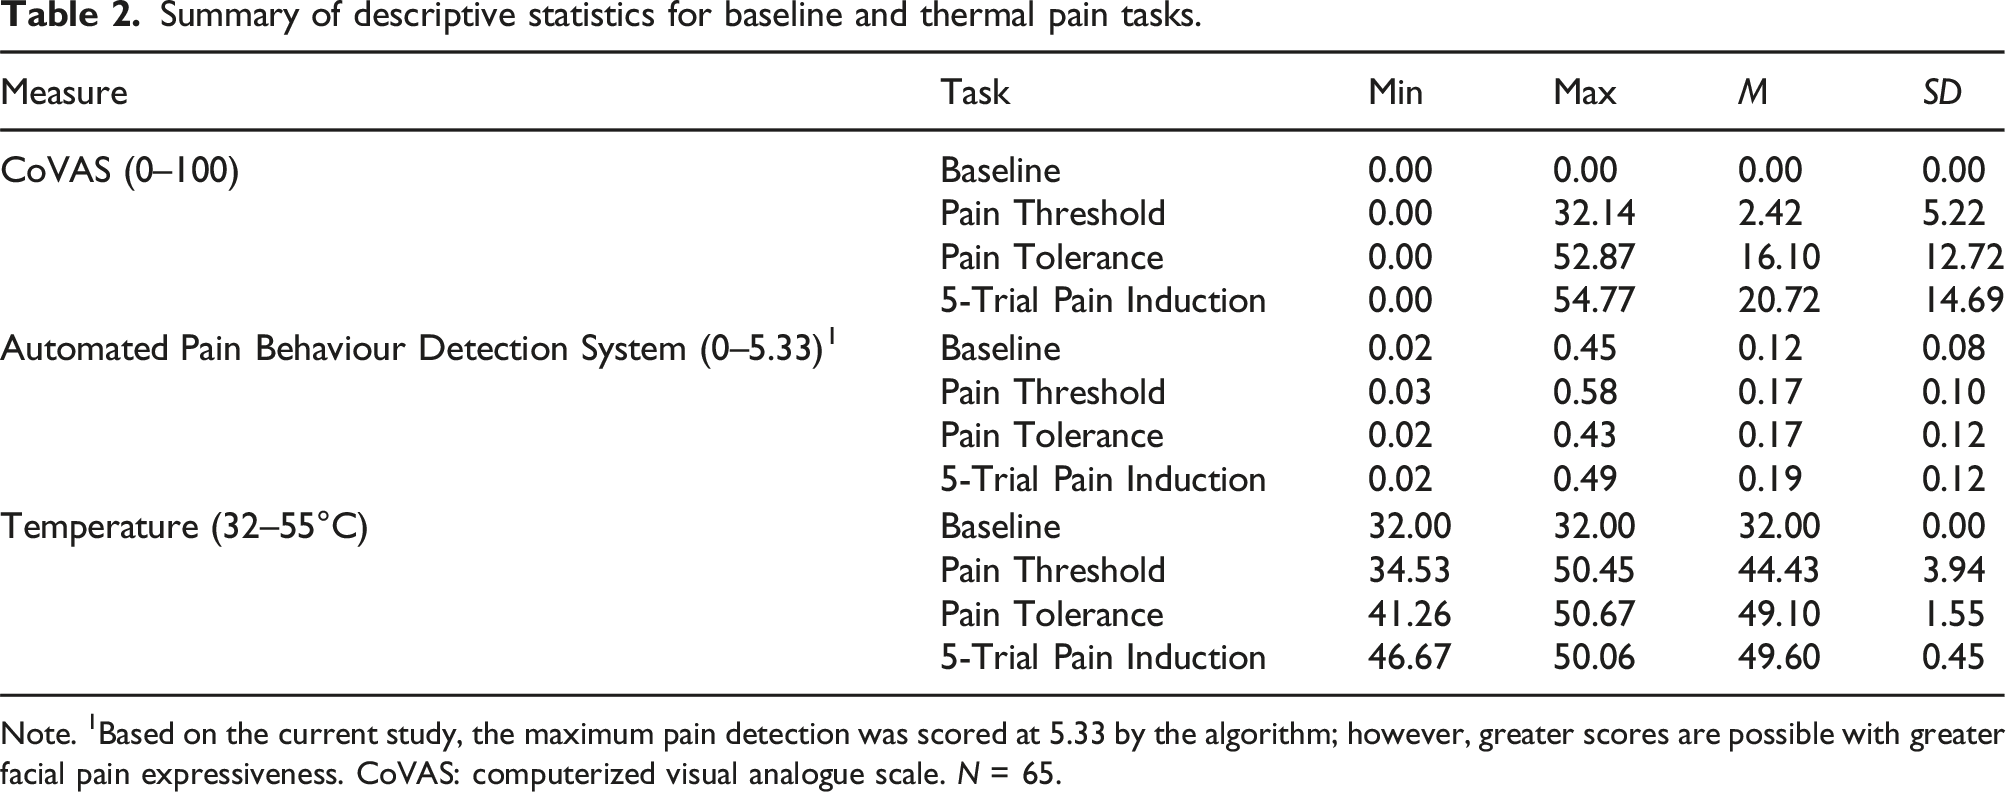
Sensitivity and specificity indices were used to evaluate the performance of the system to discriminate between pain and non-pain facial expressions on a frame-by-frame basis during the 5-trial pain induction task. This involved scoring each frame according to the gold standard manual coding. A binary classification was used for all facial expressions to discriminate facial pain expressions from non-pain expressions as determined by a gold standard FACS-based cut-off pain threshold score. Sensitivity and specificity indices were calculated using the full range of possible FACS-based cut-off pain threshold scores from 1 to 16 as varying cut-off pain threshold scores may be used in clinical care dependent on setting and population.
Range of sensitivity and specificity from optimal criterion values (system-generated scores) for ROC curves corresponding to each pain score of the FACS-based scoring approach.1

Note. 1Prkachin & Solomon, 2008. AUC: area under the curve. *p < 0.01. FACS: Facial action coding system.

Receiver operating curves for facial action coding system-based cut-off pain scores 1–4.

Receiver operating curves for facial action coding system-based cut-off pain scores 5–8.

Receiver operating curves for facial action coding system-based cut-off pain scores 9–12.

Receiver operating curves for facial action coding system-based cut-off pain scores 13–16.

Area under the curve values for ROC curve analyses for each facial action coding system-based cut-off pain threshold value.

Visual comparison of gold standard manual pain coding and pain intensity scores by the automated pain behavior detection system during the 5-trial pain-induction task. This figure shows an example participant. The top line graph depicts the gold standard manual pain coding scores (x-axis) over the entire duration of the thermal pain task (y-axis) in frames for one participant. The corresponding top bar graph simplify the manual pain coding scores by providing a visual representation of pain (red bars) versus non-pain (green bars) scoring over the cut-off pain threshold score of 4. The bottom line graph depicts the pain scoring by the automated system (x-axis) over the entire duration of the thermal pain task (y-axis) in frames for the same participant. The corresponding bottom bar graph simplifies the system scores by providing a visual representation of pain (red bars) versus non-pain (green bars) scoring over the criterion pain score of 0.2. The greater the size of the red bar indicates the length of time pain was scored as being present during the task.
Gender-based analyses
The performance of the system was explored as a function of gender. The sample was largely balanced as approximately 57% of participants were female and 43% of participants were male. The sample was also homogenous in terms of age. Two multivariate analyses of variance (MANOVAs) were conducted to compare the facial pain expressiveness of male and female participants during the 5-trial pain induction task.
Gender differences in pain scoring by the automated pain behaviour detection system and FACS-based manual coding.

Note. FACS: Facial action coding system.
ROC curve analysis results for gender-based exploration of the performance of the automated pain behaviour detection system using pain scores of the FACS-based scoring approach.1

Note. 1Prkachin & Solomon, 2008. AUC: area under the curve. *p < 0.001. FACS: Facial action coding system.
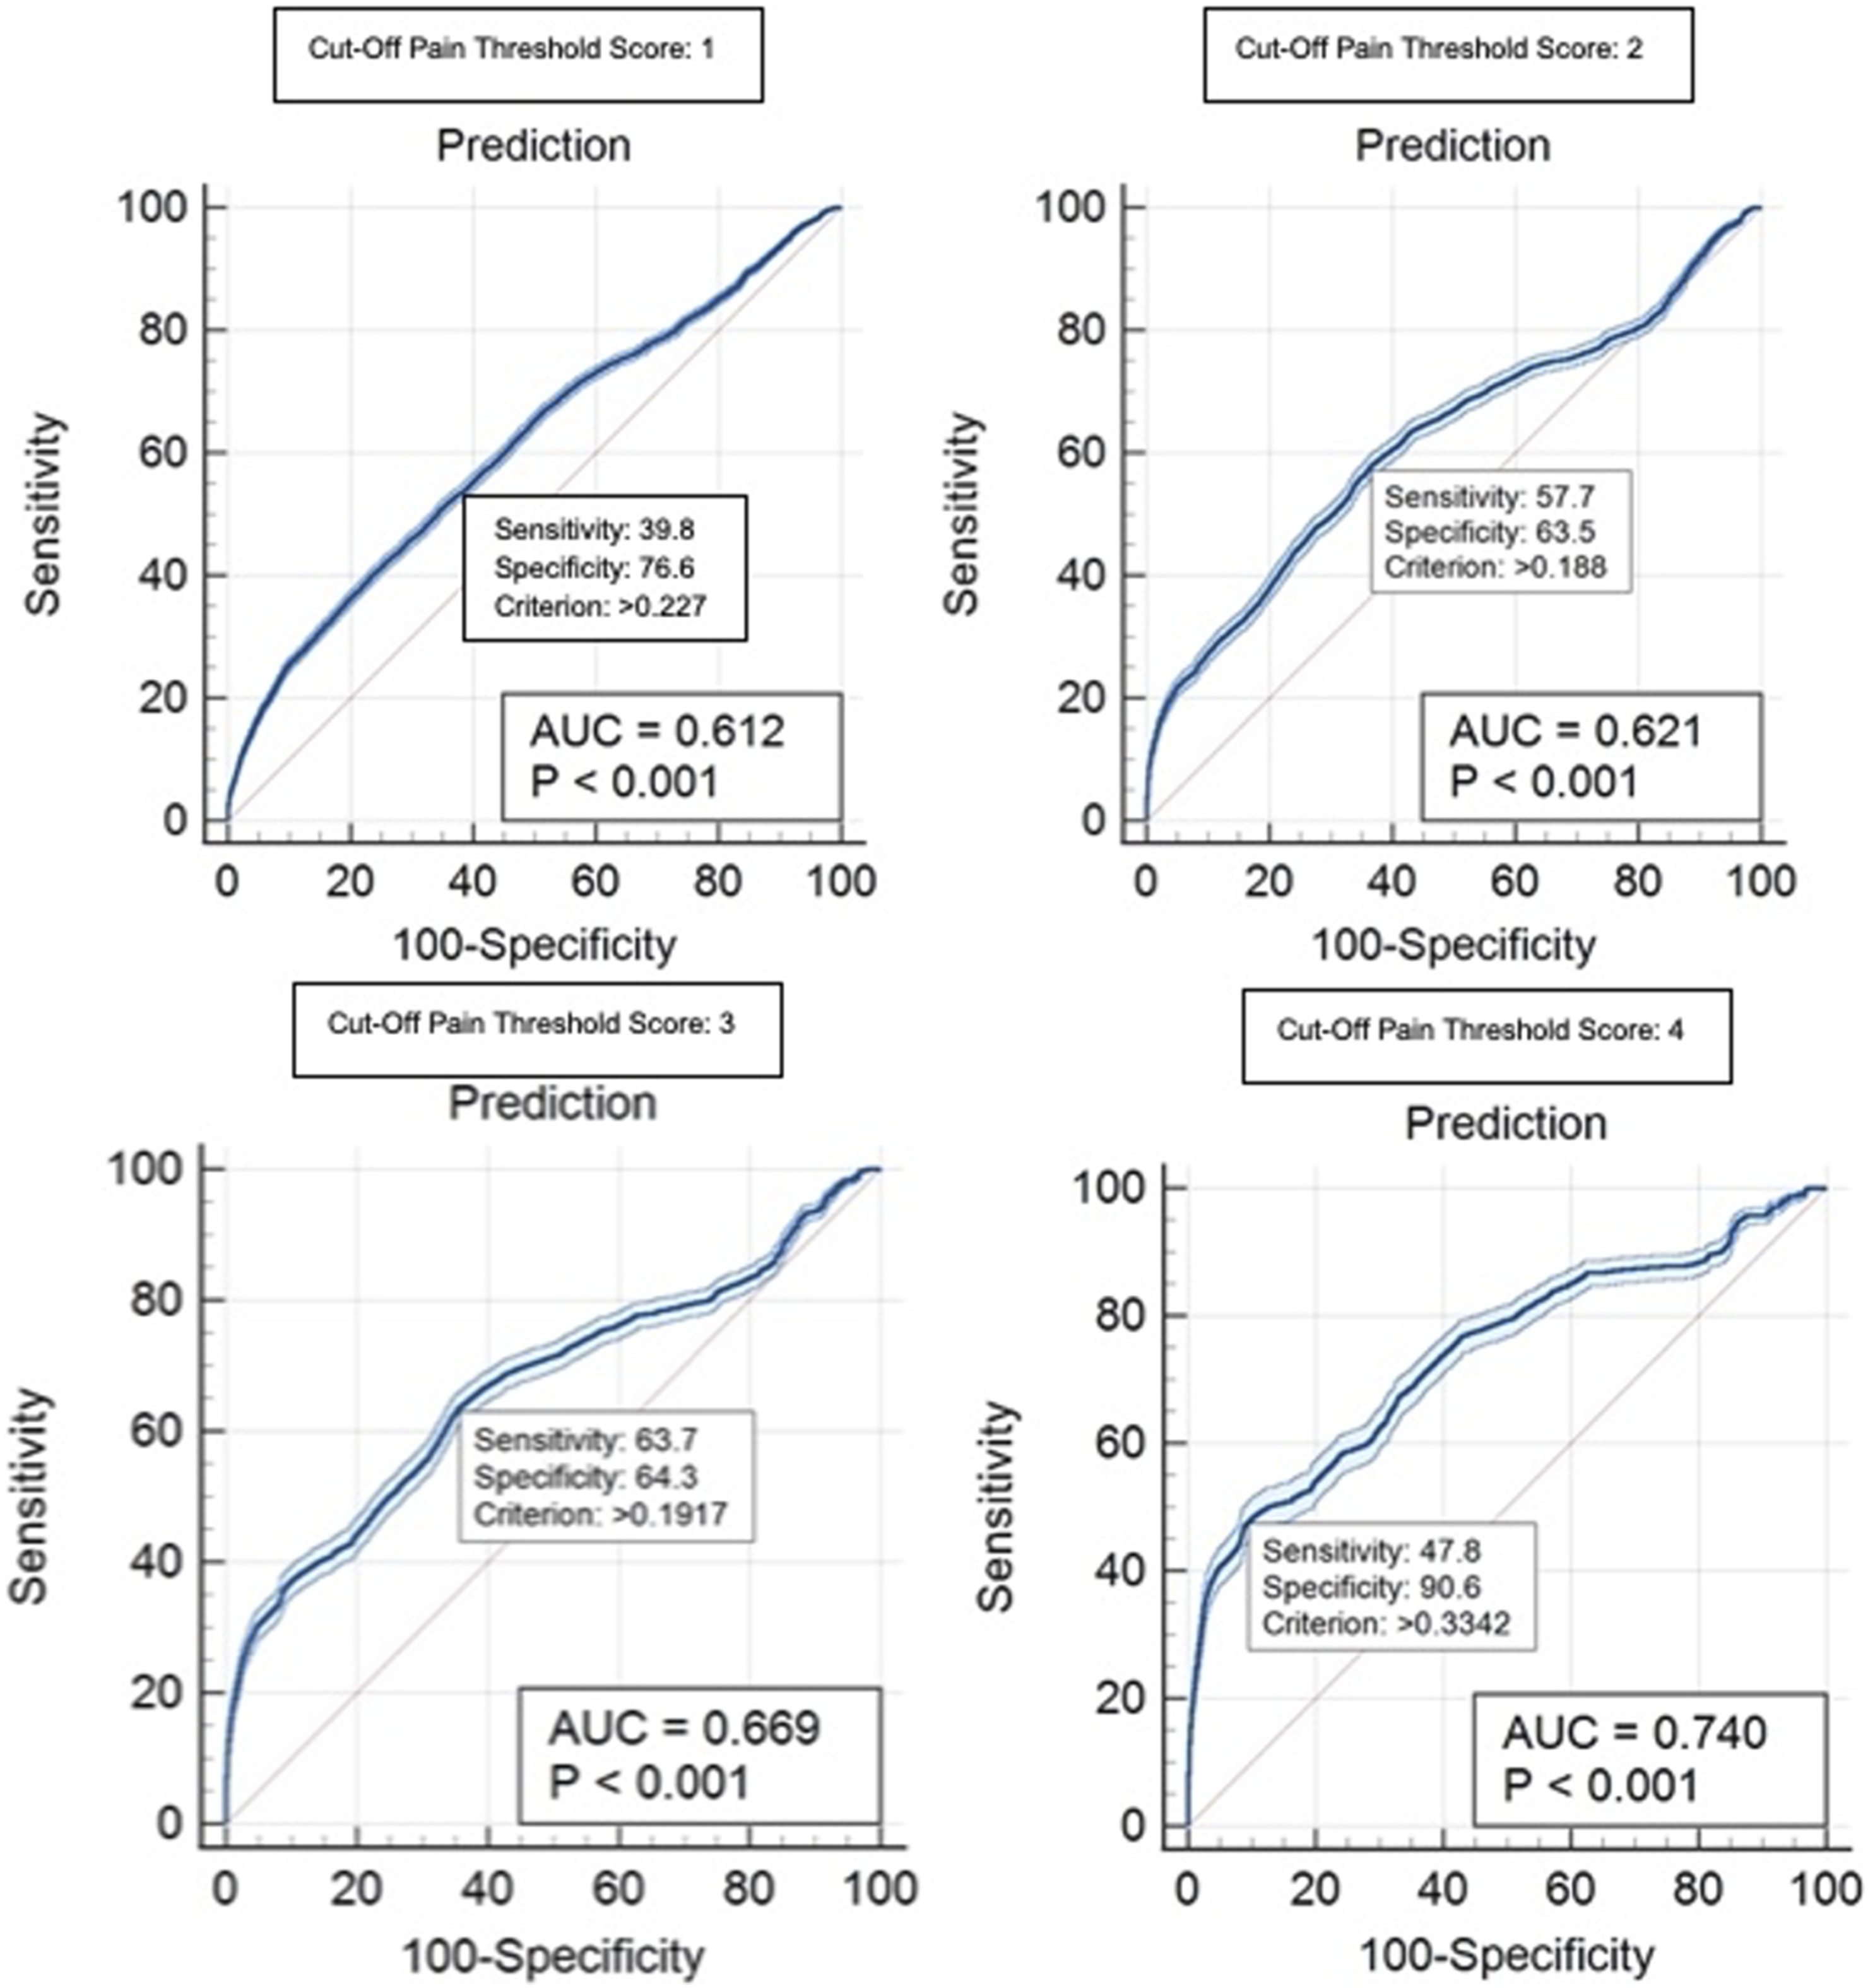
Receiver operating curves for male participants for the FACS-based cut-off pain threshold scores of 1–4. Each graph indicates an example of a criterion value with the associated sensitivity and specificity values. AUC: area under the curve. FACS: Facial Action Coding System.
Receiver operating curves for female participants for the FACS-based cut-off pain threshold scores of 1–4. Each graph indicates an example of a criterion value with the associated sensitivity and specificity values. AUC: area under the curve. FACS: Facial Action Coding System.
Correlational analyses
Summary of Pearson correlations for pain assessment measures during 5-trial pain induction task.

Note. 1Correction for attenuation was used due to frequency of frames coded as 0. FACS: facial action coding system. CoVAS: computerized visual analogue scale. *p = 0.01. N = 65.
The first series of correlations examined the relationship between the measures for all frames that were coded as depicting pain-related facial movements (i.e., frames that did not receive a manual coding pain intensity score of 0) during the 5-trial pain-induction task. Over 32,000 data frames were included across all participants. Results demonstrated a moderate positive correlation between system scoring and gold standard manual coding when participants displayed pain-related facial movements, r(32534) = 0.548, p < 0.01.
The second series of correlations examined the relationship between the measures for frames that were coded during peaks of the 5-trial pain-induction task. Peaks were defined as frames that occurred when the TSA-II temperature reached 46°C and above. Correction for attenuation 61 was used when calculating the correlations due to the high frequency of frames coded as 0 by gold standard manual coding. Over 67,000 frames of data were included across all participants. Results demonstrated a moderate positive correlation between system scoring and gold standard manual coding during peaks when thermal pain was maximally induced, r(67201) = 0.550, p < 0.01.
The third series of correlations examined the relationship between the measures for all frames of the entire 5-trial pain-induction task. The primary purpose of this correlation was to determine the relationship between simultaneous pain estimation generated by the system and continuous CoVAS self-report ratings. Correction for attenuation 61 was used when calculating the correlations due to the considerable frequency of frames coded as 0 by gold standard coding. Over 230,000 frames of data were included across all participants. Results demonstrated a weaker positive correlation between system scoring and gold standard manual coding across all frames, r(231844) = 0.480, p < 0.01.
Correspondence of facial AUs to system-generated scores and self-report ratings
The final set of analyses was aimed to determine the relationship between specific pain-related facial AUs with a) system performance in identifying facial pain expressions; and b) the average self-report CoVAS pain ratings. These analyses were conducted for the 5-trial pain-induction task. Peak pain events, classified as 2 s surrounding the highest scored frame by the system (i.e., maximal facial pain expression) during the trial, were examined for each participant. To test the correspondence between facial AUs and both system-generated scoring and self-report ratings, two multiple linear regression analyses were conducted. Each regression examined whether the pain-related facial AUs predicted either system-generated pain scores or self-report CoVAS pain ratings, controlling for gender and age.
Intercorrelations for regression analysis predicting pain scoring by the automated pain behaviour detection system.

Note. 1Dependent variable. AU: action unit. Gender: 1 = male, 2 = female. *p < 0.05.
Intercorrelations for regression analysis predicting self-report CoVAS pain ratings by participants.

Note. 1Dependent variable. CoVAS: computerized visual analogue scale. AU: action unit. Gender: 1 = male, 2 = female. *p < 0.05.
Regression analyses examining the unique variance accounted for by the predictors of pain scoring by the automated pain behaviour detection system.
Note. AU: action unit. Gender: 1 = male, 2 = female. *significant predictor.
Regression analyses examining the unique variance accounted for by the predictors of self-report CoVAS pain ratings by participants.
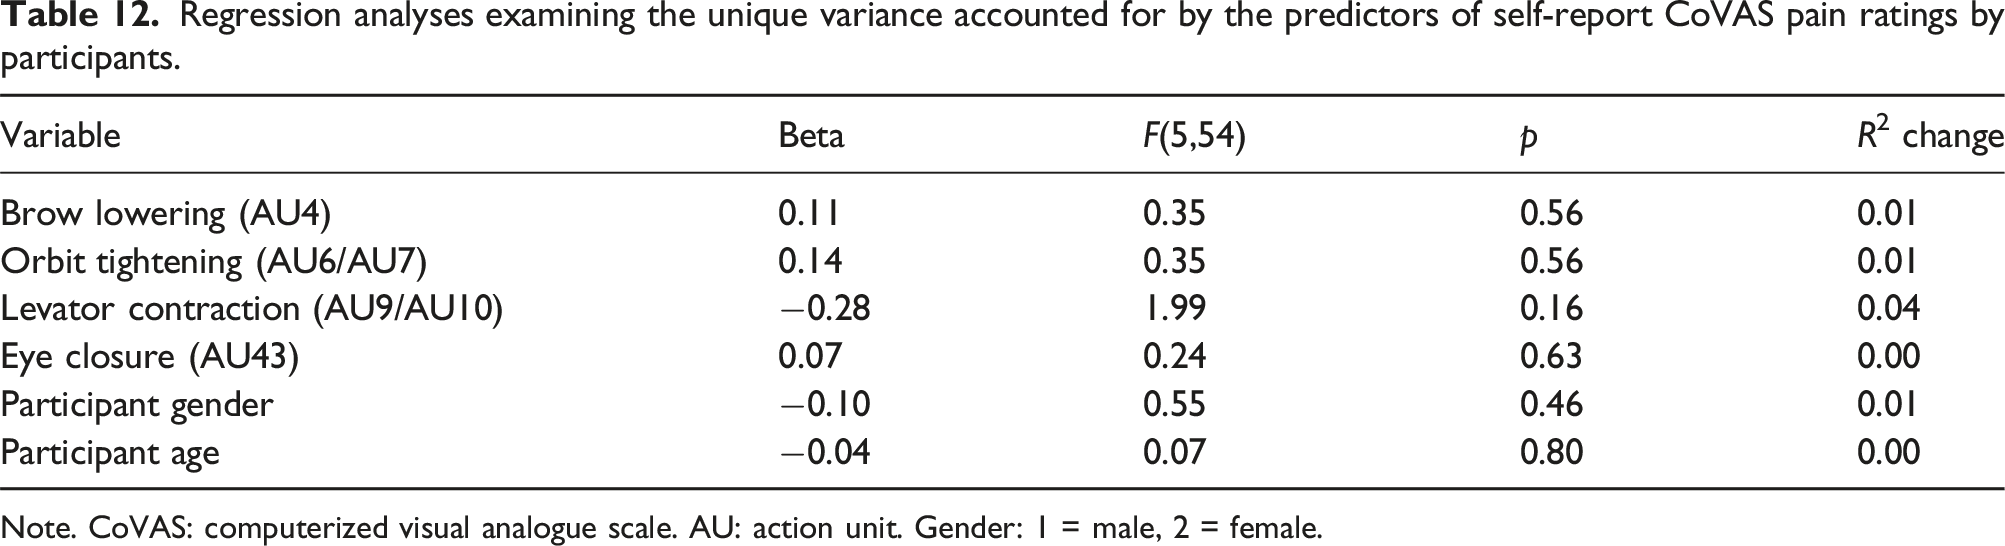
Note. CoVAS: computerized visual analogue scale. AU: action unit. Gender: 1 = male, 2 = female.
A conservative approach was adopted for the regressions first examining the full model. If the full model was significant, each variable’s unique contribution to the prediction was examined after all other variables were entered into the equation. The full model for pain scoring by the system was significant in the prediction of system-generated pain scores, F(6,53) = 11.99, p < 0.001, R 2 = 0.576 (see Table 11). Collinearity among predictor variables was evaluated from the Variance Inflation Factor (VIF) values. Results suggested low collinearity among the two significant predictor variables of brow lowering and levator contraction as demonstrated by VIF values of 1.87 and 2.28 respectively, suggesting that these variables are unlikely to be excessively correlated as predictors. In further examining the model, results suggested that brow lowering predicted 5% of the unique variance and levator contraction predicted 14% of the unique variance in system-generated pain scoring. The full model for self-report CoVAS pain ratings was not significant.
Discussion
This was the first study to evaluate a novel computer vision algorithm 33 designed to detect and analyze facial pain behaviors in older adults, live in real-time in a laboratory environment. This initial evaluation of the automated pain behavior detection system supported its potential viability for detecting and analyzing facial pain expressions. As the ultimate aim of the system is to be used in LTC settings, where chronic pain is prevalent, an important first step was to test the performance of the system using live participants displaying genuine pain expressions in a laboratory environment.
Performance of the automated pain behavior detection system
Findings suggest that the system was able to differentiate live in real-time between instances of pain and non-pain facial expressions using system-generated pain intensity scores. System performance improved at greater intensities of facial pain expressiveness. Similar results have been found in previous studies examining pain expression detection algorithms. 62 However, some investigations have shown a trend of improved performance of facial pain recognition algorithms when detecting less intense pain levels.63,64 The lack of clarity in the literature is most likely a result of the training datasets used. Video recordings displaying facial pain expressions are difficult to obtain and do not tend to include a variety of pain intensities, especially higher intensities. Such an imbalance can lead to an algorithm being more adept at recognizing lower pain scores simply due to training exposure. However, lower pain scores often correspond to more subtle pain expressions which can be difficult for the algorithm to detect and interpret accurately. In other words, characteristics of high-pain expressions are much clearer across individuals than characteristics of low-pain expressions, thus allowing for better detection performance by the algorithm of the automated system. Throughout the literature, it is apparent that there is no single cut-off that defines a facial pain expression as determined by FACS-based manual pain coding. Therefore, it was decided to determine the ability of the system to detect pain expressions using a variety of classifiers (i.e., the sixteen possible FACS-based cut-off pain threshold scores).
A positive correlation was demonstrated between gold standard manual coding and pain behavior coding by the system. Results of this study suggested that per-frame predictions when considering all video frames achieved a comparable correlation coefficient of 0.48 compared to prior investigations with video recordings. 33 Correlational analyses demonstrated that system performance improved when restricting analysis only to pain-relevant frames compared to analyzing all frames. It is possible that this restriction allows for a reduction in noise data which are more likely to accompany frames showing non-pain-related facial expressions.
As the system is ultimately intended for use in LTC settings, it was important for it to be programmed to alert when pain expressions were identified. During testing, a light was turned on and email alerts were sent to the experimenter noting that a pain expression was detected. To the best of our knowledge, this is the only study to incorporate a fully automated algorithm with a notification alert system. This has practical implications, especially for clinical populations such as individuals with severe dementia who experience communicative difficulties.
Absence of one-to-one correspondence between system-generated scores and FACS-based scores
There does not appear to be a perfect one-to-one correspondence between scoring measures. As such, any given FACS-based pain score will correspond to a range of comparative system-generated pain scores which varies somewhat from participant to participant as a function of variability in the anatomy of their faces. Since there are individual differences in pain expression, 65 the degree and manner of deviation from their corresponding neutral baseline expression can vary significantly across individuals.
Facial expressions in response to pain do not always follow a linear pattern. For example, small increases in pain might not result in noticeable changes in facial expressions until a certain threshold is reached.66,67 The algorithm may be more sensitive to certain types of facial movements (e.g., levator contraction and brow lowering) which could affect the consistency of pain expression scoring. Neural networks, such as the neural network model used by the algorithm in this study, often have a degree of prediction uncertainty, especially in complex tasks such as interpreting facial expressions. 68 This is because they operate by estimating probabilities based on the input data, and these probabilities can vary significantly even for similar inputs, so a neural network might struggle to map non-linear relationships accurately, resulting in a broad range of predicted values across participants.
Pain behaviors and self-reported pain
This study aimed to elucidate the co-variation between facial pain expressions and continuous, real-time self-report pain ratings as single retrospective self-report pain ratings are mainly utilized in the literature. The weak associations between self-reported pain ratings and non-verbal facial expressions of pain were unsurprising. In the literature, the relationship varies from no association to weak or moderate associations.69,70 Kunz et al. 67 suggested that the activation threshold, defined as the minimum level of pain stimulation needed to elicit a nonverbal pain behavior, may not correspond perfectly to verbal pain reports. This explanation is supported by facial pain expressions being described as part of a late signaling system such that while pain is being experienced, and thus communicated verbally, facial cues might be delayed in their presentation until a certain pain intensity is reached. 71 Kunz et al. 72 demonstrated that social motives could be at play in the discrepancy between subjective experienced pain and facial expressions such that an atypical expression of smiling during pain can occur during experimental pain.
Gender differences in pain expression detection
The system was better at correctly identifying facial pain expressions in female participants compared to male participants. While analyses showed no statistically significant differences in facial pain expressions, mean values for manual FACS-based coding and system-generated pain coding were slightly greater for female participants. Based on previous testing using video recordings, there also appeared to be a slight difference in algorithmic performance as a function of gender. 33 It is possible that the gender difference seen during live testing was a result of the algorithm being trained more on female faces.
Few research studies examining automated facial expression recognition by other algorithms have investigated the role of variables such as gender in evaluating model performance. 29 That said, some facial analysis models tend to perform better on male faces than female faces. 73 It has been posited that the gender bias may be due to certain datasets containing largely male faces compared to female faces. 73 This could explain the reasons that the algorithm in this study performed better on female faces due to the original training dataset containing more female faces.
The role of pain-related facial AUs
Consistent with expectations, brow lowering and levator contraction made unique and independent contributions to the prediction of the performance of the system in generating pain scores. These findings are consistent with prior investigations.74–76 The approach of the algorithm in which the system discerns facial pain expressions is similar to human observations. It has been demonstrated that brow lowering and levator contraction are the most salient facial cues observers utilize in their mental representations of facial pain expressions in others. 77 While certain facial cues are strongly related to the broader facial pain expressions, there may be different configurations or characteristic pain faces that combine the pain-related facial cues differently. 65
Limitations and future directions
This study represents an essential live test of a pain behavior detection algorithm performance prior to further testing in clinical settings. Although pain was experimentally induced, it is likely that the system would be able to detect and analyze facial pain expressions in individuals experiencing pain due to pathology. It is recognized that the detection of pain expressions in community-dwelling older adults may be less challenging than detection in samples of LTC residents with dementia. 29 Future evaluations using a sample of older chronic pain patients in a non-laboratory setting would more closely determine system performance in naturalistic situations.
Biases in algorithm performance have been found for several variables including ethnicity/race such that algorithms tend to exhibit poorer performance in accurately detecting facial expressions with darker skin tones.73,78 Due to the homogeneity of the participant sample, it was not possible to explore algorithm performance as a function of race or ethnicity. It is necessary that future studies continue to develop datasets that include a distribution of participants across varying ethnicities and races to train facial analysis algorithms and subsequently evaluate the performance of algorithms using a diverse sample.
Conclusion
This was the first investigation of a newly developed computer vision algorithm, designed from datasets of older adults with and without dementia, using live observations and in real time. Findings supported the efficacy of the automated pain behavior detection system in successfully detecting and monitoring facial pain expressions of varying intensities in community-dwelling older adults. Despite recognizing the necessity of implementing pain assessment procedures in LTC, human resource limitations impact the availability of regular, standardized pain assessments. Technology has the potential to provide a complementary method for effective and validated monitoring of pain behavior in vulnerable populations who often experience inadequate pain management. Continuous, automated assessment of pain behavior is expected to lead to better quality of life for older adults in LTC and a decreased burden for caregivers.
Footnotes
Acknowledgments
The authors thank Vivian Tran, Louise Castillo, and Laney Yarycky for their help with the data collection.
Author contributions
R.S. contributed to the conceptualization of the study, and played a primary role in data analysis, interpretation, conceptualization and manuscript write up. A.M. contributed substantially to data analysis and interpretation. B.T. and A.M. contributed substantially by providing the algorithm for the automated system. T.H. and B.T. prepared the grant that funded this project and made major contributions to interpretation of the results and write up of the manuscript. T.H. oversaw and contributed to all aspects of this project including study conceptualization.
Declaration of conflicting interests
The author(s) declared no potential conflicts of interest with respect to the research, authorship, and/or publication of this article.
Funding
The authors disclosed receipt of the following financial support for the research, authorship, and/or publication of this article: This work was supported in part through a grant from the AGE-WELL Networks of Centres of Excellence (grant # AWCAT-2019-14). Publication of this article was supported by funding from the Canadian Institutes of Health Research (#BET-190800).