
Abstract
Introduction
Rolling resistance (RR) is a drag force acting on manual wheelchairs that is associated with increased propulsion force and is linked to secondary disabling conditions of the upper limbs. A scoping review was conducted to understand how RR of manual wheelchairs has been measured and to identify limitations of those test methods and the factors tested.
Methods
A total of 42 papers were identified and reviewed, and test methods were categorized based on the measurement style of RR, testing level, and if multiple parameters could be tested. Additionally, 34 articles were reviewed for what factors were tested.
Results
Seven different testing methods categories were identified: drag test, treadmill, motor draw, deceleration, physiological expenditure, ergometer/dynamometer, and robotic test rig. Relevant articles were categorized into testing factor categories: camber, toe, tire type, tire pressure, caster type, mass, mass distribution, and type of surface.
Conclusions
The variety of testing methods suggests the need for a standardized method that can be used for wheelchair wheel design and selection to reduce RR. It is important to use adjustments, such as a forward rear axle position to mitigate RR as well as using high-pressure pneumatic tires that are properly inflated.
Keywords
Introduction
While manual wheelchairs provide mobility to millions of people worldwide, years of propulsion can have detrimental effects on the wheelchair users. For manual wheelchair users (MWU), pain and injuries commonly occur in the upper extremities (UE). Evidence suggests that 64% of individuals with paraplegia and 55% of individuals with quadriplegia experienced UE pain. 1 For individuals with spinal cord injuries, nearly 40% developed shoulder pain with standard manual wheelchair use over a three year period. 2 Shoulder and rotator cuff injuries are also common among wheelchair user,1,3,4 as is carpal tunnel syndrome. 5 These are considered repetitive strain injuries (RSI). A MWU’s quality of life can be significantly impacted by the onset of UE pain or injury, including lower participation, reduction in the ability to carry out activities of daily living, and decreased activity levels. 6
With the prevalence of UE pain and injuries and related consequences, prevention has been a major focus of researchers. Several studies have investigated the interaction between the user and their mobility device. One critical step is to understand the forces being applied to the push rim by the hand. 7 Research comparing biomechanical efficiency to mechanical efficiency was conducted and concluded that biomechanically efficient propulsion is not always the same as mechanically efficient propulsion.8–10 One method of comparing the efficiencies is to view the stroke pattern and the forces applied to the push rim.11,12 Furthermore, there are additional factors that have been shown to impact the manual wheelchair propulsion, including environmental factors such as surface type, personal factors such as type of disability, as well as the physical characteristics and setup of the manual wheelchair.13–18
With every propulsion cycle, there is a resistance force, induced by a moment that is opposite of the moment created from propulsion stroke, that the MWU must overcome to propel the device forward. The total resistance is the combination of air resistance, bearing resistance, and the rolling resistance (RR). 19 Air resistance is considered to be negligible at low speeds. 20 Bearing resistance is much harder to measure but can be considered negligible. 21 Therefore, the largest resistance to propulsion is the RR of the wheels and casters contacting the surface the MWU is on, as seen in Figure 1. 7 Mathematical models have helped to understand this.22,23 The RR acts against the tangential force from the MWU that is providing propulsion. The higher RR, the less forward momentum that is gained from each propulsion stroke. The RR results from an energy loss of the tire compression and expansion at the contact with the ground. The material of the tire plays a critical role in the loss of energy due to hysteresis (inelastic deformation), which accounts for almost all of the loss of kinetic energy in rubber. 24

RR Free body diagram where Ft is the tangential force, V is the angular velocity, and W is the load on the axle, FRR is the RR force, MZFT is the moment due to the tangential force, MZFRR is the moment inducing the RR force.
The reduced forward momentum with a higher RR means the MWU does not go as far with each propulsion stroke. As RR increases, stroke length decreases and propulsion frequency increases. 25 Furthermore, it puts the MWU at increased risk for upper extremity (UE) pain and injury and reduced activity levels and participation in events. 26 Factors such as the rough surfaces and wheelchair setup increase propulsion forces, partially due to increased RR.16,18
A coefficient of RR, denoted as
The International Society of Wheelchair Professionals established a Standards Working Group (ISWP-SWG) in 2015, which included experts in wheelchair design, manufacturing, and testing. The ISWP-SWG identified RR measurement as a high priority to improve wheelchair performance and product quality. One issue raised by the ISWP-SWG was a lack of information regarding RR over both rough and soft terrains that are important to wheelchair use in adverse conditions. A second issue was a concern that toe-in or toe-out of manual wheelchair (MWC) propulsion wheels were common in the field, but the consequences on RR were unknown.
The ISWP-SWG recommendations, as well as the research evidence that propulsion demands are linked to secondary injuries, highlight the need to either identify or develop a testing methodology that can determine the influence of individual design and environmental factors on RR. The factors commonly reported to influence RR include camber, toe, tire type, tire pressure, load distribution, and surface type. In order to better educate clinicians on the relationship between manual wheelchair propulsion and UE pain and injuries, a clinical practice guide was developed which recommends larger diameter wheels, high quality bearings, low chair weight, optimized seating position (farther back), and a forward axle position. 27 These recommendations are focused on improving biomechanical efficiency, as well as reducing RR, but do not explore all factors that influence RR.
To better understand the established test methods, this paper reviews the existing literature for RR and compiles a summary of their testing methods, capabilities, and limitations. The results of this review are intended to catalog previous testing methods from a functional standpoint to inform future RR testing methods. Furthermore, this review was used to identify the factors which are tested for impacting RR. A primary goal of this work is to inform stakeholders (clinicians, wheelchair users, wheelchair designers) of the factors that increase RR so that they can be mitigated in an effort to reduce the RSI risk of MWUs. A secondary goal is to identify what gaps may exist in understanding the influence of these factors to motivate future research. 28
Methods
A PRISMA Extension for Scoping Reviews (PRISMA-ScR) methodology was followed to find and present the results. 28 An online literature search of the National Center for Biotechnology Information’s PubMed (1946-2020) was initially conducted on June 17th, 2018. Articles were found using the keywords rolling resistance, wheelchair(s) and Medical Subject Headings (MeSH) terms wheelchairs and friction. A singular database was used because it is the premier database for biomedically related topics, is up to date, and indexes the prominent journals of the field. Lastly, some articles were presented at the recommendation of the ISWP-SWG but were mostly duplicates of the database search. While these articles provided an apriori idea of what to expect, the database search was iterative by combining the results of the keyword and MeSH terms searches in order to be comprehensive. References of articles were also viewed to ensure no articles were missed in the search. Due to the time that had passed since the first search, a follow up was conducted on March 8th, 2020 and resulted in 2 additional articles included in this review.
The type of test method was identified from each of the remaining articles. Motivated by discussions with the ISWP-SWG, each testing method was categorized according to whether it reported RR directly (Direct methods) or through a proxy measure (Indirect Method). Similarly, each method was categorized as system-level (e.g. front/rear wheels simultaneously) or component-level (e.g. individual wheels) testing and the ability to test multiple surfaces was determined. The following criteria were used to select manuscripts for inclusion into this study: 1) the manuscript reported methods that either directly or indirectly measured RR, 2) the publication was peer-reviewed, and 3) the article was written in English. Additionally, to understand what factors were tested, a secondary review evaluated if those methods used a factor or factors that were hypothesized to impact RR. The first author was the reviewer of the articles to determine eligibility based on the aforementioned criteria that was determined apriori, and independently completed the data charting for the review.
PubMed searches resulted in 53 articles from 4 searches. Additionally, 37 articles were provided from the ISWP-SWG for a total of 90 articles. This reduced to 68 articles after duplicates were removed between the articles from the ISWP-SWG and all of the PubMed searches. The primary review identified 42 articles for testing methods and the secondary review identified 34 articles included for the review of testing factors. Since the search was limited to English peer-reviewed published articles, conference proceedings and other gray literature were not included. Figure 2 provides a detailed breakdown of the article search for testing methods and factors.

Selection flowchart.
Results
Testing methods
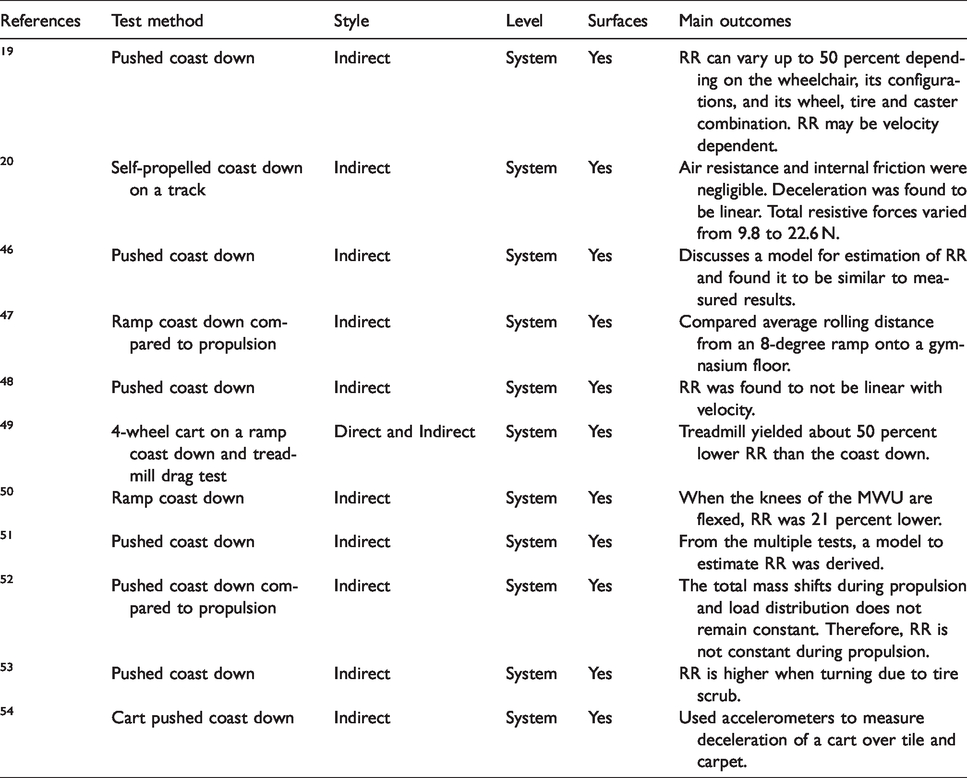
Seven test methods were identified and include drag test, treadmill, motor draw, deceleration, physiological expenditure, ergometer/dynamometer, and robotic test rig. Tables 1 to 7 include lists of each article, the test method used, the style of test (direct or indirect), the level of the test (system or component), if it can test surfaces (yes or no), and key outcomes reported. Some articles combine test types and could fall into multiple test types but are only listed once in the category that was the overarching test for simplicity. For example, a test with physiological expenditure measured on a treadmill is only listed in the treadmill category.
Comparison of drag test methods and main outcomes from published testing. These methods are catagorized by direct versus indirect test, system versus component level test, and ability to evaluate surfaces. The main outcomes are listed for each of these papers.

Drag tests
A drag test is performed by measuring the force required to pull or push a wheelchair or cart with wheelchair wheels across a surface. 29 A variation of the test has been conducted where the wheelchair is pushed by the handlebars. 30 The method is similar to treadmill testing (described below) and is accomplished by pulling a wheelchair and measuring the force on a loadcell. This category has the most diversity in how the actual test was performed, as seen in Table 1. The source used to pull the wheelchair or cart ranged from water (in a bucket as a variable weight), a motor, and a power wheelchair. While most drag test method required a large area to perform the test, one component level bench test was developed that measured the forces a wheel applied to an instrumented table. 31 Overall, these tests are a direct testing method at a system level that can test multiple surfaces.
Treadmill
During the treadmill test, a wheelchair is typically placed on top of a treadmill and a load cell is used to measure the pullback force on the chair. 35 Most of the test methods in this category are system-level, direct tests, although a component level test could be possible. Two tests used propulsion data on the treadmill and are therefore indirect test methods, while two more used direct and indirect testing methods. One study compared a push technique to a drag test and that is the only study able to test multiple surfaces. Table 2 includes details of the 11 articles that involved a treadmill for testing RR. For this style of test, it was very common for it to be combined with another test style. Most of the treadmill tests used a wheelchair except one study used a specialized cart. 36 Other studies reported using instrumented push rims on a treadmill so that physiological measurements could be collected.37,38
Comparison of treadmill test methods and main outcomes from published literature. These methods are catagorized by direct versus indirect test, system versus component level, test and ability to evaluate surfaces. The main outcomes are listed for each of these papers.

Motor draw
One type of RR test method measures the draw of an electric motor while pulling a whole manual wheelchair across a surface. 45 With a change in a testing parameter (e.g. different load), a change in motor current is measured and is compared to the baseline testing. The amperage across the motor is based on the amount needed to pull the wheelchair. Table 3 outlines the only article that measured the motor draw, which is an indirect, system level test with the ability to test multiple surfaces. It is difficult to validate this test method with only one study completed using this method. However, the main outcome of proportionality to weight is confirmed through deceleration and physiological expenditures testing.25,46
Summary of motor draw test method and main outcomes from published literature. These methods are catagorized by direct versus indirect test, system versus component level test, and ability to evaluate surfaces.

Deceleration
Deceleration testing, commonly referred to as coast down testing, is an indirect test method that is commonly used in conjunction with a ramp. A wheelchair or cart with a known weight is given potential energy (released down the ramp) and then travels across a surface at the bottom.19,47 It has also been tested with a person propelling or a wheelchair being pushed to a given velocity and then coasting to a stop.20,48 Table 4 details the 11 deceleration testing articles showing mainly indirect, system level testing with the ability to test multiple surfaces. This testing style has been used to test types of wheelchairs, tires, surfaces, and load distribution parameters. There was a relatively large variation of the methods of deceleration testing reported. For instance, over half of the articles had a wheelchair pushed and the deceleration was measured as it slowed down. Other tests used self-propulsion or a ramp to generate the initial velocity. One study compared the coast down result to treadmill results and concluded that the treadmill results (direct test method) had about 50 percent lower RR than the coast down. 49 This highlights the variance in testing methods, as well as the need for standardized testing procedures.
Comparison of deceleration test methods and main outcomes from published literature. These methods are catagorized by direct versus indirect test, system versus component level test, and ability to evaluate surfaces. The main outcomes are listed for each of these papers.
Physiological expenditures
Physiological expenditures such as heart rate and oxygen consumption can be measured during propulsion and have been used as proxy measurements for RR. 55 Similarly, instrumented push rims measuring the force and torque applied to the wheelchair wheel have been developed to study wheelchair biomechanics, including the impact of RR. In these systems, force sensors are embedded into the push rim measure the kinetic forces on the push rim. 56 The influence of RR is then reported based on changes in forces or torques required to maintain a constant speed.
The studies involving instrumented push rims have a large focus on the impact of different surfaces. This may be because it would be difficult to change out tires or have multiple designs of these instrumented push rims. It should be noted that the instrumented push rims are typically heavier than standard wheels, thus having an impact on the overall weight of the device which influences RR. However, across all of the studies in Table 5, a consistent result is an increase in RR when traversing a rougher surface, and the consequences on propulsion biomechanics. This demonstrates the importance to be able to test multiple surfaces in RR testing. Physiological expenditures testing has produced results that are consistent with other tire pressure-related studies found by other testing methods.48,53 Overall, these studies were indirect, system level tests with the ability to test multiple surfaces.
Comparison of physiological expenditures test methods and main outcomes from published literature. These methods are catagorized by direct versus indirect test, system versus component level test, and ability to evaluate surfaces. The main outcomes are listed for each of these papers.

Ergometer and dynamometer
The ergometer is a device used to simulate propulsion using rollers to measure forces or the amount of work done, while a person propels a wheelchair on the rollers. An ergometer measures the forces produced or work done by the subject. Dynamometer tests measure forces or work output on the rollers and is commonly combined with physiological measures and/or instrumented push rims to give a complete picture. Additionally, a drum-based measurement does not directly translate to flat ground measurements due to the curvature of the drum. 60 One extensive ergometer study measured kinetic and kinematic data. 61 This process was very extensive in data collection. It required a lengthy setup process and post-testing analysis. Dynamometers from different facilities have been shown to be inconsistent in their measurements across four different locations. 62 One research team used an instrumented push rim on a dynamometer, as shown in Table 6. 63 Table 6 shows the studies in this category are indirect, system level tests where attaching surfaces would be difficult given the small diameter of the drums.
Comparison of ergometer and dynamometer test methods and main outcomes from published literature. These methods are catagorized by direct versus indirect test, system versus component level test, and ability to evaluate surfaces. The main outcomes are listed for each of these papers.

Robotic test rig
The robotic test rig was developed to measure forces and torques during propulsion. It is a highly instrumented and sophisticated system to operate. 66 While the computer-controlled propulsion gives consistency, its goal is to realistically reflect propulsion from an MWU through precise motor control. Given the complexity of the device, it is unclear how RR is being measured other than changes in motor voltage similar to the motor draw study. The robotic test rig was developed to have specific control on the wheels during simulated propulsion and allow proper coasting by applying a small amount of power to the motor during deceleration. Table 7 lists the three indirect, system level studies using this method that have the ability to test multiple surfaces.
Comparison of robotic test rig testing methods and main outcomes from published literature. These methods are catagorized by direct versus indirect test, system versus component level test, and ability to evaluate surfaces. The main outcomes are listed for each of these papers.

Testing factors
The 34 publications included in this scoping review were organized and analyzed according to specific testing factors: camber, toe, tire type, tire pressure, caster type, increased mass (weight added to the device), mass distribution (weight to the rear axles versus the front casters), and surface type. Some articles provide input on more than one factor and appear in multiple tables.
Camber
Camber was evaluated in four studies which provide contradictory results about the impact of camber on RR. Three out of the four studies found that camber had minimal impact on RR as shown in Table 8. 29,41,46 A fourth study utilizing a new bench test method found that camber increased RR, but because of the design of the method this would always be the case. 31 This method will always result in increased forces being measured when camber changes because load cells are placed on all four sides of a platform in order to measure the displacement forces.
Summary of articles evaluating effect of camber on rolling resistance and the main outcomes from these research papers.

Toe
The effect of toe was examined in three of the studies and was found to have a significant impact on RR (Table 9). Specifically, one test showed that one degree of toe can induce a 25.5% increase in RR, and that RR increases non-linearly as toe increases. The increase in RR is 96.3% and 212% at two and three degrees, respectively. 29
Summary of articles evaluating effect of toe angle on rolling resistance and the main outcomes from these research papers.

Tires
There were twelve studies that evaluated and tested different types of tires including pneumatic, solid, and solid inserts. The overwhelming majority of the studies found that pneumatic tires have a lower RR than solid tires or solid inserts (Table 10). Studies concluded that solid tires and solid inserts had up to 91% more RR when compared to a properly inflated high pressure pneumatic tire (>100 psi) with a low profile.41,64 Additional studies confirm that while the RR was lower, the physiological demand was also lower.38,65 Lastly, one study established that RR is inversely proportional to rear tire diameter but the effect is negligible on soft surfaces. 49
Summary of articles evaluating effect of tires on rolling resistance and the main outcomes from these research papers.

Tire pressure
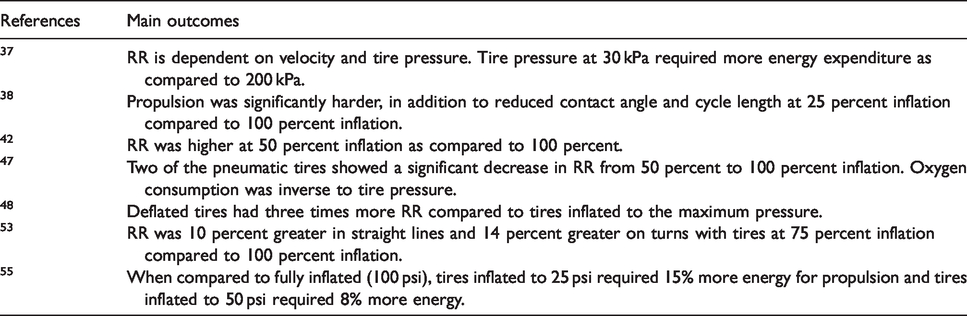
Seven studies investigated the impact of the inflation level of pneumatic tires, typically at intervals of 25% of max inflation pressure (Table 11). RR can be three times higher with deflated tires. 48 At 25% inflation in a pneumatic tire, MWUs experience reduced contact angle of the hand during propulsion, reduced propulsion cycle length, and significantly harder propulsion. 38 It was also shown that oxygen consumption and heart rate increase as tire pressure decreases.47,55
Summary of articles evaluating effect of tire pressure on rolling resistance and the main outcomes from these research papers.
Casters
Front casters, which included a variety of material compositions and diameters, were evaluated in five articles (Table 12). It was found that a four-inch caster had 16% higher RR than five or six-inch casters and caster shimmy in deceleration tests was found to increase RR.19,33
Summary of articles evaluating effect of casters on rolling resistance and the main outcomes from these research papers.

Increased mass
Six articles investigated the total weight of the wheelchair and rider on RR or simply the addition of weight to a test rig (Table 13). It was determined that RR increased, the torque required for propulsion increased, and self-selected velocities decrease with increased mass.25,40,67 The increase in torque is most likely due to the increase in mass and the increase in mass does increase RR. It was also reported that RR of pneumatic tires are less sensitive to increases in mass compared to solid tires. 64 Conversely, one study found that a 10 kg increase in mass had no effect on RR, which is likely due the placement of the added mass. 38
Summary of articles evaluating effect of increased mass in a manual wheelchair on rolling resistance and the main outcomes from these research papers.

Mass distribution
Mass distribution was studied in 11 articles and evaluated where the person’s center of gravity is positioned in the wheelchair (Table 14). Mass distribution is similar to increased mass because it changes the weight on the rear wheels or front casters. One article reported that a change in the center of gravity did not have a significant effect on a cart with four identical wheels. 49 Overall, decreased RR was seen when the load distribution was increased on the rear wheels (from 55% to 70%) and decreased on the front casters, which changes straight line propulsion and turning.51,53,67 It was found that if 30% or less of the load is on the front casters, caster diameter does not matter. 43 A common way to change the load distribution is to move the rear axle position.45,46 Additionally, a posterior axle position decreased self-selected velocity. 25 Lastly, research on propulsion has found that the person shifts their mass when propelling, and therefore, the mass distribution is not constant during propulsion. 52
Summary of articles evaluating effect of load distribution on rolling resistance and the main outcomes from these research papers.

Surfaces
The impact of surfaces was reported in 17 articles (Table 15). A common finding was that carpet had approximately 3 times higher RR than linoleum or concrete.19,30,46 Greater torque was needed to accelerate on carpet. 67 Typically, a smooth surface such as level concrete was used as the reference. Tile also had low RR.25,30,32
Summary of articles evaluating effect of floor surfaces on rolling resistance and the main outcomes from these research papers.

Discussion
Methods
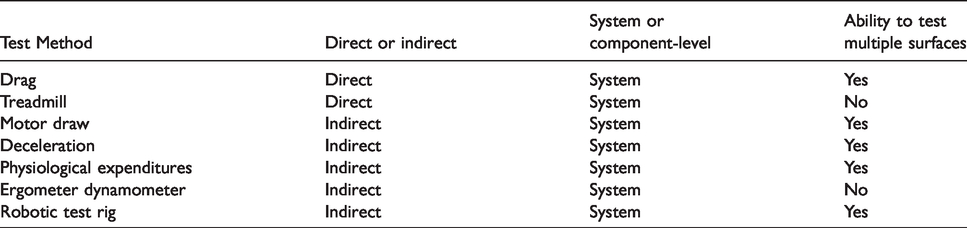
The main purpose of this review was to find a testing method capable of meeting the requirements determined by the ISWP-SWG, which included defining previous testing methods, their capabilities, and their limitations. Through the review, a wide range of RR measurement techniques have been identified in the literature, and most have data that is unique to that technique, making them difficult to compare. Specifically, seven RR test methods were identified. Five of the seven test methods were found to be mainly indirect testing and all of the methods tested at a system level. Additionally, the ability to test multiple surfaces was present in five out of seven test methods. Table 16 shows the specific breakdown of the results.
A summary of seven rolling resistance test methods and comparison of three key characteristics (direct versus indirect, system versus component level, and the ability to evaluate surfaces).
A direct test such as a treadmill or drag test will provide results that are easily comparable across studies. An indirect test may not be as valuable to stakeholders as a direct test because it uses a proxy measurement. The proxy measurement is taken and then correlated to a change in RR and while it may be quantifiable, they are not easily comparable across different studies. With the combination of some of the testing methods during an individual study, the data analysis becomes very extensive and less clear. Tests that analyze the whole wheelchair make it difficult to isolate the influence of individual wheels/tires or wheelchair setup on RR. Therefore, the results are difficult to interpret and may not provide clinicians, manufacturers, or end-users with actionable information for device setup, product development, or product selection.
The wide variety of RR testing methods and related non-uniformity in reporting approaches makes it challenging to more broadly understand the influence of the range of factors influencing RR. Consequently, it is difficult to guide design, selection and setup of manual wheelchairs based on the published RR literature, and using the methods reported. Key limitations to the existing methods are the that the majority of methods rely on proxy measurements for RR, and the test methods are system rather than component-level tests.
With all of the methods being system-level testing, it highlights the need for component-level testing to ensure a complete understanding of the resistive forces at each component. The test methods themselves often had limitations. Caster flutter or the wheelchair not decelerating in a straight line would skew the result. 19 For studies involving human subjects, fatigue during testing can bias the results. Furthermore, results can vary greatly across users with varying skill levels, thus impacting the results of the RR measured. If the test relied on an experimenter pushing the wheelchair, it is difficult to be sure that a constant speed was maintained which has been shown to be related to RR. 30 A strength of many of the methods is the ability to test multiple surfaces.
The results of this scoping review motivate the need to develop a standardized test method for directly measuring RR at a component-level under a range of common conditions that are known to influence RR. This is consistent with the need identified in the AMPS work, where component-level testing for wheels and casters was mentioned as a goal. 66 A new component-level test method may be able to provide the appropriate actionable information to all stakeholders on how to reduce RR: clinicians and users selecting products, wheelchair manufacturers and designers aiming to develop products with low RR, and researchers investigating factors influencing wheelchair propulsion and use. Through standardized methods results should be more easily interpreted, and the appropriate clinical recommendations could be provided based on the results.
Factors
Camber
With the majority of studies citing that camber had little effect on RR, it may not be a critical factor to consider in product selection or setup. Commonly, camber is chosen by the client, and their preference may outweigh any implications from camber. With typical camber angles of 5 degrees or less and a pneumatic tire, the contact patch from the tire to the surface would not change a lot. With little change, a significant difference in RR would not be found. Only one study found camber increased RR and that was due to study design. 31 Increased camber is known to increase access to the push rim and increases lateral stability, which is commonly seen in adaptive sports. 65
Toe
Most of the published literature found that toe has a significant impact on RR. Based on the limited number of papers exploring this topic, and some conflicting studies, it is a potential area for further study, especially to understand whether it is frequently observed in the community.
Tires
Types of tires was one of the most heavily studied factors in the literature. Many studies have found that pneumatic tires have significantly lower RR than solid tires. With the amount of variation in styles and materials, it is a relatively easy factor to test. Furthermore, with quick release axles commonly found on wheelchairs, it is easy to change from one set of tires to the other. Since RR is relative to weight, it indicates that heavier tires and wheels are harder to propel. Therefore, solid tires require more torque to propel and have a higher RR than pneumatic tires because of the material characteristics. The literature supports this, but with so many tire variations, it is hard to discern how much more RR is due to solid tires and not difference in setup or material composition of the tires. With numerous tire variations on the market, more testing needs to be conducted so that clinicians and MWUs can make more informed decisions on what tires would be best for a MWU. Tire selection should meet the needs of the client and the environment the device will be used in for safe propulsion.
Tire pressure
Overall, a lower tire pressure, commonly measured as a percentage of the max pressure, increases RR. The trend is nonlinear, with RR increasing at a faster rate as pressure decreases. With a reduced tire pressure, the contact patch to the surface enlarges and increases the friction between the tire and the surface. It is expected that RR would increase, and that propulsion would be more difficult without a properly inflated tire.
Casters
The overarching theme from the literature is that caster diameter is inversely related to RR, meaning that smaller wheels have a higher RR than larger wheels. With the majority of the load on the rear wheels, casters become less important, because RR is directly proportional to load. However, depending on the surface, casters can be crucial to effectively navigate the terrain. When testing RR, caster flutter can skew the results by adding RR.
Increased mass
An increase in mass is expected to increase RR, and the measurement of RR is based on the total weight of the system. It is important to note that the location of the increased mass may affect the results more than just addition of increased mass. Weight placed over the rear axle should have a minimal effect, since the majority of the loading goes through the rear wheels, whereas increased weight on the front casters would be more impactful to RR. Manufacturers have made a continuous effort to reduce wheelchair weight, but this effect is small compared to the MWU’s weight on the overall RR. Additionally, accessories such as backpacks will add to RR and only necessary items should be carried.
Mass distribution
Mass distribution in wheelchairs has been theorized since the 1980’s to impact RR. 39 Even though changes in rear axle position is the easiest way to change the mass distribution, an adjustable rear axle is not found on all manual wheelchairs and the design of some rigid frame wheelchairs does not allow for this adjustment. When ordering a wheelchair, clinicians have to determine the correct placement of the rear axle before ordering the frame to ensure proper mass distribution. Even a small change in the mass distribution can have a significant impact on RR and therefore propulsion forces. However, it is still more beneficial for the majority of the mass to go through the rear wheels and not the front casters.
Surfaces
Multiple surfaces are the hardest factor to control because clinicians do not know every surface their clients may come in contact with. However, understanding the effects of different surfaces on RR can provide insight on which surfaces to limit exposure to. Reduced exposure to high RR surfaces would help in the preservation of the upper extremities. Course surfaces and high-pile carpet are shown to increase RR (increased propulsion effort) as compared to a smooth concrete surface. Clinicians can advise patients of the risks from extended propulsion on certain types of surfaces.
Conclusion
RR of manual wheelchairs has been explored extensively because of the influence it has on wheelchair propulsion and risks to the upper extremities. Unfortunately, because of the varied testing and reporting approaches, it is difficult to draw broad conclusions about the factors that influence RR, making it difficult to use the information to inform design, selection and setup of manual wheelchairs and related components. Motivated by these limitations, we recommend that a standardized test-method be developed that can directly measure RR of individual components (wheels/tires/casters) across a range of settings that are consistent with real-world conditions.
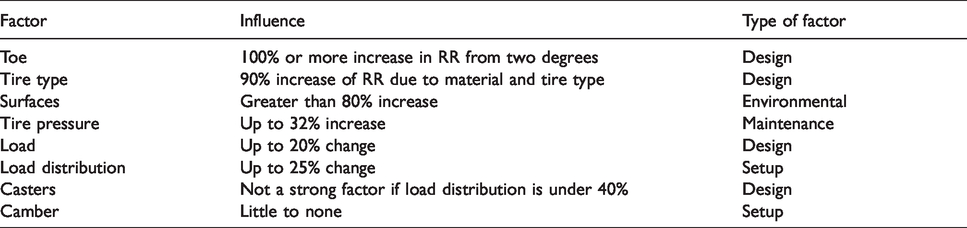
An overview of the influence of each factor discussed in the literature is shown in Table 17. Based on the variations in reporting methods, reporting procedures, and the tested levels of each factor, the level of influence relative to each factor is difficult to discern. The ranking was based on the studies that reported percent change or raw data where percent change could be calculated. While this does not provide the reliable data that a full experimental study exploring every factor in the same method, it provides insight into the potential impact of each factor. Toe has the potential to be a very significant influencer, however, there are very few studies done on it and its prevalence is unknown.29,41 Tire type was reported to have a large influence on RR.47,64 Surfaces were reported to have the third largest influence on RR, but are often difficult to control. 25 Tire pressure is the fourth biggest influencer, followed by the weight and load distribution on the device.47,53,55 The effect of overall weight and load distribution have conflicting results, as reported in various studies relating to their level of importance. While varying both overall weight and load distribution resulted in less than 20% change to RR, the multiple studies have varying conclusions as to which factor is more important, but all concluded that there should be no more than 40 percent of the load on the front casters25,53,67 With the appropriate load distribution, casters were found to not be a major factor contributing to RR. 43 Camber is also a nonsignificant influencer.29,41 While all factors should be considered, it is clear that some have a more substantial impact on RR.
Summary of factors and their influence on rolling resistance, in order of significance.
Despite a wide range of approaches to measuring RR, common themes can be seen in the findings of this scoping analysis. Wheelchair configurations have a significant impact on RR and propulsion, and small changes to configurations such as toe can have a substantial impact. Furthermore, the type of tire or size of the casters can significantly influence RR. Any changes in weight or the distribution of the load between the front and rear casters also impacts RR, and the position of the rear axle is critical in adjusting the load distribution. Lastly, it is shown that changes in the surface affect RR.
Over the numerous studies and tests that have been conducted to evaluate RR, it is clear that this drag force has a direct impact on manual wheelchair propulsion. As previously discussed, the prevalence of upper extremity injury and pain is high for MWUs. A focus by clinicians to decrease RR would help to ensure the preservation of the upper limbs. In the long term, UE injury has a significant impact on the independence of the MWU and the ability to carry out activities of daily living.
The goal for clinicians is to optimize the manual wheelchair setup for the patient to minimize RR, and therefore, reduce the prevalence of pain and injuries to the upper limbs. High pressure pneumatic tires properly inflated with no toe in the rear wheels is the most ideal setup for minimizing RR. Routine maintenance of proper tire inflation and inspection of alignment will help to mitigate RR. The load distribution should be primarily on the rear wheels with over 60% of the overall weight going through the rear wheels. A clinician should instruct the user as to safe propulsion techniques over surfaces with higher RR, such as coarse surfaces.
While the review identified the strongest influencers of RR, it does not replace clinical judgement. A case by case basis and evaluation for each client based on their needs, capabilities, and intent for use must be considered. This paper objectively reviewed the literature from a strictly RR perspective.
Limitations
A limitation of this paper is that it is based on the search of only one database, and therefore there may be additional information in the grey literature or conferencing proceedings addressing this topic. Additionally, the first author was the only reviewer of the articles and data charter. There may be other test methods that have not previously been used on wheelchairs but may exist for similar devices, such as bicycles or the automotive industry but falls outside the scope of this paper. However, to be comprehensive, the ISWP-SWG provided expert opinions. Furthermore, there were a high number of duplicates from their recommendations compared to the search results. Lastly, article references were also reviewed to ensure a comprehensive review.
Future work
Several threads of future work could exist in this area. As noted above, it is important to develop a standardized, component-level test method that can measure RR directly. Future testing should be able to consistently test many of the factors above in a systematic manner. Each factor needs to be tested independently and then in combination with other factors. It would also be beneficial to test parts of the wheelchair independently to see the individual effects with components, reduce systemic error, and not as part of the whole wheelchair. Lastly, a system to measure RR more accurately needs to be developed and employed to overcome the variations across and within the established testing methods. ISWP-SWG has a standardization goal for development of new testing equipment, which isolates the RR force and tests on a component-level. This would be able to test all of the factors above and provide the appropriate information to clinicians and manufacturers alike. With detailed product level information, clinicians can make more informed decision on product use and setup factors to optimize configurations for their clients. A more mechanically efficient device will be more biomechanically efficient and therefore reduce the risk of RSIs to end users.
Footnotes
Acknowledgements
Thank you to the ISWP-SWG for their continued support of this research and helpful feedback.
Declaration of conflicting interests
The author(s) declared no potential conflicts of interest with respect to the research, authorship, and/or publication of this article.
Funding
The author(s) disclosed receipt of the following financial support for the research, authorship, and/or publication of this article: The paper was supported by the following: National Science Foundation Integrative Graduate Education and Research Traineeship award number IGERT 1144584, Improving Health and Function Through Use of Performance Standards in wheelchair Selection Grant #: 90REGE0001-02-00, and U.S. Agency for International Development through Agreement Nos. APC-GM-0068, SPANS-037, APC-GM-0107, and FY19-A01-6024.
Guarantor
JP.
Contributorship
JO researched literature and JO and JP conceived the study. JO wrote the first draft of the manuscript. All authors reviewed and edited the manuscript and approved the final version of the manuscript.