
Abstract
Introduction
Gait impairment is common in multiple sclerosis (MS), but difficult to evaluate in clinical practice. In this proof-of-concept observational study, we compared walking ability recorded by Google Maps Timeline to conventional clinical measures in people with MS.
Methods
We used open-access Google Maps Timeline to record the total number of days with walking activity, walking distance, walking time, and walking speed. Each Google Maps Timeline variable was included in a different stepwise linear regression model including all conventional clinical variables.
Results
We included nine people with MS (age 43.1 ± 6.6 years; females 55.6%; disease duration 12.7 ± 3.1 years; median Expanded Disability Status Scale 3.0 (range 1.0–5.5)). Higher percentage of days with recorded walking was associated with lower Fatigue Severity Scale (p = 0.01), and higher MS Walking Scale (p = 0.04). Longer average daily walking distance was associated with shorter Timed-25 Foot Walking Test (p = 0.02), lower Expanded Disability Status Scale (p = 0.01), and higher Euro-Quality of Life (p = 0.04). Longer average daily walking time was associated with shorter Timed-25 Foot Walking Test (p = 0.03). Higher walking speed was associated with lower Fatigue Severity Scale (p = 0.04).
Conclusion
Google Maps Timeline parameters provide actual estimates of daily walking activities in MS.
Introduction
Multiple sclerosis (MS) is the most important cause of non-traumatic disability in young adults.1,2 Gait impairment is common in MS, and can be the consequence of weakness, unbalance, fatigue, depression, and other factors, ultimately causing poor quality of life.3,4 Evaluating gait impairment in clinical practice is time-consuming and not always feasible, with difficulties quantifying patients’ self-reported experiences. Digital tools have been investigated for remote monitoring, but are expensive and can only be used for research purposes.5–8 Thus, we have investigated the feasibility of monitoring gait in people with MS (PwMS) using Google Maps Timeline (GMT), an open-access digital tool embedded within the Google Maps smartphone application providing information about walking distance and time, thus being a promising proxy for walking abilities in real-life settings.
Methods
Study design and population
This is a proof-of-concept observational study aiming to evaluate whether individual GMT data provide direct measurements of the overall clinical status and walking abilities in MS. We have included consecutive PwMS consenting to the study and with Expanded Disability Status Scale (EDSS) < 6.0, from 25 to 29 July 2022. The present study was reviewed and approved by the local Ethics Committee. All participants signed informed consent before enrolment into the study; the study was conducted in accordance with the Declaration of Helsinki.
Clinical variables
At baseline (last week of July), for each patient we collected age, sex, disease duration, EDSS, 9 Timed-25 Foot Walking Test (T25FWT), 10 Multiple Sclerosis Walking Scale (MSWS), 11 European Quality of Life questionnaire, 12 and Fatigue Severity Scale (FSS). 13 During the clinical assessments and the monitoring period PwMS did not experience clinical relapses.
GMT data extraction
GMT was activated at baseline and continued on data recording until extraction. GMT derives locations from a number of sources, including IP addresses, saved activities, web and app activities, saved addresses, and device sensors, thus potentially covering both indoor and outdoor walking activities. We instructed participants to keep their mobile with them on all journeys. Extraction was performed in September 2022, and specifically referred to August 2022, using the Google Takeout tool and referring to GMT only. Data extraction provides timing (day and start/end time) and distance of walking activities. In particular, we recorded the first and last days with any GMT recorded activity and computed the total number of days. Then, we extracted activities rated as “high” or “medium” in terms of probability of walking (as from an undisclosed Google algorithm), and recorded: the total number of days with walking activity (from which we computed the percent of days with recorded walking), walking distance (from which we computed average daily walking distance), and walking time (from which we computed average daily walking time). Finally, by combining walking distance and time, we computed walking speed.
Statistics
Mean (and standard deviation), median (and range), and number (and percent) were calculated for different study variables, as appropriate. Considering the number of variables (risk of type I error) and the nature of our study (proof-of-concept), a parsimonious approach was applied, using different stepwise linear regression models (one for each GMT variable: percent of days with recorded walking, average daily walking distance, average daily walking time, and walking speed), including all clinical variables, with backward selection for p = 0.20 as the critical value for entering variables in the model. These models provide coefficients (Coeff), 95% confidence interval (95% CI), and p-values for significant associations only. Results were considered statistically significant if p < 0.05. Statistical analyses were performed using Stata/MP 15.0.
Results
We included 9 PwMS (age 43.1 ± 6.6 years; females 55.6%; disease duration 12.7 ± 3.1 years; median EDSS 3.0 (from 1.0 to 5.5)). Walking activities were recorded in 24.0 ± 13.5% days, with 643.73 ± 318.01 m of average daily walking distance, and 0.16 ± 0.12 h of average daily walking time. The average speed was 1.1 ± 0.4 m/s.
Higher percent of days with recorded walking was associated with lower FSS (Coeff = −1.14; 95% CI = −1.95, −0.33; p = 0.01, Figure 1(a)), and higher MSWS (Coeff = 0.73; 95% CI = 0.01, 1.46; p = 0.04, Figure 1(b)).
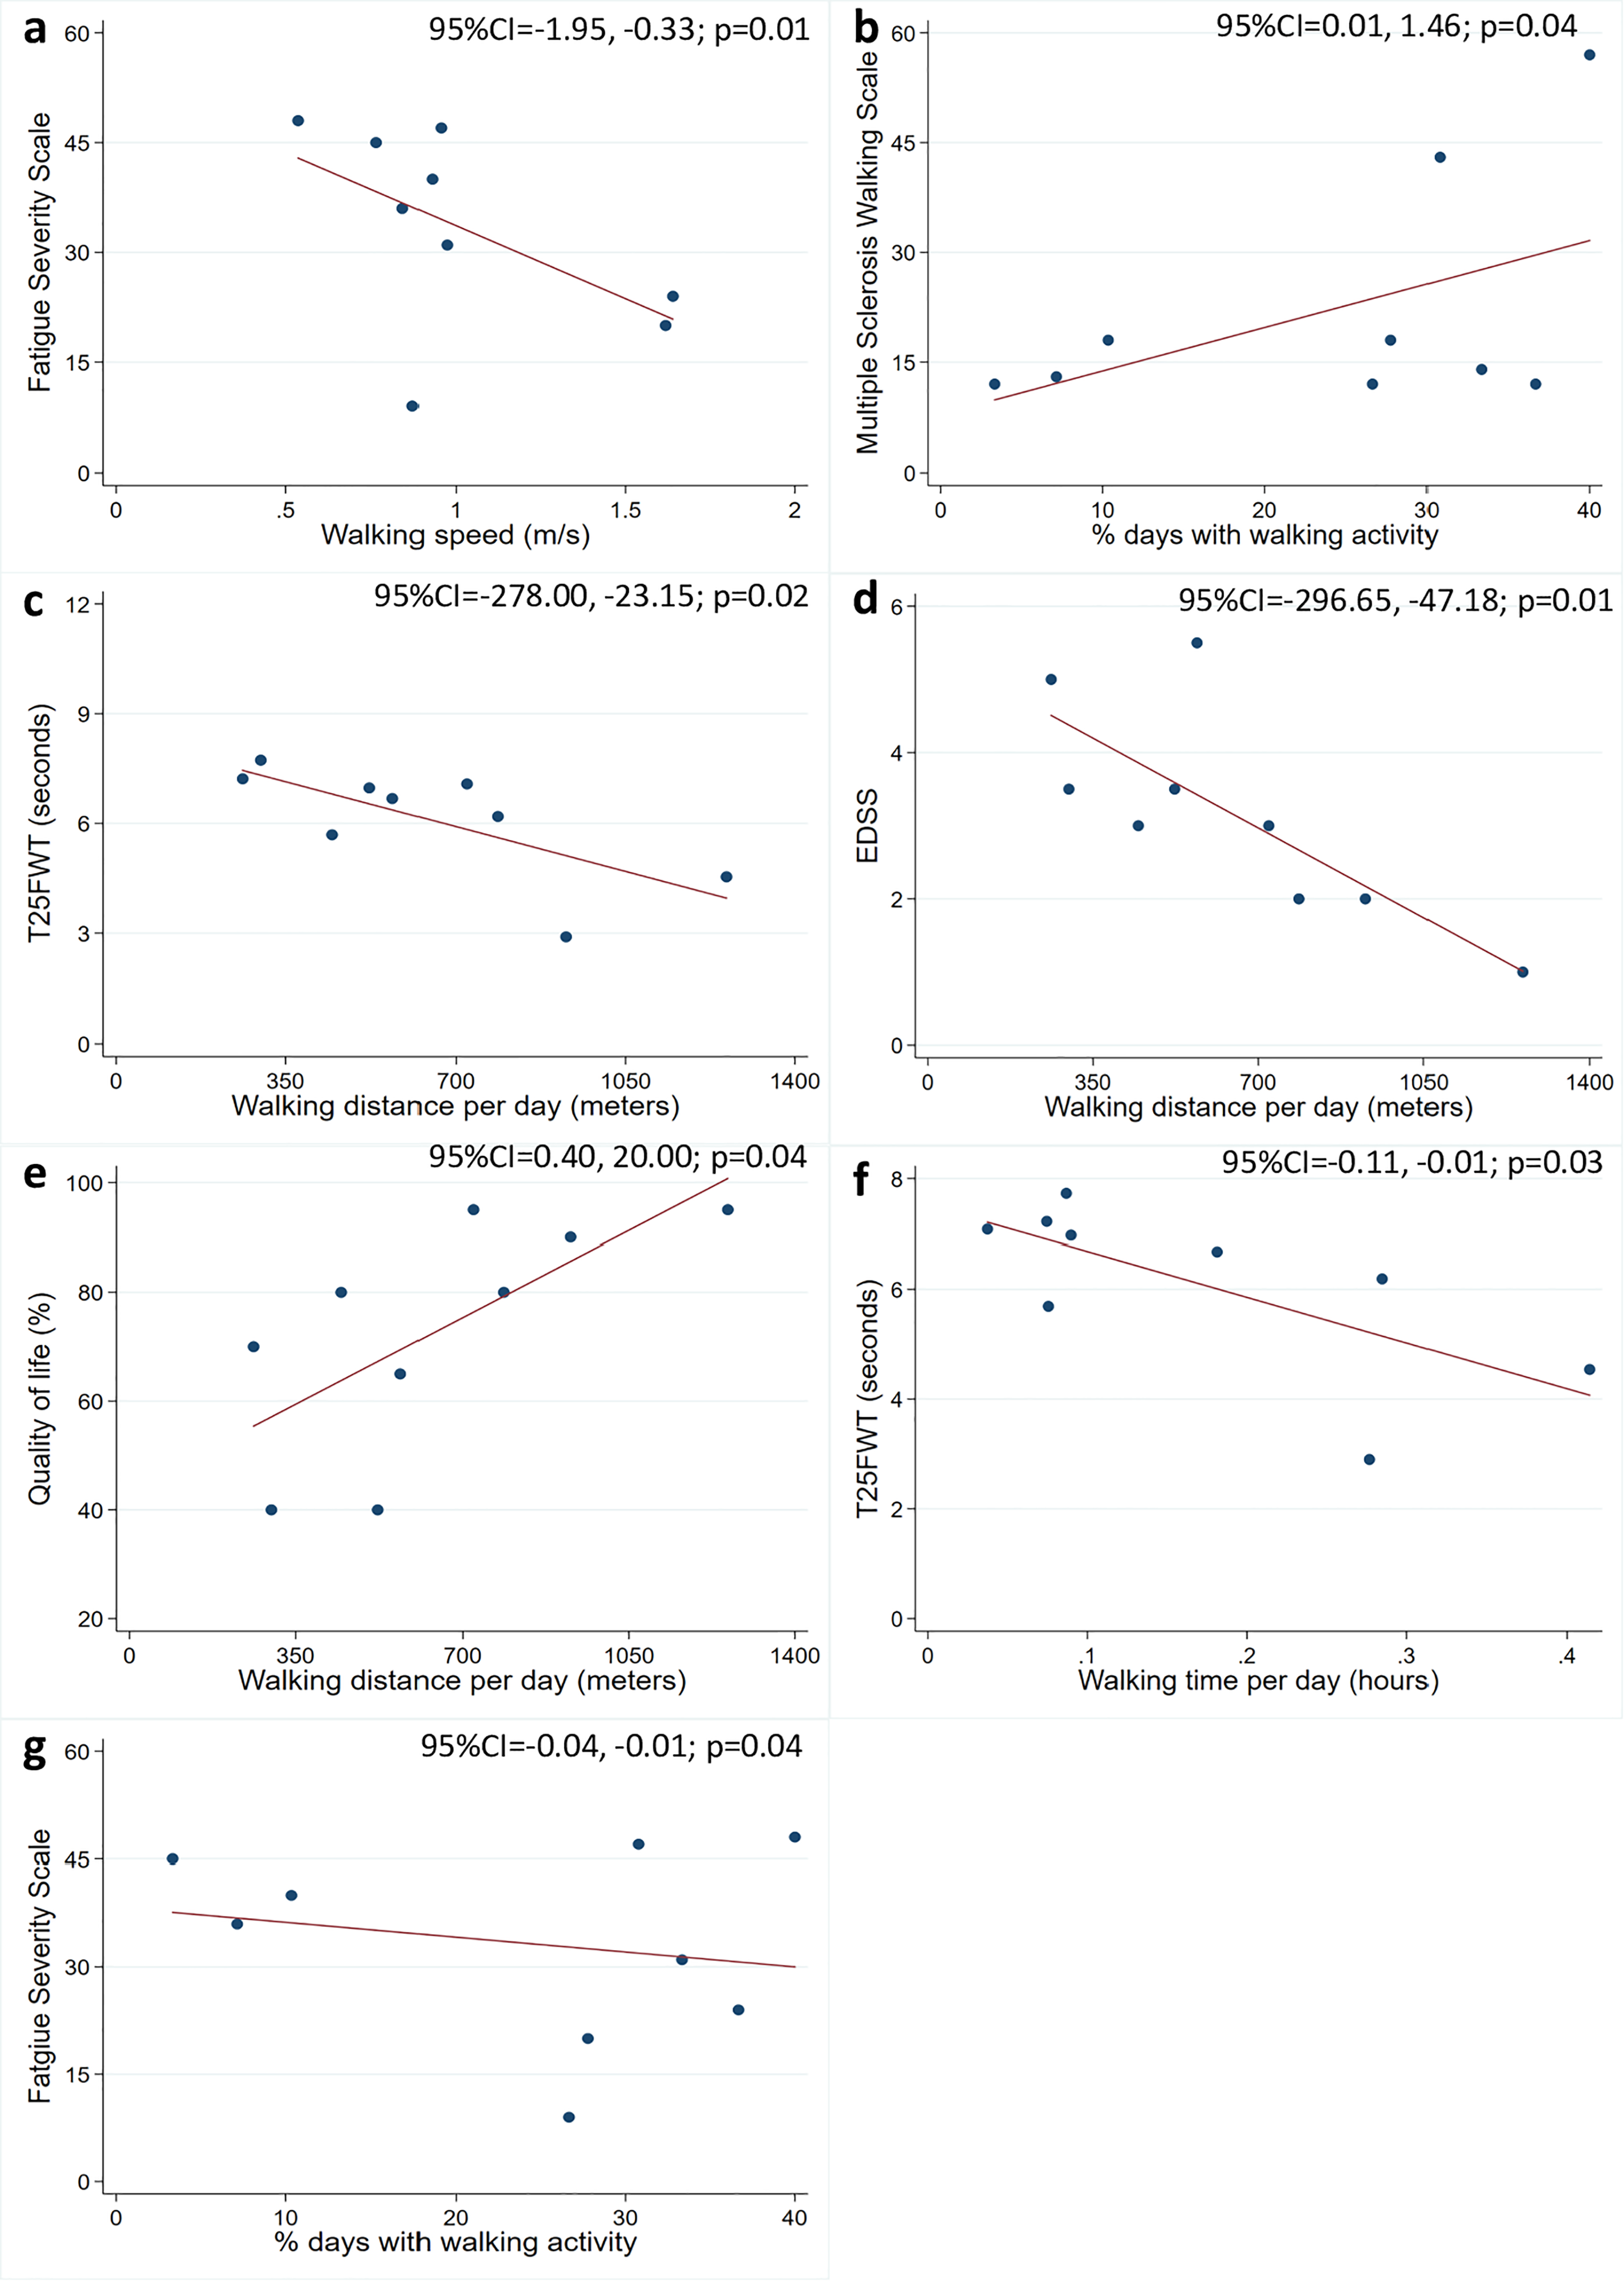
Google Maps Timeline (GMT) and clinical variables. Scatter plots show associations between GMT (x-axis) and clinical variables (y-axis). Coefficients (Coeff), 95% confidence interval (95% CI), and p-values are shown from stepwise linear regression models including, in turn, each GMT variable along with all clinical variables.
Longer average daily walking distance was associated with shorter T25FWT (Coeff = −150.58; 95% CI = −278.00, −23.15; p = 0.02, Figure 1(c)), lower EDSS (Coeff = −171.91; 95% CI = −296.65, −47.18; p = 0.01, Figure 1(d)), and higher percent quality of life (Coeff = 10.20; 95% CI = 0.40, 20.00; p = 0.04, Figure 1(e)).
Longer daily walking time was associated with shorter T25FWT (Coeff = −0.06; 95% CI = −0.11, −0.01; p = 0.03, Figure 1(f)).
Higher walking speed was associated with lower FSS (Coeff = −0.02; 95% CI = −0.04, −0.01; p = 0.04, Figure 1(g)).
Discussion
In our proof-of-concept study, we showed that GMT walking activities’ parameters were associated with a number of clinical measures of gait, disability, and fatigue, as well as quality of life.
Gait impairment in MS is the consequence of a number of factors, including motor disability and fatigue. 14 In keep with this, worse fatigue was associated with fewer days of walking activities and slower walking speed. Self-reported (MSWS) and objective walking performance (T25FWT) were associated with fewer days with walking activities, shorter daily walking distances, and less daily walking time. Higher disability (EDSS) was associated with shorter daily walking distances. Ultimately, worse quality of life was also associated with shorter daily walking distances. As such, GMT variables seem to provide actual estimates of daily walking activities in MS and related self-perceived symptoms, with the advantage of remote recording.
Limitations of our study include the small number of participants. However, this is a proof-of-concept observational study, aiming to explore the feasibility of using GMT and, thus, we only included 9 PwMS in a limited time frame. The study was conducted in summer time in Italy, and the heat might have affected both clinical measures and walking abilities on GMT, thus underestimating the extent of our associations. Unfortunately, the Google algorithm recording walking distance, time, and related probability, is undisclosed and would require validation towards other parameters using smartphone or wearable-based sensors. Still, our results are encouraging, and the use of GMT in future studies enrolling more participants is warranted.
In conclusion, GMT seems an effortless and open-source tool to monitor walking in PwMS. In the future, GMT could be used to evaluate walking abilities in MS in clinical practice (e.g. treatment response, progression, etc.), and rehabilitation settings (e.g. fatigue).
Footnotes
Declaration of conflicting interests
The author(s) declared the following potential conflicts of interest with respect to the research, authorship, and/or publication of this article: DC has received research grants from Merck. LL has received a travel grant and speech fee from Roche, Novartis, Biogen, Mylan, BMS, Almirall, Merck, and Teva. AC has received research grants from Almirall, research grants from ECTRIMS-MAGNIMS, and honoraria from Almirall, Biogen, Roche, Sanofi-Genzyme, Merck, Ipsen, and Novartis. MP has received research grants from the Italian MS Foundation and Baroni Foundation, honoraria from HEALTH&LIFE S.r.l. and Biogen, and sponsorship for travel/meeting expenses from Novartis, Roche, and Merck. RL has received honoraria from Biogen, Merck, Novartis, Roche, and Teva. VBM has received research grants from the Italian MS Society, and Roche, and honoraria from Bayer, Biogen, Merck, Mylan, Novartis, Roche, Sanofi-Genzyme, and Teva. MM has received research grants from the ECTRIMS-MAGNIMS, the UK MS Society, and Merck; honoraria from Biogen, Ipsen, Merck, Roche, and Sanofi-Genzyme.
Funding
The author(s) received no financial support for the research, authorship, and/or publication of this article.