
Abstract
Background
CombiRx was a randomized, double-blind, placebo-controlled phase 3 trial in treatment-naive relapsing-remitting multiple sclerosis (RRMS) patients randomized to intramuscular interferon beta-1a (IM IFN beta-1a), glatiramer acetate (GA), or both therapies.
Objective
This analysis investigated changes in serum neurofilament light-chain (sNfL) levels in response to treatment and assessed baseline sNfL as a predictor of relapse.
Methods
RRMS patients treated with IM IFN beta-1a 30 µg weekly + placebo (n = 159), GA 20 mg/mL daily + placebo (n = 172), or IM IFN beta-1a + GA (n = 344) were included. A linear mixed model compared sNfL values over time. Cox regression models analyzed baseline sNfL and gadolinium-enhancing (Gd+) lesions as predictors of relapse.
Results
In all treatment arms, the proportion of patients with sNfL ≥16 pg/mL decreased significantly from baseline to 6 months and was maintained at 36 months. A significantly higher percentage of patients with both baseline sNfL ≥16 pg/mL and ≥1 Gd+ lesion experienced relapses within 90 days compared to patients with sNfL <16 pg/mL and/or no Gd+ lesions.
Conclusion
sNfL levels were reduced within 6 months and remained low at 36 months. Results suggest that the combination of lesion activity and sNfL was a stronger predictor of relapse than either factor alone.
Keywords
Introduction
In patients with multiple sclerosis (MS), disease progression and treatment response are currently assessed using magnetic resonance imaging (MRI) measures (e.g. new T2 lesions or gadolinium-enhancing [Gd+] lesions) and clinical assessments (e.g. Expanded Disability Status Scale [EDSS] scores and relapses). These measures are very useful but are difficult to standardize across providers and are known to lack sensitivity and specificity. 1 More sensitive, quantifiable, cost-effective, and noninvasive biomarkers closely reflecting disease activity, progression, and treatment response could supplement or replace traditional measures, informing treatment decisions and advancing the field toward precision medicine.2,3
Neurofilament light chain (NfL) is an axonal cytoskeletal protein that is released into the extracellular space following neuronal injury, such as brain trauma. 4 Elevated levels of NfL have been detected in neurodegenerative diseases,2,5 including MS.6,7 NfL has been proposed as a prognostic biomarker for MS8–10 and as a biomarker for MS disease activity and treatment response.11–13 In patients with MS, higher serum NfL (sNfL) levels are associated with greater clinical and MRI measures of disease activity12,14,15 and may predict worse long-term clinical and MRI outcomes.12–14,16–25 sNfL levels have also been shown to decline in response to treatment with MS disease-modifying therapies (DMTs).12,15,24,26–29 Thus, an assessment of sNfL levels at baseline and over the course of long-term treatment may provide a more sensitive measure of treatment effectiveness than clinical or MRI measures alone and can help to inform whether baseline sNfL levels predict treatment outcomes.
This post hoc analysis used data from the CombiRx trial to assess the potential of sNfL as a biomarker for patients with relapsing-remitting MS (RRMS). The CombiRx study was a randomized, double-blind, placebo-controlled phase 3 trial that compared clinical and MRI outcomes in DMT-naive patients with RRMS treated with intramuscular (IM) interferon (IFN) beta-1a, glatiramer acetate (GA), or a combination of both therapies. 30 In the core 3-year study, the combination therapy was better than IFN alone, but not GA alone, in annualized relapse rate (ARR) reduction at month 36 using protocol-defined exacerbations (primary analysis) or non-protocol-defined exacerbations; GA alone was superior to IFN alone using either definition. 31 Compared to either agent alone, the combination was not better at reducing EDSS progression or change in Multiple Sclerosis Functional Composite (MSFC) score. Overall, patients in all three study arms appeared to benefit from treatment regardless of which relapse definition was used. Notably, combination treatment was associated with a significant reduction in new lesion activity and total lesion volume in comparison with each single therapy. 31 However, in the extension study, this early benefit of the combination therapy on lesion activity was not followed by a significant clinical effect based on the EDSS score or annualized relapse rate (ARR) for the combination therapy over either single therapy. 32 More sensitive metrics such as sNfL may provide a better prognostic biomarker of clinical outcomes.
The primary objective of this post hoc analysis was to assess long-term changes in sNfL levels in patients with RRMS treated with IM IFN beta-1a, GA, or both therapies (IM IFN beta-1a + GA) in the CombiRx study. In addition, this study sought to evaluate baseline sNfL and Gd+ lesions as predictors of relapse.
Methods
Study design and patients
This was a post hoc analysis of data from CombiRx (ClinicalTrials.gov identifier NCT00211887), a randomized, double-blind, placebo-controlled phase 3 trial in treatment-naive RRMS patients randomized to IM IFN beta-1a 30 µg weekly + placebo, GA 20 mg/mL daily + placebo, or IM IFN beta-1a + GA treatment for a minimum of 3 years (core study) and up to 7 years (extension study).30–32 This analysis used data from patients in the CombiRx study who volunteered for a biomarker substudy offered at most sites. Participants were between the ages of 18 and 60 years, with an EDSS score ≤ 5.5 and a diagnosis of RRMS based on the Poser or McDonald criteria. 33 The study enrolled patients between January 2005 and April 2009; additional details of the study design and inclusion/exclusion criteria, as well as primary results, have previously been reported. 30 The protocol was approved by each site's independent ethics committee (e.g. institutional review board), and all patients provided written informed consent. The study was performed in accordance with the Declaration of Helsinki.
Endpoints, assessments, and statistical analyses
Samples for biomarker analysis were collected at baseline and at 6, 12, 36, and 48 months. sNfL levels were analyzed with a Simoa Human Neurology 4-Plex A assay (Quanterix) on an HD-1 single-molecule array. EDSS scores were collected every 3 months. Relapses were captured upon the occurrence and assessed with an in-person visit based on standard relapse criteria, including an increase in EDSS score.
The baseline characteristics of patients were summarized using descriptive statistics. P values for the overall treatment groups were calculated using a general linear model except for Gd+ counts, where a Kruskal-Wallis test was run. The proportion of patients with sNfL ≥16 pg/mL was evaluated on the basis of results from a previous study, which indicated that sNfL ≥16 pg/mL was associated with higher disease activity. 24 A linear mixed model compared sNfL values over time adjusted for baseline age, sex, EDSS score, sNfL level, the presence of Gd+ lesions, and the actual body mass index. Cox regression models adjusted for age group, sex, and treatment arm analyzed baseline sNfL, baseline Gd+ lesions, and the combination of sNfL ≥16 pg/mL and ≥1 Gd+ lesion as predictors of relapse. Cox regression analyses were also used to estimate the predictive values for relapse in patients with baseline Gd+ lesions and patients with sNfL ≥16 pg/mL and ≥ 1 Gd+ lesion. Analyses of the proportion of patients with relapse by 90 days, 6 months, 1 year, and 3 years were adjusted for person-time of exposure in which patients who had experienced a relapse no longer contributed to the subsequent exposure time. Because this was a 3-year study for the primary outcome, patient numbers at 48 months were only about 60% of the total number of patients randomized, and herein only data through 36 months are analyzed.
Results
Patients
The CombiRx trial included data from 1008 patients. This post hoc study includes data from a subset of patients who provided samples for the biomarker substudy and had samples over the 3 years (n = 675). Samples from patients treated with IM IFN beta-1a (n = 159), GA (n = 172), and IM IFN beta-1a + GA (n = 344) were analyzed. Baseline characteristics were generally well balanced between the treatment groups, and there were no statistically significant differences between the groups (Table 1). However, patients in the IM IFN beta-1a cohort had a longer mean time since MS diagnosis than patients in the GA cohort or the IM IFN beta-1a + GA (combination) cohort (1.4 years vs. 1.0 or 1.1 years), had a longer mean time from MS symptom onset (5.0 years vs. 4.0 or 4.2 years), and had lower baseline sNfL levels (17.0 pg/mL vs. 20.5 or 19.6 pg/mL). Patients in the GA cohort had a greater mean number of Gd+ lesions at baseline than did the IM IFN beta-1a and combination cohorts (2.0 vs. 1.8 or 1.7).
Baseline demographic and disease characteristics.

EDSS: Expanded Disability Status Scale; GA: glatiramer acetate; Gd+: gadolinium-enhancing; IFN: interferon; IM: intramuscular; MS: multiple sclerosis; SD: standard deviation; sNfL: serum neurofilament light chain.
P-values were calculated using a general linear model except for Gd+ counts, where a Kruskal-Wallis test was run.
Change in sNfL levels over time
At baseline, the percentage of patients with sNfL ≥16 pg/mL was 30.8% in the IFN arm, 37.2% in the GA arm, and 41.0% in the combination arm, and these differences were not significantly different between groups except for the unadjusted comparison between the combination group and the IFN group (p = 0.0287). Overall, the percentage with sNfL ≥ 16 pg/mL was 37.6%, 19.6%, 14.2%, and 12.6% for baseline, 6, 12, and 36 months, respectively. In all treatment arms, the proportion of patients with sNfL ≥16 pg/mL decreased significantly from baseline to 6 months (all p < 0.05), a decrease that was maintained at 12 and 36 months (p < 0.05 to p< 0.001) (Figure 1). The greatest treatment effect occurred between baseline and 6 months; changes in the proportion of patients with sNfL ≥16 pg/mL from 6 to 12 months or from 12 to 36 months were significant (data not shown), and at all time points, reduction of sNfL compared to baseline remained statistically significant (Table 2). Overall, the proportion of patients whose sNfL decreased from ≥16 pg/mL to <16 pg/mL was 48.6% (141/290) from baseline to 6 months, 37.0% (67/181) from 6 to 12 months, and 27.0% (53/196) from 12 to 36 months. The proportion of patients whose sNfL increased from <16 pg/mL to ≥16 pg/mL was 4.7% (18/385), 2.2% (10/456), and 2.8% (12/429) at these time points, respectively.
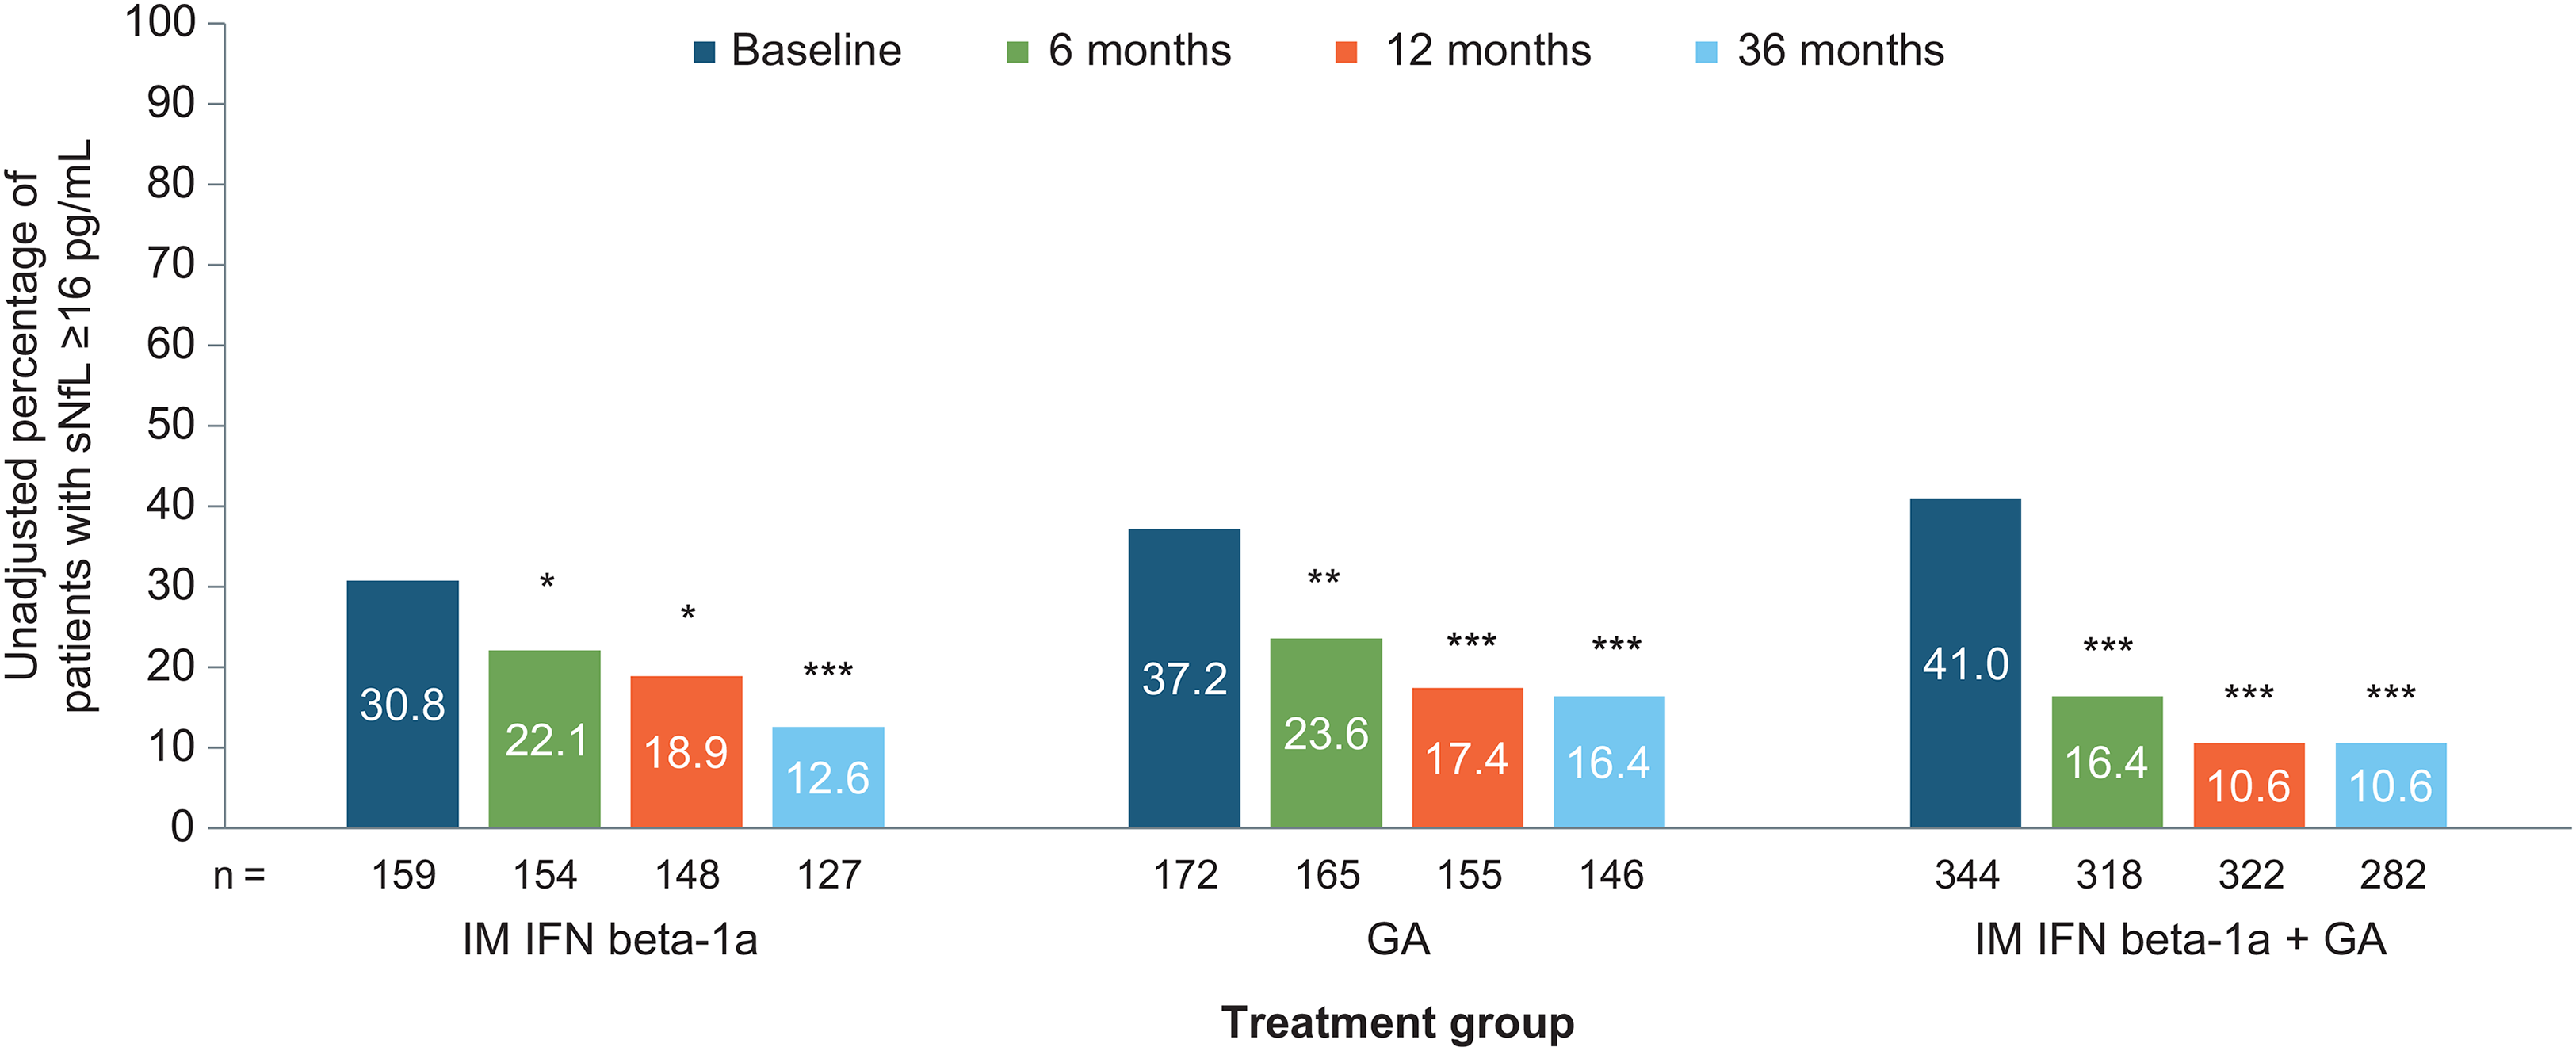
Absolute (unadjusted) percentage of patients with sNfL levels ≥16 pg/mL for each treatment group over time. Comparisons were adjusted for age, sex, the presence of gadolinium-enhancing lesions, Expanded Disability Status Scale score, baseline sNfL level, and actual body mass index. GA: glatiramer acetate; IFN: interferon; IM: intramuscular; sNfL: serum neurofilament light-chain. *p < 0.05 for change from baseline; **p < 0.001 for change from baseline; ***p < 0.0001 for change from baseline.
Reduction in adjusted least squares mean sNfL level from baseline for each treatment arm.

GA; glatiramer acetate; IFN: interferon; SE: standard error; sNfL: serum neurofilament light-chain.
Means are adjusted for age, sex, ≥ 1 gadolinium-enhancing lesion, Expanded Disability Status Scale score, baseline serum neurofilament light-chain level, and actual body mass index.
The proportion of patients with sNfL above the ≥16 pg/mL threshold decreased significantly from baseline to 36 months in all three groups: by 18.2% in the IM IFN beta-1a group (p < 0.0001; Figure 2(a)), by 20.8% in the GA group (p < 0.0001; Figure 2(b)), and by 30.4% in the combination group (p < 0.0001; Figure 2(c)).
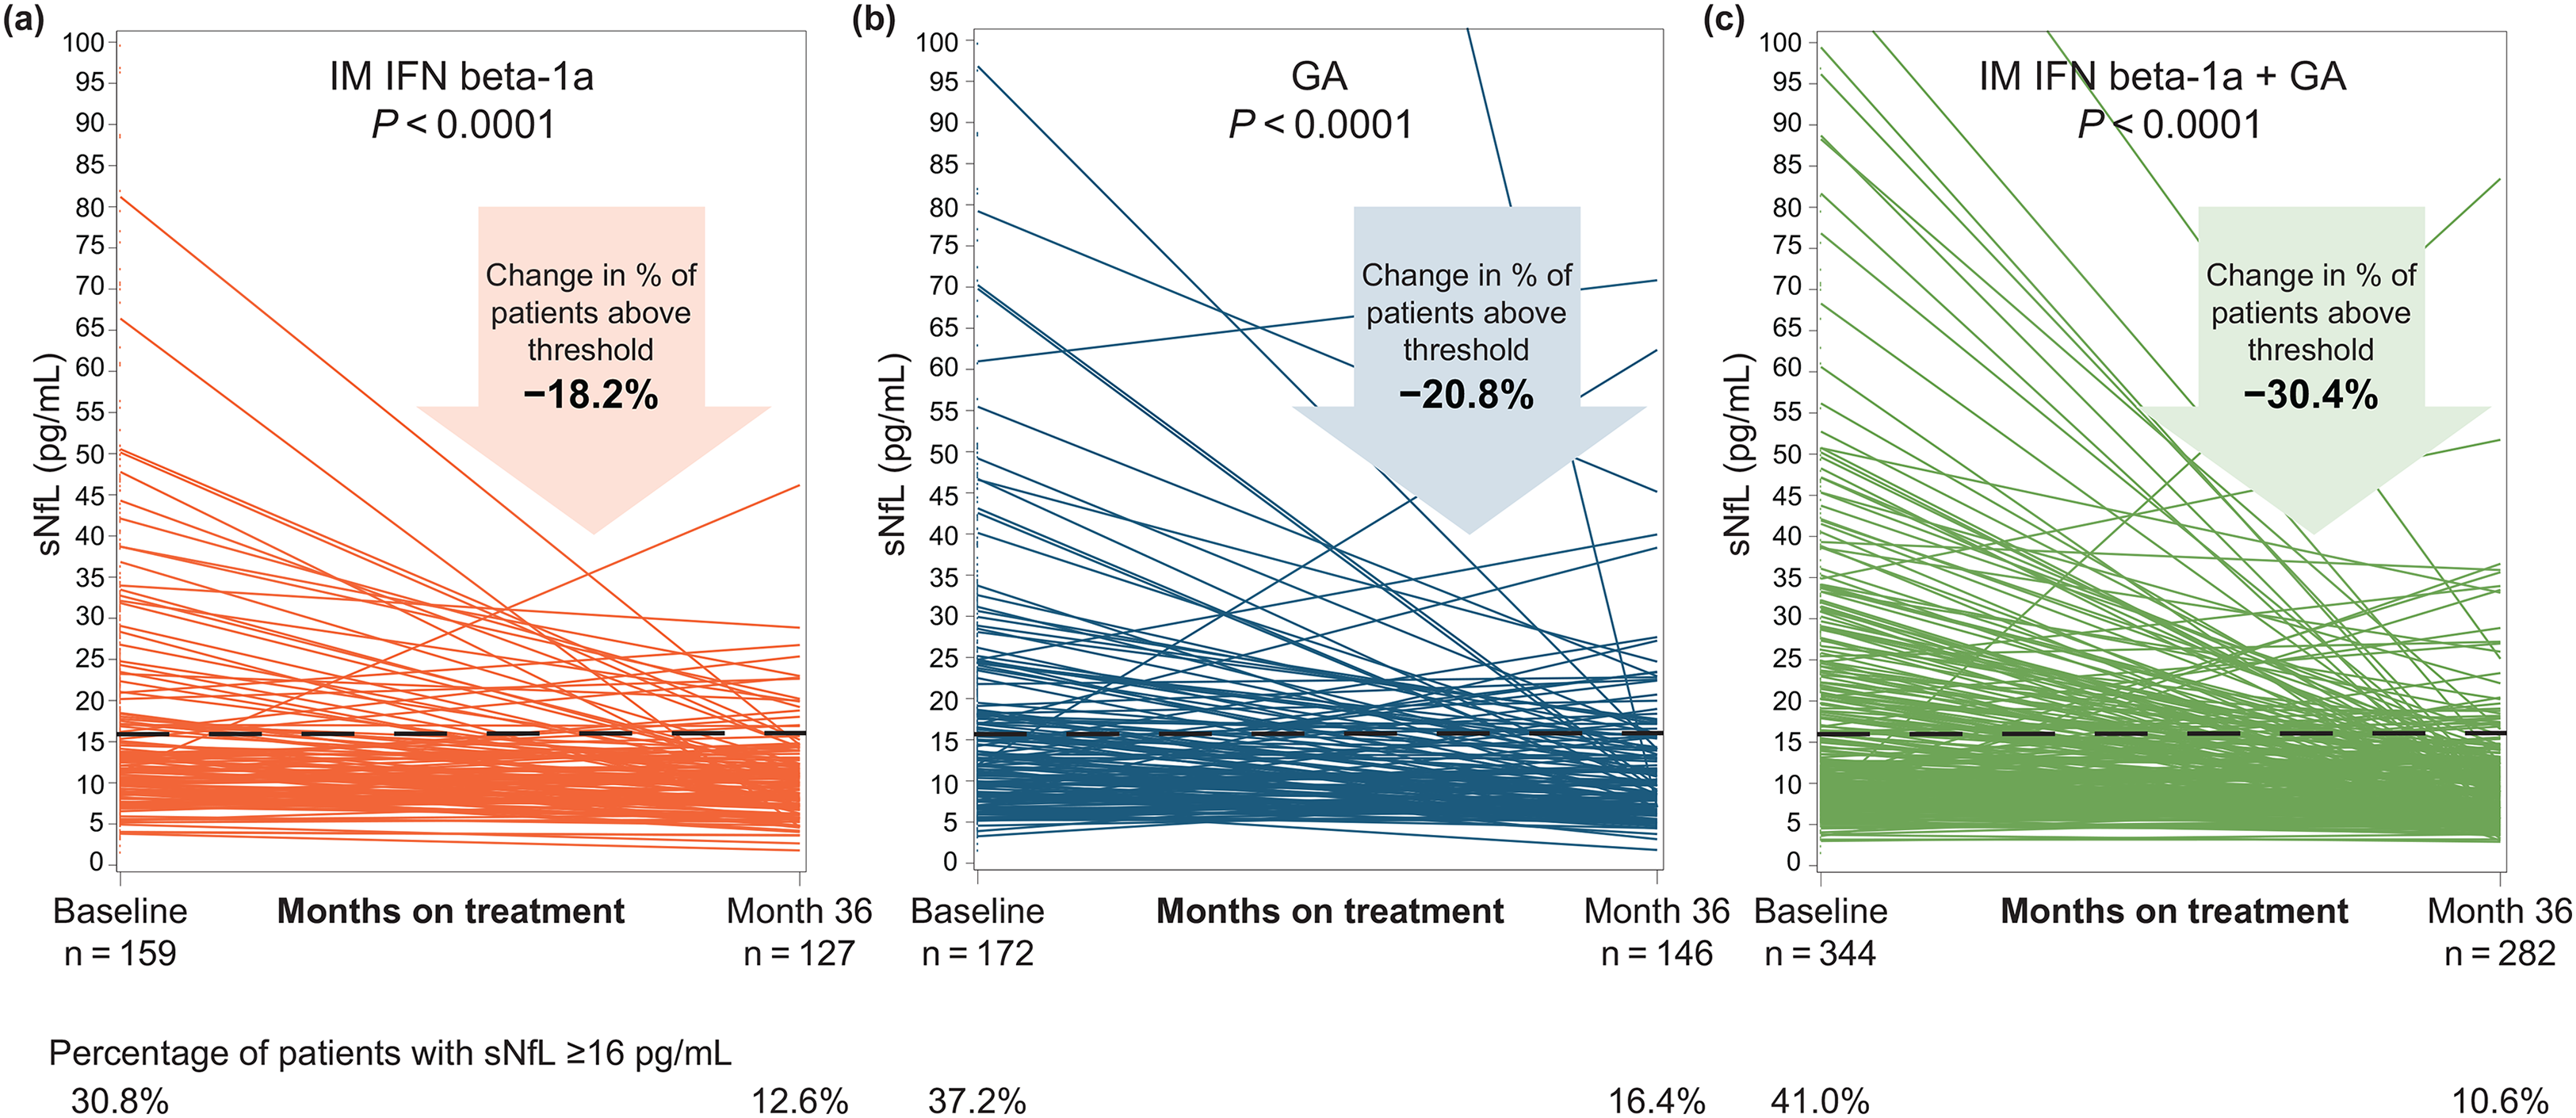
Unadjusted sNfL levels for individual patients at baseline and month 36 in the (a) IM IFN beta-1a, (b) GA, and (c) IM IFN beta-1a + GA, and (c) IM IFN beta-1a +GA treatment groups. The p-value indicates the significance of the change in the proportion of patients with sNfL ≥16 pg/mL from baseline to month 36. Comparisons were adjusted for age, sex, the presence of gadolinium-enhancing lesions, Expanded Disability Status Scale score, baseline sNfL level, and actual body mass index. GA: glatiramer acetate; IFN: interferon; IM: intramuscular; sNfL: serum neurofilament light-chain.
As with the reductions in the proportion of patients with sNfL ≥16 pg/mL, significant reductions in adjusted least squares mean sNfL levels were observed from baseline to 6 months and the significant reduction from baseline was maintained at 12 and 36 months for all three treatment groups (Table 2). The greatest magnitude of change in sNfL levels occurred between baseline and 6 months across all three arms (Supplemental Figure 1).
Baseline sNfL level as a predictor of relapse
Baseline sNfL ≥16 pg/mL predicted relapse with diminished strength in relation to the time period of the prediction. Baseline sNfL ≥16 pg/mL significantly predicted relapse within 90 days (hazard ratio [HR], 2.01; p = 0.0149) and 6 months (HR, 1.51; p = 0.0449), but not at 12 months from baseline (HR, 1.33; p = 0.0877) nor over the entire 3-year study duration (HR, 1.06; p = 0.6468). The mean time to first relapse was 100.5 days shorter in patients with baseline sNfL ≥16 pg/mL than in those with baseline sNfL <16 pg/mL (384.3 vs. 484.8 days; p = 0.0404).
Over the course of the 3 years, 52.2% of patients in the IM IFN group relapsed, 39.0% of patients in the GA group relapsed, and 38.4% of patients in the combination group relapsed. Relapse within 90 days was seen in a significantly higher percentage of patients with baseline sNfL ≥16 pg/mL and ≥ 1 baseline Gd + lesion (16.4%) in comparison with patients with a baseline sNfL ≥ 16 pg/mL and no baseline Gd+ lesions (10.0%) and patients with baseline sNfL <16 pg/mL either with Gd+ lesions (7.2%) or without baseline Gd+ lesions (6.2%; p = 0.0094; Table 3).
Percentage of patients who relapsed at different study timepoints as a function of baseline Gd+ lesions and sNfL.
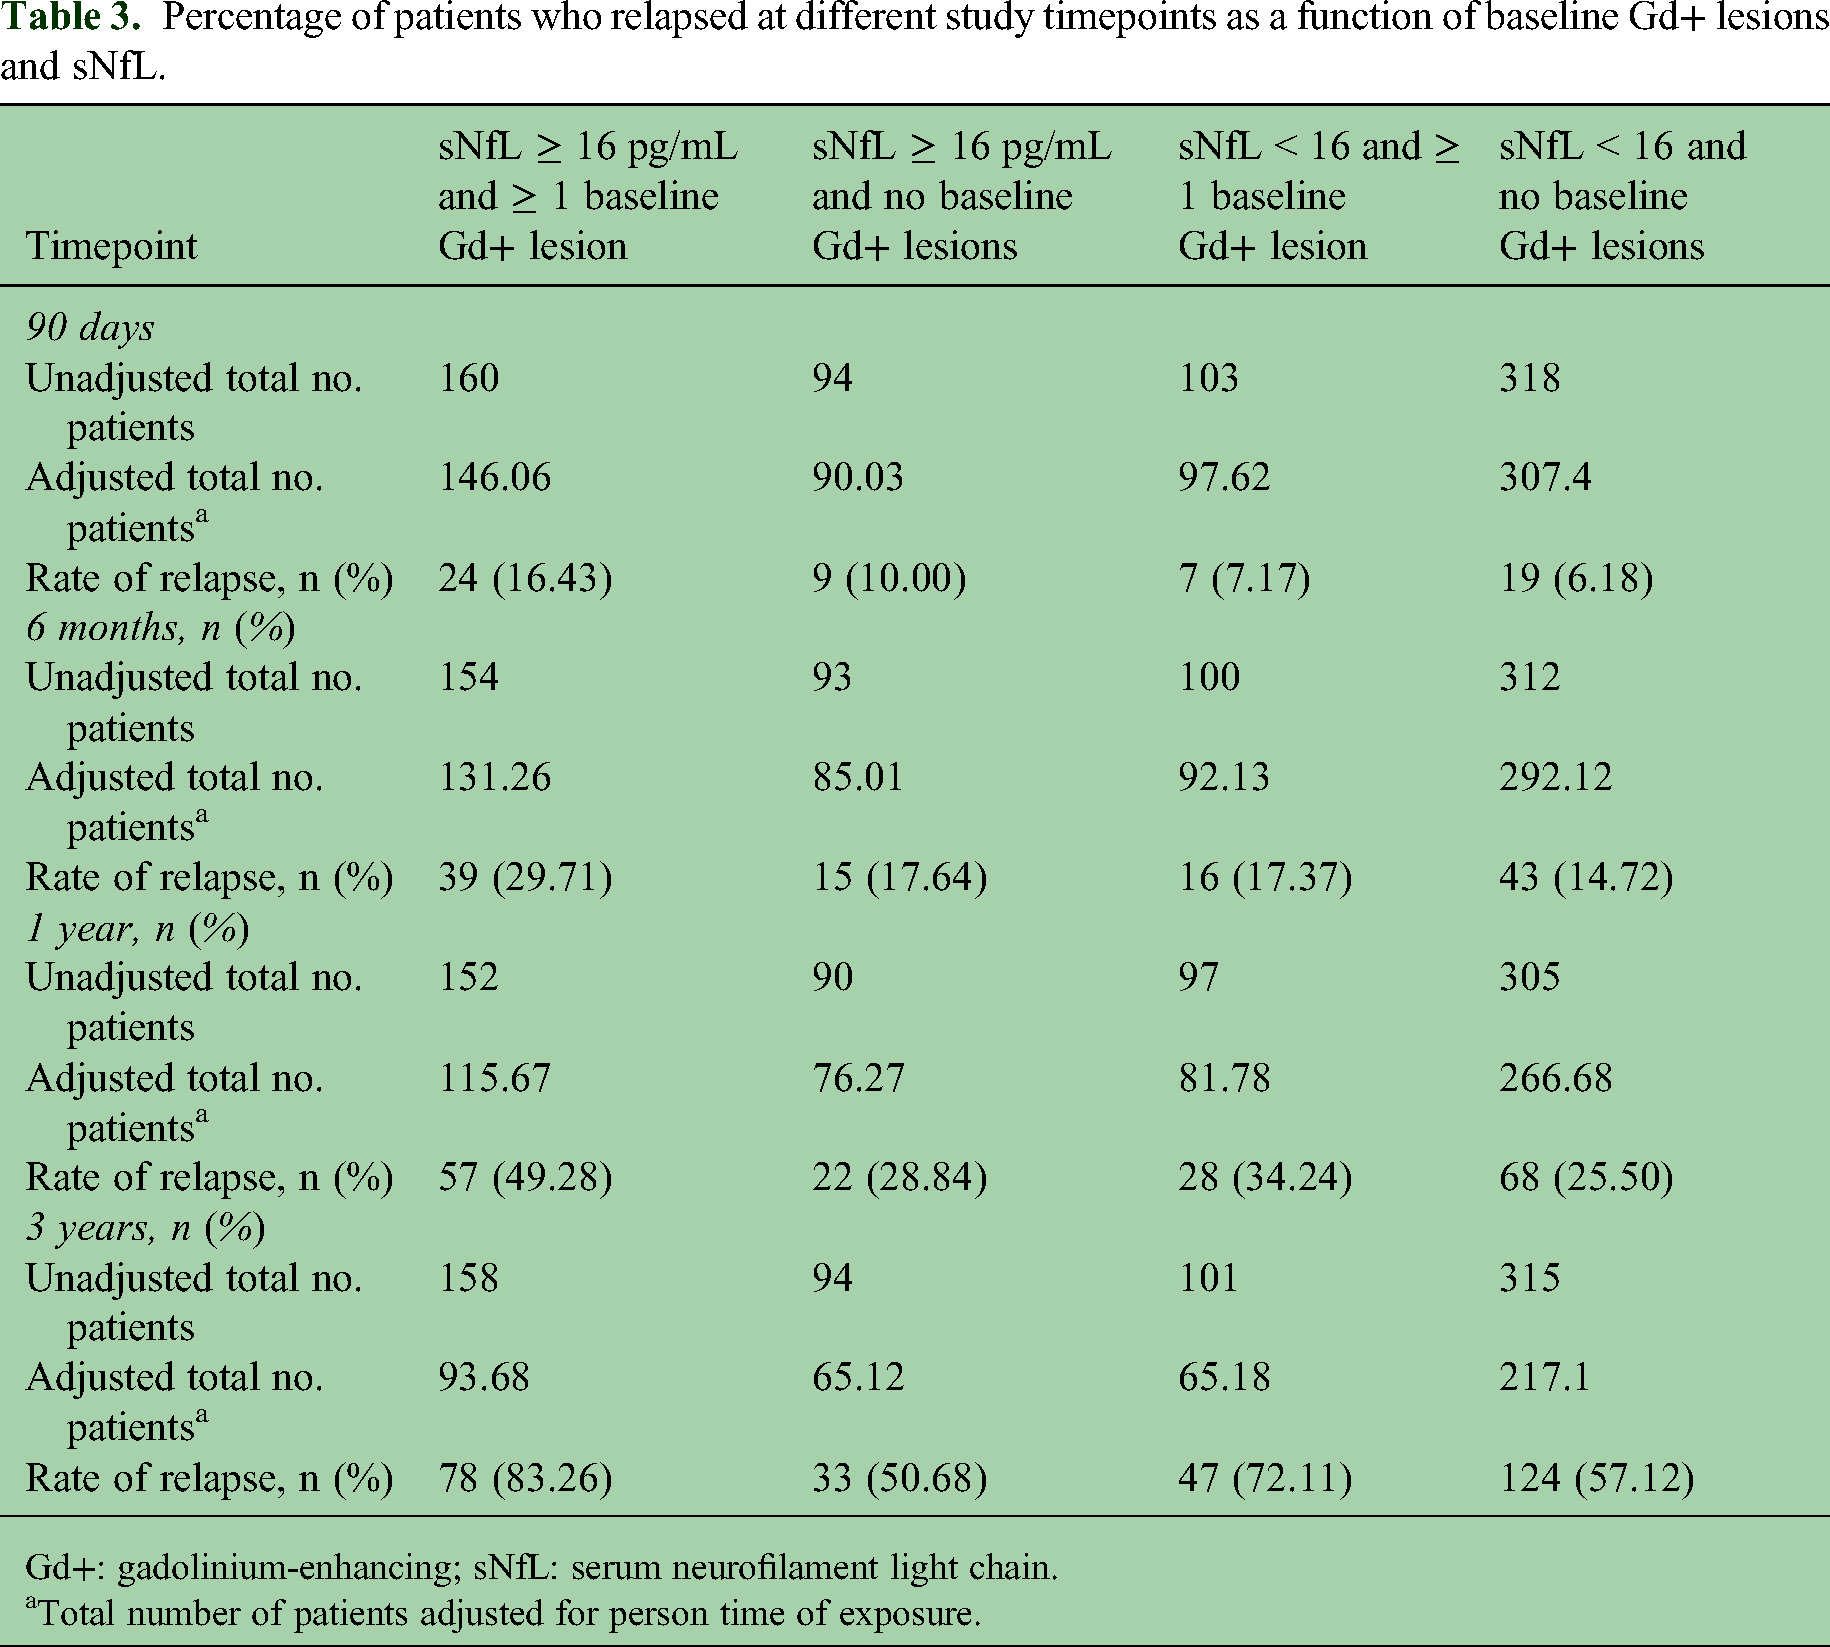
Gd+: gadolinium-enhancing; sNfL: serum neurofilament light chain.
Total number of patients adjusted for person time of exposure.
Similar results were seen at other timepoints in the study; relapse was seen in a higher percentage of patients with baseline sNfL ≥ 16 pg/mL and ≥ 1 baseline Gd+ lesion in comparison with patients with a baseline sNfL ≥ 16 pg/mL and no baseline Gd+ lesions or patients with baseline sNfL < 16 pg/mL either with Gd+ lesions or without baseline Gd+ lesions (Table 3).
Additionally, we observed that when not adjusted for sNfL, the presence of Gd+ lesions at baseline was a predictive factor for relapse within 90 days (HR, 1.76; p = 0.0339) and over the 3-year study duration (HR, 1.33; p = 0.0196). When assessed within the sNfL subgroups of < 16 and ≥ 16 pg/mL at baseline, the estimated HRs were 1.05 (p = 0.9065) and 1.67 (p = 0.2002), respectively. When an interaction term was included in the model predicting a relapse within the next 90 days, the interaction term was not significant (p = 0.5011).
Discussion
The results of this post hoc analysis demonstrated that treatment with IM IFN beta-1a, GA, or a combination of IM IFN beta-1a and GA significantly reduced sNfL levels within 6 months of treatment initiation in patients with RRMS. Although the effects on sNfL reduction were greatest within the first 6 months of treatment, levels continued to decrease through months 12 and 36 and maintained a significant difference from baseline in all treatment groups.
Previous studies have demonstrated that in patients with MS, higher sNfL levels are associated with greater disease activity, as measured by lesion activity, EDSS score, and relapses.12–15 Alongside the results from the core CombiRx trial, which demonstrated low ARRs over 36 months (ranging from 0.11 to 0.32, depending on the stringency of the relapse definition) and a reduction in the number of Gd+ lesions within 6 months in all three treatment groups, 31 the reduction in sNfL levels observed in this post hoc analysis indicated that sNfL may be useful as a biomarker of disease activity, short-term risk prediction (e.g. up to 1 year), and treatment response.
The reduction in sNfL observed in all treatment arms confirms earlier studies showing that sNfL levels are reduced with DMT treatment.12,24,26,28,29 A study of two independent MS cohorts found that the time since the initiation of a new DMT was significantly associated with a decrease in follow-up sNfL level, and the decrease was similar across different DMTs, including injectable DMTs, natalizumab, fingolimod, and rituximab. 12 Other studies have reported significant decreases from treatment initiation in NfL level with natalizumab, 28 fingolimod,26,29 dimethyl fumarate, 27 and peginterferon beta-1a. 24 The current study expands upon these previous findings to demonstrate a significant reduction in sNfL level with IM IFN beta-1a, GA, or the combination of both therapies. Moreover, in patients with baseline sNfL ≥16 pg/mL, the time to first relapse was significantly shorter than in patients with baseline sNfL <16 pg/mL and among this subgroup, shows the predictive power of baseline Gd+ lesions for future relapses. This finding is consistent with data from other studies, which demonstrated that declines in sNfL levels were correlated with improved clinical and MRI outcomes and suggests a possible use for sNfL as a disease-monitoring biomarker for RRMS.24,25
Apart from evaluating the effect of treatment on sNfL levels, baseline sNfL levels were assessed as a predictor of relapse. In an analysis of all patients regardless of treatment arm, baseline sNfL ≥16 pg/mL most strongly predicted relapse within 90 days, and it predicted relapse with somewhat less precision as the time horizon increased. Results indicated that baseline sNfL levels may also have utility in predicting relapses up to 1 year. These findings agree with and expand upon earlier studies of the prognostic value of sNfL with respect to disease outcomes, including a study that suggested that cerebrospinal fluid (CSF) concentrations of NfL were associated with the risk of relapse over 2 years in newly diagnosed clinically isolated syndrome (CIS) or RRMS patients. 21 Several longitudinal studies in patients with MS support NfL as a predictive biomarker of disease activity.16,19,23–25 One such longitudinal study reported an association between average sNfL in the first few years after clinical MS onset and 10-year lesion load and brain atrophy, as well as worsening fatigue outcomes. 16 Another longitudinal study of patients with RRMS reported an association of higher baseline CSF NfL levels with disability worsening and progression to secondary progressive MS over 5 years. 19 Furthermore, in RRMS patients treated with IM IFN beta-1a or placebo, a longitudinal study reported that higher sNfL levels at 3 years were predictive of a decrease in brain parenchymal fraction over 8 years and a higher EDSS score at 8 years. 23 In an analysis of RRMS patients in the peginterferon beta-1a ADVANCE study, baseline sNfL was a predictor of brain atrophy and new T2 lesions over 4 years, 24 and in an analysis of CIS patients in the IM IFN beta-1a CHAMPS study, higher baseline sNfL was associated with increased brain atrophy over 5 and 10 years. 25 Although the current study focused on the predictive value of sNfL over a shorter time period, these results indicate that baseline sNfL can predict relapse at the group level and is an indicator for the risk of relapse.
An additional key finding of the predictor analysis was that the baseline Gd+ lesions and sNfL ≥16 pg/mL were synergistic predictive factors of relapse as a combination of baseline Gd+ lesions and sNfL ≥16 pg/mL was a stronger predictor of relapse within 90 days than either factor alone. Similarly, a previous study reported that the combination of NfL concentration and short-term brain atrophy was a better predictor of long-term EDSS progression than was NfL concentration alone. 23 Additional studies are needed to determine how sNfL can be used in conjunction with other biomarkers to improve the prediction of disease outcomes over the long term.
These results should be interpreted with caution because this was an unplanned, post hoc analysis. However, the reduction in sNfL levels in all treatment arms mirrors the reduction in lesion activity and ARR observed in the CombiRx trial, 31 and the ability of baseline sNfL level to predict treatment outcomes is consistent with previous findings.16,23,24 Although the CombiRx extension study reported clinical and MRI outcomes up to 7 years, 32 sNfL samples were collected only up to 48 months, and this analysis reports sNfL results over only the first 36 months because of limited sample availability at the later timepoint. Lack of a placebo control limits the interpretation of this analysis to only those RRMS patients treated with an active DMT; adjusting for additional covariates (e.g. comorbidities) and establishing normative reference ranges will also be required to better understand how the results may apply to individual patients in clinical practice. Additional studies are thus needed to evaluate the value and utility of sNfL in assessing MS disease severity and monitoring longer-term treatment outcomes in a real-world setting.
This post hoc analysis of the CombiRx trial supports sNfL as a prognostic biomarker by suggesting that baseline sNfL levels most strongly predict relapses within 90 days and may predict relapses up to 1 year. At baseline, the presence of Gd+ lesions and sNfL ≥16 pg/mL was a stronger predictor of relapse within 90 days than either factor alone, which further supports the consideration of sNfL as a potential prognostic biomarker to be used alongside other MRI and clinical assessments to facilitate DMT selection based on baseline disease activity, severity, or both.
Supplemental Material
sj-pdf-1-mso-10.1177_20552173231169463 - Supplemental material for Serum neurofilament light-chain levels and long-term treatment outcomes in relapsing-remitting multiple sclerosis patients: A post hoc analysis of the randomized CombiRx trial
Supplemental material, sj-pdf-1-mso-10.1177_20552173231169463 for Serum neurofilament light-chain levels and long-term treatment outcomes in relapsing-remitting multiple sclerosis patients: A post hoc analysis of the randomized CombiRx trial by Gary Cutter, Richard A Rudick, Carl de Moor, Carol M Singh, Elizabeth Fisher, Thijs Koster, Fred D Lublin, Jerry S Wolinsky, Henry McFarland, Steven Jacobson and Maria L Naylor in Multiple Sclerosis Journal – Experimental, Translational and Clinical
Footnotes
Acknowledgements
Alexandra D’Agostino, PhD, of Ashfield MedComms, an Inizio company, wrote the first draft and revised subsequent drafts of the manuscript based on input from the authors, and Celia Nelson of Ashfield MedComms copyedited and styled the manuscript per journal requirements. Biogen reviewed and provided feedback on the manuscript to the authors. All authors were involved in critically reviewing the manuscript for intellectual content and provided final approval of the submitted version.
Data sharing
Declaration of conflicting interests
The author(s) declared the following potential conflicts of interest with respect to the research, authorship, and/or publication of this article: GC has served on data and safety monitoring boards for AstraZeneca, AveXis, BioLineRx, BrainStorm Cell Therapeutics, Bristol Myers Squibb/Celgene, CSL Behring, Galmed, HISUN USA, Horizon Pharmaceuticals, Mapi Pharma, Merck, Merck/Pfizer, Neurim, Novartis, OncoImmune, OPKO Biologics, Orphazyme, Reata, Sanofi, Teva, Viela Bio, VIVUS, the National Heart, Lung, and Blood Institute (Protocol Review Committee), and the National Institute of Child Health and Human Development (Obstetric Pharmacology Research Unit oversight committee) and has received compensation for consulting or advisory board service from BioDelivery Sciences International, Biogen, Click Therapeutics, Genentech, Genzyme, GW Pharmaceuticals, Klein-Buendel, MedDay, MedImmune, NeuroGenesis, Novartis, Osmotica, Perception Neurosciences, Recursion/CereXis, Roche, and TG Therapeutics. Dr Cutter is employed by the University of Alabama at Birmingham and is president of Pythagoras, Inc., a private consulting company located in Birmingham, AL, USA. RAR and MLN were employees of Biogen at the time of these analyses and may hold stock and/or stock options in Biogen. CdM, CMS, EF, and TK are employees of and hold stock and/or stock options in Biogen. FDL has received compensation for consulting and advisory board work from Acorda, Actelion/Janssen, Apitope, Atara Biotherapeutics, Avotres, Banner Life Sciences, Biogen, Brainstorm Cell Therapeutics, EMD Serono, Entelexo Biotherapeutics, GW Pharma, Immunic, Jazz Pharmaceuticals, Labcorp, Mapi Pharma, Medday, MedImmune/Viela Bio/Horizon Therapeutics, Mylan, Neuralight, Neurogene, Novartis, Orion Biotechnology, Population Council, Receptos/Celgene/BMS, Roche/Genentech, Sanofi Genzyme, Teva, and TG Therapeutics; has received research funding from Actelion, Biogen, Brainstorm Cell Therapeutics, Novartis, Sanofi, the National Institutes of Health, and the National Multiple Sclerosis Society; has received speaker honoraria from Sanofi; and holds stock options in Avotres and Neuralight. JSW has served on advisory boards and data monitoring or steering committees for, has consulting agreements with, or has received speaker honoraria from Avotres, BrainStorm Cell Therapeutics, Cleveland Clinic Foundation, EMD Serono, MedDay, NervGen, Novartis, Roche/Genentech, Sanofi Genzyme, and the University of Alabama at Birmingham, and has received royalties for out-licensed monoclonal antibodies through UTHealth from MilliporeSigma. HM and SJ have not declared any conflicts of interest.
Funding
The author(s) disclosed receipt of the following financial support for the research, authorship, and/or publication of this article: CombiRx (NCT00211887) was funded by the NIH, National Institute of Neurologic Disorders and Stroke (phase III study: U01NS045719). This post hoc analysis was sponsored by Biogen. Biogen provided funding for medical writing support in the development of this manuscript.
Supplemental material
Supplemental material for this article is available online.
References
Supplementary Material
Please find the following supplemental material available below.
For Open Access articles published under a Creative Commons License, all supplemental material carries the same license as the article it is associated with.
For non-Open Access articles published, all supplemental material carries a non-exclusive license, and permission requests for re-use of supplemental material or any part of supplemental material shall be sent directly to the copyright owner as specified in the copyright notice associated with the article.