
Abstract
Background
Technological advancements of remote-monitoring used in clinical-care and research require validation of model updates.
Objectives
To compare the output of a newer consumer-grade accelerometer to a previous model in people with multiple sclerosis (MS) and to the ActiGraph, a waist-worn device widely used in MS research.
Methods
Thirty-one individuals with MS participated in a 7-day validation by the Fitbit Flex (Flex), Fitbit Flex-2 (Flex2) and ActiGraph GT3X. Primary outcome was step count. Valid epochs of 5-min block increments, where there was overlap of ≥1 step/min for both devices were compared and summed to give a daily total for analysis.
Results
Bland–Altman plots showed no systematic difference between the Flex and Flex2; mean step-count difference of 25 more steps-per-day more recorded by Flex2 (95% confidence intervals (CI) = 2, 48; p = 0.04),interclass correlation coefficient (ICC) = 1.00. Compared to the ActiGraph, Flex2 (and Flex) tended to record more steps (808 steps-per-day more than the ActiGraph (95% CI= –2380, 765; p < 0.01), although the ICC was high (0.98) indicating that the devices were likely measuring the same kind of activity.
Conclusions
Steps from Flex and Flex2 can be used interchangeably. Differences in total step count between ActiGraph and Flex devices can make cross-device comparisons of numerical step-counts challenging particularly for faster walkers.
Keywords
Introduction
Ambulatory disability is a frequent and often devastating consequence of multiple sclerosis (MS).1,2 People with MS are more sedentary than the general population3–7 which can amplify already disabling symptoms and increase the risk of sedentarism-related morbidity.8,9 Remote activity monitoring can be useful for documenting activity status for clinical care by recording the amount of activity a person actually performs in daily life rather than what a person is capable of doing in a clinic evaluation.10,11
ActiGraph accelerometers are widely used in MS research, accounting for 75% of 61 articles reporting on ≥24 hours and <1 month of continuous physical activity monitoring in MS.12,13 The waist-worn ActiGraph may be impractical for longer-term continuous use (i.e. year-long) due to inconvenience, expense and technical barriers. Ankle-worn devices such as the StepWatch have similar limitations. Unobtrusive, commercially available, wrist-worn devices could be an alternative for continuous, longer-term monitoring of physical activity. In healthy adults, many such wearable devices have been validated against manual or video recording during treadmill training, and at home (over c. 7 days) as accurate measures of step count.14–18
Manufacturers often do not share the hardware or algorithm updates of the frequently changing wearable devices with the consumer (or researcher), nor is validation data readily available. Hence, in longitudinal studies where device loss and replacement are inevitable, it is important to ensure that newer generation devices have output metrics comparable to the original device used at study initiation.
For example, the Fitbit Flex 2 (Flex2) replaced the Fitbit Flex (Flex), a widely used wrist-worn accelerometer. The Flex2 is waterproof (reducing risk of not being re-donned post-ablution and thereby could increase adherence) and records swimming – an important option for exercise in some individuals with MS due to pervasive heat sensitivity.19–21 In this study, we sought to (a) compare the output from the Flex and ActiGraph GT3X against manual step-counting 22 over 2 min in the clinic, and (b) compare the outputs from the Flex2 to that of the Flex, and ActiGraph at home over 7 days. The ActiGraph was selected as a reference because of its widespread use in MS studies.
Material and methods
Participants
Individuals enrolled in the FITriMS cohort study (Fitbit remote monitoring in MS)22,23 were assessed at study entry (including a 2-min walk test (2MWT)). Participants were invited to participate in a 7-day home validation of Flex against an ActiGraph GT3X (Group 1) once they had completed >3 months, 24 and the Flex2 after >10 months in FITriMS (Group 2). Individuals with relapsing–remitting or progressive forms of MS from the UCSF MS Center clinic were prospectively recruited between July 2015 and April 2016. Inclusion criteria were: (a) a definite diagnosis of MS, defined by 2010 International Panel criteria; 25 (b) ≥18 years of age; (c) ability to walk for at least 2 min with or without an assistive device; (d) relapse free for ≥30 days prior to study entry; (e) Wi-Fi Internet access and the ability to follow instructions for technology maintenance. Participants were excluded if they had major musculoskeletal (e.g. recent broken leg), cardiovascular or respiratory comorbidities (e.g. congestive heart failure) that could interfere with physical activity and potentially bias or obscure results. The definition of the 2014 Advisory Committee on Clinical Trials in MS Committee was employed for the characterization of relapsing and progressive MS phenotypes. 26 The UCSF IRB approved the study protocol. All participants provided written informed consent.
Study procedures
Neurologists evaluated disability using the Expanded Disability Status Scale, EDSS. 27
Step count measurement techniques included:
Manual step counting: research personnel recorded actual steps the participant took over a 2MWT. ActiGraph GT3X (Manufacturing Technology, Inc., FL, USA): this contains a triaxial accelerometer, is worn on an elastic band around the waist and is validated as a measure of walking behaviour in individuals with MS.28,29 For this study the accelerometer signals were set at 30 Hz and 10-second epochs. The data were retrieved from the ActiGraph via a direct USB 2.0 connection and downloaded using ActiLife v6.13.2 software. A low frequency extension filter was applied, as per the manufacturer’s guideline.
30
Fitbit Flex (Flex) (Fitbit, CA, USA): Flex contains a tri-axial accelerometer within a discreet bracelet worn around the wrist.
19
The Flex records step count as the main outcome and was previously validated in MS.
22
Commercial production of the Fitbit Flex was discontinued, and this model is being replaced with the Fitbit Flex 2. Fitbit Flex 2 (Flex2) (Fitbit, CA, USA): Flex2 contains a tri-axial accelerometer within a discreet bracelet around the wrist. The main outcome metric is steps per epoch (i.e. minute or day). The device can be worn at all times (waterproof up to 100 m).
Both the Flex and Flex2 synchronize with either smartphone applications (via Bluetooth) or a computer application (via USB dongle). The research team purchased the devices without financial support from device manufacturers.
At study entry, step count was compared between manual, Flex and ActiGraph over a 2MWT. For the 7-day home comparison in the two groups, eligible participants were mailed a package containing: (a) a fully charged and activated ActiGraph accelerometer (set to record for 7 ± 3 days); (b) a Flex2 (only Group 2) device pre-set up with an anonymous Gmail account different from their original Flex account to ensure data quality; (c) written instructions; and (d) a pre-paid envelope to return the ActiGraph and Flex2 at the end of the monitoring period. An electronic message was sent with detailed instructions and a reminder to continue wearing their Flex simultaneously. Participants were instructed not to change their normal daily activities and to wear the Flex2 on the same wrist as the Flex (non-dominant). The ActiGraph was worn on an elastic belt around the waist over their non-dominant hip.
The Health eHeart Study clinical research platform (https://www.health-eheartstudy.org/) was used for electronic consent and remote Fitbit data collection. Participants gave authorization to link their Fitbit accounts for the study to recover data for research purposes. The Health eHeart database collected and stored the data through an application-programming interface.
Statistical analysis
Wear-time validation for the ActiGraph was generated using 60-second epochs. 31 The Troiano (2007) wear-time validation parameters were used.32,33 At least 10 hours of valid wear time per day and 3 days of valid data were required for comparative assessment. 34 Interclass correlation coefficients (ICCs) with 95% confidence intervals (CIs) were calculated.
Absolute step count was compared between devices over the 2MWT. To calculate steps per day, at home, valid measurements were defined as continuous 5 minute increments, or ‘blocks’, when there was overlap of at least 1 step/min for the two devices being compared. These blocks were then summed to give daily totals (Supplemental Figure S1). For this analysis, we compared blocks rather than total daily averages, since there were times where one device was used for higher intensity physical activity (running, swimming) while the other was not worn, even on days that were deemed valid. With this analytical method, the intervals compared included only times when both devices were being worn simultaneously.
We compared step counts among the measurement devices using the Bland–Altman approach 35 and paired t-test to determine the mean difference. The modified limits of agreement method was applied on the repeated measurements to compare the repeatability of the two raters. 35 Modified Bland–Altman (with correction) was used when there was a linear relationship between the mean difference of the step counts recorded by the devices and the average of the step counts from the devices being compared.36,37 Paired two-sample t-tests assuming equal variance were used to determine if potential covariates (sex or disease subtype) were factors in the difference between step count measures. The ‘leave-one-out’ method 38 was used to assess for differential bias across the disability spectrum. The model was then trained on each EDSS group subset to determine the relationship between the step-count difference and the average step count on the two devices. A linear regression model was performed to examine the effect of the EDSS groups on the rate of step count difference change over the average of step count (slope).
R software calculated statistics and generated figures; 39 p-value < 0.05 was considered significant.
Results
Sixty-one participants were included in comparisons between Flex and ActiGraph to manual step counting (the gold standard for this study) during the 2MWT (Table 1).22,24 Bland–Altman plots showed no systematic bias between devices. Compared to manual counts, the ActiGraph tended towards under-record steps whereas the Fitbit over counted compared to ActiGraph for lower daily steps (Supplemental Figure S2). There was no systematic bias between Fitbit and manual counts. Over 2MWT, ICCs were moderate–high between ActiGraph and Flex (0.59, 95% CI = 0.40–0.73. Mean difference = –6.03), Flex and manual (0.69, 95% CI = 0.53–0.80. Mean difference = 9.75) and ActiGraph and manual (0.76, 95% CI = 0.63–0.85. Mean difference = 15.79). Covariates (sex, disease subtype and age group) did not affect the results.
Group 1: demographic data for step count comparison over a clinic-based 2-Minute Walk Test (2MWT) (Manual, Fitbit Flex and ActiGraph), and 7-day home-environment step count comparisons (Fitbit Flex and ActiGraph). (Adapted from Block 2016. 24 )
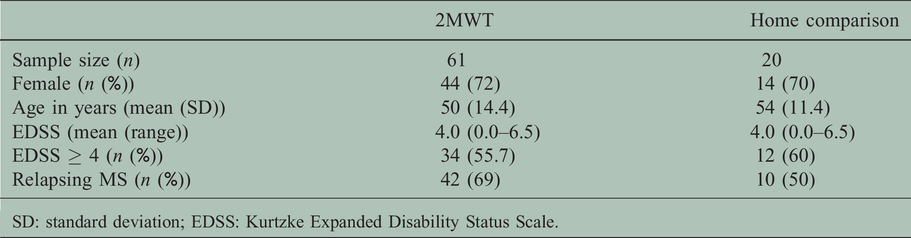
SD: standard deviation; EDSS: Kurtzke Expanded Disability Status Scale.
Thirty-six individuals participated in the home comparison of the Flex2 and ActiGraph over 7 days. Five participants returned the ActiGraph with data for different days than was recorded for the Flex2 and were excluded. No participants were excluded due to cardiovascular or musculoskeletal comorbidities. Median EDSS at study entry was 4.0 (Interquartile range, IQR 2.5–6.0); 17 (58%) were women; and 16 (52%) had a diagnosis of relapsing MS (Table 2). Sample size for each comparison, after quality control and performing the ‘block’ analysis for the daily step count totals were: 22 for the ActiGraph/Flex2, 18 for Flex/Flex2 and 20 for the ActiGraph and Flex. Including unique (different) individuals from Group 1 increased the sample to 33. Subjects reported that missing data for Flex and Flex2 occurred due to difficulties remembering to sync both devices on separate accounts. Missing ActiGraph data was due to forgetting or not wanting to don the device.
Group 2: demographic data for 7-day home-environment step count comparisons (Flex, Flex2 and ActiGraph).
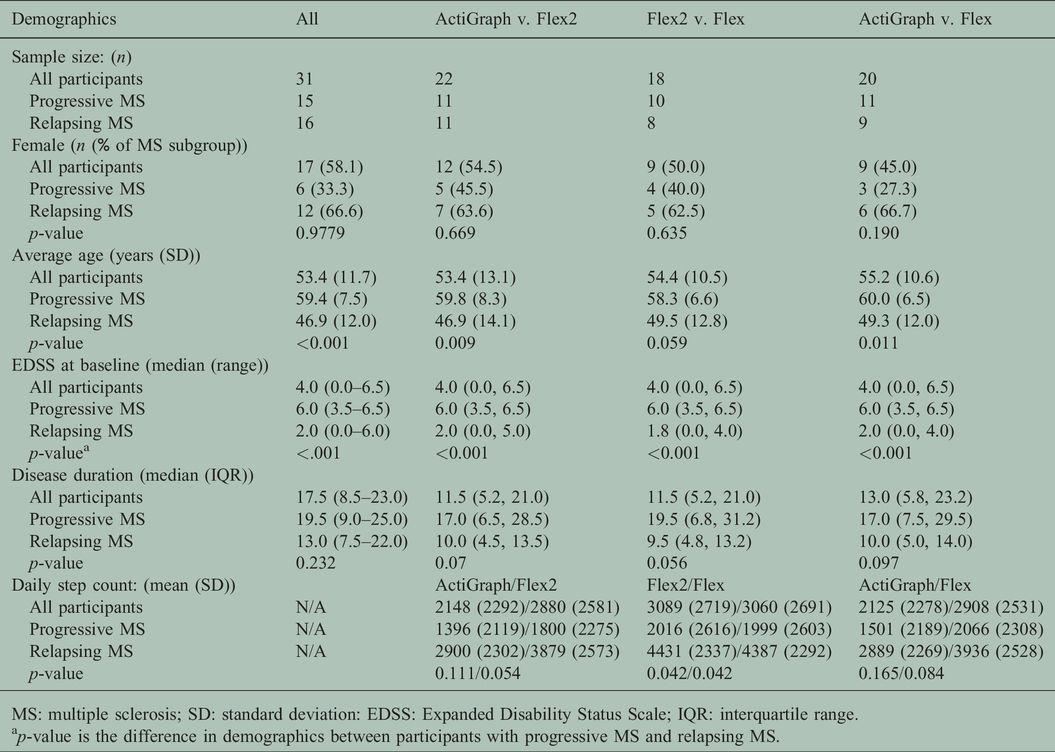
MS: multiple sclerosis; SD: standard deviation: EDSS: Expanded Disability Status Scale; IQR: interquartile range.
ap-value is the difference in demographics between participants with progressive MS and relapsing MS.
Flex2 averaged 808 more steps-per-day than the ActiGraph (Bland–Altman: 95% CI = 670, 946; p < 0.01). However, when we used modified (corrected) Bland–Altman there was a high percentage of data points (96%) within the 95% limits of agreement, indicating a better fit (Figure 1a, Supplementary Table 1B). A similar trend was seen between Flex and ActiGraph (mean difference: 873 per day. 95% CI = 724, 1023; p < 0.01) (Figure 1b). The percentage of data points within the 95% limits of agreement increased from 93 to 96% using the modified Bland–Altman, also denoting a better fit with this method (Figure 1b). No systematic difference was seen in the modified Bland–Altman plots for the Flex v. Flex2 (mean difference: 25 steps/d more recorded by the Flex2 (95% CI = 2, 48; p = 0.04)) (Figure 2). The percentage of data points within the 95% limits of agreement decreased (95 to 92%) when using the modified Bland–Altman, revealing that this correction did not produce a better fit.

ActiGraph and Flex2 (modified Bland–Altman plot).

ActiGraph and Flex (modified Bland–Altman plot). The solid lines represent the mean differences between the measures and the dashed horizontal lines represent mean differences ±2 standard deviations. Each solid point corresponds to a separate individual, for a separate day. The solid lighter grey lines indicated where ‘0’ difference between the measures would lie. The grey dashed lines are the 95% limits of agreement. The histograms on the top and right depict the distribution of the data.

Flex2 and Flex (Bland–Altman Plot). The solid line represents the mean difference between the measures and the dashed horizontal lines represent mean difference ±2 standard deviations. Each solid point corresponds to a separate individual, for a separate day. The solid lighter grey line indicated where ‘0’ difference between the measures would lie. The grey dashed lines are the 95% limits of agreement. The histogram on the top and right depicts the distribution of the data.
ICCs were high for all comparisons: ActiGraph v. Flex2 (0.98 (95% CI = 0.97–0.99)), ActiGraph v. Flex (0.98 (95% CI = 0.97–0.98)) and Flex v. Flex 2 (1.0 (95%CI= 1.0–1.0)) (Table 3). A larger discrepancy was observed between devices with greater daily steps (Figures 1 and 2) and lower walking disability. The difference between ActiGraph and Flex2/Flex, was greater for individuals who took more steps/d (mean difference –387 (95% CI = –491, –282) below the cohort median v. –1229 (95% CI = –1439, –1019) above it) (Supplementary Table 2). Discrepancy was negligible between Flex and Flex2 (–10 steps difference (95% CI = –23, 4) below the cohort median, and 59 step difference (95% CI = 16, –102) above).
Interclass correlation coefficients (ICCs) and average differences in steps recorded between measurement techniques during seven days of home activity monitoring (group 2).

aA negative value signifies that the first step counting technique (in the header) measured fewer steps; conversely, a positive sign denotes that the first technique measures more steps than the comparator.
Between the Flex and ActiGraph, the effect of disability (increased EDSS score) on the rate of step-count difference change over the slope was not significant, although trended towards decreasing (n = 33, β = –0.019, p = 0.229) (Supplementary Figure S3).
The discordance in steps recorded was greater for all comparisons in individuals with relapsing MS (Table 4). The Flex and Flex2 showed the lowest discordance in step count for both disease subtypes (mean difference progressive: 3, p = 0.72 (95% CI = –14, 19) and relapsing: 49, p = 0.034 (95% CI = 4, 94)). Between genders, significant difference in step count was observed between Flex2 and Flex for men (mean difference: 56 steps/day, 95% CI = 29, 82; p < 0.01) but not women (mean difference: 3 steps/day, 95% CI = –31, 38; p = 0.848). ActiGraph measured fewer steps than Flex2 in both women (mean difference: –830 steps/day, 95% CI = –1022, –638; p < 0.01) and men (mean difference: –783 steps/d, 95% CI = –988, –578; p < 0.01). Modified Bland–Altman plots presented a superior fit, improving the percentage of people within the 95% limits of agreement in women from 93 to 99%. Similar results were found for ActiGraph and Flex comparisons.
Table of Bland–Altman results for all participants and separated into multiple sclerosis subtype (relapsing and progressive) in Group 2.

ap-value from paired t-test.
bModified Bland–Altman was used when there was any relationship between the mean and standard deviation of the differences and the magnitude of the measurements.
Discrepancy between Flex and Flex2 was greater in individuals with lower disability (EDSS < 4.0, mean difference: 49 steps/day, 95% CI = 4, 94; p = 0.034) than those with greater disability (EDSS ≥4.0, mean difference: 3 steps/d, 95% CI = –14 steps/day 19; p = 0.721). Greater discrepancy was seen between ActiGraph and Flex2 for individuals with lower disability (EDSS < 4.0: mean difference: –1086 steps/d, 95% CI –1303, –868; p < 0.01) than higher disability scores (EDSS ≥4.0: mean difference: –503 steps/day, 95% CI = –638, –368; p < 0.001). The ActiGraph and Flex comparisons yielded similar results.
Discussion
Consistent with previous literature,13,16,40 the ActiGraph tended to under-record steps when fewer steps were taken (slower walking), in the clinic test and also during the home validation (7 d). Greater differences between ActiGraph and Flex (and Flex2) were observed in individuals taking greater steps/day, with lower disability, who were men, and were diagnosed with Relapsing MS. The difference was not related to disability status, although a larger sample may show a small negative differential bias with increasing EDSS scores, independent of daily steps. In light of these results, researchers should be cautious when choosing what device to use for measuring step count in people with faster walking speeds.
Our previously reported results on Group 1 (n = 20) illustrated that Flex recorded 1132 steps/d more than ActiGraph (95% CI = 500–1763). 24 However, the mean difference was small (c. 70 steps) for days with low steps (<3000 steps) and increased (c. 2400 steps difference) as daily steps increased (>3000 steps/day). 24 The current analysis confirms these results.
This study describes a general method for corroborating measurements of daily step counts captured by remote activity monitoring. The correlation between the Flex and Flex2 step counts demonstrates that step-count data captured by these devices is essentially identical (ICC = 1.0, p < 0.01) and can be used interchangeably for remote step count monitoring in individuals with MS. It is likely that other devices using the identical tri-axial accelerometer will yield similar results. However, because manufacturers do not provide hardware or algorithm updates to consumers, it is necessary to establish methods to compare newer to older models thereby ensuring data quality and integrity.
Because prior research indicated greater percentage use of the wrist-worn accelerometers compared to a waist-worn ActiGraph,22,24 we opted for a ‘blocked’ times approach to compare the devices and remove potential bias from individuals wearing one device more. Other studies have used a summative approach, 13 however here we selected the blocked approach to favour actual wear-time when all devices were being used concurrently.
The difference between the Flex and Flex2 was negligible (the Flex2 recorded an average increase of 25 steps/d than the Flex). However, both Flex and Flex2 wrist-worn devices recorded a significantly greater number of steps than the waist-worn ActiGraph GT3X (on average an increase of 873 and 808 steps/d, respectively). Notably, 96% of individuals measured steps were within the 95% CIs. This observation indicates that wrist-worn and waist-worn devices are measuring the same activity but are judging what constitutes a valid step differently, with the ActiGraph being more conservative. A study comparing the ActiGraph (GT3X+) and the StepWatch observed high accuracy for both devices at fast and comfortable walking speeds over a modified 6-Minute Walk Test, but showed discrepancies (ActiGraph under-recording compared to the StepWatch) at slower speeds and greater ambulatory disability. 13
The question remains: is Fitbit over-counting or is ActiGraph under-recording? For in-clinic assessments, what constitutes a step is relatively obvious and the participant is fully aware that they are being observed. Walking at home is less predictable in ways that may affect how steps are counted. It is possible that the ActiGraph may not have recorded some activity as full steps whereas the Flex and Flex2 did. The Flex and Flex2, on the other hand, may record other body movements as steps, because these devices are worn around the wrist. Thus the term ‘step count’ is potentially misleading. It is possible that wrist-worn devices compute higher daily steps compared to the waist-worn ActiGraph because they count movements that may not constitute full-length strides as steps. If so, then it is possible that wrist-worn devices may be more sensitive, and possibly more accurate for overall daily physical activity and function. Weikert et al., proposed that ActiGraph measures ‘walking mobility’ rather than physical activity when worn around the waist in individuals with MS. 41
These data illustrate the importance of disease and clinical context specific validation of activity monitoring devices for research and clinical care. There is a growing trend of using wearables for health and remote objective monitoring to obtain large amounts of data from people in their daily life. Data from people outside of the clinic-setting give a more holistic view of their function, and may provide clinical trials with more sensitive measures of real-world disability worsening potentially over shorter study durations than traditional performance-based or patient-reported measures. Further study is ongoing to address what other information can be obtained from these wearable devices (i.e. min/min or active v. sedentary bouts) and that may be useful to evaluate activity in the home environment. For example, changes outside of a pre-determined limit could serve as an early warning sign perhaps prompting the healthcare team to action. To address the discrepancy between the Flex devices and the ActiGraph in greater steps/d and lower disability, studies using other, perhaps more sensitive activity monitors (i.e. StepWatch) are needed.
Study limitations
Although disability score was not found to have a sytematic effect on differential bias, given the sample size larger studies should confirm these results in a similarly wide range of disability. This would increase generalizability across the spectrum. Secondly, there may have been some ‘reactivity’ due to the short validation time (7 d), although we did not observe any reactivity in our larger cohort study when wrist-worn devices were introduced. 22 Thirdly, the waist-worn ActiGraph appears to be less sensitive to measurement of steps in more disabled persons and perhaps ankle-worn devices (such as StepWatch, which was not used in this study) could provide another perspective on what wrist-worn devices are actually measuring. For the goal of this analysis, the block-time approach was specifically selected in order to compare measurement of all devices when they were actually being worn simultaneously. However, the block-time approach does not account for differences in total daily device usage and therefore would not capture differences in wearability over the course of a valid day that could bias results depending on the research question. As a consequence, comparison of steps using the block time method to the daily average method may not be easily interpretable.
Conclusions
This manuscript presents a cross-validation methodology for remote activity monitoring devices. The Flex and Flex2 models of consumer-grade accelerometer, Fitbit, can be used interchangeably, however, caution should be exercised when using these devices with people who walk many steps per day or have lower levels of disability. Wearable devices, marketed for consumers rather than research, can be useful for longer-term studies as adherence is likely to be higher, albeit at the potential cost of ‘exact step count’ and detailed gait analysis.
Supplemental Material
MSO888660 Supplemetal Material1 - Supplemental material for Validation of a consumer-grade activity monitor for continuous daily activity monitoring in individuals with multiple sclerosis
Supplemental material, MSO888660 Supplemetal Material1 for Validation of a consumer-grade activity monitor for continuous daily activity monitoring in individuals with multiple sclerosis by Valerie J Block, Chao Zhao, Jill A Hollenbach, Jeffrey E Olgin, Gregory M Marcus, Mark J Pletcher Roland Henry Jeffrey M Gelfand and Bruce AC Cree in Multiple Sclerosis Journal – Experimental, Translational and Clinical
Supplemental Material
MSO888660 Supplemetal Material2 - Supplemental material for Validation of a consumer-grade activity monitor for continuous daily activity monitoring in individuals with multiple sclerosis
Supplemental material, MSO888660 Supplemetal Material1 for Validation of a consumer-grade activity monitor for continuous daily activity monitoring in individuals with multiple sclerosis by Valerie J Block, Chao Zhao, Jill A Hollenbach, Jeffrey E Olgin, Gregory M Marcus, Mark J Pletcher Roland Henry Jeffrey M Gelfand and Bruce AC Cree in Multiple Sclerosis Journal – Experimental, Translational and Clinical
Supplemental Material
MSO888660 Supplemetal Material3 - Supplemental material for Validation of a consumer-grade activity monitor for continuous daily activity monitoring in individuals with multiple sclerosis
Supplemental material, MSO888660 Supplemetal Material1 for Validation of a consumer-grade activity monitor for continuous daily activity monitoring in individuals with multiple sclerosis by Valerie J Block, Chao Zhao, Jill A Hollenbach, Jeffrey E Olgin, Gregory M Marcus, Mark J Pletcher Roland Henry Jeffrey M Gelfand and Bruce AC Cree in Multiple Sclerosis Journal – Experimental, Translational and Clinical
Supplemental Material
MSO888660 Supplemetal Material4 - Supplemental material for Validation of a consumer-grade activity monitor for continuous daily activity monitoring in individuals with multiple sclerosis
Supplemental material, MSO888660 Supplemetal Material1 for Validation of a consumer-grade activity monitor for continuous daily activity monitoring in individuals with multiple sclerosis by Valerie J Block, Chao Zhao, Jill A Hollenbach, Jeffrey E Olgin, Gregory M Marcus, Mark J Pletcher Roland Henry Jeffrey M Gelfand and Bruce AC Cree in Multiple Sclerosis Journal – Experimental, Translational and Clinical
Supplemental Material
MSO888660 Supplemetal Material5 - Supplemental material for Validation of a consumer-grade activity monitor for continuous daily activity monitoring in individuals with multiple sclerosis
Supplemental material, MSO888660 Supplemetal Material1 for Validation of a consumer-grade activity monitor for continuous daily activity monitoring in individuals with multiple sclerosis by Valerie J Block, Chao Zhao, Jill A Hollenbach, Jeffrey E Olgin, Gregory M Marcus, Mark J Pletcher Roland Henry Jeffrey M Gelfand and Bruce AC Cree in Multiple Sclerosis Journal – Experimental, Translational and Clinical
Footnotes
Acknowledgements
We thank Mr Antoine Lizeé for analysis and graphical representation of the data in some of the supplementary figures and tables.
Conflict of interests
Valerie J. Block, Chao Zhao, Jill Hollenbach, Jeffrey Olgin, Gregory Marcus and Mark J. Pletcher have nothing to declare.
Roland G. Henry has received personal compensation for consulting from Novartis, Roche/Genentech and Sanofi, and has received research support from MedDay Pharmaceuticals, Roche/Genentech and Sanofi.
Jeffrey M. Gelfand: research support (to University of California, San Francisco) from Genentech, service contract support from MedDay, and prior research support from Quest Diagnostics; consulting fees from Biogen and Alexion; and personal compensation for medical-legal consulting. His spouse has received consulting fees from Zosano Pharma Corp, Eli Lilly and Company, and Biohaven Pharmaceutical; honoraria from UpToDate (for authorship) and JAMA Neurology (as an associate editor); consulting payments for work done through the University of California, San Francisco, Pediatric Headache programme from eNeura, Inc; and personal compensation for medical-legal consulting
Bruce A. C. Cree has received personal compensation for consulting from Akili, Alexion, Biogen, EMD Serono, Novartis and TG Therapeutics.
Funding
The author(s) disclosed receipt of the following financial support for the research, authorship, and/or publication of this article: Funded in part by National Center for Advancing Translational Sciences of NIH (KL2TR000143) (JMG).
Supplemental Material
Supplemental material for this article is available online.
References
Supplementary Material
Please find the following supplemental material available below.
For Open Access articles published under a Creative Commons License, all supplemental material carries the same license as the article it is associated with.
For non-Open Access articles published, all supplemental material carries a non-exclusive license, and permission requests for re-use of supplemental material or any part of supplemental material shall be sent directly to the copyright owner as specified in the copyright notice associated with the article.