
Abstract
Background
Physical function and walking performance have become important outcomes in clinical trials and rehabilitation involving persons with multiple sclerosis (MS). However, assessments conducted in controlled settings may not reflect real-world capacity and movement in a natural environment. Peak cadence via accelerometry might represent a novel measure of walking intensity and prolonged natural effort under free-living conditions.
Objective
We compared peak 30-minute cadence, peak 1-minute cadence, and time spent in incremental cadence bands between persons with MS and healthy controls, and examined the associations between peak cadence and laboratory-assessed physical function and walking performance.
Methods
Participants (147 MS and 54 healthy controls) completed questionnaires on disability status and self-reported physical activity, underwent the Short Physical Performance Battery, Timed 25-Foot Walk, Timed Up and Go, and 6-Minute Walk, and wore an accelerometer for 7 days. We performed independent samples t-tests and Spearman bivariate and partial correlations adjusting for daily steps.
Results
The MS sample demonstrated lower physical function and walking performance scores, daily steps, and peak cadence (P < .001), and spent less time in purposeful steps and slow-to-brisk walking (40-119 steps/minutes), but accumulated more incidental movement (1-19 steps/minutes) than healthy controls. The associations between peak cadence and performance outcomes were strong in MS (|rs| = 0.59-0.68) and remained significant after controlling for daily steps (|prs| = 0.22-0.44), P-values < .01. Peak cadence was inversely correlated with age and disability, regardless of daily steps (P < .01).
Conclusions
Our findings provide preliminary evidence for the potential use of peak cadence with step-based metrics for comprehensively evaluating free-living walking performance in MS.
Introduction
Multiple sclerosis (MS) is a chronic neurodegenerative disease that results in impaired walking and physical dysfunction over time. Approximately 75% of people with MS have deficits in lower extremity function and walking difficulties that impact daily activities, independence, and quality of life.1,2 To that end, physical function and walking performance have become important outcomes in clinical trials of disease-modifying agents and rehabilitation. These outcomes are typically assessed using performance-based tests administered in well-defined, controlled laboratory or clinical settings, yet such assessments may not reflect real-world capacity and movements in a natural environment with more motor-cognitive challenges.3,4 Instead, device-based measures of free-living physical behaviors may capture everyday performance and provide important and complementary information compared with laboratory-based, physical performance tests alone. 5
Accelerometry has been widely applied in MS and other populations as a measure of free-living physical activity (PA). 6 PA volume is often reported as activity or step counts per day in MS research, while intensity is traditionally quantified as time spent above activity count ranges (ie, cut-points) corresponding with a priori defined metabolic equivalents (METs) categories (eg, moderate-to-vigorous intensity PA [MVPA] defined as ≥3 METs).6,7 However, accumulation of time or counts over these METs categories does not reflect a specific intensity value, and it fails to fully describe the overall pattern of PA including lower-intensity minutes. This is especially essential for those who spend less time above the MVPA cut-points due to functional declines (eg, MS and aging),8,9 and relying solely on time spent below 3 METs may be reductionist to fully depict light-intensity PA for these individuals. One recent scoping review highlighted the potential of accelerometry for measuring outcomes beyond PA in MS, such as mobility dysfunction. 6 There is a need for clear, applicable metrics for comprehensively evaluating free-living walking performance of people with MS for research and clinical practice.
Peak cadence of ambulatory activity (ie, walking) can be derived from minute-by-minute accelerometer data by calculating the highest cadence values (steps/minutes) within certain time periods,10,11 and these metrics have been included as indicators of natural effort among large, nationally representative samples (eg, U.S. National Health and Nutrition Examination Survey).11-13 Peak 30-minute cadence (Peak-30CAD; the average cadence of the 30 highest non-consecutive minutes in a day) represents an individual’s “best natural effort” 11 shaped by intensity 10 and persistence of daily ambulatory behavior as well as its consistency across the monitoring period. 14 Peak 1-minute cadence (Peak-1CAD; the highest cadence recorded for a single minute in a day) may directly exhibit one’s physical capacity and willingness for high-intensity ambulation.11,15 Conceptually, Peak-30CAD and Peak-1CAD might be compatible with, or at least complementary to, laboratory-based measures of walking performance (eg, the 6-Minute Walk and Timed 25-Foot Walk Tests). To that end, the use of peak cadence combined with other step-based metrics (daily steps; time spent in incremental cadence bands) might not only enable evaluation of PA patterns across a full range of intensity levels,16,17 but potentially offer a feasible approach for determining ambulatory performance during daily living. These step-based metrics are easily tractable from wearable sensors in controlled or uncontrolled environments and have wide appeal for researchers, clinicians, and the public. This potential for widespread use may bridge scientific research and practical applications and eventually help better understand the effects of interventions/treatments on real-world outcomes. 18
To date, peak cadence has primarily been investigated in the general population, 10 such as its descriptive epidemiology across demographic characteristics11,19 and associations with health outcomes and disease risk.12,13,17 Walking cadence has been applied for classifying PA intensity in MS and there is initial validity for this application among individuals of varying disability levels. 20 There are no published data on peak cadence in persons with MS and, more specifically, whether these free-living indices correlate with laboratory-assessed physical and walking performance. The current study compared free-living step-based metrics (daily steps, Peak-30CAD, Peak-1CAD, and time spent in cadence bands) between persons with MS and healthy controls, and examined the associations between step-based metrics and laboratory-assessed physical function and walking performance. We hypothesized that persons with MS would ambulate at a lower peak effort and spend more time in lower cadence bands in a free-living condition compared with healthy controls, and there would be strong associations between peak cadence indices with functional performance scores.
Methods
Participants
Participants with MS were recruited through advertising in the community, the National MS Society chapters, mailing lists from the MS clinics, and local therapeutic recreation facilities. Those who were interested in participating contacted the laboratory via email or phone and were screened based on the following inclusion criteria: (a) MS diagnosis; (b) age between 20 and 79 years old; (c) relapse-free for at least 30 days; (d) ambulatory with or without assistance; and (e) willingness to complete the testing procedures. Individuals not satisfying those criteria were excluded from participation. Healthy controls were recruited from the local community and matched by age (within 5 years) and sex of the MS sample (2 MS:1 control) based on similar criteria except for MS diagnosis or relapses. The original study had a total sample of 217 MS and 104 healthy controls. The current analysis only included participants with complete data for accelerometry and assessments of physical function and walking; the final analytic sample consists of 147 persons with MS and 54 healthy controls.
Study Procedures and Measures
The study protocol was approved by the Institutional Review Board of the University of Alabama at Birmingham (IRB-161108001). All participants provided written informed consent before data collection. Participants completed questionnaires and physical performance assessments during a single laboratory visit. After the session, participants wore an accelerometer during waking hours for 7 days and then mailed the device back to the laboratory through the United States Postal Service in a prepaid, pre-addressed envelope.
Demographic and Clinical Characteristics
All participants completed a questionnaire regarding demographic information, including age, sex, and race/ethnicity. Persons with MS further self-reported MS type and disease duration, and completed disability measures, including the Patient Determined Disease Steps (PDDS) and the 12-Item MS Walking Scale (MSWS-12). The PDDS is a valid measure of self-reported ambulatory disability status in MS, with scores ranging between 0 (Normal) and 8 (Bedridden). 21 The MSWS-12 is a patient-rated measure of the impact of MS on walking ability, 22 with walking difficulty rated from 1 (not at all) to 5 (extremely) on 12 items; the sum score was transformed into a scale from 0 to 100. Higher scores on the PDDS and MSWS-12 reflected higher levels of perceived disability and walking limitations in persons with MS.
Physical Function and Walking Performance
Laboratory assessments of physical function and walking performance were administered following standardized procedures. The Short Physical Performance Battery (SPPB) was used to access physical function, including standing balance, gait speed, and lower extremity strength.23,24 For standing balance, participants were instructed to maintain upright posture for 10 seconds in 3 stances (feet side-by-side, semi-tandem, and tandem) sequentially; those who were able to maintain balance with a given stance proceeding to undertake the subsequent, more challenging stance. Gait speed was assessed by recording the time for participants to walk a 4-m course at their normal pace. Lower extremity strength was assessed by asking participants to rise from a chair 5 times as quickly and safely as possible without the use of arms for support, a single practice of sit-and-rise was performed prior to the assessment. Component scores for each of the 3 assessments ranged from 0 (Inability to complete assessment) to 4 (High level of performance), and then were summed for a total score ranging from 0 to 12; higher scores indicated better physical function. 25 The Timed Up and Go (TUG) and Timed 25-Foot Walking (T25FW) tests were used to measure functional mobility and walking speed, respectively.26,27 For the TUG, participants performed the test as safely and quickly as possible by standing up from an armless chair without the use of hands, walking toward and around a cone located 3 m in front of the chair, walking back to the chair, and then sitting back down. During the T25FW, participants were instructed to walk as quickly and safely as possible across a 25-foot distance from a static start position. The average time of 2 trials was recorded in seconds for both assessments; a shorter duration for the TUG or faster speed (25 ft divided by time) for the T25FW represented better performance. Last, the 6-Minute Walk (6MW) was administrated as an objective measure of walking endurance. 28 Participants walked as fast and as far as possible within the limits of safety and stability in a large, open space free of obstacles for 6 minutes. The total distance walked over the 6-minute period was recorded by assessors using a distance-measuring wheel; a longer distance indicated better walking endurance.
Accelerometry
Free-living PA was assessed using ActiGraph GT3X+ accelerometers (ActiGraph Corporation, Pensacola, FL, USA). Participants wore the accelerometer on an elastic belt around the waist over the non-dominant hip during waking hours of a 7-day period, except for water-based activities (eg, showering). The accelerometer collected raw data at a sampling rate of 100 Hz, and the data were downloaded in 1-minute epochs and processed using ActiLife software. The Troiano wear-time algorithm was applied to identify non-wear time. 29 A valid day was considered to be ≥10 hours of wear time; individuals with 1 or more valid days of data were included in the analyses. Minute-by-minute data were further processed using custom R scripts to generate step-based metrics. 30 Daily steps (steps/day) were calculated by averaging step counts across all valid days. Peak-30CAD (step/minutes) was generated by: (1) first rank-ordering an individual’s steps/minutes values within each valid day; (2) calculating the mean of the highest 30 non-consecutive values within each day; and (3) finally taking the average of the resulting cadence values across all valid days. Peak-1CAD (step/minutes) was obtained by averaging the highest single steps/minutes value for each day across all valid wear days. A graphic representation for generating peak cadence is provided in Figure 1. The average time spent in established cadence bands from nonmoving to incrementally faster rates of movement were calculated across valid days and classified as the following: non-movement (0 steps/minutes), incidental movement (1-19 steps/minutes), sporadic movement (20-39 steps/minutes), purposeful movement (40-59 steps/minutes), slow walking (60-79 steps/minutes medium walking (80-99 steps/minutes), brisk/moderate walking (100-119 steps/minutes), and faster walking (≥120 steps/minutes). 16 Such classification of stepping cadence is adopted from previous research in the general adult population, yet it is considered to be appropriate for MS based on established step-rate thresholds for PA intensity among those with diverse disability levels. 20
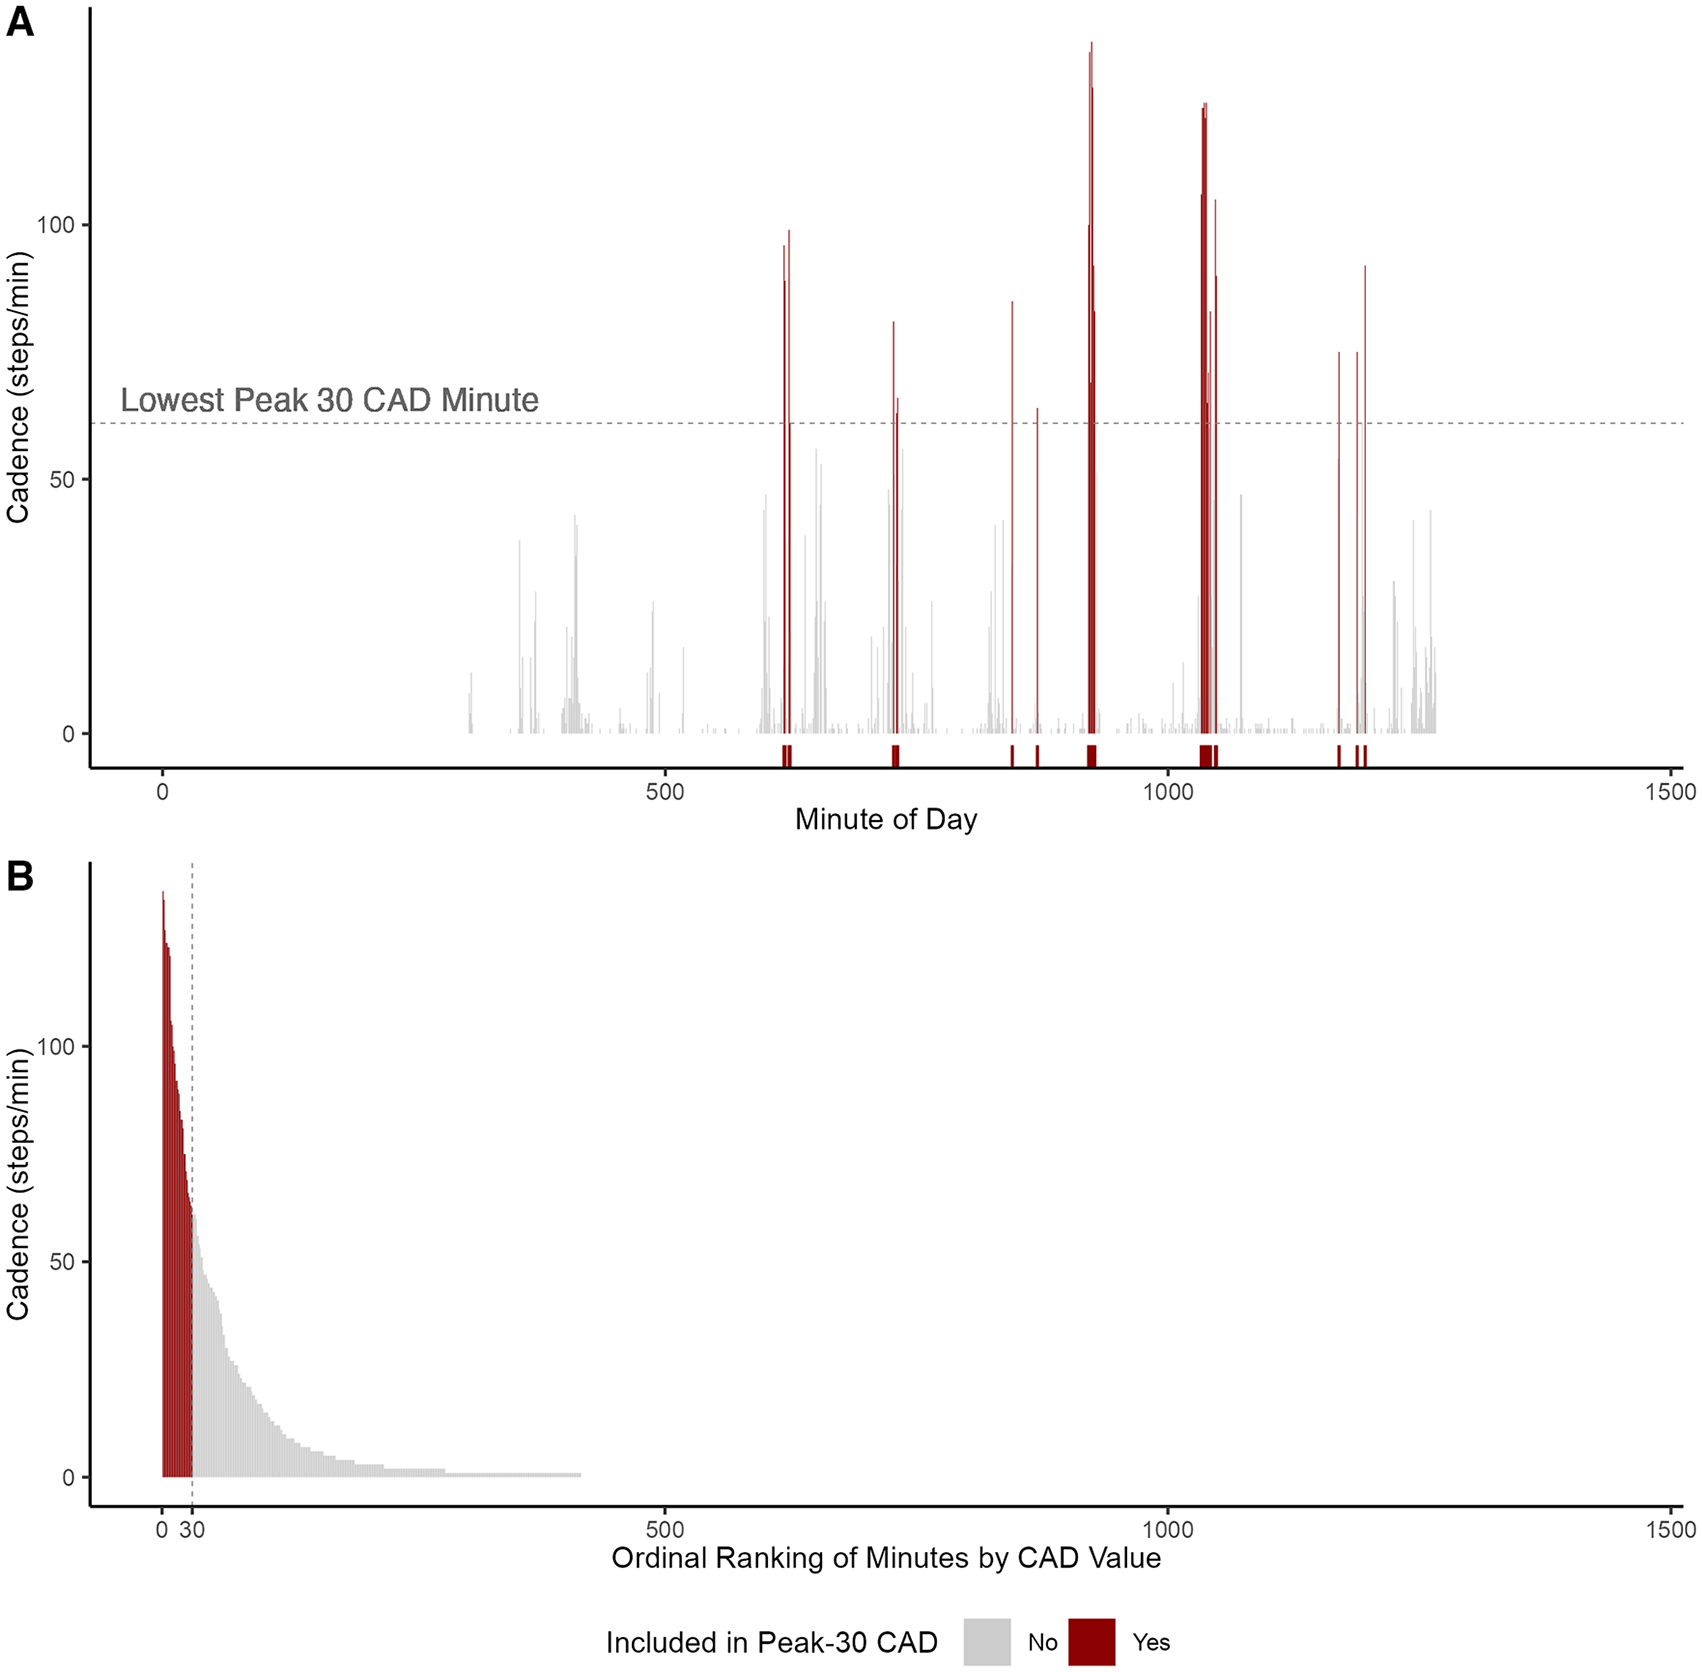
Visual description of peak 30-minute cadence (Peak-30CAD) calculation. The figure illustrates the data processing steps performed to calculate Peak-30CAD using 1 day of data from an individual. Panel A displays each cadence (steps/minutes) value across a day and identifies the highest 30 (not necessarily consecutive) values (highlighted); Panel B first rank orders the 30 highest cadence values within a day.
Self-reported Physical Activity
PA was further assessed using the Godin Leisure-Time Exercise Questionnaire (GLTEQ). 31 Participants reported the frequency of engagement in mild, moderate, or strenuous PA for 15+ minutes during the previous week. The frequencies of mild, moderate, and strenuous bouts were multiplied by 3, 5, and 9 METs, respectively; the resulting products were summed into a measure of overall PA, ranging from 0 to 119.
Statistical Analysis
Data were analyzed using R (version 4.1.1) with the α level set at .05. Sample characteristics are presented as mean (standard deviation), median (interquartile range), range (min–max), or point estimate with 95% confidence interval (CI) by groups, where appropriate. Independent samples t-tests were performed to determine differences in physical performance scores and step-based metrics between MS and healthy controls. The magnitude of difference was quantified using Cohen’s d effect size and interpreted as small (0.2), medium (0.5), and large (0.8). 32 We examined the associations between step-based metrics with physical function and walking performance, self-reported PA, disability, and age using Spearman (rs) correlation coefficients in MS and healthy controls separately. Since individuals who accumulated a greater number of daily steps likely also achieved higher values for peak cadence, we further performed partial correlations (prs) to examine the independent associations between peak cadence indices and other variables while controlling for daily steps. The magnitude of correlation coefficients was classified as weak (.1), moderate (.3), and strong (.5). 32
Results
There were no significant differences in age, sex, or race distribution, but persons with MS self-reported less PA participation (GLTEQ) than healthy controls (P < .01); see Table 1. Among the MS group, 16 participants walked using single-point assistive devices and 7 used bilateral assistive devices. Descriptive data for laboratory assessments and step-based metrics are provided in Table 2. Persons with MS had significantly lower scores on all performance tests, fewer daily steps, and lower peak cadence than healthy controls (|d| = 0.57-0.85; P < .001). Both groups spent the greatest amount of monitored time in non-movement and there were pronounced reductions in each incrementally higher cadence band (Figure 2). The MS sample demonstrated significantly less time spent in purposeful steps, slow walking, medium walking, and brisk walking (d = −0.65 to −0.90; P < .001), but more time in incidental movement than the control sample (d = 0.36, P = .015).
Demographic and Clinical Characteristics of Persons with MS and Healthy Controls.
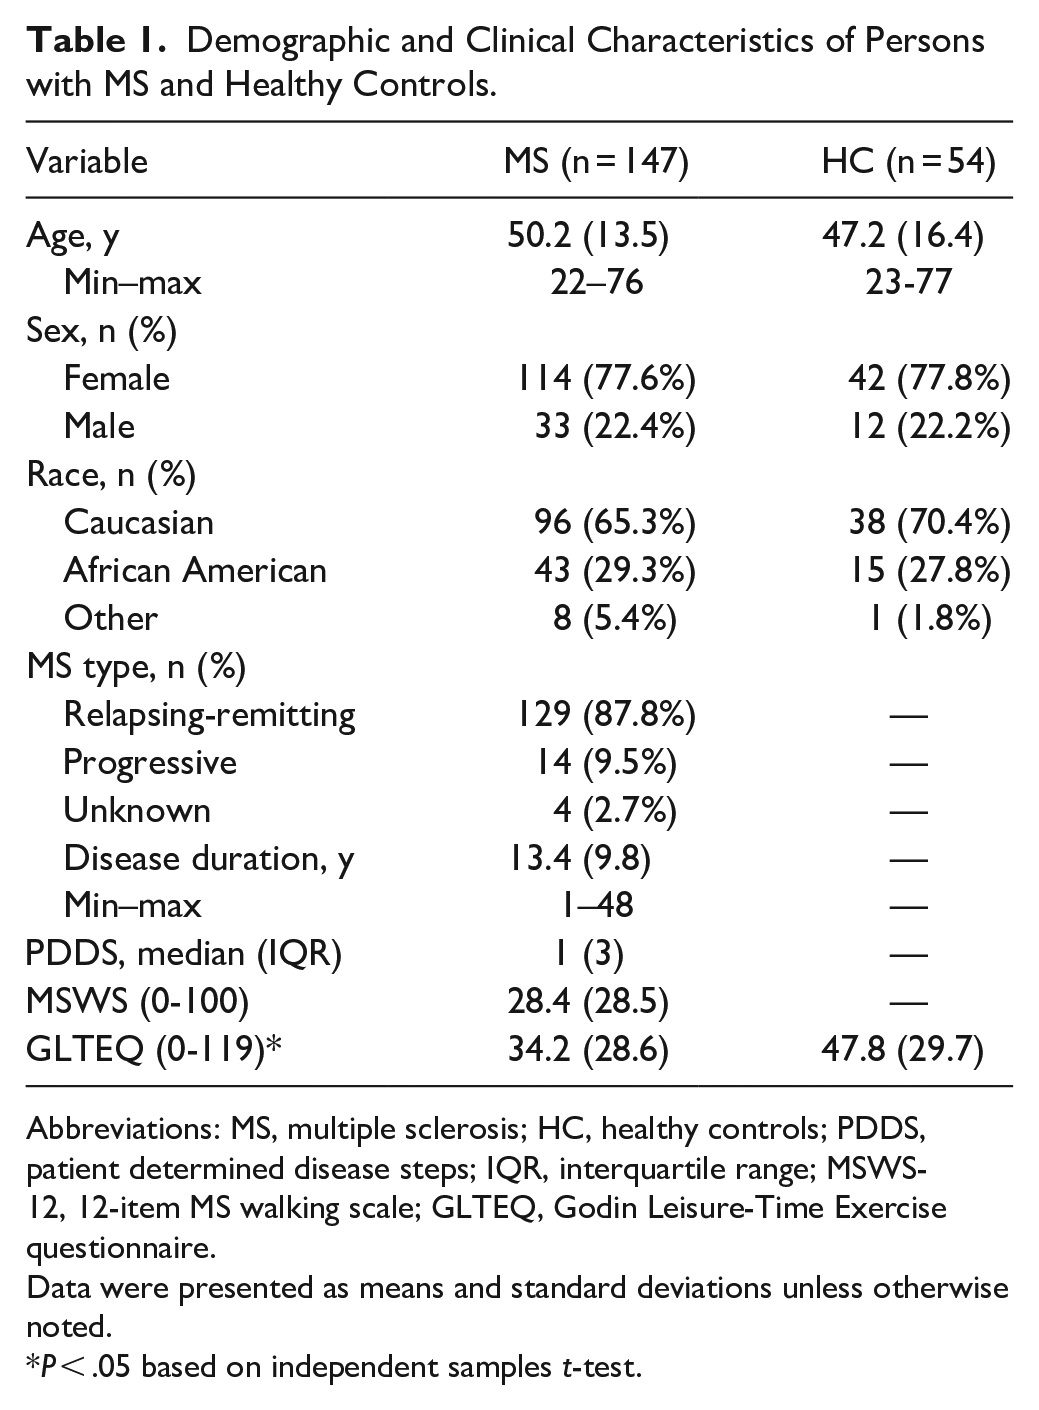
Abbreviations: MS, multiple sclerosis; HC, healthy controls; PDDS, patient determined disease steps; IQR, interquartile range; MSWS-12, 12-item MS walking scale; GLTEQ, Godin Leisure-Time Exercise questionnaire.
Data were presented as means and standard deviations unless otherwise noted.
P < .05 based on independent samples t-test.
Device-Measured Step-Based Metrics and Physical Function in Adults with MS and Healthy Controls.
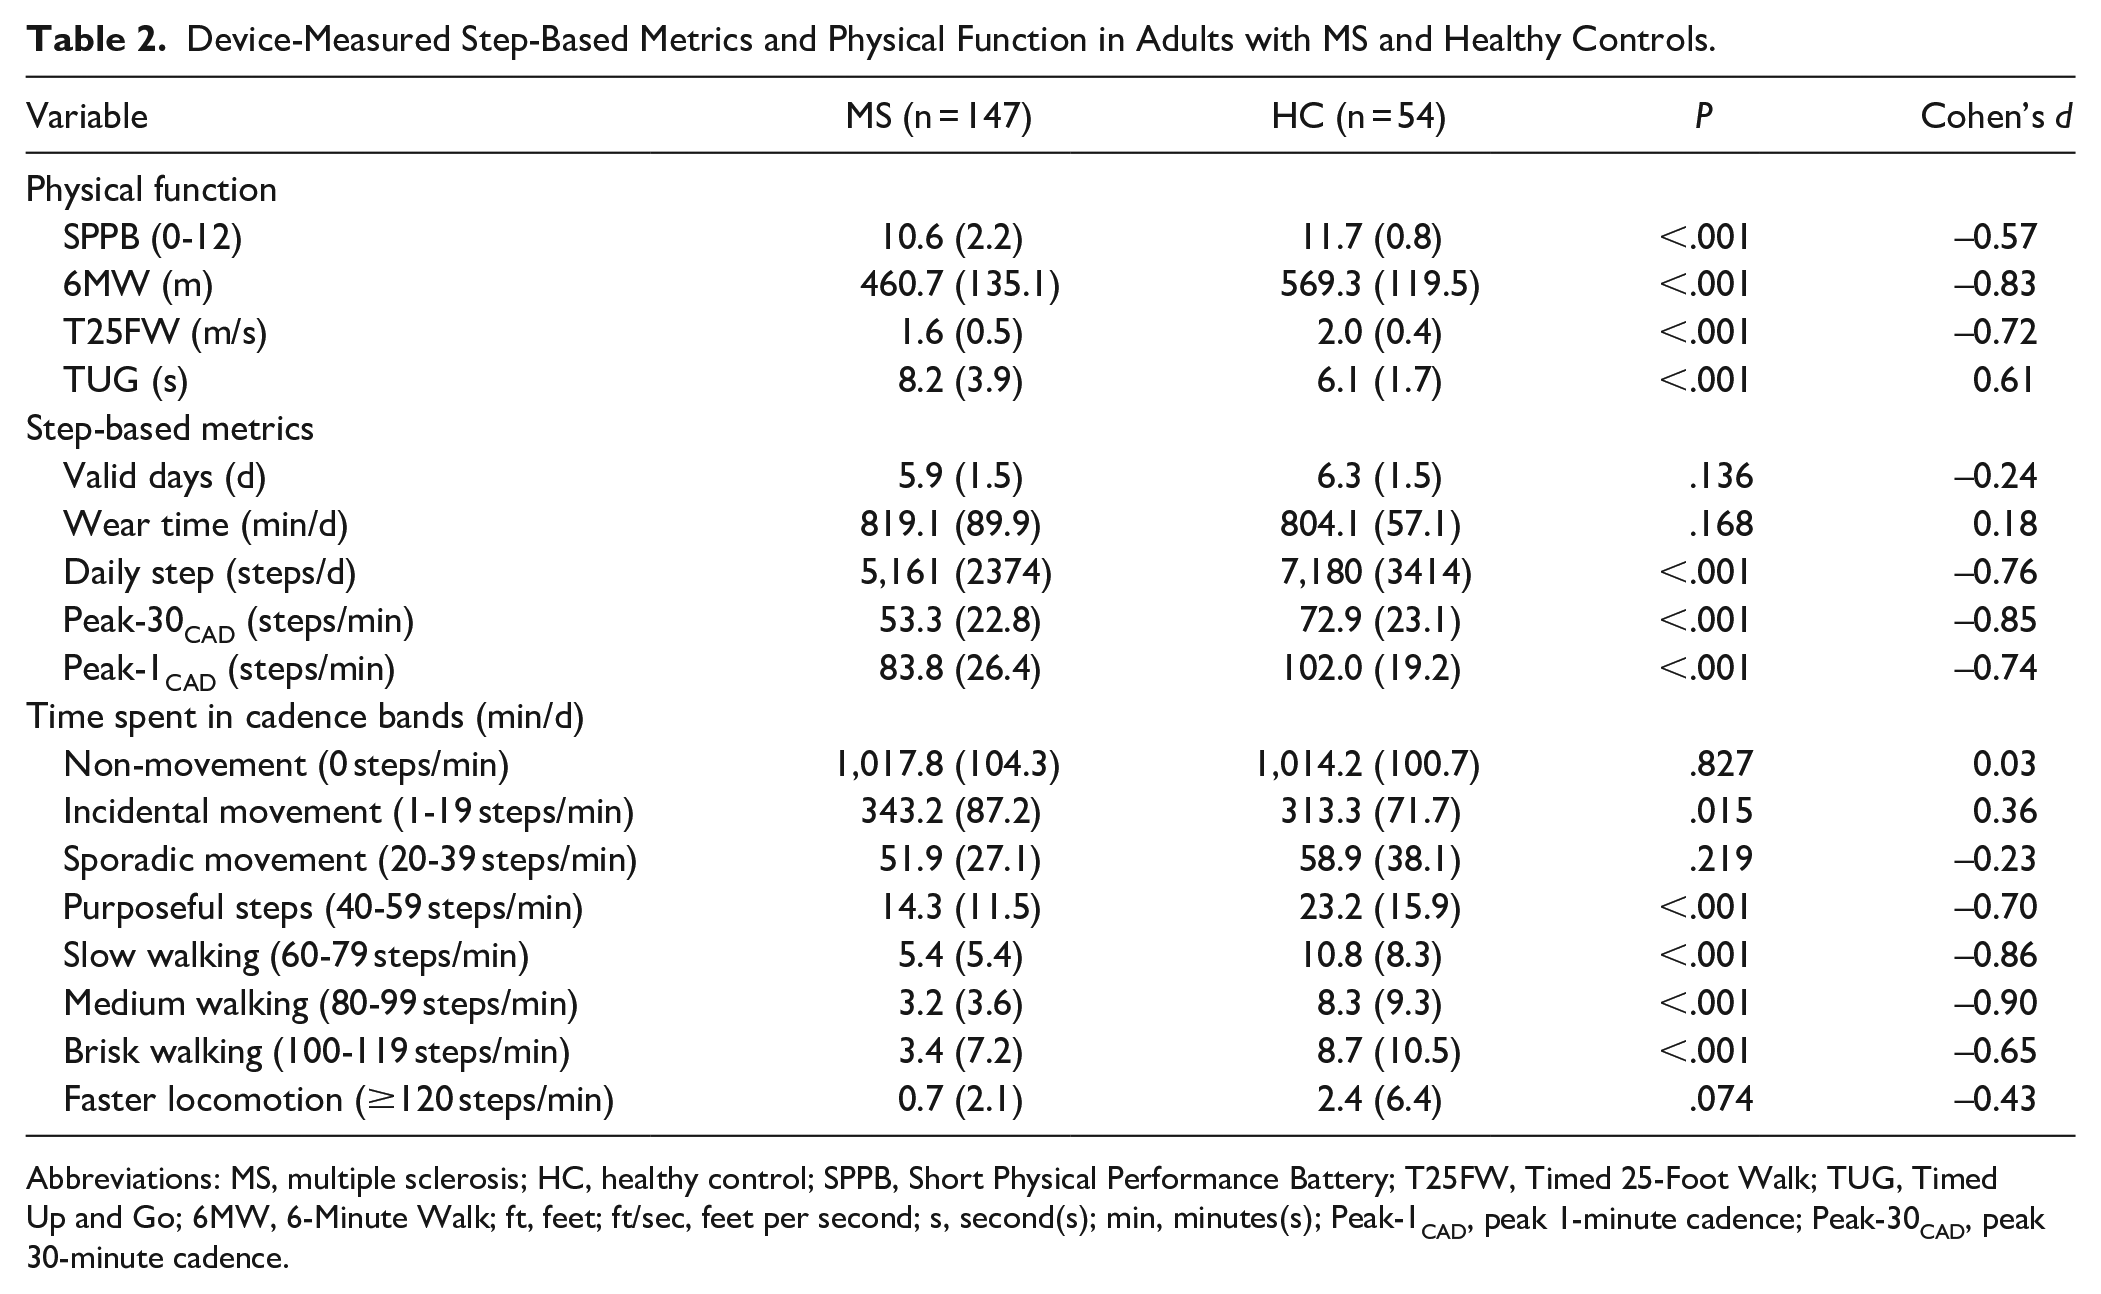
Abbreviations: MS, multiple sclerosis; HC, healthy control; SPPB, Short Physical Performance Battery; T25FW, Timed 25-Foot Walk; TUG, Timed Up and Go; 6MW, 6-Minute Walk; ft, feet; ft/sec, feet per second; s, second(s); min, minutes(s); Peak-1CAD, peak 1-minute cadence; Peak-30CAD, peak 30-minute cadence.
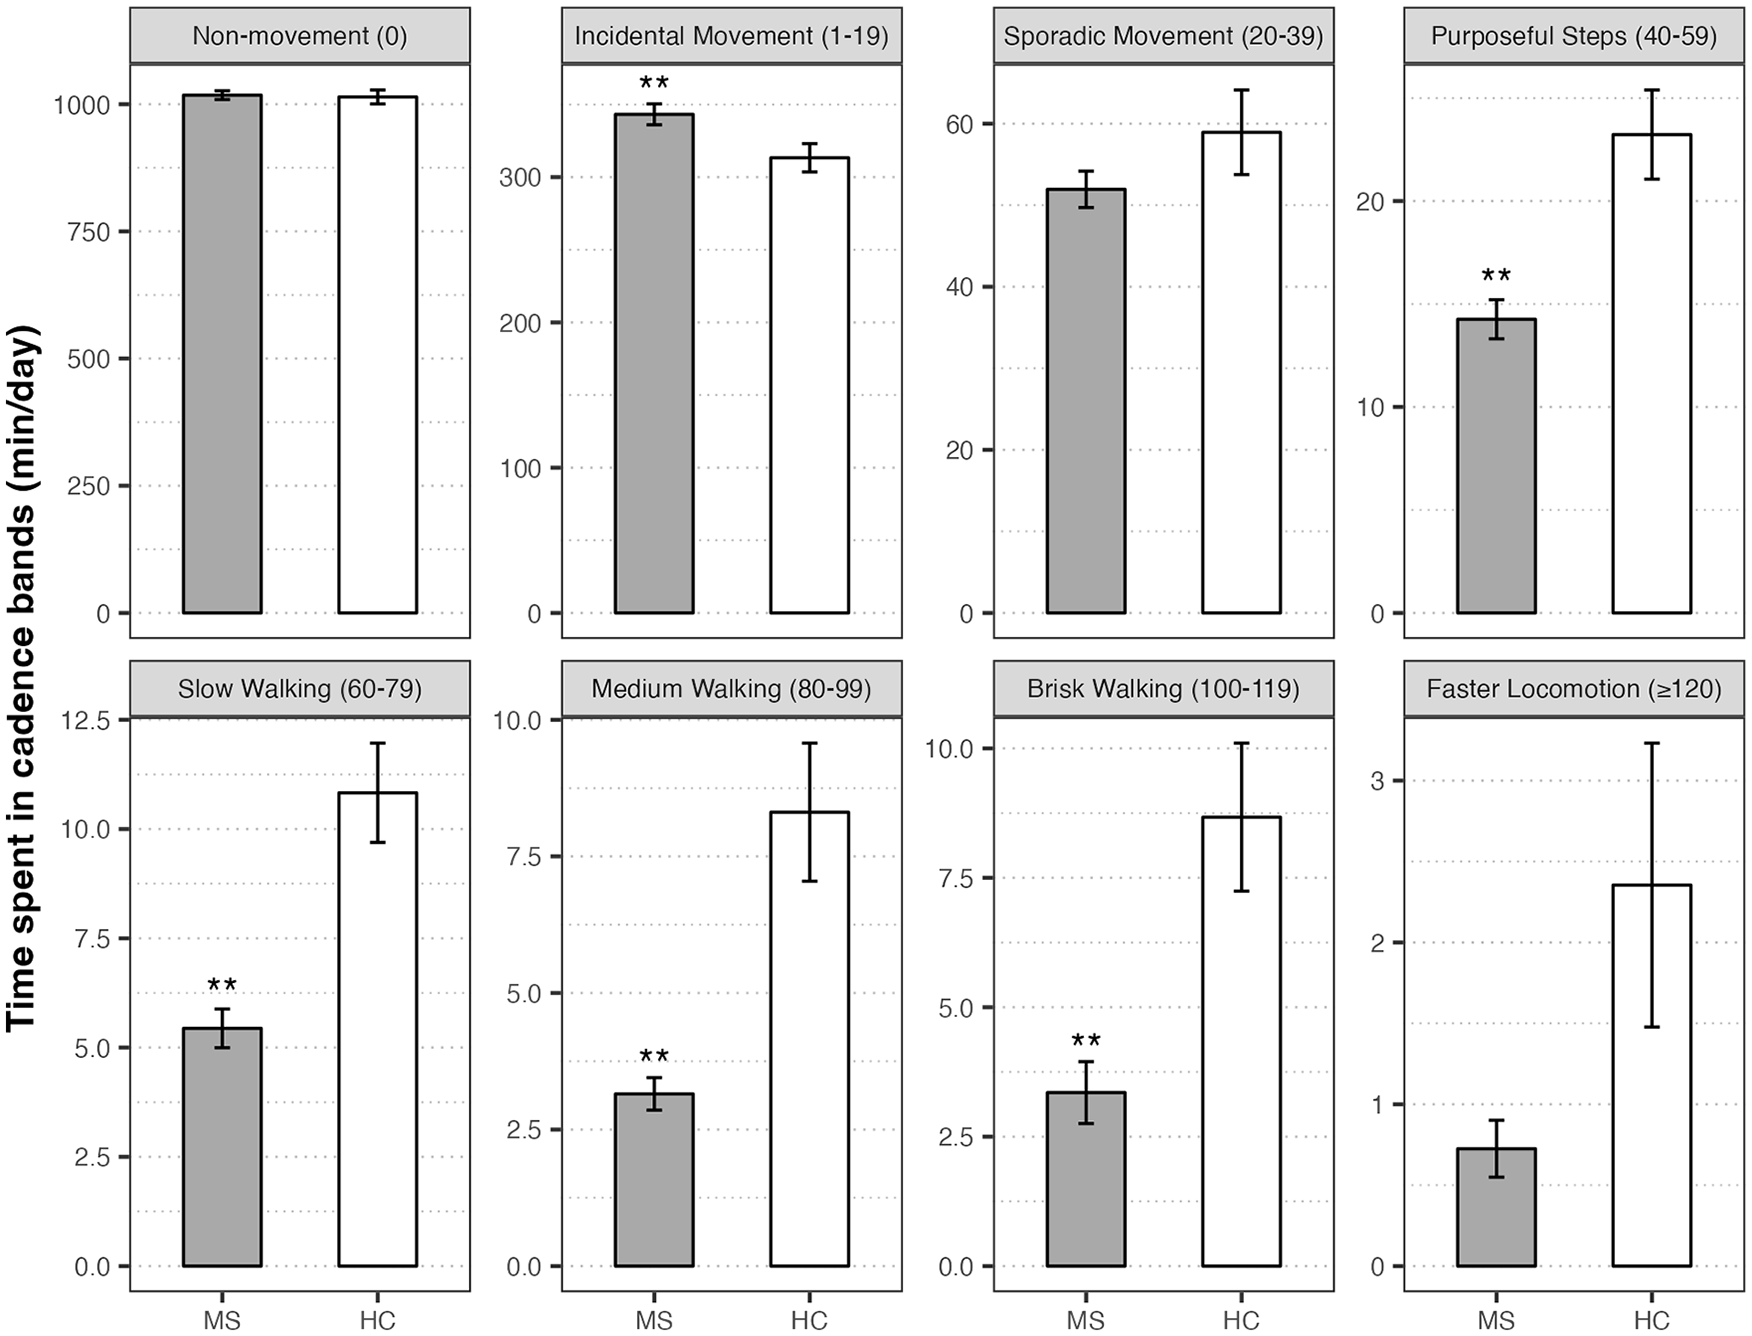
Group comparisons of average time (minutes/day) spent in cadence bands (steps/minutes) for individuals with multiple sclerosis (MS) and healthy controls (HC). Boxes and error bars represent mean values and standard errors.
The bivariate and partial correlations between step-based metrics with other variables are presented in Table 3. Daily steps were strongly correlated with all physical performance scores in MS (|rs| = 0.58-0.60), but it was only correlated with 6MW scores in healthy controls (rs = 0.38), all P < .01). There were significant associations between Peak-30CAD and Peak-1CAD with all physical performance scores (SPPB, T25FW, 6MW, and TUG) in both groups, yet the magnitudes were slightly stronger in MS than controls (|rs| = 0.56-0.68 vs 0.35-0.62). Of note, the associations between peak cadence and physical performance scores remained significant after controlling for daily steps in both groups (|prs| = 0.22-0.44 vs 0.27-0.53; P < .01). Scatter plots with lines of best fit for bivariate correlations between peak cadence and physical performance scores are displayed in Figure 3.
Correlations between Device-Measured Step-Based Metrics, Physical Function, Walking, and Other Variables.
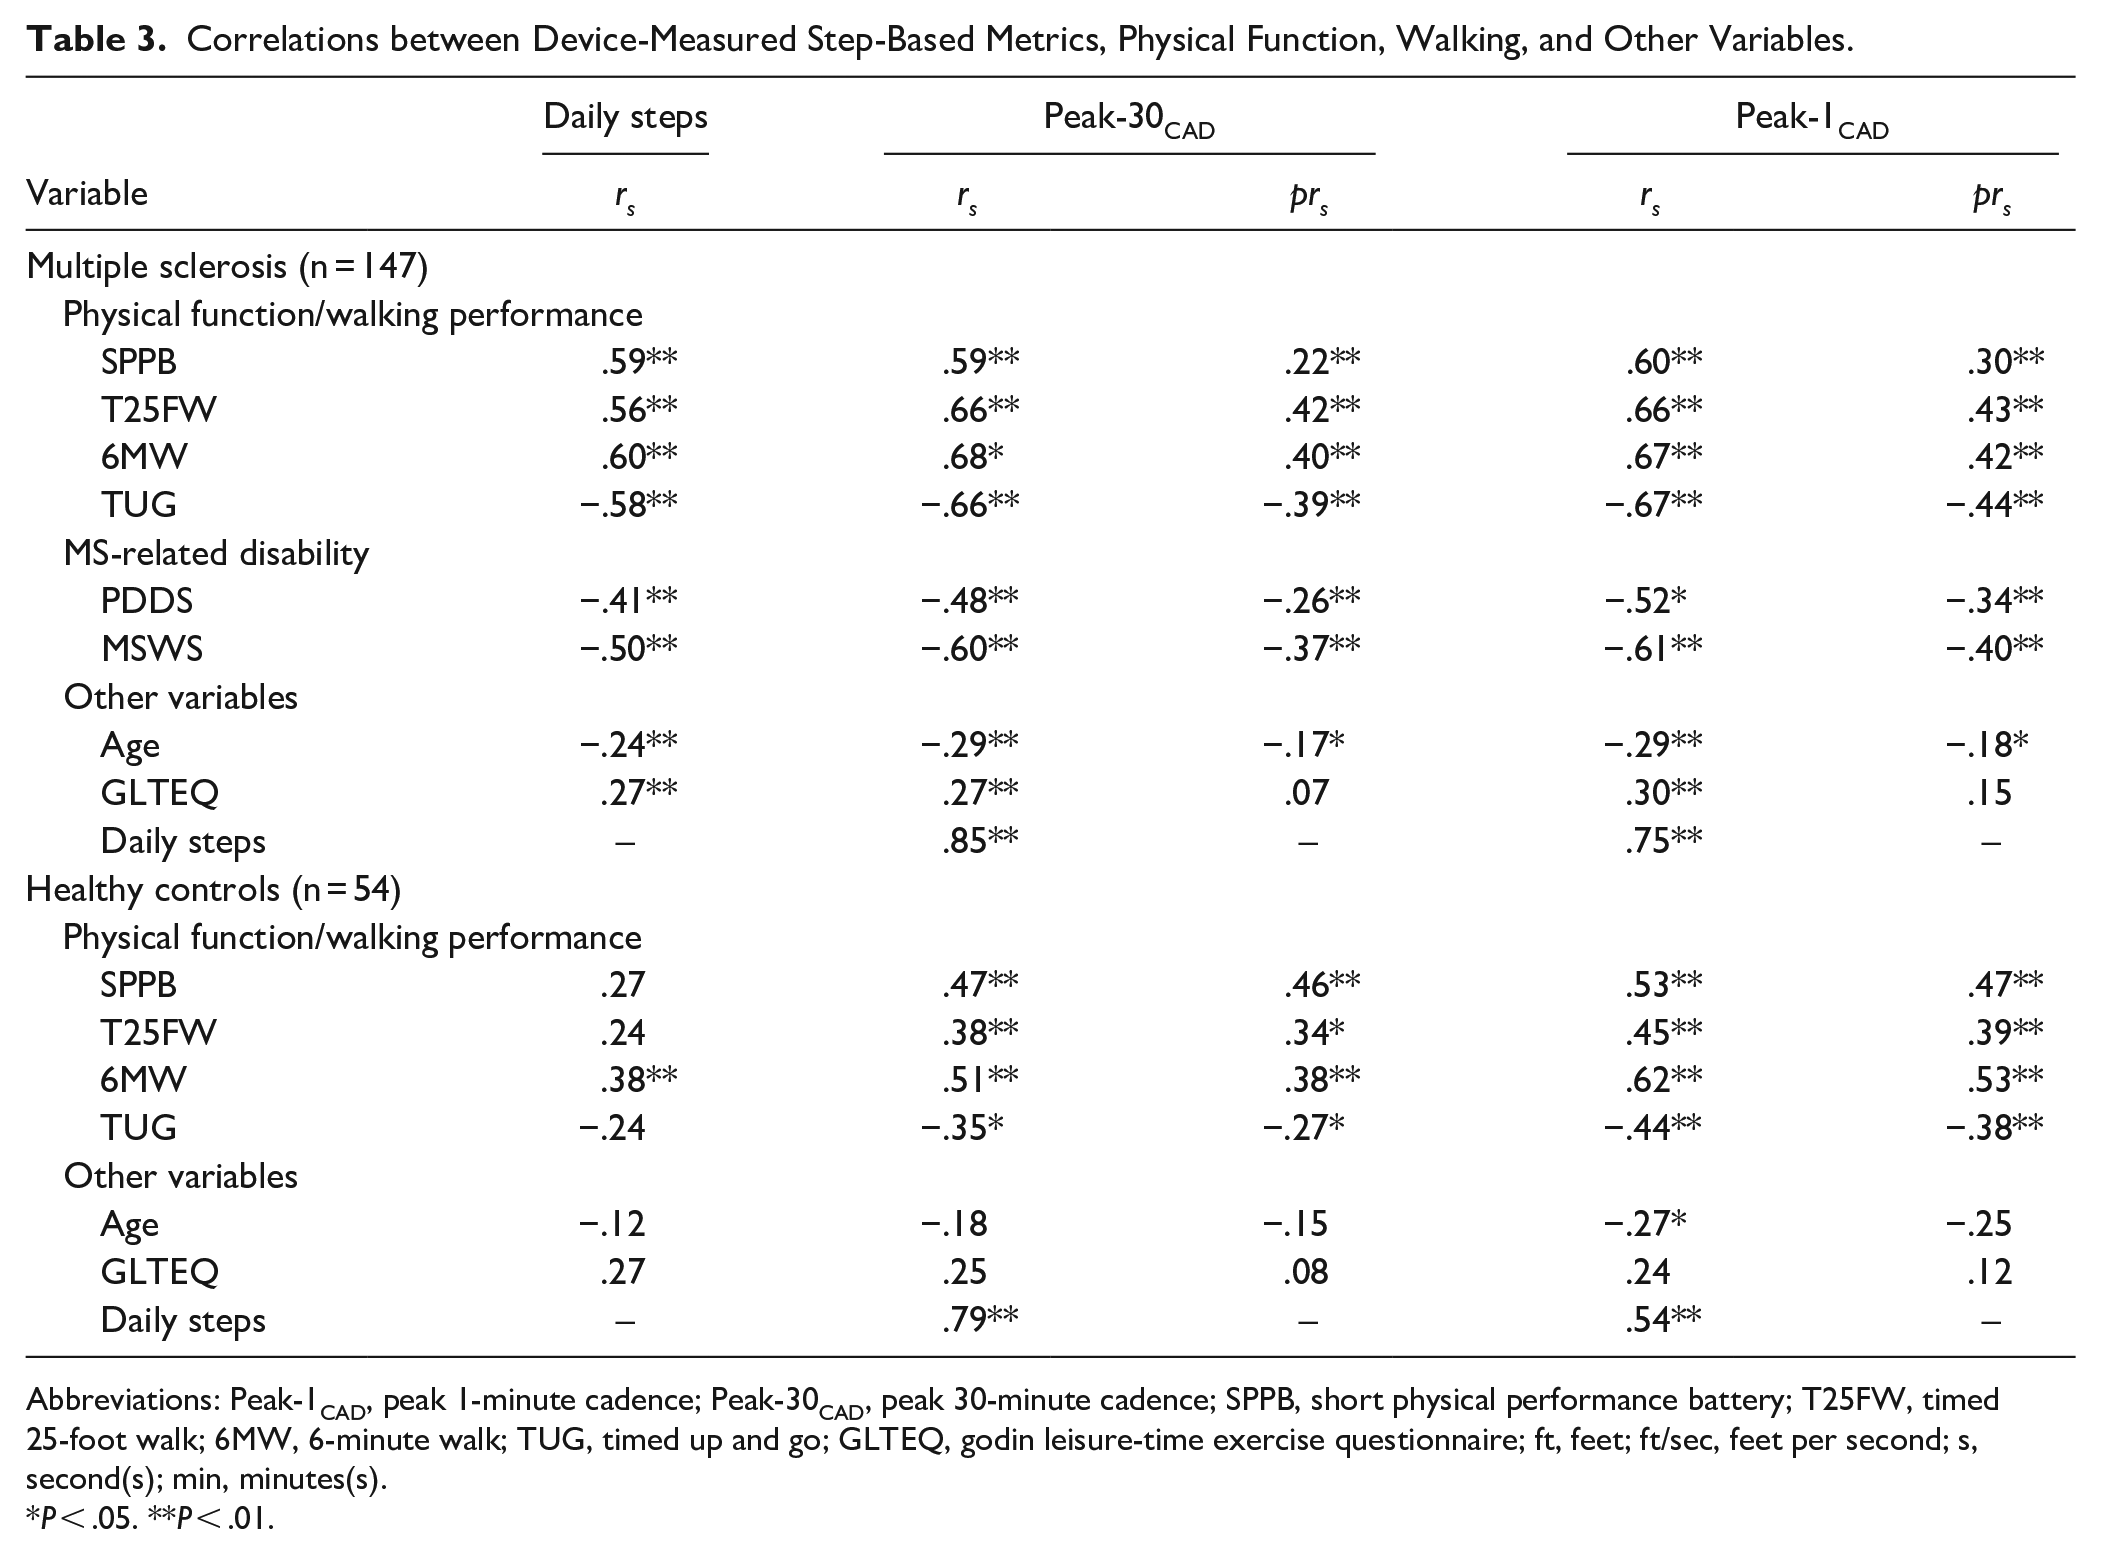
Abbreviations: Peak-1CAD, peak 1-minute cadence; Peak-30CAD, peak 30-minute cadence; SPPB, short physical performance battery; T25FW, timed 25-foot walk; 6MW, 6-minute walk; TUG, timed up and go; GLTEQ, godin leisure-time exercise questionnaire; ft, feet; ft/sec, feet per second; s, second(s); min, minutes(s).
P < .05. **P < .01.
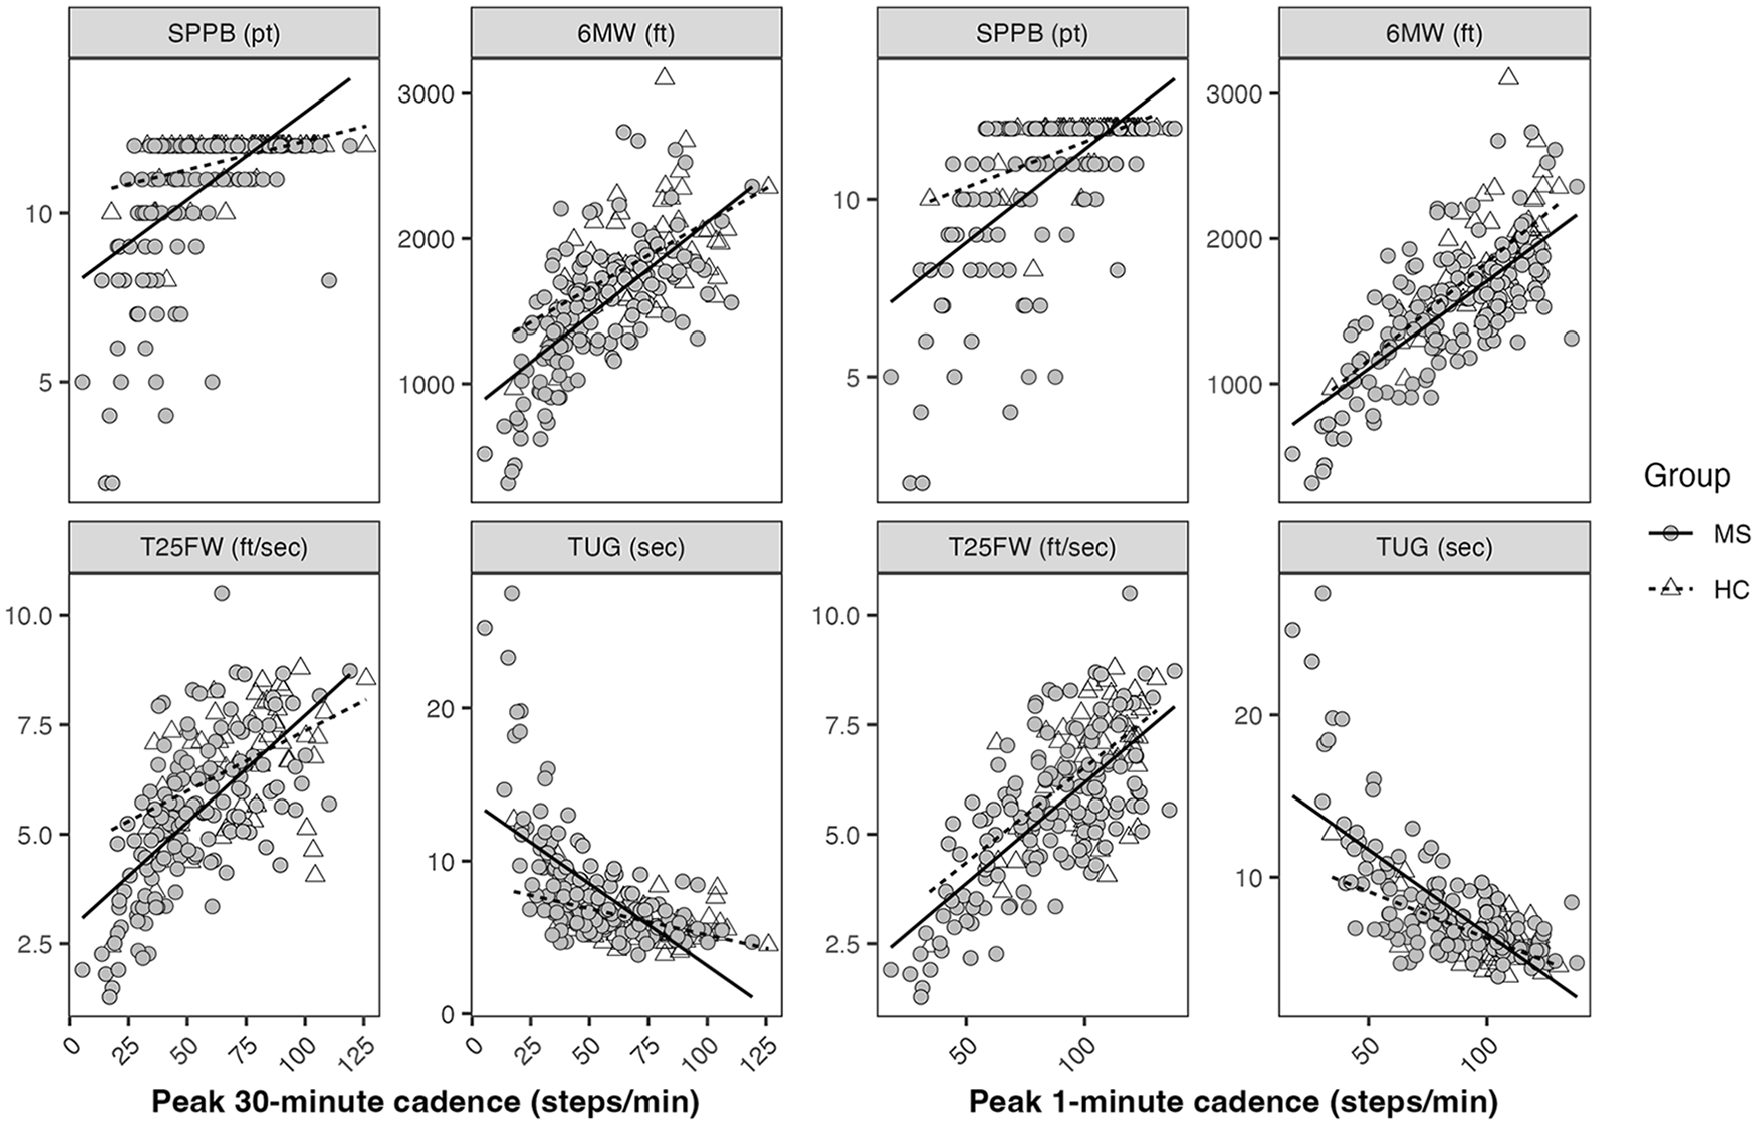
Scatter plots with lines of best fit for bivariate relationships between peak cadence and functional scores in multiple sclerosis (MS) and healthy controls (HC).
Within the MS sample, Peak-30CAD and Peak-1CAD were inversely correlated with age and MS-related disability with or without controlling for daily steps (P < .01). Only Peak-1CAD was significantly correlated with age in healthy controls (rs = −0.27), yet this relationship became non-significant after adjusting for daily steps. There were significant bivariate correlations between daily steps and peak cadence indices with GLTEQ in MS (rs = 0.27-0.30), but not healthy controls (P > .05); this relationship in MS was non-significant when controlling for daily steps (P > .05). Daily steps were strongly correlated with both Peak-30CAD and Peak-1CAD, but its association with Peak-1CAD was weaker in controls than MS (rs = 0.54 vs 0.75). The bivariate correlation between Peak-30CAD and Peak-1CAD was 0.96 in MS compared with 0.83 in healthy controls.
Discussion
The current study examined accelerometer-measured, free-living peak cadence and its association with physical and walking performance, age, disability, and self-reported PA in persons with MS and healthy controls. As expected, persons with MS demonstrated worse physical function and walking performance and engaged in lower volume (daily steps) of free-living PA with lower intensity and peak natural effort (Peak-30CAD and Peak-1CAD) than healthy controls. When classifying PA using cadence bands, the MS sample spent less time in purposeful steps, slow walking, medium walking, and brisk walking (ranging from 40 to 119 steps/minutes), but accumulated more incidental movement (1-19 steps/minutes) compared with controls. Interestingly, we observed that Peak-30CAD and Peak-1CAD were independently associated with physical performance (SPPB, T25FW, 6MW, and TUG) after controlling for daily steps, with stronger correlations in MS than healthy controls. Additionally, our results indicated significant associations between peak cadence with age and disability status in MS, regardless of daily steps. To our knowledge, this is the first study that focused on free-living peak cadence and cadence-bands in MS.
Persons with MS engaged in substantially less PA than healthy controls (P < .05), and this is consistent with previous research.6,33 Notably, we extended current knowledge by using steps-based metrics to quantify natural effort and further illustrated a full range of intensity levels participated by persons with MS. Herein, the MS sample had a mean Peak-30CAD of 53.3 steps/minutes and Peak-1CAD of 83.8 steps/minutes, and these were lower than healthy controls (72.9 and 102.0 steps/minutes, respectively), the U.S. general population (71.6 and 100.7 steps/minutes, respectively) 11 and some older adult samples (eg, 61.7 and 100.8 steps/minutes in older cancer survivors).34-36 This suggests a deleterious impact of MS on daily ambulatory behavior, including total volume, intensity and persistence, and physical capacity for higher-intensity PA. Given that 100 steps/minutes is considered as a cadence threshold for moderate-intensity walking, 20 the MS sample spent approximately 4.1 minutes/day in higher intensity walking activities. Although this is substantially less time compared with the average MVPA rate in MS (eg, 18.7 minutes/day) from a cross-sectional study, 8 we still observed medium to large difference between the MS and control samples (d = −0.65 to −0.43), similar to previous evidence.8,37 Furthermore, our findings revealed patterns of light-intensity PA (<100 steps/minutes) in MS distinct from previous studies. 33 One recent meta-analysis summarized accelerometry outcomes in MS and suggested overall more sedentary time and less light intensity PA (reported as minutes/day or percent monitor time) compared with healthy controls (effect size of 0.29 and −0.34, respectively). 33 However, we reported that the MS sample spent less time in some light-intensity levels (40-99 steps/minutes), but accumulated more incidental movement (1-19 steps/minutes) and comparable non-movement (zero cadence) and sporadic movement (20-39 steps/minutes) as healthy controls. Future research might examine peak cadence in diverse MS samples and identify clinically relevant thresholds associated with specific health benefits.
One important finding is that in MS, free-living peak cadence was independently associated with physical function and walking performance assessed in a laboratory condition while controlling for PA volume (ie, strong bivariate and moderate partial correlations). This is plausible because individuals who are able to regularly ambulate at higher intensity (eg, brisk walking) would be better suited to achieve higher functional test scores. Similar findings have been reported in a previous study in older adults (n = 43; aged 67.3 ± 5.3 years), in which Peak-30CAD was correlated with fast speed and completion time of a 400-m walk test regardless of daily steps (|pr| = 0.34 and −0.30, respectively). Further, our data demonstrated comparable correlations between Peak-30CAD and Peak-1CAD with functional scores in MS (|r| = 0.60-0.67 vs 0.59-0.68), but Peak-1CAD demonstrated stronger associations with functional scores than Peak-30CAD in healthy controls (|r| = 0.44-0.62 vs 0.35-0.51). This aligns with the definitions of peak cadence indices addressed above and potentially suggests a difference between MS and healthy controls. Likely, healthy individuals might choose to walk at a comfortable yet lower intensity below their actual capacity, whereas persons with MS tended to exert near-full effort during prolonged walking bouts in daily living. Indeed, every-day walking may occur in a complex, cognitively challenging environment analogous to in-lab dual-task walking 4 and result in worse gait outcomes (eg, variability and stability) than usual walking, which is particularly relevant for those with cognitive and physical impairments.3,5,38 Given the high correlation between Peak-30CAD and Peak-1CAD as well as their comparable associations with physical performance scores, it appears that the 2 indices could be used interchangeably in MS under a free-living condition. Further investigation is needed to address the distinct benefits and utilities of peak cadence indices in various environments to facilitate practical implementation in MS compared with the general population. 39
The current study further examined the potential correlates of peak cadence, including age, disability, and self-reported PA. In MS, the inverse associations between peak cadence with age and disability scores suggest a decreased capacity for daily ambulatory activities due to aging and MS-caused impairments. Unlike previous studies in the general population, 11 we did not observe significant associations between age with daily steps or Peak-30CAD in healthy controls. This discrepancy is likely due to the small sample of healthy controls matched with the MS sample. After adjusting for daily steps, the relationship between self-reported PA and peak cadence became non-significant, suggesting that peak cadence may be less related to PA volume. Collectively, we identified independent associations with functional scores, age, and disability. This underscores the potential use of peak cadence as a distinct measure in MS, and it may provide valuable insights into physical capacity and aspects of ambulatory behavior in real-world scenarios. 18 Further research is needed to understand the implications of free-living peak cadence in MS, such as establishing measurement criteria and normative data (eg, across lifespan), identifying benchmark values relevant to clinical health outcomes, and calibrating peak cadence indices in various walking environments.10,18
Real-world walking performance has gained increasing attention in MS. For example, 1 study demonstrated diminished gait quality (eg, speed, stride regularity) during free-living ambulation compared to usual laboratory walking among 44 persons with MS. 40 Another study observed that persons with MS who had greater walking capacity (6MWT ≥ 500 m) rarely walked at a comparable pace to the clinical assessment during daily living (12.2%-20.5%), whereas those with lower capacity (6MW < 300 m) exhibited more consistency between the 2 environments (72.5% steps ≥ 6 MW pace). 41 Such difference in clinical versus real-world walking performance may affect clinical interpretation of functional test results (ie, whether a change over time translates to real-life activities) and highlights the importance of establishing real-world walking metrics that hold ecological validity and support for targeted rehabilitation. 41 Although some studies involved conventional walking outcomes or cadence in free-living settings,42,43 these approaches might require statistical techniques to acquire the desired outcome (eg, habitual walking step rate via personalized activity modeling 43 ) or not be readily interpretable for practical application. By contrast, peak cadence has shown initial feasibility in population-based research and has been applied in other chronic diseases outside of MS.34,44 The current study provides support for the use of this promising and understandable metric for real-world walking performance in persons with MS. Of note, our findings suggest that peak cadence captures performance irrespective of PA volume, and this unique aspect was not explored in other approaches within previous MS research. Other strengths of the current study include the incorporation of multiple laboratory assessments (physical function and walking), the examination of factors pertinent to MS and walking (disability and age), and the comparison with healthy controls.
Several limitations in the current study should be acknowledged. Our MS sample was ambulatory with relatively low disability status, and these findings may have limited generalizability across advanced levels of disability and impaired mobility or other health conditions. We had imbalanced sample sizes for MS and healthy controls and did not control for other factors that may be related to walking performance and peak cadence, such as sex 35 and body mass index. 19 By extension, future studies may consider larger, diverse MS and control samples to examine peak cadence and its associations with various health outcomes.
Conclusion
Herein we provided the first application and validation of peak cadence metrics via accelerometry in persons with MS. There were strong associations between free-living peak cadence and laboratory-assessed physical function and walking performance, independent of the amount of PA. Additionally, peak cadence was independently associated with age and MS-related disability. Our findings support the potential use of peak cadence with other step-based metrics (eg, time spent in cadence bands) for comprehensively evaluating natural effort and ambulatory performance in a free-living condition. Future research should examine the clinical relevance of peak cadence for practical implications in persons with MS.
Footnotes
Acknowledgements
The authors thank all study participants for the time and effort dedicated to the research.
Declaration of Conflicting Interests
The author(s) declared no potential conflicts of interest with respect to the research, authorship, and/or publication of this article.
Funding
The author(s) disclosed receipt of the following financial support for the research, authorship, and/or publication of this article: This work was supported by a grant (CA-1708-29059) and a mentor-based postdoctoral fellowship for rehabilitation research (MB 2110) from the National Multiple Sclerosis Society.