
Abstract
Objective
Diabetic peripheral neuropathy (DPN) is a common chronic complication of diabetes, but current diagnostic methods are limited by invasiveness, poor sensitivity, or subjectivity. This study aims to develop a non-invasive, reliable diagnostic tool using multimodal optical coherence tomography (OCT) images and a deep learning (DL) algorithm with multi-head attention for early DPN detection.
Methods
A multi-head attention-based DL model was constructed, with ResNet-18 as the feature extractor to fuse and classify enface OCT images from different retinal layers. A total of 3264 OCT images from 544 eyes of 435 diabetic patients were enrolled. The model was evaluated via fivefold cross-validation on the training dataset (Dataset A, n = 267) and further validated on a temporal validation dataset (Dataset B, n = 168). Single-layer contrast experiments were conducted to identify the most predictive retinal layer, and Gradient-weighted Class Activation Mapping (Grad-CAM) was used for model visualization.
Results
The proposed model achieved an average area under the curve (AUC) of 0.719 in fivefold cross-validation and an AUC of 0.721 in the temporal validation dataset. Among all retinal layers, the avascular layer provided the highest predictive value for DPN (average AUC = 0.707), with significant differences in performance compared to other layers (p < 0.05). Grad-CAM visualization revealed that photoreceptor defects were the key regions contributing to the model's classification decisions, suggesting an association between photoreceptor abnormalities and DPN. Additionally, the model outperformed individual retinal indicators (retinal nerve fiber layer thickness, superficial capillary plexus/deep capillary plexus density) whose AUCs ranged only from 0.524 to 0.565.
Conclusion
The multi-head attention-based DL model effectively identifies DPN using non-invasive OCT images, with the avascular layer providing critical information. This approach provides a promising clinically feasible early screening strategy, and photoreceptor defects may serve as a potential DPN biomarker, requiring further validation.
Keywords
Introduction
Diabetic peripheral neuropathy (DPN) is one of the most common chronic complications among patients with diabetes and is characterized by degenerative changes in the peripheral nerves. In severe cases, it can lead to loss of sensory function, ulcers, and even amputations. 1 With the continued rise in diabetes prevalence, diabetes and its associated complications have become a significant public health issue worldwide. 2 Over the past three decades, the global number of patients with diabetes has quadrupled, with approximately 1 in 11 adults currently living with diabetes, indicating the growing burden of DPN. 3
Early detection and diagnosis of DPN are crucial for the clinical management of patients with diabetes. 4 Several methods are available for assessing DPN, but many, such as scoring systems like the Michigan Neuropathy Screening Instrument, are limited by subjectivity, poor repeatability, and low sensitivity. 5 Nerve conduction velocity (NCV) can be used to analyze nerve conduction function quantitatively; however, it is not sufficiently sensitive for early or small fiber neuropathy. 6 Skin biopsy is considered the gold standard for diagnosing DPN; however, it is an invasive, costly, and time-consuming procedure. 7 Therefore, finding a simple, non-invasive, clinically feasible, and highly sensitive method for the early detection and diagnosis of DPN is essential.
Optical coherence tomography (OCT) is a high-resolution, non-invasive ophthalmic examination method commonly used to assess the structural condition of the retina. 8 Using low-coherence light interferometry, OCT provides cross-sectional images of the retina, accurately displaying various layers of the retinal structure. 9 Retinal nerve fiber layer thickness measured from OCT images has been shown to be a biomarker for detecting or predicting DPN. 10 The Enface image in OCT is a cross-sectional planar image, different from the commonly used longitudinal cross-sectional images; it is a surface image of the retina or other tissue structures observed from a specific depth layer. 11 This imaging method can display the lateral details of specific retinal layers, thereby providing more detailed information. 12 Systematic analysis of these images may help identify new sensitive markers for DPN.
Deep learning (DL) has achieved remarkable success in the field of medical image analysis, particularly in tasks such as image classification, segmentation, and object detection. 13 Its success is primarily attributed to its ability to automatically learn features from large datasets, thereby reducing dependence on manual feature extraction. 14 DL methods have been widely applied for the automatic analysis of OCT images. 15
The multi-head attention mechanism, initially used in the transformer model for natural language processing, has gained widespread application in the field of DL in recent years. 16 This mechanism performs multiple parallel attention calculations on the input information, allowing it to capture both global and locally correlated features, thereby enhancing the model's ability to represent complex features. 17
This study proposes a DL algorithm based on a multi-head attention mechanism to integrate multimodal OCT images for identifying DPN. The algorithm also uses class activation maps to identify specific regions in images that contribute to the classification decisions. Using this automated approach, populations at high risk of DPN can be identified, providing a reference for the early detection and diagnosis of DPN in clinical practice.
Methods
Study design and population
Participants in this study were patients with diabetes who underwent optical coherence tomography angiography (OCTA) examinations at the Endocrinology Laboratory of Qilu Hospital, Shandong University, between July 2023 and September 2024. Examinations were conducted from 8:30 AM to 11:30 AM and from 2:30 PM to 5:00 PM each day. Participants were excluded if they met any of the following exclusion criteria: (1) history of vitreous hemorrhage, retinal detachment, intraocular surgery (except cataract surgery), or ocular trauma; (2) prior anti-VEGF treatment; (3) suspected ocular diseases such as glaucoma, vitreous disease, amblyopia, or abnormalities of the optic nerve or cup-to-disc ratio; (4) severe systemic diseases other than diabetes, such as uncontrolled hypertension, malignancy, nephritis, or cerebrovascular disease; (5) history of systemic surgery, thrombolytic therapy, or renal dialysis.
DPN was diagnosed based on the Toronto Consensus Criteria, 18 which requires that the diagnosis of DPN meet at least two of the following conditions: (1) objective evidence of abnormal nerve function, such as through NCV tests, and (2) presence of one or more patient-reported symptoms of neuropathy (e.g. paresthesia, numbness, pain) or detection of signs of nerve damage through physical examination (e.g. monofilament testing, vibration perception, pinprick sensation, thermal sensation).
Diabetes in this study was diagnosed according to the 2024 standards of the American Diabetes Association (ADA), 19 using any of the following glucose test results: (1) fasting plasma glucose (FPG): plasma glucose level after fasting for at least 8 h. Diabetes was diagnosed if FPG was ≥7.0 mmol/L (126 mg/dL); (2) oral glucose tolerance test: a plasma glucose value measured 2 h after ingesting 75 grams of glucose. A value of ≥11.1 mmol/L (200 mg/dL) confirmed diabetes; (3) Glycated Hemoglobin (HbA1c): reflecting the average blood glucose level over the past 2–3 months. Diabetes was diagnosed if HbA1c was ≥6.5%; (4) Random Plasma Glucose: diabetes was diagnosed if random plasma glucose was ≥11.1 mmol/L (200 mg/dL) in the presence of typical symptoms (e.g. polyuria, polydipsia, weight loss).
This study was conducted in accordance with the Declaration of Helsinki and was approved by the Ethics Committee of Qilu Hospital, Shandong University. Informed consent was obtained from all the participants.
Data acquisition and dataset partitioning
Imaging was performed using a 400 kHz SS-OCTA instrument (BM400K, Beijing Top Medical Technology Co., Ltd, China) with a laser wavelength of 1060 nm, acquisition speed of 400,000 A-scans per second, and a bandwidth of 100 nm. The axial and transverse resolutions were 3.8 µm and 10 µm, respectively. Additionally, a real-time ultra-high-frequency eye-tracking system (128 Hz) was employed to avoid imaging errors caused by eye movements and subsequent motion-correction procedures. Scanning was performed centered on the macula with a set scan size of 18 mm × 18 mm. The device's built-in algorithm distinguished different vascular layers, including the vitreous layer (from the top of the retina to the inner limiting membrane (ILM)), the superficial vascular layer (from the ILM to 9 µm below the inner plexiform layer (IPL)), the deep vascular layer (from 6 µm below the IPL to 9 µm below the outer plexiform layer (OPL)), the avascular layer (from 6 µm below the OPL to Bruch's membrane (BM)), and the choriocapillaris (from BM to 29 µm below BM), resulting in a total of five layers.
The exported OCT EnFace images were uniformly sized at 1024 × 1024 pixels. Low-quality images (signal quality < 8) or misaligned images owing to capture errors were excluded. Ultimately, images from 544 eyes of 435 participants were collected, totaling 3264 images.
We also collected data on the patients’ symptoms, past medical history, smoking and drinking history, laboratory indicators, neurological examinations, and NCV tests. Additionally, OCT-based biomarkers were collected, such as retinal nerve fiber layer (RNFL) thickness, superficial capillary plexus (SCP) density, and deep capillary plexus (DCP) density. The NCV tests included the conduction velocities of the bilateral median nerve and tibial nerve. All measurements and data collection were completed by professional doctors.
Data collected after February 2024 were categorized as Dataset A (n = 267) and used to train and evaluate the DL model. Data collected before this date were categorized as Dataset B (n = 168) and used as a temporal validation dataset to evaluate the final tuned model, further validating the model's diagnostic efficacy. The two datasets were independent and did not overlap.
Network architecture design
The design of this network model employs a multimodal fusion strategy to explore the correlations between different image modalities and enhance classification performance (Figure 1). Specifically, the front end of the network consisted of feature extractors comprising multiple parallel ResNet-18 branches, each handling OCTA images from different layers. Each ResNet-18 model retained only the backbone network for feature extraction, and the final fully connected classification layer was removed. After obtaining feature vectors from different modalities using these extractors, a custom multi-head attention mechanism was applied to compute the attention between these feature vectors.
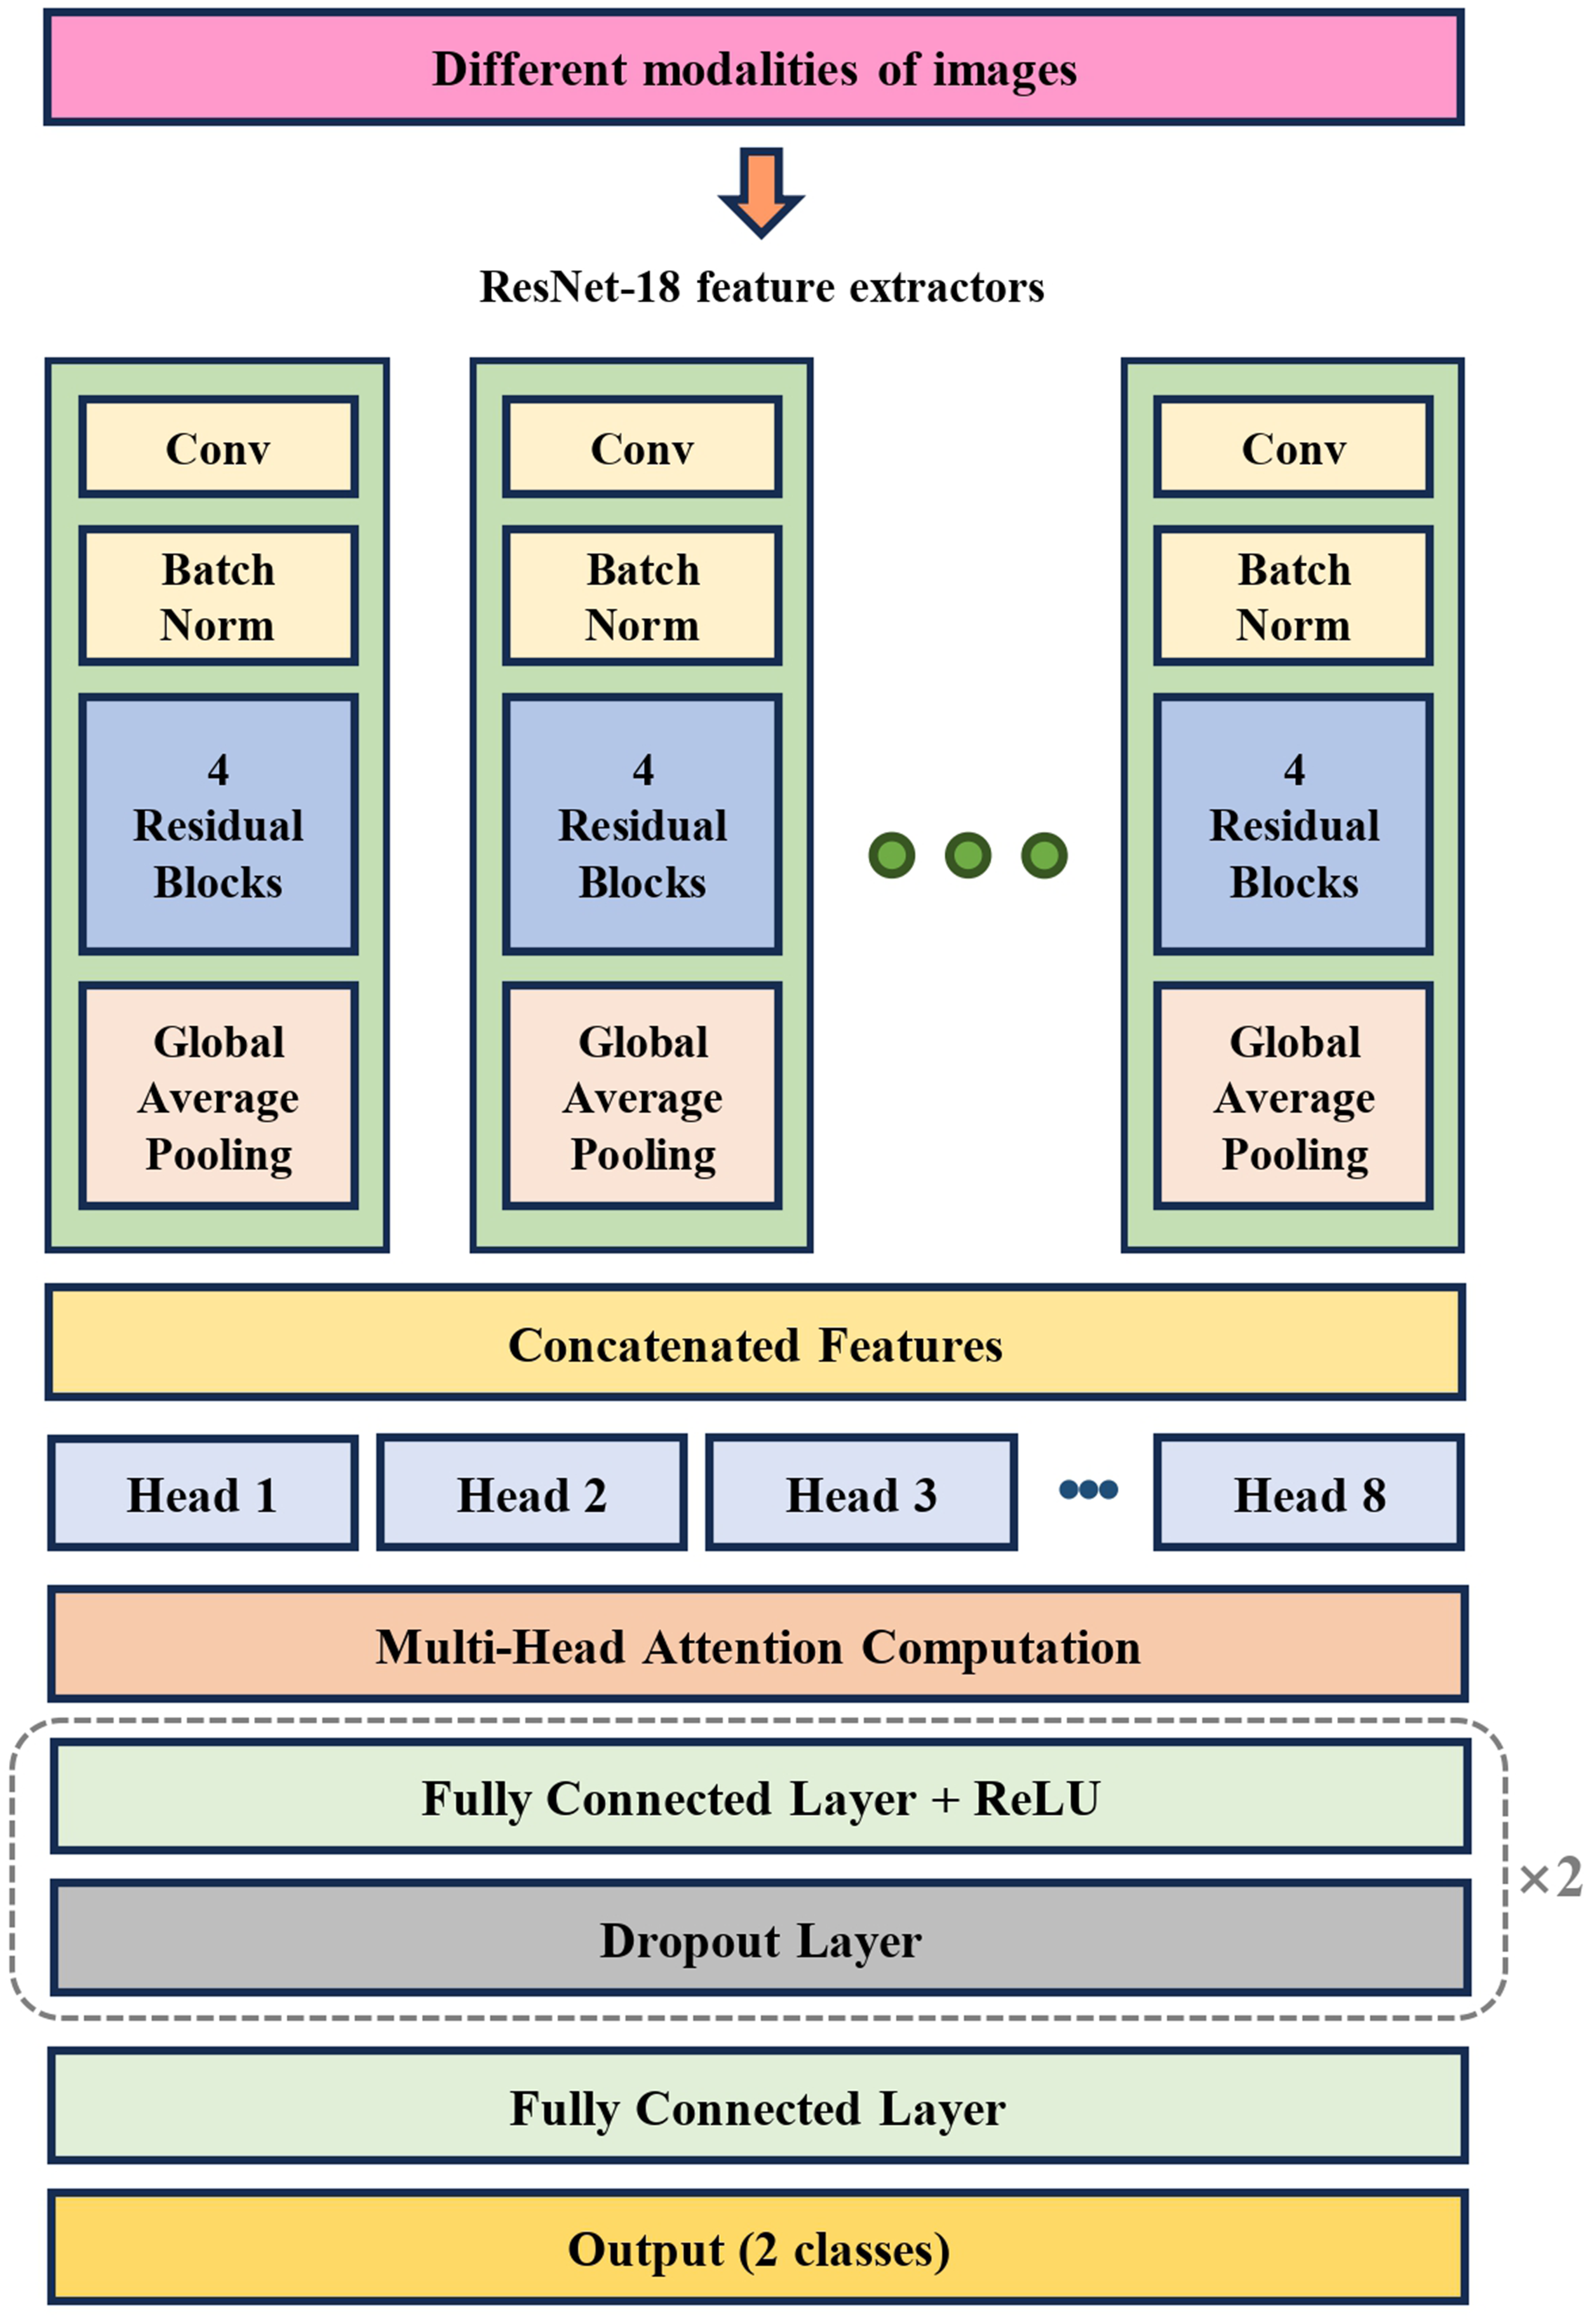
Schematic diagram of the algorithm network model used in this study.
The multi-head self-attention module contains eight attention heads, encoding the features of each modality by generating queries, keys, and values and calculating attention scores among the different modality features to capture the correlations between outcome-relevant features extracted from each modality. Using this mechanism, the self-attention module adaptively assigns weights to feature vectors from each modality, thereby enhancing its focus on key information and suppressing redundant features.
Following feature fusion, the network uses a multilayer perceptron (MLP) with three linear layers to reduce the dimensionality of the fused features and outputs predicted classifications or continuous variable results. To prevent overfitting, each fully connected layer in the MLP was followed by a dropout layer that randomly dropped neurons during training to enhance the generalization capability of the model.
Data preprocessing and model training
The ResNet feature extractor utilizes pre-trained weights from the ImageNet dataset for transfer learning, with the parameters of these layers frozen to prevent overfitting during model training, especially when the training dataset is small. Dataset A was randomly split into training, validation, and testing sets at a ratio of 3:1:1, such that 60% of the data were used for training, 20% for validation, and 20% for testing in each split. During the fivefold cross-validation, the entire dataset was split into training, validation, and testing sets at this ratio for each of the five splits, and the evaluation metrics were averaged across all five iterations to ensure robustness. Care was taken to ensure that images from the same participant's eyes were included in only one of the training, validation, or test sets.
The training set was used for model training, and the performance was evaluated using the validation set after each epoch. After training was completed, the model with the best performance on the validation set was selected for the evaluation of the test set.
Before model training, random horizontal flipping (RandomHorizontalFlip) was applied to the training images as a data-augmentation technique. The R, G, and B channels of each image were normalized using means of [0.485, 0.456, 0.406] and standard deviations of [0.229, 0.224, 0.225] to ensure consistency with the pre-trained ImageNet weights.
The Adam optimizer was employed along with a custom learning rate scheduler. Specifically, the training started with a warm-up strategy involving a gradually increasing learning rate for the first eight epochs, followed by a cosine-annealing schedule until the end of the training. The initial learning rate was set at 1e-9, reaching a peak of 5e-5 after the warm-up period. The weight decay was set at 1e-4, with a total of 120 epochs and a batch size of 16.
The model was implemented using Python 3.10, PyTorch 2.1.2 + cu121, and the training was conducted using NVIDIA RTX 4090. All codes are provided in the data availability section of this study to facilitate reproducibility.
Single-layer contrast experiment
To further investigate the retinal structural layers that could provide potential diagnostic information for DPN, we configured a ResNet-18 feature extractor with a single-layer and applied images from various OCT layers for training. Fivefold cross-validation was used to ensure consistent dataset partitioning. The evaluation metrics were calculated for each of the five validation sets, and the average values were compared.
Validation of temporal validation dataset
Dataset A was used for retraining. After completing the training, inference was performed on Dataset B, followed by the calculation of various evaluation metrics. This approach serves as an approximation of real-world studies by simulating a scenario in which the model encounters new data in practical applications. This reflects the performance and generalizability of the model in real-world applications.
Statistical analysis
The diagnostic and recognition capabilities of the DL algorithm for DPN were evaluated using the area under the receiver operating characteristic (ROC) curve (AUC). Additionally, the recall, precision, and F1-score were employed to comprehensively assess the classification performance of this binary classification task. These metrics provide different perspectives: precision measures the accuracy of the predictions, recall assesses the model's ability to identify positive cases, and the F1-score, as the harmonic mean of precision and recall, balances the tradeoff between the two. These metrics were calculated using the Metrics module in the Sklearn Library. Continuous variables were presented as mean ± standard errors and categorical variables as frequencies (percentages). For normally distributed continuous variables, intergroup differences were compared using the independent samples t-test, while the Mann–Whitney U test was applied for non-normally distributed ones. Categorical variables were compared using the chi-square test. To compare the predictive value of different retinal layers (avascular layer, SCP, DCP, vitreous layer, choriocapillaris), pairwise comparisons of AUCs were conducted using DeLong's test. In order to verify the independent predictive value of the model prediction score for DPN, a multivariate logistic regression model was constructed and all potential clinical confounding factors were adjusted. The model prediction score was scaled to a range of 0 to 100, derived from the predicted probability that ranges from 0 to 1, multiplied by 100. To assess associations between OCT-derived biomarkers (RNFL thickness, SCP and DCP density) and DPN, binary logistic regression was used to estimate odds ratios (ORs) with 95% confidence intervals (CIs), quantifying their link to DPN risk. ROC curves and corresponding AUCs were generated for each biomarker to evaluate their independent predictive performance. All statistical analyses were performed using Python 3.11, with a p-value of <0.05 considered statistically significant.
Model visualization
Gradient-weighted Class Activation Mapping (Grad-CAM) is a technique used for visualizing DL models, revealing which input regions are most important for the model's decision-making in specific predictions. Specifically, Grad-CAM works by computing the gradients of the output from the last convolutional layer of the ResNet feature extractor, and then weighting and summing these gradients to generate a class activation map. This map highlights the key regions of the input image that the model focuses on, indicating the areas that contribute the most to the classification decision. Grad-CAM was implemented using torchcam version 0.4.0.
Results
Baseline characteristics
The baseline characteristics of Dataset A are shown in Table 1, including 148 cases in the DPN group and 119 cases in the non-DPN group. The DPN group had significantly higher age, duration of diabetes, and prevalence of diabetic retinopathy (DR) than the non-DPN group, while the levels of LDL, ALT, AST, TC, and BMI in the DPN group were significantly lower than those in the non-DPN group (all p < 0.05). There were no significant differences in gender distribution, prevalence of hypertension and CVD, smoking and drinking proportions, as well as the levels of FPG, HbA1c, HDL, TG, and Scr between the two groups (all p > 0.05).
Baseline characteristics of Dataset A.

DPN: diabetic peripheral neuropathy; FPG: fasting plasma glucose.
The baseline characteristics of Dataset B are shown in Table 2, including 108 cases in the DPN group and 60 cases in the non-DPN group. The DPN group had significantly higher age, duration of diabetes, proportion of males, prevalence of DR, hypertension, CVD, and smoking proportion than the non-DPN group. FPG level was lower and Scr level was higher (all p < 0.05), while there were no significant differences in alcohol consumption, BMI, HbA1c, blood lipid indicators (HDL, LDL, TC, TG) and liver function indicators (ALT, AST) between the two groups (all p > 0.05).
Baseline characteristics of Dataset B.

Data are shown as mean ± standard errors (or percentages; p < 0.05 is considered statistically significant. Multiple imputation for missing values was performed using the random forest method. DPN: diabetic peripheral neuropathy; CVD: cardiovascular disease; BMI: body mass index; FPG: fasting plasma glucose; HbA1c: glycosylated hemoglobin; HDL: high-density lipoprotein cholesterol; LDL: low-density lipoprotein cholesterol; ALT: alanine aminotransferase; AST: aspartate aminotransferase; TC: total cholesterol; TG: triglyceride; Scr: serum creatinine.
Model performance evaluation under cross-validation
As shown in Figure 2, for the binary classification model identifying DPN, the AUC scores across the five independent test sets were 0.684, 0.730, 0.724, 0.664, and 0.793, respectively. The average AUC score was 0.719, indicating that OCTA images can be used for the identification or diagnosis of DPN. In addition, the average precision (specificity) across the five results was 69.26%, the average recall (sensitivity) was 72.34%, and the average F1 score was 0.589.

The classification performance of the model on dataset A using fivefold cross-validation.
Single-layer contrast experiment results
Next, the changes in prediction performance were compared using combinations of images from individual OCTA structural layers as inputs (Figure 3). After fivefold cross-validation, the average AUC value of the avascular layer was 0.707, indicating that it provides the most significant predictive value. The average AUCs for the SCP and DCP were 0.673 and 0.648, respectively, suggesting that these layers also held some value. The average AUCs for the vitreous layer and CC were 0.563 and 0.511, respectively, contributing little to the model performance. In addition, the DeLong's test was used to conduct pairwise comparisons of the AUC between each layer. The results are shown in Table 3. Compared with DCP (p = 0.039), Vitreous Layer (p < 0.001), and CC (p < 0.001), the AUC of the Avascular Layer was significantly different. In summary, structured images of the avascular layer contain the most critical information for diagnosing DPN.
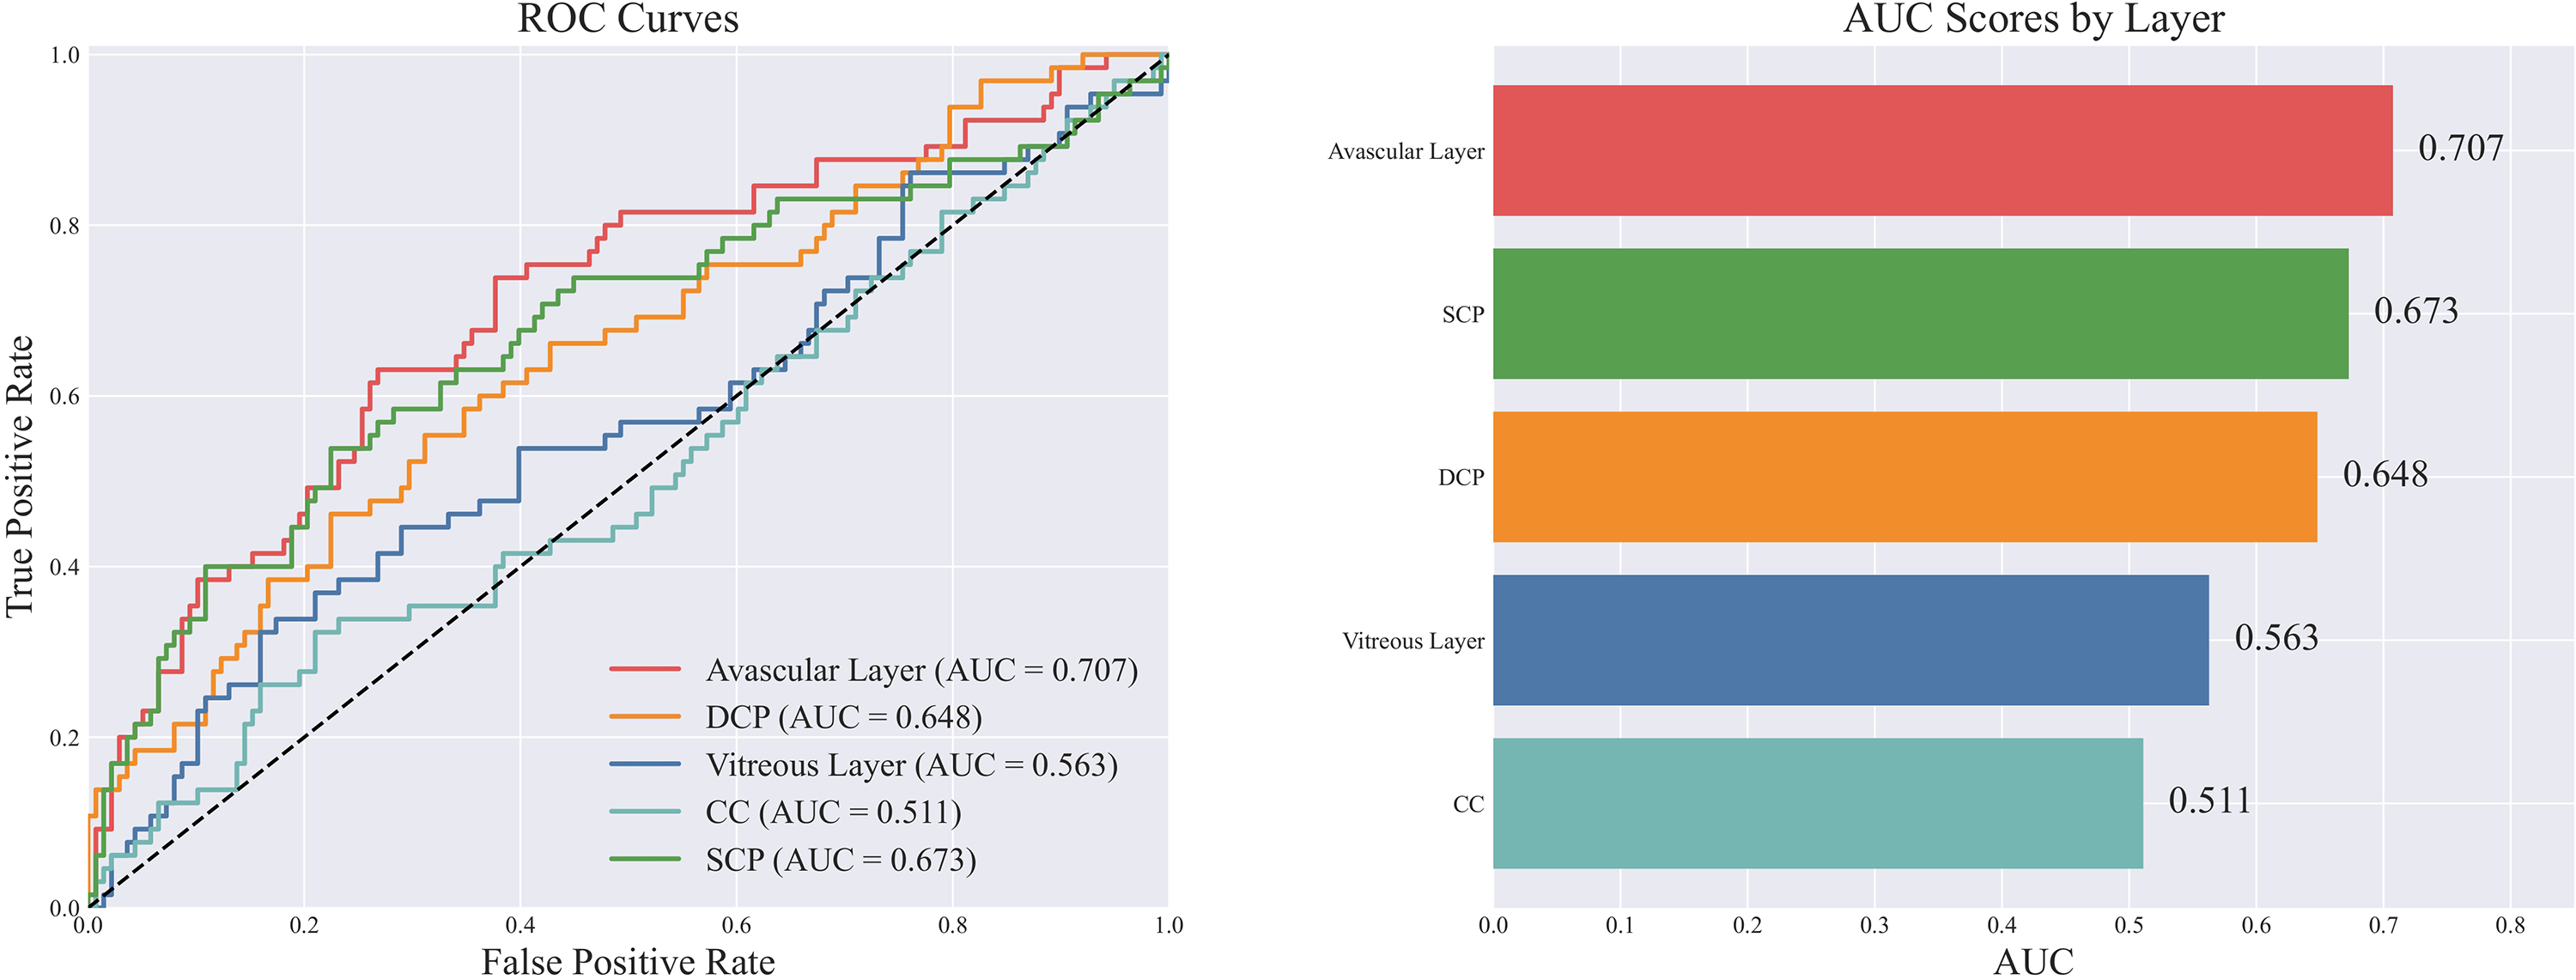
Comparison and ranking of classification performance between different layers when using only a single layer of images.
Comparison of area under the curves of different layers using the DeLong's test.

SCP: superficial capillary plexus; DCP: deep capillary plexus.
Final evaluation of the temporal validation dataset
Finally, after the training on Dataset A was completed, the inference results on Dataset B showed an AUC of 0.721, indicating an improvement compared to the previous results, likely owing to the increased sample size used for training (Figure 4). The precision (specificity) and recall (sensitivity) were 68.11%, 70.83%, and the F1 score was 0.507. In addition, in order to verify the independent predictive value of the prediction score of the DL model for DPN, a multivariate logistic regression model was constructed by incorporating potentially confounding clinical characteristics such as age, diabetes duration, and glycosylated hemoglobin (HbA1c) into the adjustment factors. As shown in Table 4, after adjusting for all confounding factors, the prediction score of the model was still an independent risk factor for DPN (OR = 1.05, 95%CI: 1.03–1.07, p < 0.001), suggesting that the diagnostic value of the multi-head attention DL model for DPN was independent of the above clinical baseline characteristics.

The classification performance of the model on the temporal validation Dataset B.
The correlation between model prediction score and DPN.
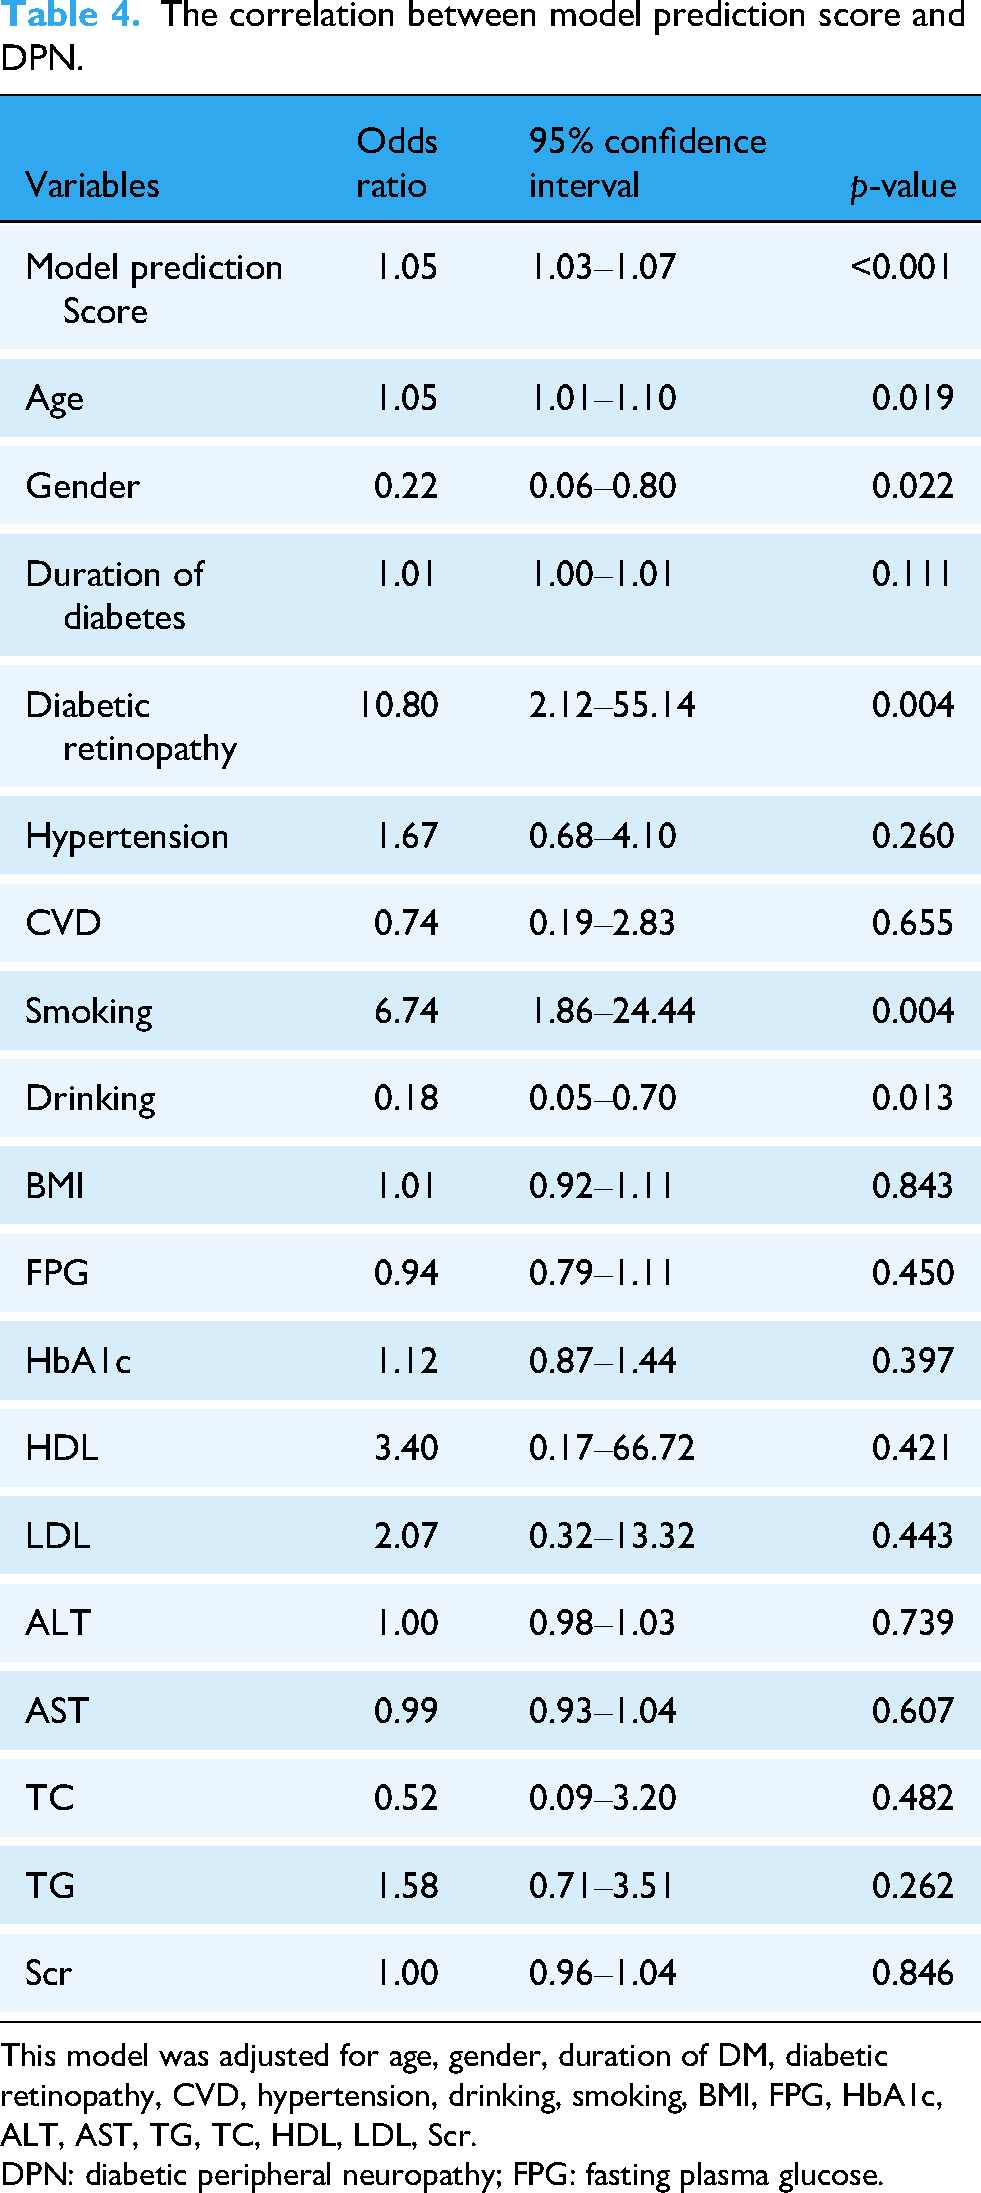
This model was adjusted for age, gender, duration of DM, diabetic retinopathy, CVD, hypertension, drinking, smoking, BMI, FPG, HbA1c, ALT, AST, TG, TC, HDL, LDL, Scr.
DPN: diabetic peripheral neuropathy; FPG: fasting plasma glucose.
Feature exploration
The last layer of the ResNet feature extractor, corresponding to the avascular layer images, was selected as the target layer for Grad-CAM. Representative images are shown in Figure 5. By comparing the gradient-weighted class activation heat maps with the original images, we observed that the model captured relatively darker regions within the avascular layer. When mapped to the corresponding OCT longitudinal sectional images, that is, the A-scan (single-depth scan), a noticeable defect in the photoreceptor cells was observed in this region. Therefore, photoreceptor cell defects are a part of the basis for the model's decision-making in diagnosing DPN, suggesting that abnormalities in photoreceptor cells may be markers for the onset of DPN.
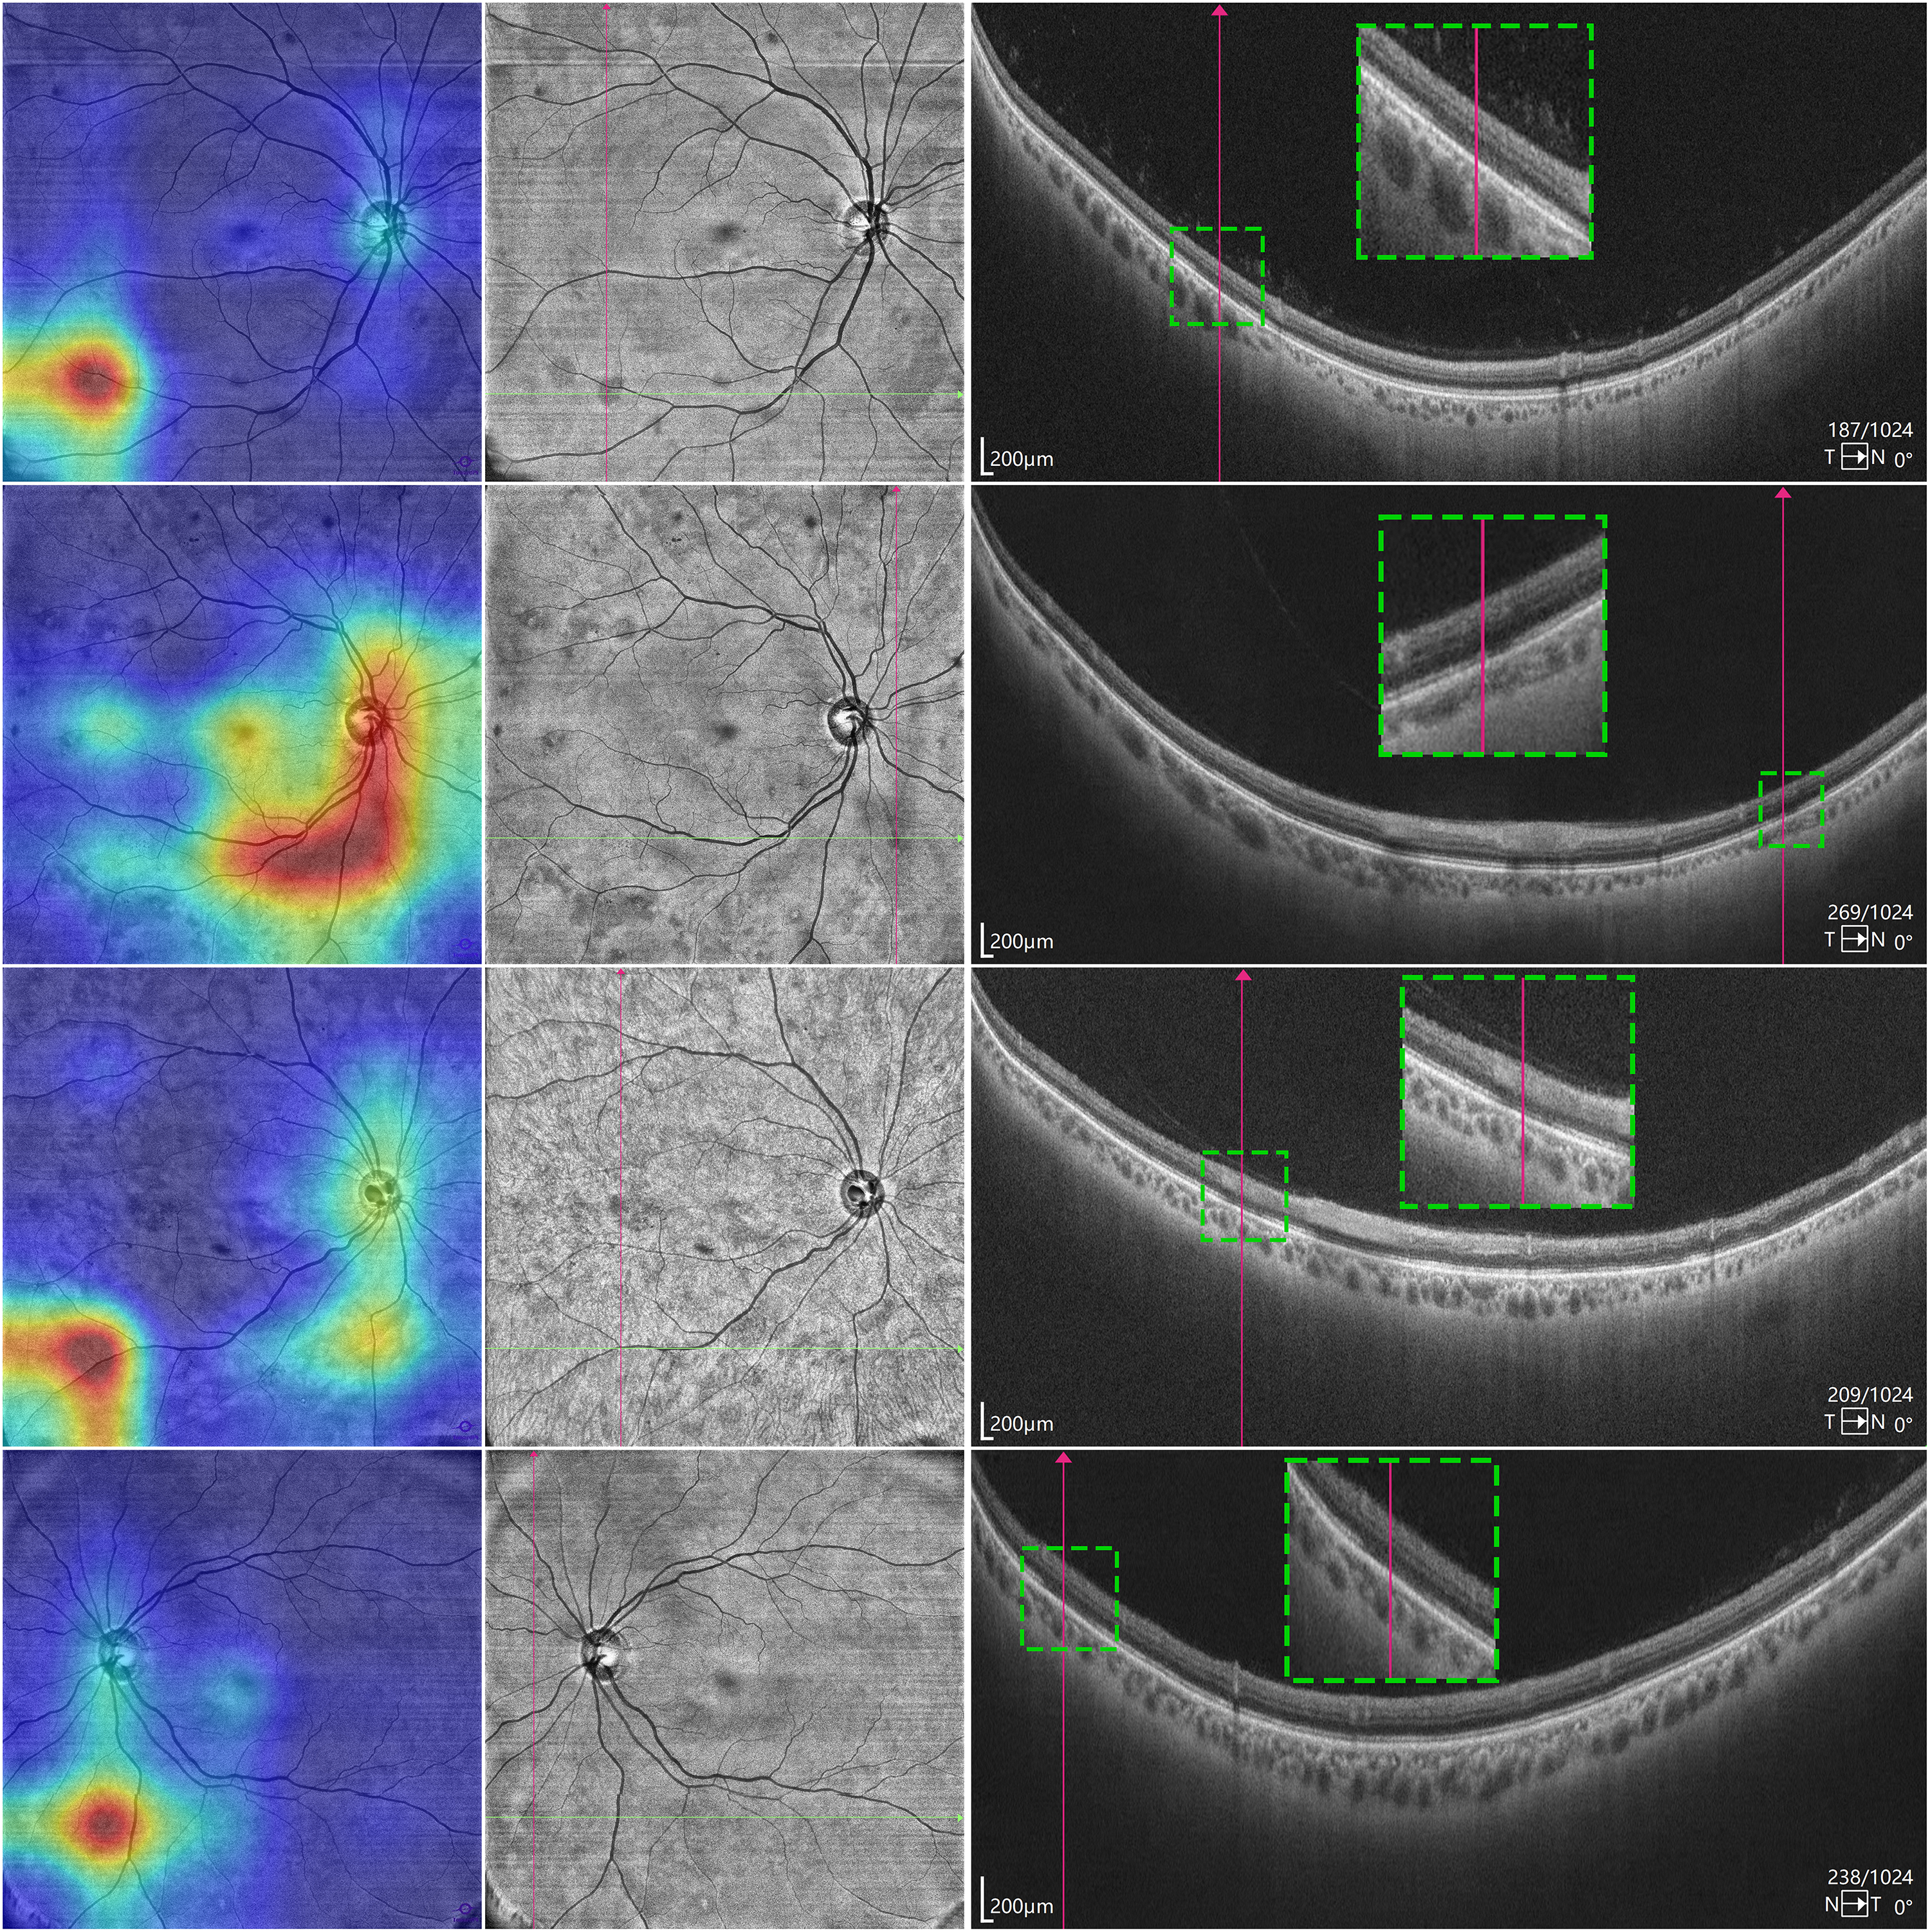
Visualization of photoreceptor defects using Grad-CAM heat maps and OCT imaging. The leftmost image in each row shows the original image overlaid with the heat map generated by Grad-CAM. The red highlighted is the basis for the model's classification decisions. The middle image in each row is an OCT Enface image of the avascular layer of the retina, with crossed lines marking dark areas, which may be areas of photoreceptor cell defects. The rightmost image in each row is the OCT A-scan image of the corresponding position, and it was found that there is indeed a defect in the photoreceptor cells at the corresponding position. OCT: optical coherence tomography; Grad-CAM: Gradient-weighted Class Activation Mapping.
Performance comparison
We analyzed the predictive efficacy of individual retinal indicators (RNFL thickness, SCP/DCP density) for DPN using logistic regression and ROC curves (Table 5, Figure 6). RNFL thickness (OR = 0.99, p = 0.365) and SCP density (OR = 1.02, p = 0.298) showed no significant correlation with DPN, while DCP density was weakly negatively correlated (OR = 0.95, 95% CI:0.92–0.99, p = 0.008). The AUC of RNFL, SCP, and DCP were 0.524, 0.549, and 0.565 (all close to random guessing, AUC = 0.5), notably lower than our model's performance (fivefold cross-validation AUC = 0.719; temporal validation Dataset AUC = 0.721), indicating the model outperformed all single indicators.
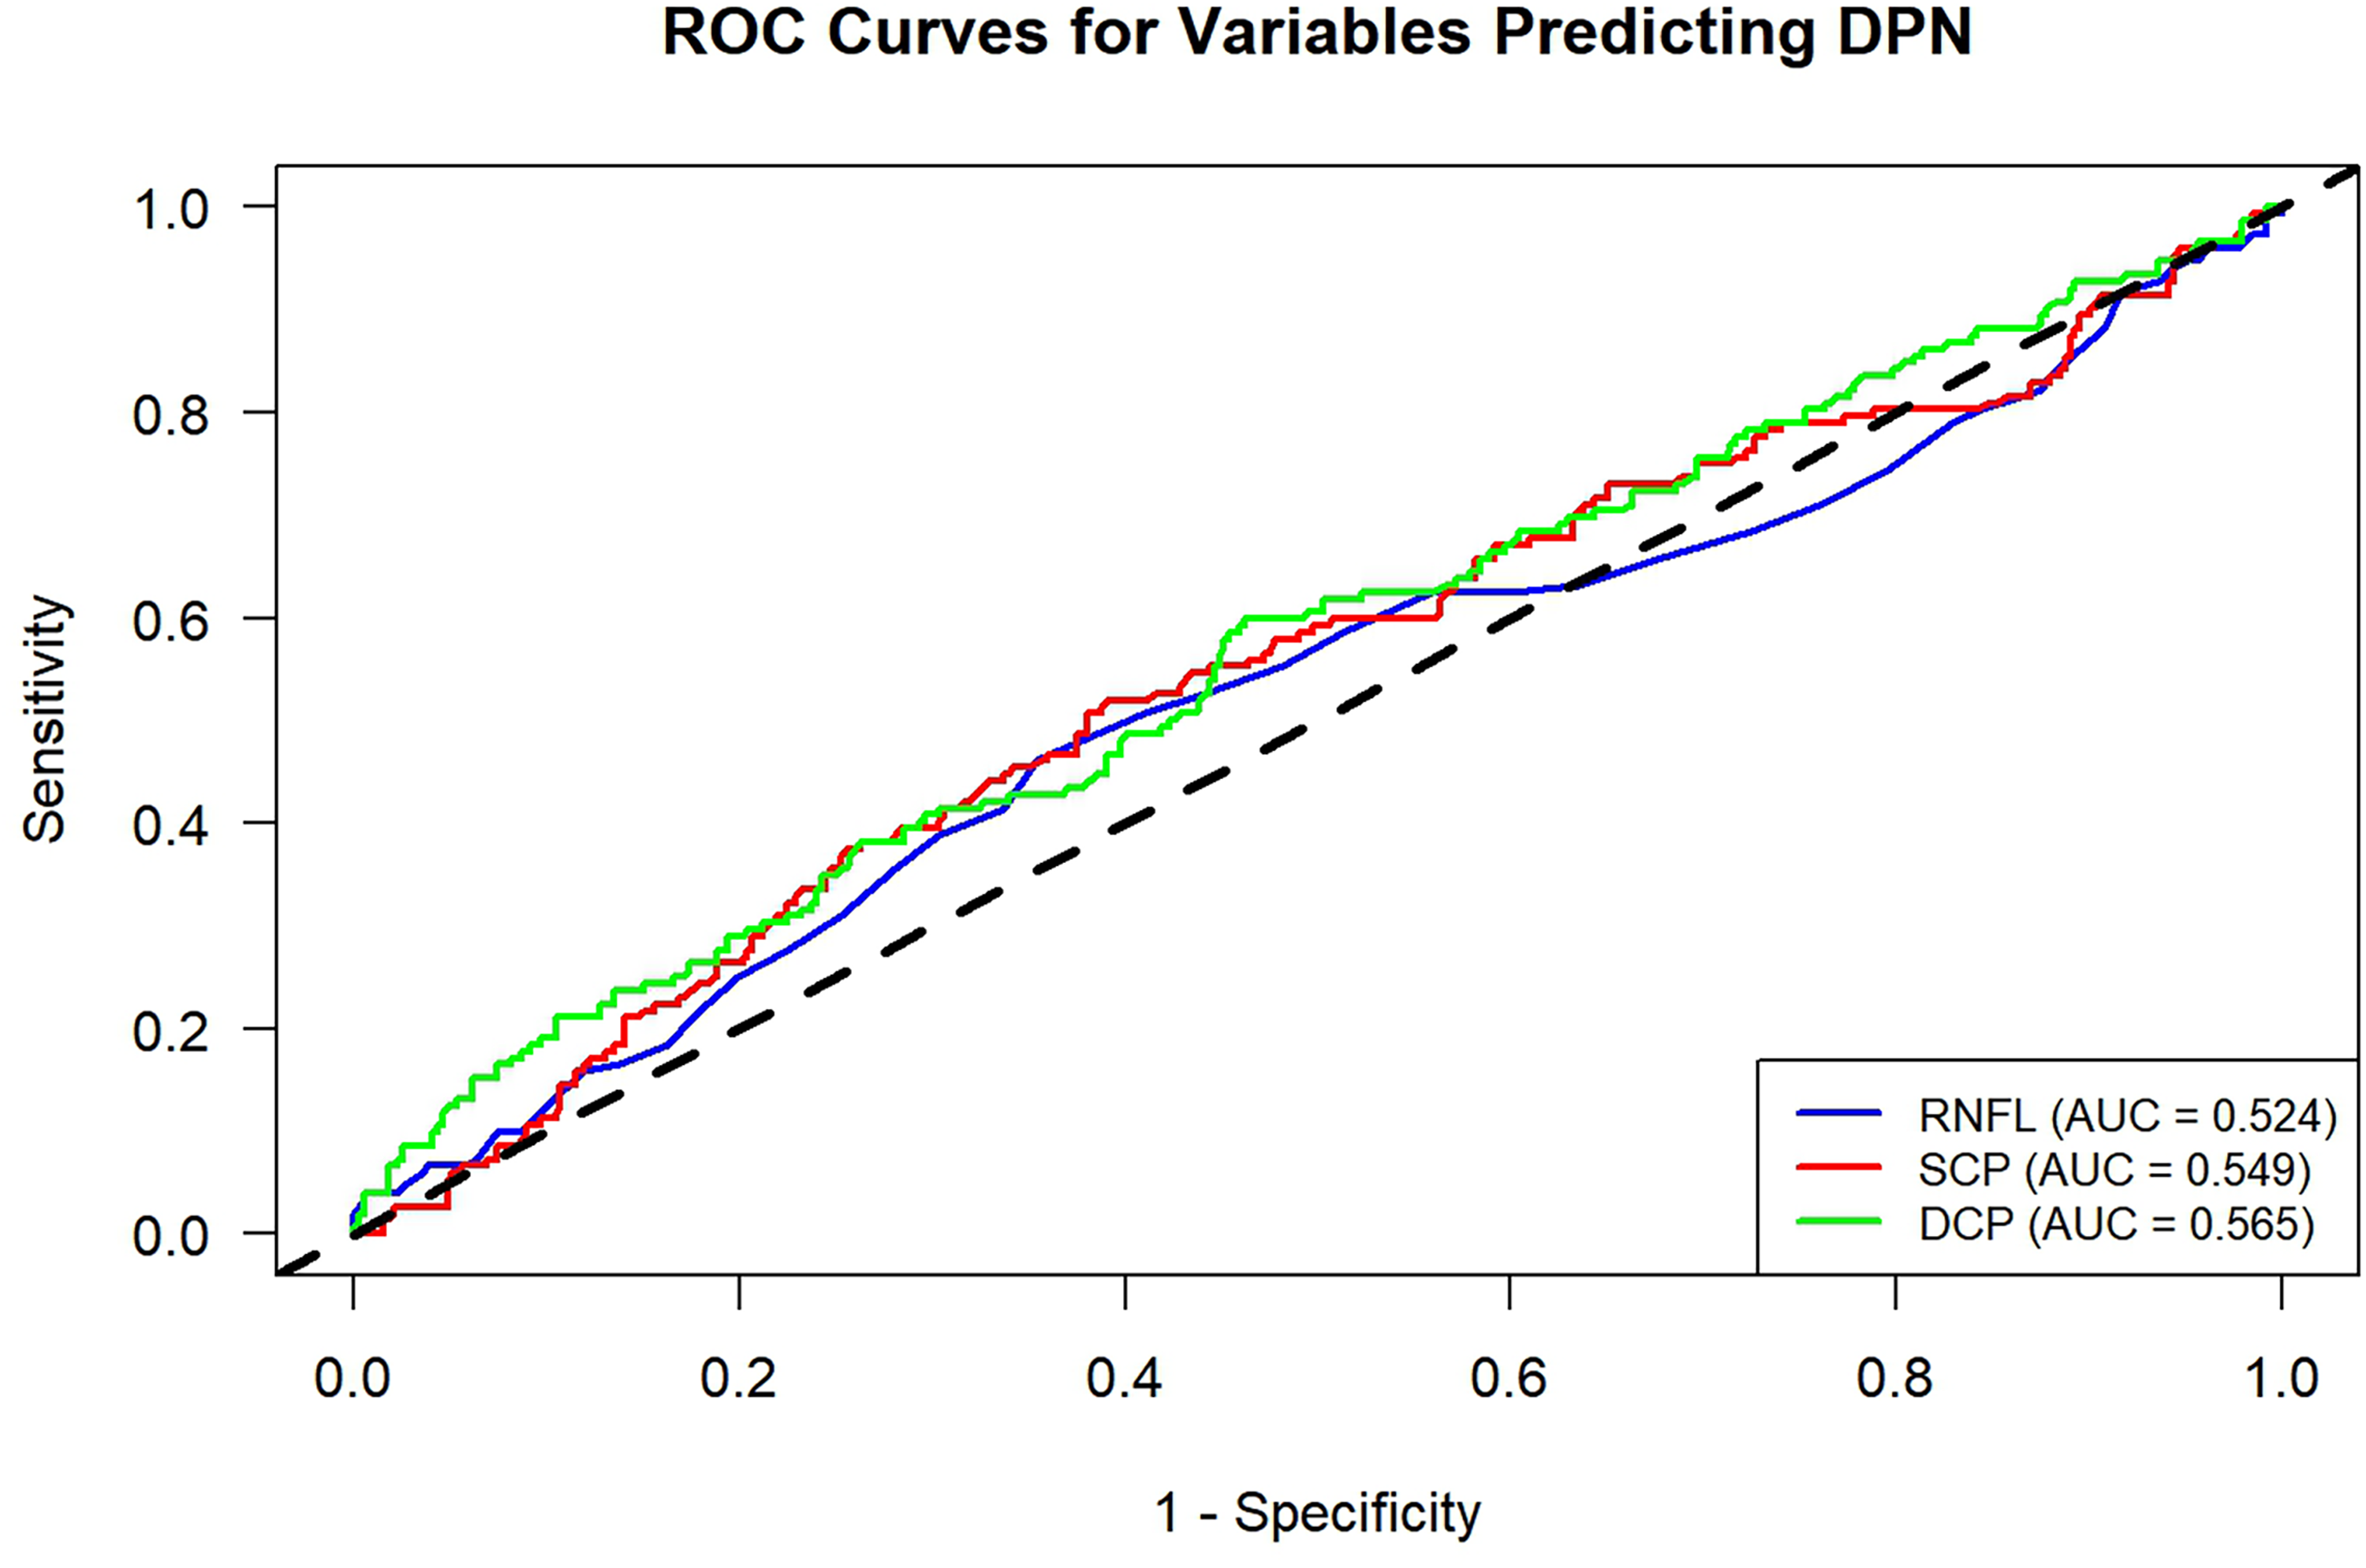
ROC curves for RNFL, SCP, and DCP prediction of DPN. DPN: diabetic peripheral neuropathy; RNFL: retinal nerve fiber layer; SCP: superficial capillary plexus; DCP: deep capillary plexus; ROC: receiver operating characteristic.
The correlation between RNFL, SCP, DCP, and DPN.

DPN: diabetic peripheral neuropathy; RNFL: retinal nerve fiber layer; SCP: superficial capillary plexus; DCP: deep capillary plexus.
Discussion
This study evaluated the capability of OCT in identifying DPN. Using facial images captured by OCT devices with a large field of view (18 mm × 18 mm), a convolutional neural network model with multi-head attention mechanisms was able to recognize the presence of DPN to a certain extent. Through a layer-by-layer analysis of the various OCT structural layers, we found that avascular layer images provided the most valuable information for DPN identification. Finally, after analyzing the features of each image group, we observed that photoreceptor cell degeneration may indicate the presence of DPN. In conclusion, we proposed a novel method for identifying or diagnosing DPN and demonstrated the significant potential of DL algorithms for this task.
We designed a neural network model for processing multimodal OCT images that combines a ResNet feature extractor with a multi-head attention mechanism for classifying DPN. The model design adopts a mid-fusion strategy, where information from each layer is combined after feature extraction and then fed into subsequent multi-head attention layers and a MLP. A study utilizing convolutional neural networks (EfficientNet) for diagnosing DR through OCTA images evaluated the performance of classifiers using single-layer inputs and multilayer fusion architectures, including early, mid, and late fusion strategies, and found that mid-fusion was the optimal approach. 20 Similarly, another study used a convolutional neural network (VGGNet) with an ensemble learning strategy to diagnose DR using OCTA images. 21 The ensemble learning approach, akin to a late fusion strategy, also demonstrated superior performance compared with models handling single-modality images. In conclusion, for multimodal image-processing tasks, adopting an appropriate feature fusion method can improve performance.
A key finding from our single-layer contrast experiments—validated by DeLong's test–is that the avascular layer outperforms other retinal layers in DPN prediction (average AUC = 0.707). Pairwise comparisons showed significant AUC differences between the avascular layer and the DCP (p = 0.039), vitreous layer (p < 0.001), and choriocapillaris (CC, p < 0.001), confirming its unique diagnostic value for DPN. No significant difference was observed with the SCP (p = 0.23), suggesting SCP may carry partial but less robust predictive value. This layer-specific superiority aligns with the avascular layer's role as the primary location of photoreceptor cells, which are highly sensitive to diabetes-induced metabolic and microvascular impairments.22,23 DeLong's test results further highlight that retinal layers contribute unequally to DPN diagnosis, underscoring the importance of targeting key structural layers in OCT-based diagnostic tool development.
A striking disparity emerges when comparing our model's predictive performance with traditional OCT-derived biomarkers. Logistic regression and ROC analyses revealed weak discriminative power for DPN in RNFL thickness (AUC = 0.524), SCP density (AUC = 0.549), and DCP density (AUC = 0.565)—all AUCs close to the random-guessing threshold of 0.5. Even DCP density, which showed a significant negative correlation with DPN (OR = 0.95, 95% CI:0.92–0.99, p = 0.008), lacked clinically meaningful predictive accuracy. In contrast, our multi-head attention model achieved an average AUC of 0.719 in fivefold cross-validation and 0.721 on the temporal validation dataset, with substantially improved performance. This superiority stems from integrating multimodal layer information (vs. single biomarkers) and the attention mechanism's ability to capture inter-layer correlations and prioritize critical avascular layer features (e.g. photoreceptor defects)—details missed by traditional thickness/density metrics. Conventional OCT biomarkers fail to reflect the complex retinal structural changes in DPN, while our model's layer-specific feature extraction and fusion offer a more comprehensive, sensitive approach.
Our study clearly identified through Grad-CAM visualization that the model's classification decisions for DPN primarily focus on specific regions of the avascular layer—these regions appear as dark areas in OCT Enface images, and their correspondence to photoreceptor cell defects is confirmed in OCT A-scan longitudinal cross-sectional images. This finding provides direct imaging evidence for the association between photoreceptor abnormalities and DPN, rather than mere theoretical speculation. Studies have shown that photoreceptor cell function may be impaired in patients with diabetes. 22 Physiologically, both photoreceptors and peripheral nerves are high-metabolic, long-projecting neural tissues, and they face common damage risks in the diabetic pathological microenvironment: hyperglycemia-induced oxidative stress directly impairs the stability of nerve cell membranes23–25; diabetes-related chronic inflammation increases the levels of inflammatory factors in the retina, further exacerbating photoreceptor damage 23 ; meanwhile, diabetic microvascular lesions not only lead to insufficient blood supply to peripheral nerves but also affect the nutrient supply from the choriocapillaris to photoreceptors,26,27 forming a parallel pathological state of “ischemic malnutrition.” Additionally, impairments in neurotrophic factor signaling pathways (e.g. BDNF, NGF) may constitute a shared neurodegenerative mechanism,28,29 further explaining why retinal photoreceptor defects can indirectly reflect the pathological conditions of peripheral nerves. In summary, retinal photoreceptor defects are not isolated ocular structural abnormalities but more likely a “window manifestation” of systemic neuro-microvascular damage caused by diabetes, exhibiting a synchronous pathological association with the occurrence and development of DPN. However, whether there is a causal relationship between the two and whether photoreceptor defects precede the onset of clinical DPN symptoms require further verification through subsequent longitudinal cohort studies.
Previous studies utilizing OCT for DPN prediction have primarily focused on longitudinal images obtained from A-scans. A 4-year longitudinal study demonstrated that retinal thickness was a significant predictor of DPN onset. 30 Another study applied DL methods to semantically segment OCTA blood flow images to calculate vessel length density and found that reduced macular microvascular density was associated with DPN. 31 Some studies argue that DPN should not be considered an isolated neurological disease, 32 as corneal nerve parameters identified through confocal microscopy have been shown to be excellent diagnostic markers for DPN, comparable to skin biopsy. 33 Although the CCM examination is non-invasive, our experience shows that it causes significant discomfort to patients, leading to poor compliance. Similarly, electrophysiological assessments, while precise and objective, cannot evaluate small fiber damage, and also cause discomfort to patients. OCT, however, is quick and efficient, and most importantly, does not cause any discomfort to the subjects. As a routine examination for patients with diabetes, OCT results can help identify the possibility of DPN, allowing targeted screening for high-risk individuals, thus improving patient experience and reducing medical resource waste.
Test set predictions revealed a notable rate of false positives, with 52 non-DPN samples misclassified as DPN; this represents a key practical concern, as such misclassification may induce unnecessary patient anxiety, prompt referrals for invasive confirmatory assessments (e.g. nerve conduction studies, skin biopsies), and increase healthcare expenditures—outcomes that counteract the study's goals of enhancing patient experience and optimizing resource utilization, thus highlighting the need for further model refinement. By contrast, only 14 DPN samples were misclassified as NDPN, resulting in a low false negative rate. This aligns with the primary objective of DPN screening, which prioritizes early detection and intervention. In future iterations, integrating the model with key clinical variables (e.g. diabetes duration, glycated hemoglobin levels) could enable flexible adjustment of the prediction threshold, thereby reducing unnecessary clinical referrals while preserving high sensitivity for DPN detection. For clinical applicability, the model's diagnostic threshold can be tailored to specific medical scenarios to balance sensitivity and specificity: for large-scale population-based DPN screening, the threshold can be appropriately lowered to further reduce false negatives.
This study has several limitations. First, as a cross-sectional study, the model's ability to predict DPN development was not evaluated, and the relationship between photoreceptor damage and DPN observed via Grad-CAM is speculative and does not imply a causal relationship, which requires further investigation in future longitudinal studies. Second, while Grad-CAM enabled rough localization of photoreceptor defect areas—with most lesions in peripheral retinal regions undetectable by earlier small-field OCT/OCTA devices—and works by computing the model output gradient relative to the last convolutional layer's feature map to gauge classification contributions, repeated convolution and pooling operations drastically reduce the output feature map resolution, resulting in coarse heat maps and necessitating more precise semantic segmentation models for accurate identification and quantification of these target regions in future research. Additionally, due to issues with image acquisition and examination procedures, some low-quality images were excluded, potentially introducing a degree of statistical selection bias. Finally, the sample size was relatively small for training a DL model, and Dataset B served only as a temporal validation dataset from the same clinical center, rather than a true external independent validation cohort. This single-center design with a limited sample size not only restricts the external validity and generalizability of the model but also limits the applicability of the proposed threshold adjustment strategy. To address these limitations, future research should adopt a multi-center study design with larger, more demographically diverse samples; this will enable verification of the model's performance across different patient populations and clinical institutions, as well as further validation and calibration of the optimal diagnostic threshold range for the model in distinct healthcare settings.
Conclusion
The multi-head attention DL model constructed in this study achieves non-invasive identification of DPN based on enface OCT images from multiple retinal layers (AUC = 0.721). Among these layers, the avascular layer serves as the key source of information, and photoreceptor defects may act as a potential biomarker for DPN. This approach provides a novel clinical tool for the early screening of DPN in diabetic patients. Subsequent longitudinal cohort studies are required to validate its predictive value and the causal relationship of the proposed biomarker.
Footnotes
Acknowledgements
We would like to thank Editage (![]() ) for the English language editing. This study was supported by the Jinan Clinical Research Center for Endocrine and Metabolic Diseases.
) for the English language editing. This study was supported by the Jinan Clinical Research Center for Endocrine and Metabolic Diseases.
This study was funded by the National Key Research and Development Program of China (2023YFA1801100, 2023YFA1801104) and Taishan Scholars Program of Shandong Province (Grant No. tstp20231250). The funders played no role in study design, data collection, analysis and interpretation of data, or the writing of this manuscript.
Ethics approval and consent to participate
This study was approved by the Ethics Committee of Qilu Hospital of Shandong University (IRB approval number: KYLL-202311-026). Written informed consent was obtained from all participants prior to the initiation of the study at their respective institutions. This study was conducted in accordance with the principles of the Declaration of Helsinki.
Consent for publication
Not applicable.
Authors’ contributions
XH was responsible for the project conceptualization, supervision, funding, and manuscript review. QQ was responsible for the manuscript writing, statistical analysis, and part of the coding. ZY was responsible for the algorithm model design and training as well as part of the coding. NH was responsible for formal analysis, data curation, validation, and writing—review & editing. LC provided the computational resources. All authors read and approved the final manuscript.
Funding
The authors disclosed receipt of the following financial support for the research, authorship, and/or publication of this article: This work was supported by the National Key Research and Development Program of China (Grant Nos. 2023YFA1801100 and 2023YFA1801104), the Key R&D Program of Shandong Province, China, the Taishan Scholars Program of Shandong Province (Grant No. tstp20231250), and the Science and Technology Research Project of the China Science and Technology Development Center for Traditional Chinese Medicine.
Declaration of conflicting interests
The authors declared no potential conflicts of interest with respect to the research, authorship, and/or publication of this article.
Data availability
Data supporting the analyses in this study are available from the corresponding author upon reasonable request.