
Abstract
Objectives
Infarct volumes on diffusion-weighted imaging (DWI) are critical for predicting stroke outcomes and guiding late-window endovascular thrombectomy. Although 3D U-Net-based deep learning achieves high sensitivity, it often yields false positives due to infarct mimics. We developed a SegMamba-based model to enhance global volumetric feature extraction and compared both approaches on a dataset encompassing multiple DWI hyperintense pathologies.
Methods
Two models were trained on a multicenter dataset of 10,820 DWI scans (2011–2014) and evaluated against manual segmentation on an external test set of 2731 fresh DWI scans. Diagnostic accuracy was assessed in a clinical cohort of 1194 patients from a different center (2017–2020) who underwent DWI for various indications. We compared the models using the Dice similarity coefficient (DSC), average Hausdorff distance (AHD), sensitivity, and specificity.
Results
The training, external test, and clinical test datasets had mean (SD) ages of 67.9 (12.8), 68.2 (12.7), and 63.9 (15.4) years, with 58.9%, 60.4%, and 58.1% male, respectively. In the external test dataset, SegMamba and U-Net achieved similar DSC (0.786 vs 0.785; p = 0.141), but SegMamba outperformed U-Net in AHD (1.25 mm vs 1.76 mm; p < 0.001). In the clinical dataset, SegMamba showed slightly lower sensitivity (96.97% vs 98.79%) but substantially higher specificity (58.80% vs 29.54%), resulting in higher overall accuracy (64.07% vs 39.11%; p < 0.001).
Conclusions
Changing the main architecture of the segmentation model alone maintained segmentation performance within ischemic-stroke cohorts, while achieving better classification in broader disease populations. This study highlights the need for deep-learning models to be validated not only for segmentation performance within target disease cohorts but also across diverse clinical environments to ensure practical utility.
Keywords
Introduction
Diffusion-weighted imaging (DWI) is highly sensitive for the early detection of acute ischemic stroke (AIS). 1 Infarct volumes measured on DWI correlate with unfavorable stroke outcomes and are critical for guiding modern treatment decisions.2–5 Despite its vital role, manual segmentation of infarcts is time-consuming and subject to inter-rater variability.
To address this, deep learning models, most commonly based on the U-Net architecture, have demonstrated strong segmentation performance using DWI.6–9 However, this laboratory-level performance, often reported in studies, frequently fails to translate to real-world clinical utility. This translational gap stems from two critical limitations in how these models are typically validated. First, performance is often assessed using only the Dice similarity coefficient (DSC), which can be biased by lesion size. Second, and more importantly, as found in recent systematic review, models are almost exclusively validated on pre-selected, stroke-only cohorts. 10 This idealized setting ignores the diagnostic uncertainty of routine practice, where models must distinguish true infarcts from numerous mimics. Consequently, these models often generate frequent false positives in real-world application, imposing a significant burden on clinicians.
To address these limitations, we designed an experimental study using SegMamba, a recently introduced framework that extends U-Net architectures by incorporating state-space modeling to better capture long-range contextual information. 11 This architectural difference provided a valuable opportunity to explore whether a model with a more global view could better address the key clinical challenge of false positives. We therefore compared the two architectures with two complementary aims. First, we externally validated segmentation performance against expert manual segmentations using both the DSC and the average Hausdorff distance (AHD). Second, we assessed diagnostic accuracy in an unfiltered, real-world emergency department cohort of 1194 patients with mixed stroke and non-stroke pathologies to evaluate practical clinical applicability. To our knowledge, this is the first large-scale study to evaluate an AIS segmentation model in a real-world setting including non-stroke populations, while also introducing a Mamba-based architecture as an alternative to the widely adopted U-Net framework.
Materials and methods
Participants
Training dataset
For the training dataset, we utilized 12,013 AIS or transient ischemic attack (TIA) patients who had been previously enrolled in the Korean nationwide image-based stroke database project between 2011 and 2014.12,13 We excluded patients with MRI contraindications (n = 258), suboptimal image quality (n = 78), absence of DWI (n = 826), and image processing errors (n = 31). Following these exclusions, the remaining 10,820 patients were partitioned in an 8:2 ratio into a training and validation dataset (n = 8661) and an internal test dataset (n = 2159) for SegMamba-based algorithm (Figure 1).

Study flow chart.
External test dataset
To evaluate the segmentation performance of both 3D U-Net- and SegMamba-based algorithms in ischemic stroke patients, we utilized 2857 DWI scans from AIS or TIA patients who had been enrolled in our previous study from a comprehensive stroke center between 2011 and 2014. 14 For this study, we excluded patients with imaging-negative TIA (n = 80) and those with insufficient MRI tag information (n = 46). After these exclusions, 2731 patients remained available for external testing (Figure 1).
Clinical test dataset
For clinical testing, we consecutively enrolled 1194 patients who underwent brain DWI at the emergency department from another tertiary university hospital from 2017 to 2020. Inclusion criteria encompassed patients presenting with neurological symptoms, irrespective of their diagnosis (Figure 1).
Algorithm development
Infarct segmentation for training and external test dataset
Ischemic lesions on DWI for the training and external test datasets were segmented using the in-house software Image_QNA, with all work supervised by an experienced vascular neurologist (W-S. Ryu).12,13 The ground truth was established using a semi-automated workflow. First, an operator manually delineated a region of interest around the hyperintense lesion on DWI (b1000) images. Next, the operator selected representative pixels within the lesion, which served as seeds for Image_QNA's threshold-based “smart region selection” algorithm. This tool automatically generated an initial segmentation mask of all connected voxels with similar signal intensities. Finally, this initial mask was manually refined by the operator, who added or removed voxels as needed to ensure the final boundaries accurately matched the true extent of the ischemic lesion. This detailed segmentation methodology and the Image_QNA software have been described in previous reports.15,16
Image preprocessing
To train SegMamba-based algorithm, b1000 images were preprocessed by skull stripping using Otsu's threshold and N4 bias correction. For normalization, we adjusted image signals to fit between 0 and 255 and applied z-score normalization.
SegMamba-based and U-Net-based algorithms development
The SegMamba-based algorithm was developed by integrating the state-space model (Mamba) architecture with traditional convolutional neural network components, building upon the documented architecture. 11 The network's encoder adopted the Mamba architecture as its foundational framework, leveraging its sequential modeling capabilities for processing volumetric medical imaging data. 17 The initial input layer processed 3D volumes through a stem layer comprising a depth-wise convolution with a 7 × 7 × 7 kernel size, 3 × 3 × 3 padding, and 2 × 2 × 2 stride, converting the input volume into initial feature representations.
To enhance feature extraction, two specialized modules were implemented (Figure 2). The first was the Gated Spatial Convolution (GSC) Block, which employed dual convolutional pathways with kernel sizes of 3 × 3 × 3 and 1 × 1 × 1. This block incorporated normalization layers and nonlinear activations, implementing a multiplicative gating mechanism to control information flow. The GSC Block utilized residual connections to preserve spatial contextual information while maintaining efficiency.

Detailed architecture of SegMamba-based algorithm.
The second module was the Tri-orientated Spatial Mamba (TSMamba) Block, which processed features along three orientations: forward direction for sequential processing along the primary axis, reverse direction for backward processing, and inter-slice direction for cross-sectional feature integration. Each orientation stream employed selective state space modeling, and features from all orientations were fused through adaptive weighting. The TSMamba Block implemented skip connections to facilitate gradient flow.
The decoder pathway followed the conventional 3D U-Net architecture with several enhancements, including progressive upsampling through transposed convolutions and feature-level uncertainty estimation in skip connections to filter multi-scale features. The architecture implemented hierarchical feature fusion at multiple resolution levels and includes a final segmentation head with softmax activation for multi-class prediction. The network was trained end-to-end using a combination of losses, including cross-entropy loss for semantic segmentation, Dice loss for boundary refinement, and deep supervision at intermediate levels.
For the details of the development of 3D U-Net-based algorithms, refer to our previous study. 14
Data augmentation
The input images were resized to a standardized dimension of 256 × 256 pixels, followed by random scaling with factors between 0.9 and 1.1. Geometric transformations included pseudo-2D rotations with angles ranging from −30 to 30 degrees (probability 0.3), random flips along each axis (probability 0.2), and 90-degree rotations (probability 0.2). The pipeline also incorporated intensity transformations such as Gaussian noise (probability 0.1), Gaussian blur, and random gamma adjustments. All images were normalized and underwent non-empty mask-based cropping to ensure the presence of relevant features, and these augmentation strategies were applied to mitigate overfitting and improve generalizability.
Model training
All models were trained on six NVIDIA A6000 GPUs using distributed data parallel. A batch size of 10 per GPU was used, resulting in a total batch size of 60. The input consisted of DWI patches with dimensions of 256 × 256 × 20. Optimization was performed using the AdamW optimizer with an initial learning rate of 1 × 10⁻⁴. A linear warm-up cosine annealing schedule was applied over 100 epochs. The loss function combined Dice loss and cross-entropy loss, and deep supervision was incorporated to enhance stable training. Validation was conducted every 25 epochs, and models were saved only when performance improved, thereby preventing overfitting and ensuring selection of the optimal model.
Algorithm evaluation of segmentation performance
For external test dataset, the following metrics were used to evaluate segmentation performance of both algorithms. Additionally, we evaluated the algorithms’ performance under various clinical conditions. Volumetric analysis was assessed for infarct volumes of less than 3 and 5 mL, while DSC and AHD were examined for infarct volumes of less than 1, 3, and 5 mL.
Coefficient of determination (equation 1)

Concordance correlation coefficient (CCC; equation 2) X = algorithm segmentation volume Y = manual segmentation volume

DSC (equation (3))

AHD (equation (4))

Ground truth establishment for clinical test dataset
Experienced stroke neurologists (H. Kim and W-S Ryu) reviewed formal neuroradiology reports, relevant medical records, and follow-up imaging including non-contrast CT and multiple MRI sequences for all 1194 patients in the clinical test dataset and classified each case's DWI hyperintensity into one of four categories: no definite abnormality, AIS, hemorrhagic stroke, or other abnormalities. AIS was defined as the presence of a lesion associated with symptoms occurring within 7 days prior to hospital admission. A case was considered a true positive if the algorithms detected at least one pixel corresponding to an ischemic stroke lesion. Other abnormalities comprised CNS disorders not classified as ischemic or hemorrhagic strokes, such as tumors, chronic lesions, seizure related signal changes, metabolic encephalopathy, and hypoxic brain injuries.
Statistical analysis
Baseline characteristics between the training dataset and the external test dataset were compared using ANOVA, Kruskal-Wallis test, and chi-square test as appropriate. For the external test dataset, the DSC and AHD of the two algorithms were compared using the Mann-Whitney U test. Subsequently, correlation plots and Bland-Altman plots were generated to compare infarct volumes between algorithm-generated and manually segmented infarcts. An independent t-test was applied to compare the two algorithms. For the clinical test dataset, the diagnostic accuracy of the algorithms in detecting AIS was evaluated using sensitivity, specificity, accuracy, positive predictive value (PPV), negative predictive value (NPV), and area under the curve (AUC). McNemar's test was used to compare the diagnostic accuracy between the two algorithms. Additionally, to assess the diagnostic performance of the two algorithms in different clinical contexts, subgroup analyses were performed using the same metrics in three populations: (1) a cohort excluding patients with hemorrhagic strokes and (2) a cohort excluding hemorrhagic strokes and other abnormalities. Moreover, to evaluate performance in hyper AIS, the cohort comprising only AIS patients was stratified based on the time interval from symptom onset to imaging (<3 h) for additional analyses.
All statistical analyses were performed using R (version 4.4.2; R Foundation for Statistical Computing, Vienna, Austria) and p less than 0.05 was considered statistically significant.
Results
Baseline characteristics and MRI information of study population
The mean ages for the training and validation, internal test and external test datasets were 67.9 ± 12.8, 68.2 ± 12.7, and 68.2 ± 12.3, respectively, with 58.9%, 60.4%, and 57.6% of participants being male (Table 1). MRI vendors, magnetic field strength, and imaging parameters were variable across the datasets. For the clinical test dataset, the mean ± SD age was 63.9 ± 15.4, and 58.1% of participants were male (Table 2).
Baseline characteristics of training and external test dataset.

Data are presented as mean ± standard deviation, number (percentage), or median (interquartile range, IQR). NIHSS = National Institutes of Health Stroke Scale.
Data were missing for 1,129, 264, and 65 patients in the Training-and-validation dataset, the Internal test dataset, and the External test dataset, respectively.
Data were missing for 1,257, 318, and 1 patients in the Training-and-validation dataset, the Internal test dataset, and the External test dataset, respectively.
Data were missing for 1,252, 317, and 1 patients in the Training-and-validation dataset, the Internal test dataset, and the External test dataset, respectively.
*Kruskal-Wallis test was used.
Baseline characteristics of clinical test dataset.

Data are presented as mean ± standard deviation and number (percentage). Other abnormalities consisted of 49 cases of tumors, 24 cases of chronic lesions, 18 cases of seizure-related signal changes, 14 cases of metabolic encephalopathy, 10 cases of hypoxic brain injury, and 5 other cases.
Infarct segmentation performance of both algorithms
In the external test dataset, volumetric analysis demonstrated a strong correlation between the predicted and ground truth infarct volume in both models, with r² and ρ values of 0.972 and 0.986 for SegMamba algorithm and 0.975 and 0.987 for the 3D U-Net algorithm, respectively (Table 3 and Figure 3). The SegMamba algorithm achieved a DSC of 0.786 (95% confidence interval [CI], 0.779–0.793), comparable to the 3D U-Net algorithm, which achieved a DSC of 0.785 (95% CI, 0.778–0.791; p = 0.141). In contrast, the SegMamba algorithm showed a better AHD of 1.252 (95% CI, 0.903–1.601) compared to the 3D U-Net algorithm, which showed an AHD of 1.764 (95% CI, 1.526–2.002; p < 0.001).
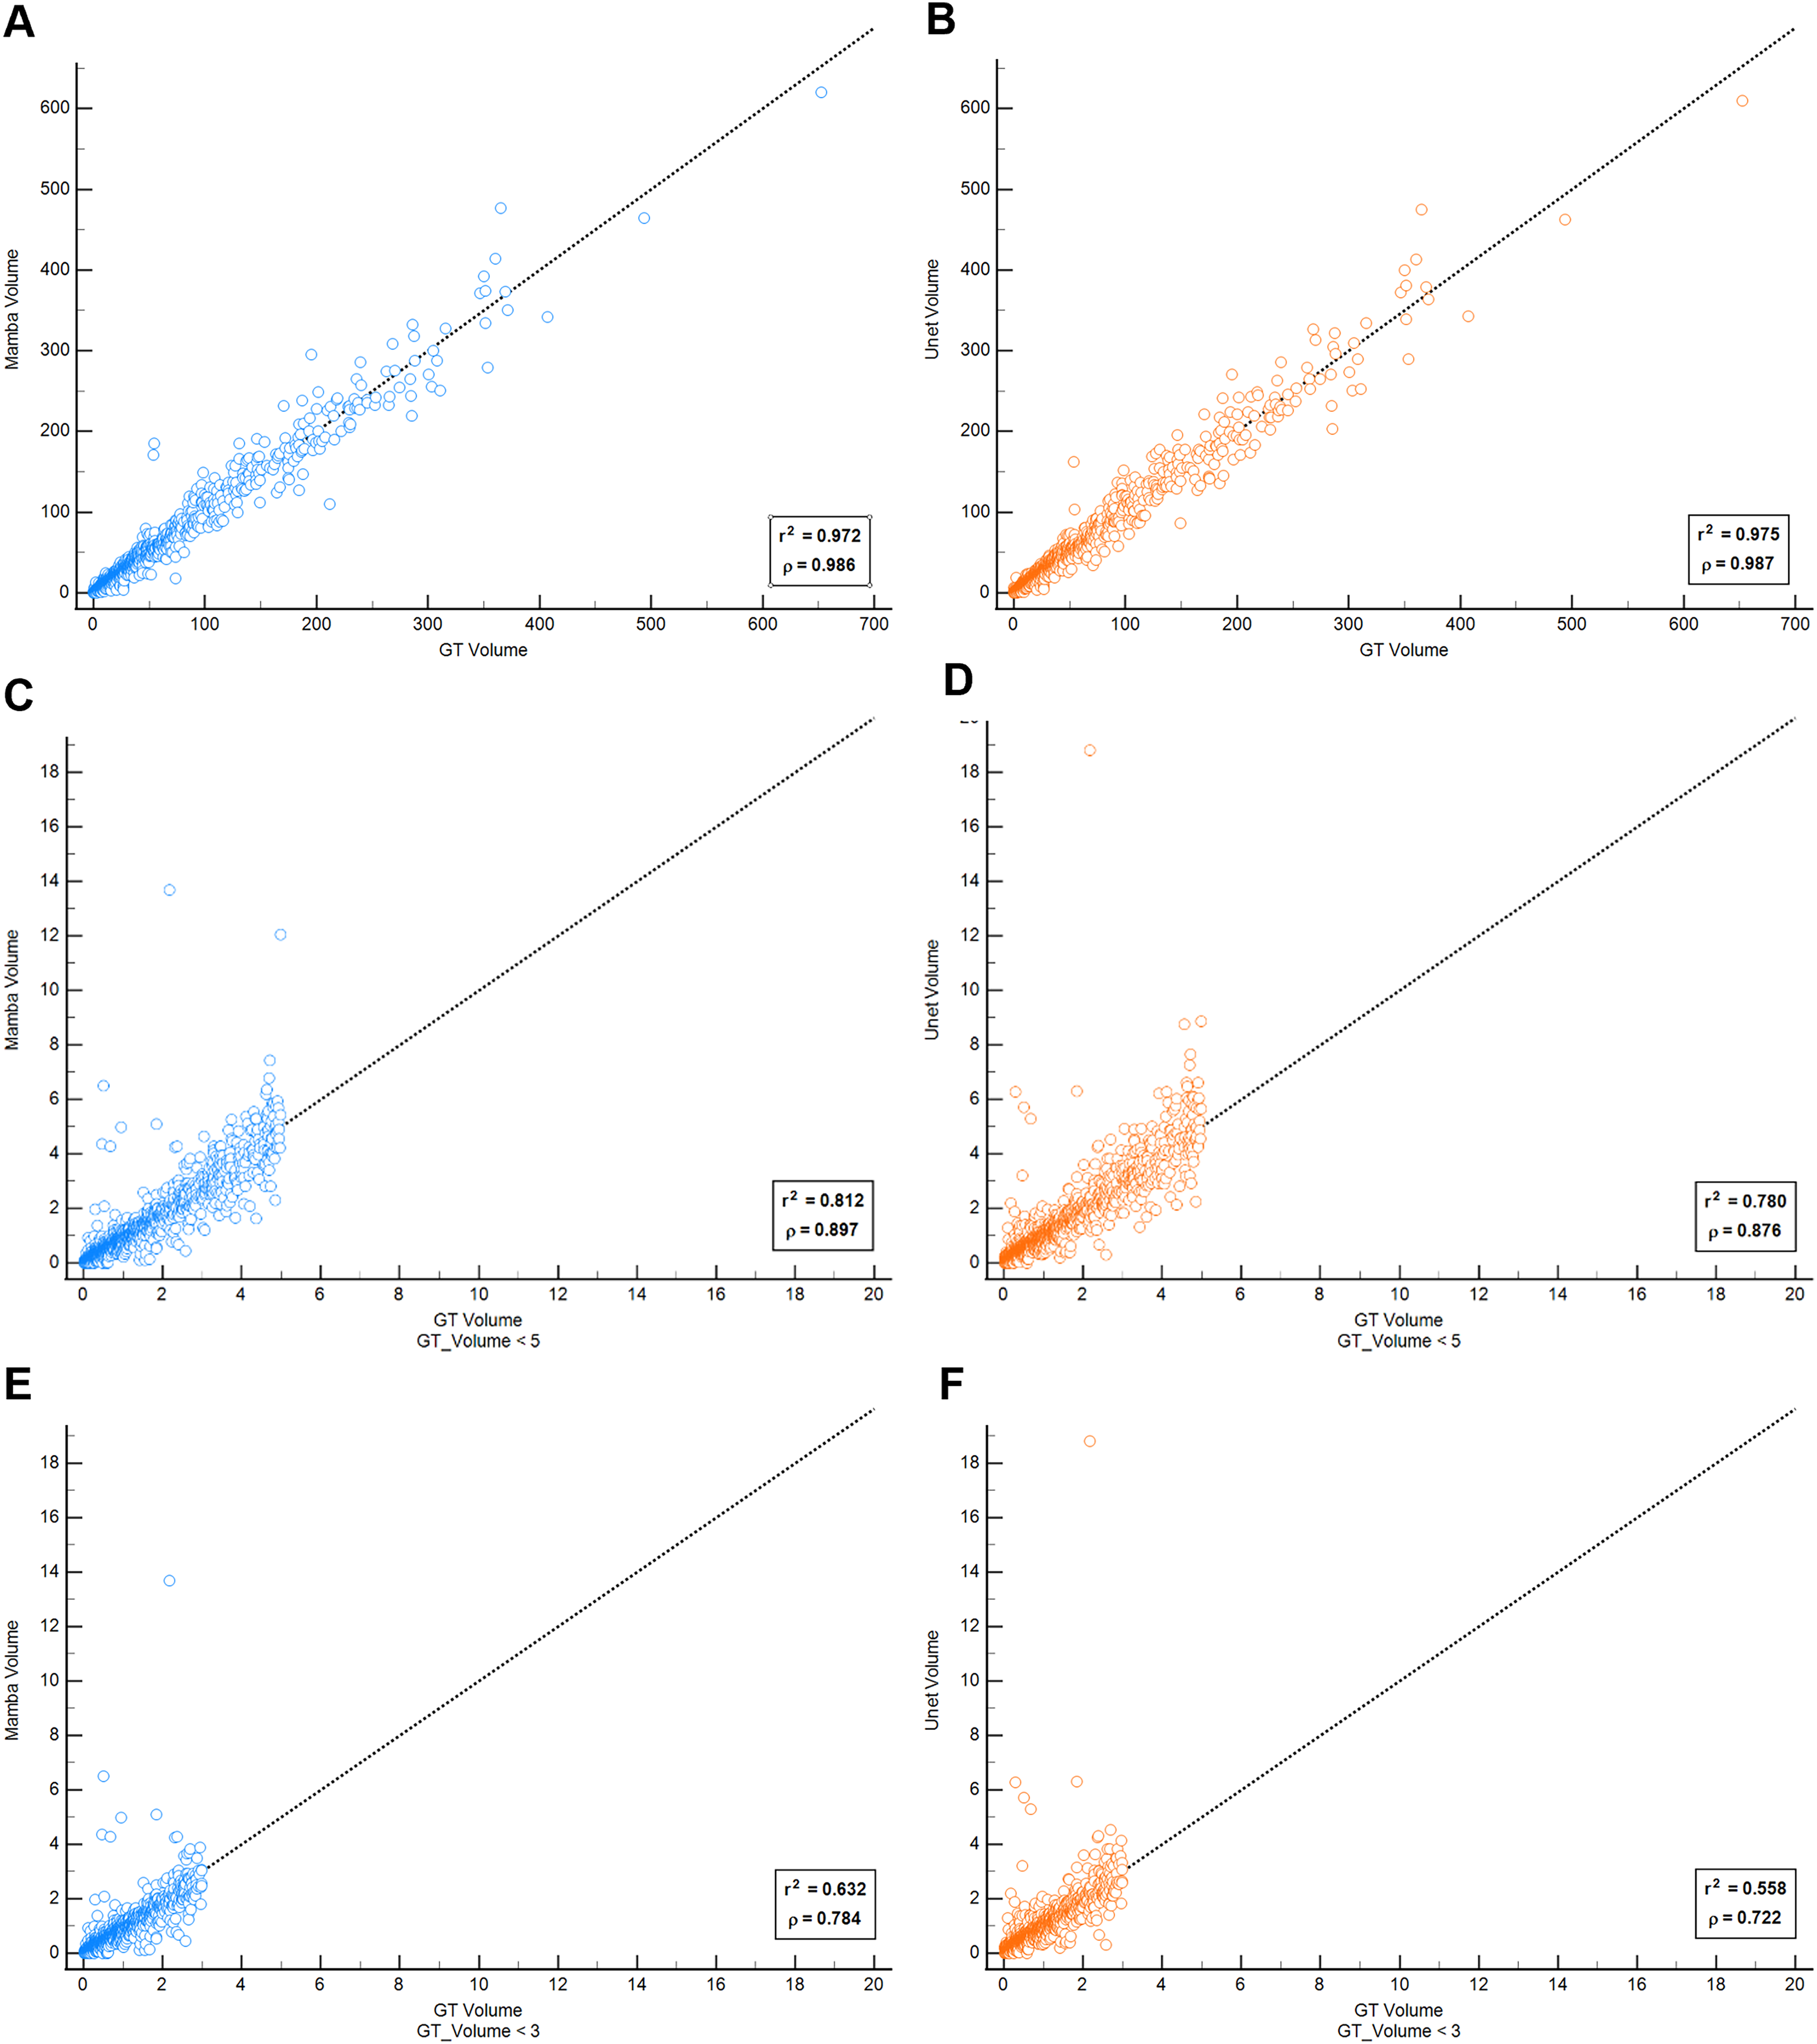
Correlation plot of two algorithms with ground truth infarct volume. Correlation between algorithm predicted volume with ground truth (GT) infarct volume. (A) SegMamba algorithm result for total cases. (B) 3D U-Net algorithm result for total cases. (C) SegMamba result for infarct volume less than 5 mL. (D) 3D U-Net result for infarct volume less than 5 mL. (E) SegMamba result for infarct volume less than 3 mL. (F) 3D U-Net result for infarct volume less than 3 mL.
Segmentation performance and volumetric analysis of the two algorithms.

Data are presented as estimate (95% confidence interval).
CCC: concordance correlation coefficient; DSC: Dice similarity coefficient; AHD: average Hausdorff distance.
*Mann-Whitney U test was used.
For infarct volumes below 5 and 3 mL, both algorithms maintained high DSC values. The r² and ρ values were slightly higher for the SegMamba algorithm, and AHD values were significantly lower than those of the 3D U-Net algorithm. When infarct volume was restricted to 1 mL or less, a similar trend for segmentation performance was observed (Table 4).
Segmentation performance of the two algorithms for infarction volumes below 1 mL.

Data are presented as estimate (95% confidence interval).
CCC: concordance correlation coefficient; DSC: Dice similarity coefficient; AHD: average Hausdorff distance.
*Mann-Whitney U test was used.
The mean percent differences of predicted volumes in SegMamba and 3D U-Net algorithm compared to the ground truth volumes were −11.6% (95% CI, −90.7–67.5%) and 1.5% (95% CI, −76.7–73.7%) and they were statistically different (p < 0.0001; Figure 4). Even as infarct size decreased, the mean percent difference remained smaller in the 3D U-Net algorithm compared to SegMamba.

Bland-Altman plot of two algorithms with ground truth infarct volume. Comparison of algorithm predicted volume with ground truth (GT) infarct volume. (A) SegMamba algorithm result for total cases. (B) 3D U-Net algorithm result for total cases. (C) SegMamba result for infarct volume less than 5 mL. (D) 3D U-Net result for infarct volume less than 5 mL. (E) SegMamba result for infarct volume less than 3 mL. (F) 3D U-Net result for infarct volume less than 3 mL.
Diagnostic accuracy of both algorithms in the clinical scenario
In the clinical dataset, the 3D U-Net algorithm showed excellent sensitivity of 98.79% and NPV of 99.35% for AIS detection (Table 5). Although the SegMamba algorithm exhibited a slightly lower sensitivity of 96.97% and an NPV of 99.18%, it achieved a significantly higher specificity of 58.80%, compared to 29.54% for the 3D U-Net algorithm (p < 0.001; Table 6). The AUC values for SegMamba and 3D U-Net were 0.816 and 0.805, respectively (Figure 5).
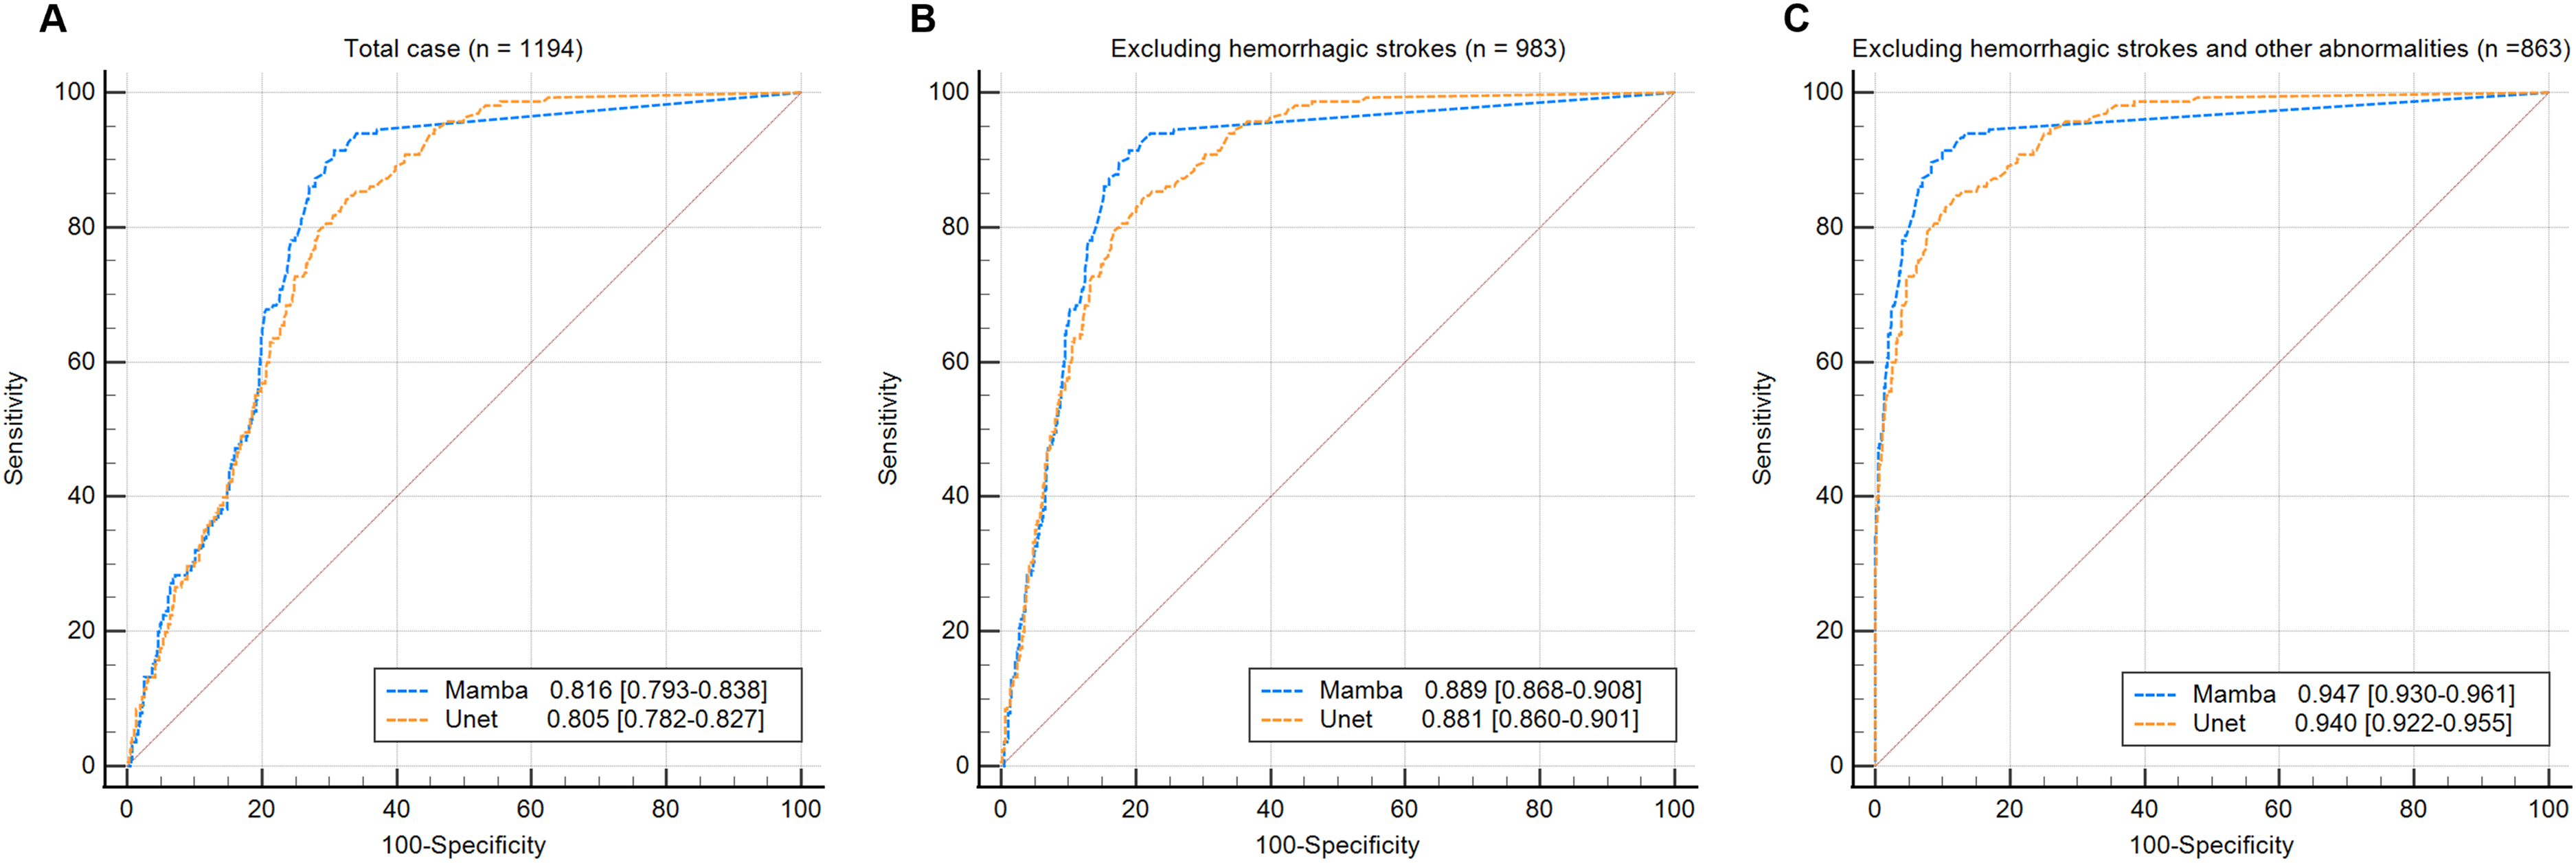
Receiver operating characteristic (ROC) curve of the two algorithms. (A) Comparison of the ROC curves between the SegMamba-based algorithm and the 3D U-Net-based algorithm for all cases. (B) Comparison of the ROC curves between the SegMamba-based algorithm and the 3D U-Net-based algorithm after excluding hemorrhagic stroke cases. (C) Comparison of the ROC curves between the SegMamba-based algorithm and the 3D U-Net-based algorithm after excluding both hemorrhagic strokes and other neurological abnormalities.
Diagnostic accuracy of the two algorithms for clinical test dataset.

Data are presented as estimate (95% confidence interval).
AIS: acute ischemic stroke; PPV: positive predictive value; NPV: negative predictive value.
Mcnemar's test of the two algorithms for clinical test dataset.
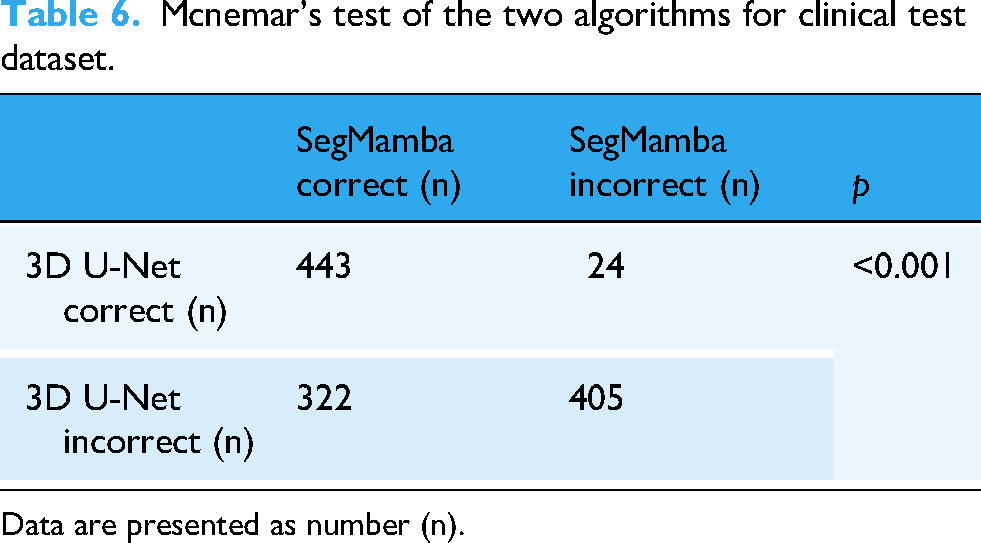
Data are presented as number (n).
When hemorrhagic stroke cases were excluded from the clinical dataset, the SegMamba algorithm achieved a higher specificity of 71.39% compared to 36.68% for the 3D U-Net algorithm, and the AUC values were 0.889 and 0.881. Furthermore, after excluding other neurological disorders aside from AIS, the specificity improved to 81.23% for SegMamba and 46.87% for the 3D U-Net, and the AUC values were 0.947 and 0.940. When analyzing AIS cases with a symptom onset-to-imaging time of less than 3 h (n = 54), the sensitivity of the SegMamba algorithm was 96.30%, while that of the 3D U-Net was 100.00%.
Discussion
In this study, we developed a novel deep learning algorithm for detecting and segmenting ischemic lesion on DWI, using SegMamba as the backbone architecture. To isolate the effect of the core model design, we compared SegMamba algorithm with a validated 3D U-Net-based algorithm trained on the same dataset and subjected to identical pre- and post-processing steps. Both models exhibited excellent lesion segmentation performance (Figure 6). However, their performance differed when applied to data from routine clinical practice.

Representative cases of acute ischemic stroke. (A) Raw diffusion-weighted imaging (DWI) of corona radiata infarction. (B) Result of SegMamba algorithm. (C) Result of 3D U-Net algorithm. (D) Raw DWI of occipital lobe infarction. (E) Result of SegMamba. (F) Result of 3D U-Net.
U-Net is well recognized for its exceptional segmentation performance, and numerous medical image segmentation algorithms adopt U-Net as their backbone architecture. 18 The 3D U-Net variants build on this approach by leveraging volumetric spatial information, enabling more comprehensive medical image segmentation. 19 Accordingly, many previous studies have developed AIS segmentation models based on U-Net. Because U-Net relies on stacked convolutions and skip connections with finite receptive fields, each voxel is classified largely on local appearance without an explicit mechanism for modeling long-range or inter-slice dependencies. 20 This locality can cause the network to over-segment nonspecific DWI hyperintensities. These shortcomings mean that, although U-Net excels on curated test sets, segmentation metrics alone are insufficient to demonstrate clinical utility when AIS must be distinguished from its many mimics in a heterogeneous emergency department population.
Automated DWI segmentation and infarct volume quantification provide considerable advantages for research, supporting not only time-sensitive large-scale randomized controlled trials but also enabling a broader scope of AIS image analyses.21,22 However, implementing these algorithms in everyday clinical settings, rather than limiting them to research contexts, creates a substantial workload due to false-positive cases. This burden not only increases the physicians’ time spent interpreting image but also raise the risk of overdiagnosis, particularly for less experienced clinicians.
Therefore, to develop an algorithm more suitable for clinical use, we aimed to reduce the capture of clinically insignificant DWI high signal intensity (HSI) information. To this end, we adopted SegMamba framework, which integrates a U-shaped architecture with Mamba to model global volumetric features across multiple scales. 11 As expected, it filtered out many non-clinical HSIs, including noise artifacts, metallic artifacts, and anatomically normal structures that appear HSI (Figure 7).

Representative cases of high signal intensity on diffusion-weighted imaging without brain abnormalities. (A) Raw diffusion-weighted imaging (DWI) of subtle high signal intensity on the right internal capsule due to corticospinal tract. (B) Result of SegMamba algorithm. (C) Result of 3D U-Net algorithm. (D) Raw DWI with susceptibility artifact at pons. (E) Result of SegMamba. (F) Result of 3D U-Net.
This gain, however, came at the cost of a modest drop in sensitivity (96.97% vs 98.79% for 3D U-Net). Because even experts can miss very small or subtle infarcts—especially punctate posterior-circulation lesions or faint cortical infarcts—a slight reduction in sensitivity could translate into delayed diagnoses in the most challenging cases. The trade-off reflects each architecture's intrinsic bias: U-Net's dense, voxel-level decisions favor exhaustive detection but over-call non-specific hyperintensities, whereas SegMamba's global-context filtering suppresses noise yet may under-report borderline lesions. Our results therefore underscore that no single architecture is universally optimal; choosing or tuning an AI tool for stroke imaging should depend on the clinical priority—maximizing sensitivity for early triage, maximizing specificity to minimize unnecessary follow-up, or striking a balanced middle ground.
A key strength of this study lies in its clinical evaluation using a fresh dataset of 1194 consecutively enrolled patients who underwent brain DWI for neurological symptoms, regardless of their final diagnosis. Although many segmentation models continue to improve in performance, their validation is often conducted on meticulously curated, AIS-specific datasets that have undergone substantial data cleaning.23,24 Furthermore, the majority of prior studies have evaluated model performance using only simple metrics such as the DSC. As a result, metrics derived from such controlled datasets may fail to accurately reflect real-world clinical applicability. As evidenced by the comparable segmentation performance but differing clinical outcomes of the SegMamba and U-Net based models, our findings underscore the importance of validating deep learning algorithms on unfiltered datasets to ensure their practical utility in routine clinical practice.
This study also has several limitations. One important issue is the heterogeneity of MRI field strength across datasets, as the external test set consisted almost entirely of scans from 1.5 T scanners, whereas the training data included a substantial proportion of 3.0 T scans. Such an imbalance represents a domain shift that can challenge deep learning models because of differences in signal-to-noise ratio and image contrast. In addition, although SegMamba algorithm showed sufficiently high sensitivity, false negatives were observed in some cases of hyper AIS with subtle signal changes, whereas the 3D U-Net algorithm did not (Figure 8). Given the urgent nature of AIS, this shortcoming could be critical. However, these limitations suggest that different algorithms, each with distinct strengths, can be selectively applied in clinical practice. The extremely high sensitivity of the 3D U-Net-based algorithm, along with its smaller volume discrepancy relative to ground truth, might be more suitable for detecting hyperacute or small ischemic lesions and tracking infarct progression in confirmed AIS. In contrast, the balanced performance of the SegMamba-based algorithm may help radiologists and less experienced physicians by reducing interpretation time, thereby improving workflow in clinical settings.

Representative cases of hyperacute ischemic stroke. (A) Raw diffusion-weighted imaging (DWI) of paramedian pontine infarction. (B) Result of SegMamba algorithm. (C) Result of 3D U-Net algorithm. (D) Raw DWI of internal capsule infarction. (E) Result of SegMamba. (F) Result of 3D U-Net.
Additionally, since the SegMamba algorithm was trained exclusively on AIS patients, it remains a segmentation model optimized for this specific condition. While it effectively eliminated clinically insignificant HSIs, it did not completely remove false positives in patients with non-AIS neurological disorders. For instance, in the hemorrhagic stroke group, the SegMamba algorithm filtered out 21 of the 207 false-positive cases detected by the 3D U-Net algorithm, and in the other abnormalities group, filtered 17 of the 119 false positives of 3D U-Net. Therefore, further investigation should focus on developing a segmentation algorithm that functions accurately within only AIS rather than detecting general DWI abnormalities. This goal might be achieved by broadening the range of pathologies included in the training set while assigning higher weights to AIS cases and lower weights to non-AIS conditions, as well as integrating clinical information as an additional input to develop a multimodal model.
Conclusions
We employed SegMamba to develop an algorithm that delivers AIS segmentation performance on par with validated 3D U-Net algorithm, while improving diagnostic accuracy in routine clinical settings. This study underscores the importance of validating deep learning models both within specific disease cohorts and across diverse clinical contexts to ensure their true utility in daily practice.
Footnotes
Acknowledgements
The authors thank all study participants and the clinical and research staff at each participating center for their invaluable contributions to this work.
ORCID iDs
Ethical approval
The institutional review boards of all centers approved the study and written informed consent was obtained from patients or their legal representatives. Institutional Review Boards of Korea University Guro Hospital approved this study (2022GR0199).
Author contributions
Hokyu Kim contributed to the conceptualization, formal analysis, and drafting of the original manuscript. Wi-Sun Ryu was responsible for conceptualization, supervision, and critical revision of the manuscript. All authors were involved in data acquisition, analysis, and interpretation. All authors approved the final version of the manuscript, agreed on the journal of submission, and accepted responsibility for all aspects of the work.
Funding
The authors received no financial support for the research, authorship, and/or publication of this article.
Declaration of conflicting interests
The authors declared the following potential conflicts of interest with respect to the research, authorship, and/or publication of this article: Hoyoun Lee and Wi-Sun Ryu are employees of JLK Inc. Rest of the authors report no relationships that could be construed as a conflict of interest.
Data availability
The data that support the findings of this study are available from the corresponding author upon reasonable request.
Guarantor
Wi-Sun Ryu.