
Abstract
Objective
Early and accurate identification of skin lesions—ranging from benign irregularities to life-threatening cancers—is crucial for improving clinical outcomes. However, existing skin lesion datasets suffer from severe class imbalance, and there is limited consensus on effective augmentation strategies. This study aims to develop a robust framework that mitigates these limitations while enhancing diagnostic accuracy and interpretability.
Methods
We introduce a novel transfer learning-based framework termed hierarchical attention stacked ensemble
Results
Experimental evaluations on the HAM10000 dataset demonstrated that the proposed framework achieved an outstanding accuracy of 93.96%, surpassing several state-of-the-art approaches. The use of Grad-CAM visualizations further enhanced model interpretability by effectively localizing lesion-relevant regions.
Conclusion
The proposed HASE framework not only delivers superior diagnostic accuracy but also alleviates challenges associated with class imbalance, limited dataset diversity, and high computational cost. By combining hierarchical attention and multi-level ensemble weighting, it establishes a reliable and interpretable solution for early and precise skin lesion classification, offering significant potential for real-world dermatological applications and improved patient care.
Keywords
Introduction
Skin lesions represent abnormal alterations in the skin’s appearance or structure and are associated with a wide range of dermatological conditions. These conditions can vary from common problems, such as acne, to more serious and potentially life-threatening diseases like skin cancer. Although skin disorders manifest with diverse symptoms, the presence of lesions is not their sole characteristic. Lesions may result from numerous causes, including infections, inflammatory responses, allergic reactions, malignancies, insect bites, trauma, autoimmune diseases, genetic factors, environmental exposures, vascular irregularities, warts, and cysts. 1 They are generally classified according to their potential health risk. Benign lesions, such as moles, skin tags, warts, seborrheic keratoses, and hemangiomas, are typically harmless. In contrast, malignant lesions, including basal cell carcinoma, squamous cell carcinoma, and melanoma, are cancerous and capable of spreading, posing serious health risks. 2
Prompt and accurate identification of skin conditions traditionally relied on clinical examination and diagnostic testing. Delays in detection or insufficient attention could lead to severe consequences, including skin cancers, which rank among the most common forms of cancer globally. Although melanoma is less frequent than other types of skin cancer, it remains the primary cause of skin cancer-related mortality.
3
Recent data suggest that around 2.2% of the population may be diagnosed with melanoma during their lifetime, with
Timely identification of skin lesions is crucial for preventing their progression into more serious conditions. Despite this, many individuals remain unaware of existing skin abnormalities, partly due to the complexity and cost associated with conventional medical evaluations. Dermatoscopy, a non-invasive imaging technique that combines magnification and illumination, assists in examining skin lesions and facilitates early cancer detection. However, the effectiveness of dermatoscopy largely depends on the examiner’s skill, leaving room for human error. 5
Artificial intelligence (AI), particularly through machine learning (ML) and deep learning (DL) frameworks, has demonstrated considerable promise in automating the detection of skin lesions. These approaches allow for rapid analysis of medical images, supporting early diagnosis and better clinical outcomes. Nevertheless, several challenges remain. Existing methods tend to favor classes with abundant data, struggle to extract rich features from transfer learning (TL) models without fine-tuning, and encounter difficulties in integrating multiple models effectively. Moreover, limited interpretability and biases arising from overlapping validation and testing datasets further hinder practical deployment. TL architectures such as DenseNet and ResNet also present limitations, including rigid scaling constraints, reliance on manual design choices, and high computational demands, which restrict their adaptability and efficiency, particularly in resource-limited settings. 6
To overcome these obstacles, researchers have explored convolutional neural networks (CNNs) and ensemble learning strategies. While these approaches aim to mitigate the shortcomings of individual models, conventional ensemble techniques—such as majority voting, softmax averaging, and weighted averaging—do not adequately consider the relative importance of each predictor, often resulting in suboptimal performance. Additionally, post-prediction ensembling alone may fail when handling images with high variance, as no single model consistently identifies the correct class. These limitations highlight the importance of pre-prediction stacking, which complements traditional ensembling by addressing data variability and enhancing overall predictive accuracy.
Our methodology was meticulously crafted to address the abovementioned key challenges in skin lesion detection, aiming to resolve the following research questions (RQs). These questions formed the cornerstone of our architectural framework, guiding the development of innovative and effective solutions.
– Most skin lesion datasets have significant class imbalance, which can bias models toward the majority classes. Approaches like data augmentation or generative adversarial networks (GANs) can help reduce this imbalance. Identifying the most effective augmentation strategy to ensure reliable performance on completely unseen data remains a key research goal.
– With many TL models available, choosing and adapting the most suitable model is challenging. Models pretrained on datasets such as ImageNet often have fixed architectures that may not perfectly match task-specific needs. Optimizing these models for superior performance on the target task is therefore crucial.
– In classification tasks, not all image regions contribute equally to feature extraction. Irrelevant or redundant regions can reduce model performance. Highlighting and focusing on the most important regions is essential to improve classification accuracy.
– Relying on a single algorithm can result in misclassification, especially for complex data. EL combines the strengths of multiple models to produce more reliable predictions. However, conventional methods like majority voting or simple averaging often fail to optimally weight individual models. A dynamic weighting strategy is, therefore, needed to enhance overall performance.
7
– Post-prediction ensembling alone may struggle with images exhibiting high variance, as no single model can consistently predict the correct class. Integrating a pre-prediction stacking mechanism helps overcome these limitations, enabling more robust feature extraction and improved classification accuracy. 8
These research questions formed the foundation of our approach, which introduced several key contributions:
Addressing class imbalance: A comprehensive augmentation framework was developed and evaluated using four strategies: no augmentation (NA), prior augmentation (PrA), training data augmentation (TDA), and posterior augmentation (PoA). The most effective method was selected based on its performance on unseen data, ensuring balanced class representation and reducing bias toward majority classes. Optimizing TL models: EfficientNetV1 architectures were adopted for their flexibility and computational efficiency. These models were customized with additional layers and novel modules, resulting in the “Hierarchical Attention Stacked Ensemble (HASE)” framework, which effectively captured both shallow and deep feature representations. Focusing on critical features: Triplet-attention (TA) mechanisms, consisting of soft attention integration (SAI), channel attention integration (CAI), and squeeze-excitation attention integration (SEAI), were incorporated to emphasize the most relevant regions of the input data, enhancing the model’s focus on key features. Pre-prediction stacking: Three stacking configurations—HASE: independent TA, HASE: serial stacked TA, and HASE: parallel stacked TA—were implemented before training. This strategy combined extracted features to capture the most meaningful and deep patterns. Novel ensemble strategy: The Matthews-correlation-coefficient weighted averaging (MWA) approach was introduced to calculate and apply optimal prediction weights across models. Its extension, multi-level MWA (ML-MWA), further improved performance by leveraging predictions from multiple layers, enhancing robustness, accuracy, and generalization. Enhancing interpretability: Gradient class activation maps (Grad-CAMs) were integrated to visualize and highlight regions associated with specific skin conditions, improving transparency and reliability while providing valuable insights for clinical applications.
Literature review
Skin lesion classification has received significant attention within medical imaging and AI. Despite notable advancements, challenges such as class imbalance, dataset-specific optimization, and the effective use of attention mechanisms remain. This section reviews existing approaches, highlighting both their contributions and limitations to provide context for the present study.
TL has been extensively applied in skin lesion classification. Hosny et al. 9 utilized AlexNet to classify melanoma and nevus, achieving high accuracy, but did not incorporate attention mechanisms that could improve diagnostic precision. Tajerian et al. 10 reported 84.30% accuracy with EfficientNet-B1, demonstrating its capability to detect pigmented lesions; however, reliance on general features limited performance for dataset-specific characteristics. Wang et al. 11 employed DenseNet-121 and VGG-16 to extract multiscale features, achieving 91.24% accuracy, yet the absence of dataset-specific fine-tuning reduced adaptability. Mahbod et al. 12 studied the influence of image size on TL-based classification, reaching 86.2% balanced accuracy, though the computational requirements limited real-time applicability. Popescu et al. 13 combined TL with collective intelligence to achieve 86.71% accuracy, but did not validate results on an independent test set, raising questions about model robustness. Howal and Wagh 14 proposed the ILENET–LinkNet architecture integrating preprocessing, attention-based segmentation, and hybrid feature learning, demonstrating improved skin lesion classification performance through score-level fusion, although the multi-stage design increases architectural complexity.
Hybrid architectures that combine CNNs and transformers have demonstrated effectiveness in capturing both local and global features. Khan and Khan 15 developed SkinViT, which integrates outlook attention with transformers and achieved 91.09% accuracy; however, its high computational cost limited scalability. Dong et al. 16 proposed TC-Net, effectively combining CNN and transformer features to achieve improved segmentation performance, yet the model’s complexity hindered practical implementation. Nie et al. 17 introduced a hybrid CNN–transformer approach with focal loss, attaining 89.48% accuracy, though it struggled to extract deeper features in more complex cases.
Attention mechanisms have become increasingly popular for emphasizing critical features in classification tasks. Nguyen et al. 18 applied DL with soft attention, reporting accuracies of 90% and 86% across different models, but did not compare alternative attention strategies. Datta et al. 19 implemented soft attention, achieving 93.4% accuracy, yet faced challenges in optimizing color channel weights, limiting generalizability. Saarela and Georgieva 20 used Bayesian inference to improve interpretability, achieving 80% accuracy, but their method fell short in classification precision compared to other techniques.
To address these limitations, more sophisticated attention mechanisms have been proposed. Singh et al. 21 combined Bayesian MultiResUNet with DenseNet-169 for segmentation and classification, reaching 86.67% accuracy, yet it struggled with complex lesion types. Khan et al. 22 introduced an entropy-optimized attention mechanism within a DL framework, achieving over 90% accuracy, although the robustness of their model on independent test sets was not thoroughly evaluated.
EL methods have been widely investigated to improve classification performance. Ajmal et al. 23 applied fuzzy entropy optimization within an ensemble framework, achieving high accuracy on the HAM10000 and ISIC 2018 datasets; however, high computational demands and the lack of evaluation on real-world datasets limited its applicability. Rahman et al. 24 employed an ensemble of five deep networks, attaining 88% accuracy, but the method did not offer dataset-specific optimization.
Nidhi et al. 25 and Abir et al. 26 utilized PAD-UFES-20 dataset to classify skin lesions with only one TL method with no ensemble techniques. Ahmmed et al. 27 also did the same with PH2 dataset.
Data augmentation has played a crucial role in mitigating class imbalance. Gouda et al. 28 enhanced image quality using ESRGAN prior to classification, achieving 83.2% accuracy, yet did not fully resolve persistent imbalance issues. Sun et al. 29 leveraged augmented datasets along with supplementary metadata, reaching 89.5% accuracy, but the augmentation procedure lacked sufficient transparency, limiting reproducibility.
Studies30–33 incorporated augmentation techniques in ISIC2017-2020 datasets with TL, but hadn’t tried to explore any ensemble methods.
Despite these advances, many approaches remain constrained by small datasets, limited dataset-specific fine-tuning, and inadequate validation on independent test sets. Challenges related to computational efficiency and scalability persist, particularly for real-world deployment. Additionally, traditional ensemble techniques often fail to assign optimal weights to individual models, which can reduce overall effectiveness.
Building on these observations, our study proposes a novel framework designed to overcome the limitations of existing approaches. A critical first step involves selecting the most effective augmentation strategy to address class imbalance. By incorporating TA in serial, parallel, and independent stacking configurations, the framework enhances feature extraction and emphasizes the most relevant regions. Fine-tuning TL models for skin-specific characteristics reduces dependence on generalized ImageNet-pretrained architectures. Furthermore, our ensemble strategy employs Matthews-correlation-coefficient weighted averaging (MWA) to dynamically assign optimal prediction weights, ensuring robust and consistent performance across diverse datasets. Collectively, these innovations offer a comprehensive solution to current challenges and advance the state of skin lesion classification.
Materials and methods
This study was conducted as a theoretical and computational investigation utilizing TL and ensemble learning techniques for skin lesion classification. The experimental work was carried out in the authors laboratory over a period of approximately 6 months.
Dataset description
This study utilized a publicly available dermatoscopic dataset to provide a comprehensive and diverse analysis of skin lesion classification.
The dataset, Human Against Machine (HAM10000), was obtained from the Harvard Dataverse repository. 34 It consists of a carefully curated set of 10,015 dermatoscopic images in JPG format, divided into seven distinct classes.
The seven classes included in the dataset are melanoma (MEL), nevus (NV), vascular lesions (VASC), actinic keratosis (AK), basal cell carcinoma (BCC), benign keratosis (BKL), and dermatofibroma (DF). Among these, MEL, AK, and BCC are classified as malignant lesions, whereas NV, BKL, and DF are benign. Some types of VASC may also exhibit malignant characteristics.
Tables 1 to 4 provides an overview of the dataset distribution, offering a clear depiction of the composition of data used in this study.
Brief information of the HAM10000 dataset.

HAM10000: Human Against Machine.
Input data for Matthews-correlation-coefficient weighted averaging (MWA).

Weighted ensemble results (Matthews-correlation-coefficient weighted averaging (MWA)).

Trainable parameters for each architecture.

Figure 1 presents representative examples from each class, showing one sample per category. The dataset’s substantial class imbalance is further illustrated in the class distribution visualization in Figure 2.

Sample images from the HAM10000 dataset: (a) NV: nevus; (b) MEL: melanoma; (c) BKL: benign keratosis; (d) BCC: basal cell carcinoma; (e) AK: actinic keratosis; (f) VASC: vascular lesions; and (g) DF: dermatofibroma.

Sample distribution for each class in the HAM10000 dataset.
The dataset was carefully preprocessed to meet the objectives of this study. Additional details regarding the specific versions used are available in HAM10000. 35
Methodological approach
The methodological framework of this study started with dataset acquisition, followed by comprehensive data preprocessing. The datasets were subsequently divided into two primary subsets: a main training set and an independent testing set. The independent testing set was completely held out during training and validation, providing truly unseen data for final evaluation.
To mitigate class imbalance, four distinct data augmentation strategies were employed:
No augmentation (NA): Only the original dataset was used, without generating any synthetic images. Prior augmentation (PrA): Synthetic images were created prior to data splitting, which could result in overlap, where both original and augmented images from the same source might appear in training, validation, and testing sets. Training data augmentation (TDA): Augmentation was applied solely to the training data, keeping validation and testing sets independent and unchanged. Posterior augmentation (PoA): Each subset—training, validation, and testing—was augmented after splitting, increasing the dataset size across all partitions.
The most effective augmentation strategy was identified by training a customized network based on EfficientNetV1 variants, followed by evaluation on the independent testing set to determine performance on entirely unseen data.
Next, the data was processed within the HASE framework. HASE combined architectures trained on the training set and validated on the validation set. It incorporated models using three TA configurations, which included soft attention, channel attention, and squeeze-excitation attention: HASE: independent TA, HASE: serial stacked TA, and HASE: parallel stacked TA.
Predictions from each model were then fused using the ML-MWA method, applied across multiple layers to boost performance. This ensemble technique enabled optimal weighting of predictions and improved generalization.
For interpretability, Grad-CAM visualizations were employed, providing insights into model behavior by highlighting critical regions of the input images. A schematic diagram of the sequential steps in this methodology is presented in Figure 3.

Sequential representation of methodology.
Preprocessing and data augmentation
To prepare the dataset for effective training, images were first grouped according to their lesion IDs. Careful sampling was then conducted to create distinct subsets for training, validation, and testing. Specifically, 15% of the images were allocated to the independent testing set, while the remaining 85% formed the primary training set. The independent testing set was completely preserved as unseen data and used exclusively for final evaluation, ensuring an unbiased assessment of model performance.
Lesion IDs were strictly separated across training, validation, and testing sets prior to augmentation, ensuring that no images derived from the same lesion appear in more than one subset.
Figure 4 depicts the four data augmentation strategies implemented to address class imbalance:

Illustration of four data augmentation strategies.
No augmentation (NA): The original dataset was used without generating any synthetic images. Prior augmentation (PrA): Synthetic images were produced before dataset splitting, which could result in overlap where both original and augmented images from the same source appear in training, validation, and testing sets. Training data augmentation (TDA): Augmentation was applied solely to the training subset, keeping validation and testing sets independent and unchanged. Among the four strategies, this is the only clinically valid augmentation approach, as it preserves the independence of validation and test data and prevents data leakage. Posterior augmentation (PoA): Each subset—training, validation, and testing—was augmented separately after splitting, increasing the dataset size across all partitions.
To address class imbalance, roughly 8000 synthetic images were generated for each class. The primary training dataset was subsequently split into training, validation, and testing subsets in a 70:15:15 ratio, respectively.
Augmentation was carried out using TensorFlow’s
Figure 5 presents examples of original, contrast-enhanced, and augmented images, illustrating a sample from the AK class along with its augmented variants.
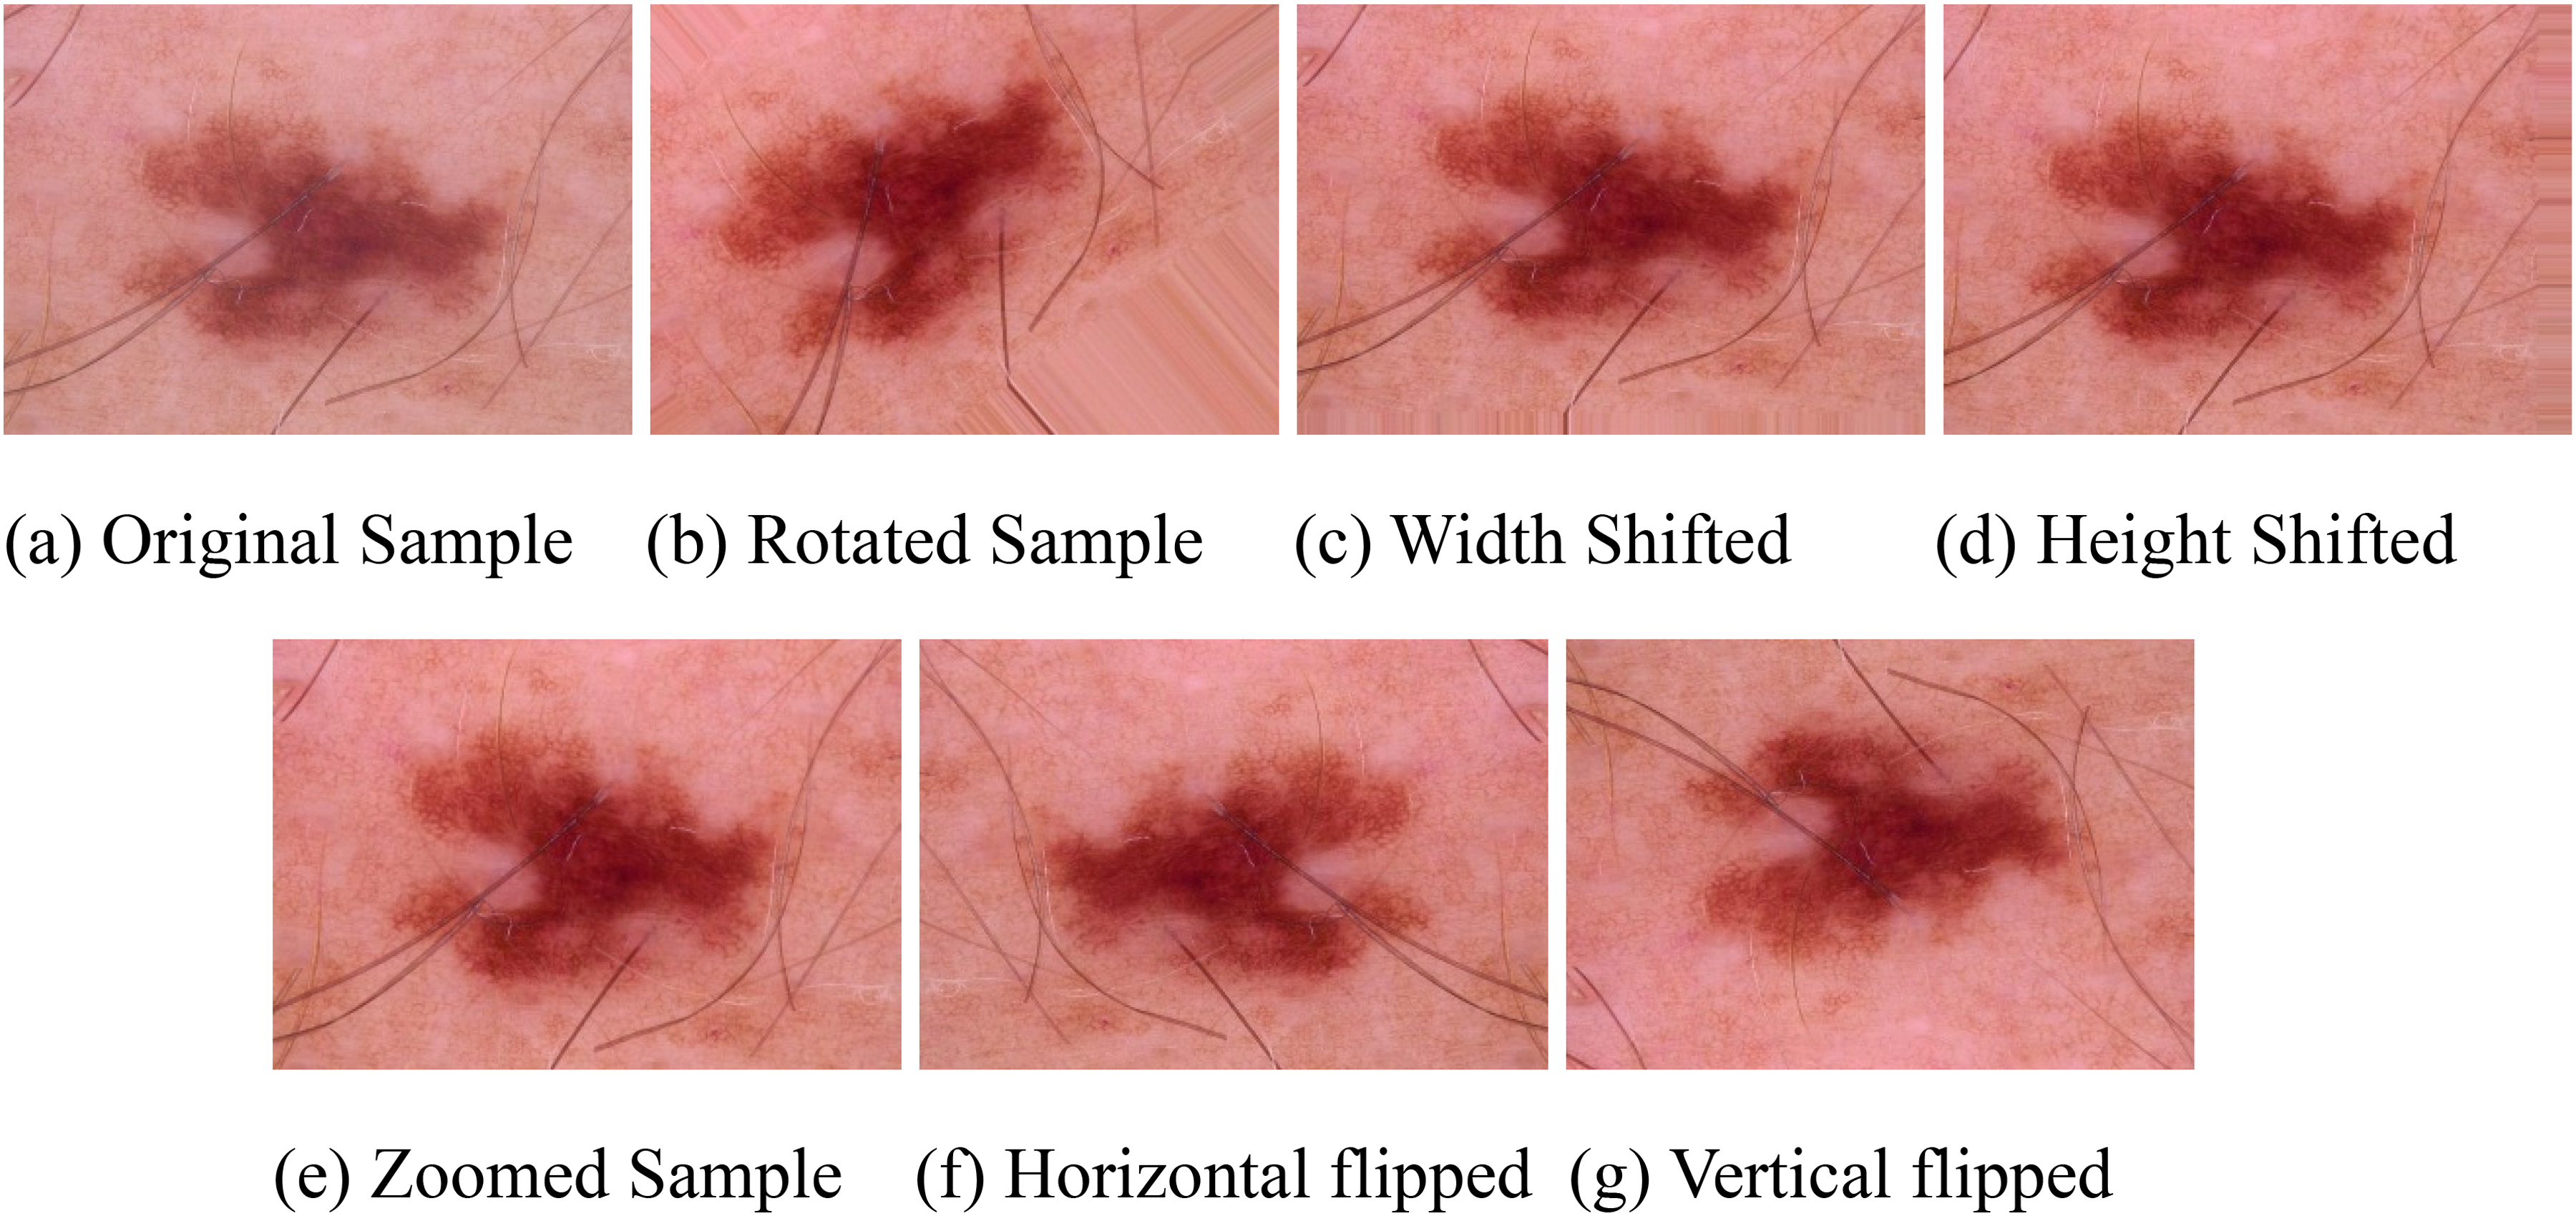
Images of the augmented samples: (a) original sample; (b) rotated sample; (c) width shifted; (d) height shifted; (e) zoomed sample; (f) horizontal flipped, and (g) vertical flipped.
Tables 5 and 6 show the comparison of all augmentation strategies in both testing and independent testing data. Accordingly, all primary performance comparisons and conclusions in this study are drawn based on results obtained using the TDA strategy.
Performance evaluation by four augmentation strategies on testing data.

NA: no augmentation; PrA: prior augmentation; TDA: training data augmentation; PoA: posterior augmentation.
Performance evaluation by four augmentation strategies on independent testing data.

NA: no augmentation; PrA: prior augmentation; TDA: training data augmentation; PoA: posterior augmentation.
Development of HASE architectures
The HASE framework utilized customized EfficientNetV1 models, fully leveraging TL. Specifically, seven pre-trained architectures, including various EfficientNetV1 variants with input dimensions of

Overview of the hierarchical attention stacked ensemble (HASE) architecture.
The integration process started by importing pre-trained models from the
Three customized CNN architectures incorporating TA were developed:
Soft attention integrated network (SAIN): Targeted fine-grained spatial patterns. Channel attention integrated network (CAIN): Enhanced feature representation by emphasizing significant channels. Squeeze-excitation attention integrated network (SEAIN): Calibrated channel-wise responses to capture hierarchical features more effectively.
The TA modules were selectively integrated into these networks. For SAIN and SEAIN, TA modules were inserted after each convolutional block, while CAIN incorporated channel attention after every
The convolutional backbone consisted of two convolutional blocks, each containing four
The three HASE configurations—serial stacked, parallel stacked, and independent attention—are described as follows.
HASE: Serial stacked attention network
In the serial configuration, outputs from SAIN, CAIN, and SEAIN were integrated in a sequential manner. Following the reshaping of the pre-trained model’s output tensor, the SAIN processed the features first, followed by CAIN, and finally SEAIN. Each network further refined the features extracted by the preceding one, producing progressively enhanced representations. These features were flattened into a one-dimensional tensor and fed through three fully connected layers with sizes 256, 128, and 7, corresponding to the number of classes. ReLU activation was applied to the first two layers, while the final layer used softmax to produce class probabilities. Dropout layers with rates of 35% and 25% were included after the first two dense layers, respectively, to reduce overfitting.
HASE: Parallel stacked attention network
In the parallel configuration, outputs from SAIN, CAIN, and SEAIN were computed concurrently. Each network independently processed the reshaped pre-trained output, extracting features in parallel. The resulting feature maps were then concatenated to merge complementary information from all attention mechanisms. The combined tensor was flattened and passed through the same fully connected layers and dropout setup as in the serial configuration. This design facilitated the integration of diverse feature representations, enhancing model generalization.
HASE: Independent attention network
In the independent configuration, SAIN, CAIN, and SEAIN functioned completely independently. Each network extracted features separately from the reshaped pre-trained model output. The outputs were flattened into one-dimensional tensors and passed through their respective fully connected layers. Each network generated its own predictions, maintaining independence of the extracted features. This setup allowed each attention mechanism to focus solely on its specialized feature extraction, which could later be combined during ensemble evaluation.
The careful design of these three HASE configurations ensured effective utilization of attention mechanisms, enabling robust feature extraction and improving model performance across varied input scenarios.
Feature extraction process
In our methodology, the HASE models were employed for effective feature extraction. The top fully connected layers were excluded (
Feature visualization
Figure 7 illustrates the hierarchical feature extraction process within an Optimized EfficientNetV1 architecture. The figure shows activation maps at multiple stages of the TL model, with each row corresponding to a different layer’s activations, providing a detailed view of the progressive transformation of input images:

Feature extraction process illustrated by activation maps (sample visualization).
Input layer ( Zero padding ( Convolution ( Batch normalization ( ReLU activation ( Max pooling ( Concatenation ( Dense layer ( Output layer (
The visualization in Figure 7 displays up to five filters per layer using the
Demonstrated on a single sample and selected layers, this process highlights the systematic extraction of thousands of feature representations. These detailed features substantially enhanced overall model performance by providing deeper insights into how hierarchical patterns were captured across the architecture.
Triplet-attention
To improve the model’s ability to focus on important input features while minimizing less relevant information, we employed three complementary attention mechanisms, collectively called Triplet-Attention (TA). This method integrates CAI, SEAI, and soft attention integration (SAI) to efficiently capture and emphasize critical patterns within the data.
Soft attention integration
The SAI module emphasizes assigning attention weights to individual elements of the input, enabling the model to prioritize regions according to their importance.
37
The attention mechanism can be expressed as follows: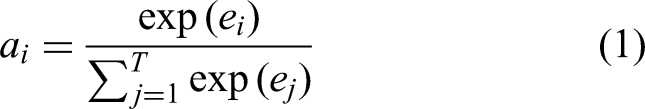
Here
By assigning greater weights to the most important regions, the SAI module directs the model’s focus toward the most relevant portions of the input, thereby improving overall performance.
Channel attention integration
The CAI module emphasizes the significance of key channels within feature maps by computing attention weights across them. These weights are determined using statistical properties, such as the mean and standard deviation, of the input feature maps and are applied to enhance relevant features.
39
The functionality of the CAI module can be expressed mathematically as follows:

Here
Squeeze-excitation attention integration
The SEAI module emphasizes channel-wise attention, allowing the model to dynamically recalibrate feature maps.
41
The module carries out two main operations: aggregation of global spatial information and recalibration of features across channels. For an input feature map 


Here
Matthews-correlation-coefficient weighted averaging
We introduced a new ensemble learning method called Matthews-correlation-coefficient weighted averaging (MWA), which assigns proportional weights to predictions from multiple classifiers based on their Matthews correlation coefficient (MCC) performance. Unlike accuracy-based or loss-based metrics, MCC provides a balanced evaluation of classifier quality even in cases of class imbalance. By emphasizing classifiers with higher MCC values, the MWA method ensures that the ensemble leverages models that provide stronger overall consistency in predicting both positive and negative classes.
Step 1: Evaluating classifier performance
The first step involves measuring the performance of each classifier using the MCC. MCC is widely regarded as one of the most informative metrics for binary classification, as it takes into account true positives (TP), true negatives (TN), false positives (FP), and false negatives (FN) in a balanced manner. The MCC score is calculated as follows:
The resulting MCC value ranges from
This property makes MCC particularly suitable for imbalanced classification problems, where simple accuracy may be misleading.
Step 2: Computing ensemble weights
Once MCC values are obtained for each model, they are shifted to ensure non-negativity so that proportional weights can be assigned. This prevents negative MCC values from adversely affecting ensemble contributions. The normalized ensemble weights are computed as follows:
where
Step 3: Generating ensemble predictions
The ensemble predictions are generated through the weighted averaging of each classifier’s probabilistic outputs. Let 
where
By proportionally emphasizing classifiers that demonstrate a higher correlation between predictions and actual outcomes, the MWA technique strengthens both the robustness and generalization of the ensemble. A graphical overview of this process is provided in Figure 8.

Logarithmic loss-based weighted ensemble in layer
Justification of proposing MWA
The MWA method is introduced to provide a principled and reliable ensemble weighting strategy for class-imbalanced medical image classification tasks. Conventional ensemble techniques, such as the majority voting and simple weighted averaging, typically rely on heuristic or manually assigned weights and do not guarantee an optimal or performance-aware weighting of individual models. Similarly, probabilistic or accuracy-based weighting methods, including Bayesian model averaging, are often biased toward the majority classes and may yield misleading importance estimates in imbalanced datasets. 43
In contrast, the MCC offers a comprehensive performance measure by simultaneously incorporating true positives, true negatives, false positives, and false negatives into a single statistic. Unlike accuracy or confidence-based metrics, MCC remains robust under severe class imbalance, which is a common characteristic of skin lesion datasets. Therefore, using MCC as the basis for model weighting enables a fair and discriminative assessment of each classifier’s true predictive capability.
The proposed MWA strategy leverages MCC values to automatically assign higher weights to consistently reliable models while suppressing the influence of poorly performing ones. Within the multi-level ensemble architecture, MWA is applied hierarchically, allowing model contributions to be refined progressively across successive layers. This hierarchical weighting mechanism addresses the limitations of single-stage ensemble methods, enhances robustness against class imbalance, and leads to improved generalization and predictive performance.
Multi-level MWA
The multi-level MWA method extended the MWA technique across two distinct layers, enabling a more refined and hierarchical emphasis on the strengths of individual models. This multi-level strategy addressed a critical challenge in single-level ensembling: the difficulty in adequately highlighting superior models due to relatively low individual classifier weights. By adopting a sequential “Layer-by-Layer” ensembling approach, this method progressively prioritized high-performing models at each layer, amplifying their influence in subsequent layers. A generic visual representation of the multi-level MWA framework is provided in Figure 9.

Structure of the multi-level Matthews-correlation-coefficient weighted averaging (MWA) framework.
MWA in Layer 1
In the first layer, we ensembled the predictions to generate pre-final predictions using three core HASE approaches: HASE: serial stacked attention (SSA), HASE: parallel stacked attention (PSA), and HASE: independent stacked attention (ISA). These approaches were applied to eight customized versions of pre-trained models, resulting in a total of 24 initial predictions. For the ISA approach specifically, a pre-layer combination step was introduced to aggregate the attention-integrated results for each model before proceeding to the ensembling process in Layer 1. This step ensured that the attention mechanisms were effectively integrated into the ensemble.
MWA in Layer 2
The predictions from Layer 1, reduced to three consolidated outputs (SSA, PSA, and ISA), were further ensembled in Layer 2. This final ensembling step combined the strengths of the three HASE approaches, producing the ultimate prediction output, denoted as “HASE.” This hierarchical approach enhanced the robustness and accuracy of the ensemble by iteratively refining the influence of high-performing models across layers.
Pseudocode for MWA
Matthews-Correlation-Coefficient alg:mcc Weighted Averaging (MWA)

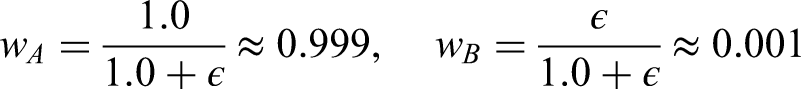
Numerical example of MCWE
Consider a binary classification problem withtwo models and three test samples in Table 2.


Experimental results and analysis
This section provides a detailed evaluation of the classification performance of the proposed methodology. The analysis includes both quantitative metrics and visual interpretations to demonstrate the effect of employing MWA on enhancing the predictive capabilities of the HASE architectures. Through a variety of experimental results—covering multiple evaluation metrics, graphical representations, and confusion matrices—we offer a thorough comparison of the different approaches discussed in the previous sections.
Performance evaluation metrics
To comprehensively evaluate the performance of our models, several key metrics were employed: accuracy, precision, recall (sensitivity), F1-score, specificity, and ROC-AUC (receiver operating characteristic area under the curve). These metrics provided essential insights into the classification capabilities of the models. Each metric was calculated based on the confusion matrix, which classified predictions as true positives (TP), false positives (FP), true negatives (TN), and false negatives (FN).
44
The mathematical definitions of these metrics are as follows:

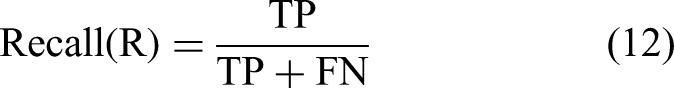
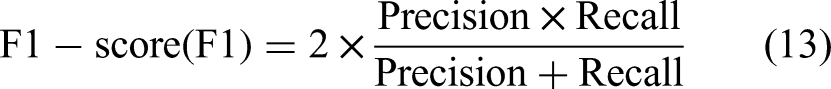


Using these performance metrics, we obtained a clearer picture of how well our models generalize across different classification scenarios. This evaluation helped identify both the strengths and limitations of each approach, guiding further improvements for practical deployment.
Experimental setup
The complete framework was executed within a Kaggle notebook environment, utilizing a GPU P100 alongside a dual-core Intel Xeon CPU with a processing speed of 690 ms/step. The dataset consisted of distinct lesion images, resized to
Model training was carried out over 100 epochs with a batch size of 16. The Adam optimizer was employed with an initial learning rate of 0.0001, and categorical cross-entropy was used as the loss function to support multi-class classification. To prevent overfitting and improve generalization, early stopping was applied using the Reduce-on-Plateau method, with a patience of 50 epochs.
This section examined both theoretical considerations and empirical results to evaluate classification performance. The main goal was to demonstrate the effect of MWA on enhancing the predictive accuracy of HASE architectures. By presenting experimental outcomes—including a comprehensive set of evaluation metrics, ROC-AUC curves, and confusion matrices—a detailed comparison of the various methodologies introduced earlier was achieved.
Although the proposed framework integrates multiple models and ensembling stages, it does not incur significant computational overhead, as all base models are independent and can be trained in parallel. More precisely, The seven ENv1 variants with three attention modules are considered as base models that can be run in parallel. Consequently, the overall training time is bounded by the most computationally intensive model (SA_ENb7, 997 seconds per epoch), while the remaining models require less time. The ensemble stage operates in constant time due to the fixed number of layers. Furthermore, early stopping and learning rate scheduling were applied to mitigate overfitting and ensure robust generalization.
Trainable parameters
As our ensemble strategy was implemented at the prediction stage, the total number of trainable parameters remained unchanged after ensembling. In contrast, during the stacking phase, where models were integrated prior to training, the overall parameter count increased substantially. Table 4 presents a detailed summary of the trainable parameters for each model.
Hyperparameter selection
Hyperparameter tuning is essential for maximizing model performance, often resulting in gains beyond baseline expectations.46,47 In this work, hyperparameters were carefully selected through a manual tuning procedure, guided by empirical observations and established DL practices. Key parameters such as learning rate, batch size, kernel sizes, and activation functions were systematically adjusted to improve performance while preventing overfitting. This meticulous tuning, informed by extensive experimentation, ensured a balance between computational efficiency and optimal classification outcomes.
A learning rate of 0.0001 was used with the Adam optimizer, enabling precise weight updates necessary for navigating the complex optimization space. Batch normalization was applied to stabilize training, enhance convergence speed, and reduce overfitting. The “he_normal” kernel initializer was employed to maintain proper gradient flow and support effective weight initialization. Additionally, the ReLU activation function was utilized to capture complex data patterns, further improving the model’s classification accuracy.
Performance analysis of the four augmentation strategies to determine the optimal approach
As previously described, four data augmentation strategies were implemented to address class imbalance. NA: The dataset remained unmodified, using only the original images without generating any synthetic samples. PrA: synthetic images were created before dataset splitting, which could result in overlaps where both original and augmented images from the same source appeared in training, validation, and testing subsets. TDA: Augmentation was applied solely to the training subset, keeping the validation and testing sets fully independent. PoA: augmentation was carried out separately on each subset—training, validation, and testing—after splitting, thereby expanding the dataset size across all partitions.
These augmentation strategies were applied to customized pre-trained EfficientNetV1 models. Tables 5 and 6 report the performance metrics on both the testing dataset and the reserved independent testing set, enabling the identification of the most effective augmentation approach.
Although PrA achieved near-perfect test accuracies (e.g. PrA_ENb0: 98.11% on test data), its performance dropped considerably on independent testing data, exposing limitations in generalization. For example, PrA_ENb0 declined from 98.11% to 91.43% on independent testing—a decrease of 6.68%—whereas TDA_ENb0 maintained 90.10%, demonstrating better robustness. Similarly, PrA_ENb3 decreased by 6.61% (97.55%
These results emphasize TDA’s ability to prevent overfitting, while PrA’s high test scores diminished when evaluated on independent data. The instances where TDA’s independent accuracy exceeded its test accuracy (e.g. TDA_ENb2: +1.87%) further confirm its superior generalization capability.
While the NA strategy showed some gains over earlier results (e.g. NA_ENb0: 90.58% on independent data), it was generally outperformed by TDA. For example, TDA_ENb0 achieved 90.10% on independent testing, slightly higher than NA_ENb0 (90.58%), and larger differences were observed for models such as TDA_ENb4 (91.06% vs. NA_ENb4: 88.77%). The persistent class imbalance continued to impact NA’s precision and recall, as seen in NA_ENb3 (F1-score: 88.80% compared to TDA_ENb3: 90.35%).
These results confirm TDA as the most effective augmentation strategy. Although PrA’s high test accuracies may appear attractive, the sharp declines on independent data (e.g. PrA_ENb0:
Performance analysis of HASE architectures in ML-MWA
The MWA was applied to the outputs of all classifiers at each layer, denoted as
HASE architectures in MWA_Layer 1 on testing data
The effectiveness of the SSA architectures at
Performance evaluation of serial stacked attention on testing data in MWA_Layer 1.
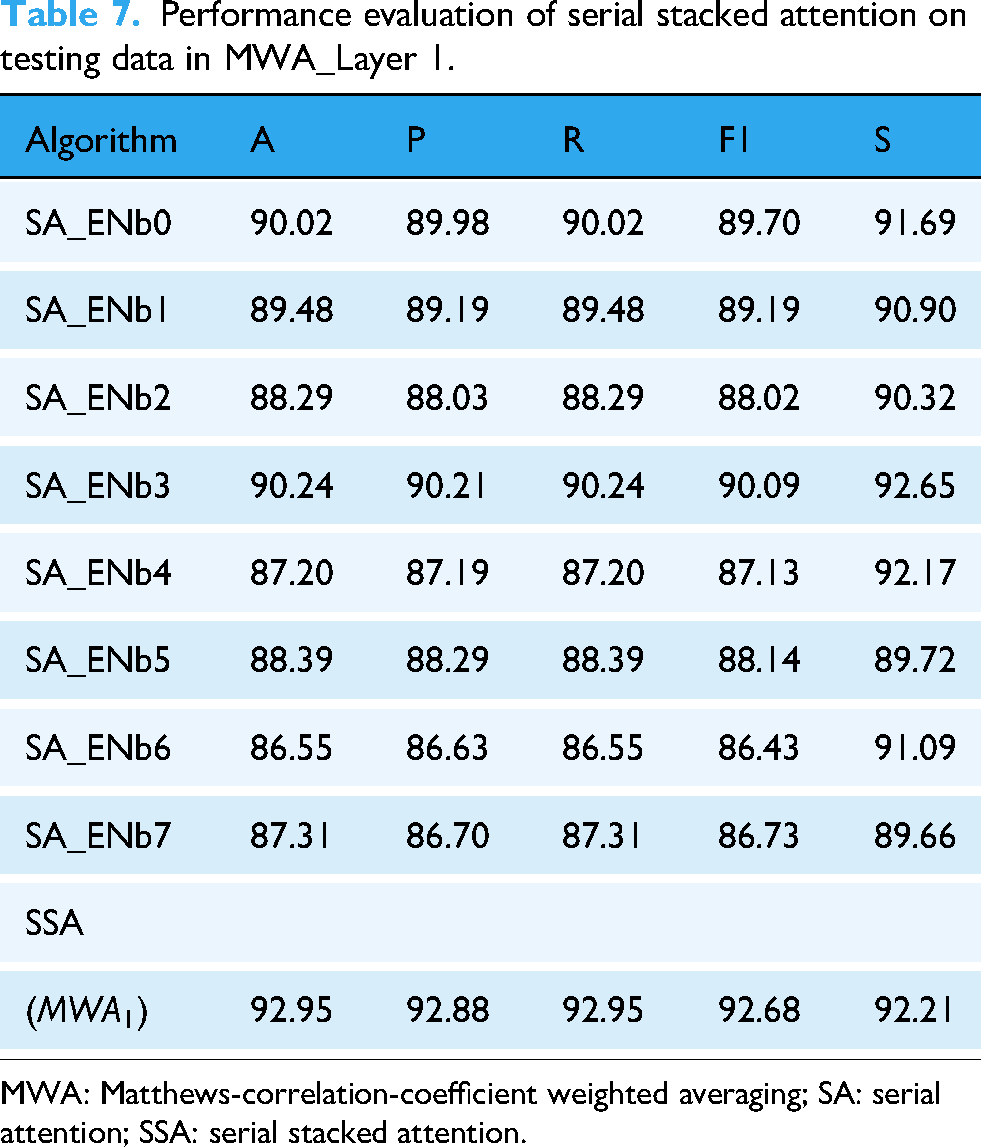
MWA: Matthews-correlation-coefficient weighted averaging; SA: serial attention; SSA: serial stacked attention.
The ensembled SSA architecture at
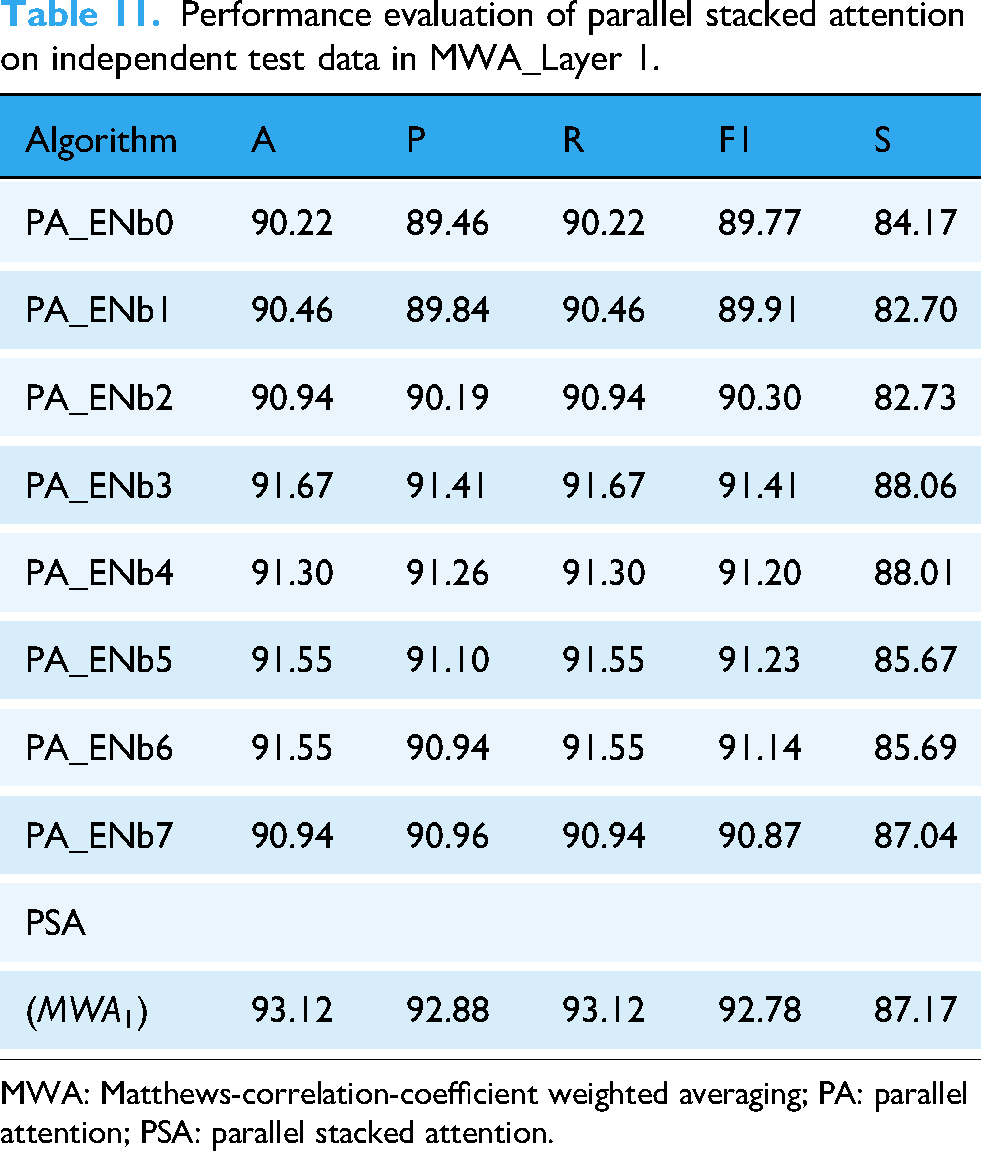
The performance of the parallel stacked attention (PSA) architectures at
Performance evaluation of parallel stacked attention on testing data in MWA_Layer 1.

MWA: Matthews-correlation-coefficient weighted averaging; PA: parallel attention; PSA: parallel stacked attention.
The ensembled PSA architecture at
For evaluating the performance of HASE: ISA in Layer 1, the results of attention-integrated networks were first ensembled for each EfficientNetV1 variant. In the pre-Layer 1 stage, the outputs of the TA mechanisms were combined, producing seven results per architecture. These were subsequently ensembled into a single ISA outcome. Detailed metrics of this ensembling process are presented in Table 9.
Performance evaluation of independent attention on testing data in MWA_Layer 1.

SAI: soft attention integration; CAI: channel attention integration; SEAI: squeeze- excitation attention integration; IA: independent attention; ISA: independent stacked attention; MWA: Matthews-correlation-coefficient weighted averaging.
The table illustrates performance metrics for each TA mechanism and their ensembled results for the respective architectures independent attention (IA). For example, IA_ENb2 achieved an accuracy of 89.70%, precision of 89.53%, and recall of 89.70%, with an F1-score of 89.35% and specificity of 88.72%. Similarly, IA_ENb0 and IA_ENb1 recorded accuracies of 88.50% and 88.72%, respectively. The ISA architecture at
This process demonstrated that ensembling the TA mechanisms significantly enhanced model performance, with the ISA architecture at
HASE architectures in MWA_Layer 1 with independent testing data
The performance of the HASE architectures in
Performance evaluation of serial stacked attention on independent test data in MWA_Layer 1.

MWA: Matthews-correlation-coefficient weighted averaging; SA: serial attention; SSA: serial stacked attention.
Performance evaluation of parallel stacked attention on independent test data in MWA_Layer 1.
MWA: Matthews-correlation-coefficient weighted averaging; PA: parallel attention; PSA: parallel stacked attention.
Performance evaluation of independent attention on independent test data in MWA_Layer 1.

SAI: soft attention integration; CAI: channel attention integration; SEAI: squeeze- excitation attention integration; IA: independent attention; ISA: independent stacked attention; MWA: Matthews-correlation-coefficient weighted averaging.
Table 10 showcases the performance of the SSA architectures across various models. For example, SA_ENb0 achieved an accuracy of 90.46%, with precision and recall values of 89.69% and 90.46%, respectively. Similarly, SA_ENb1 demonstrated strong performance with an accuracy of 91.91%, precision of 91.56%, and recall of 91.91%. The ensembled SSA mechanism in
Table 11 presents the results for the PSA architectures. PA_ENb1 and PA_ENb2 achieved accuracies of 90.46% and 90.94%, respectively, with balanced precision and recall values. PA_ENb3 also performed well, achieving an accuracy of 91.67% and an F1-score of 91.41%. The ensembled PSA mechanism in
Table 12 highlights the performance of the ISA architectures, which combined the strengths of each attention mechanism individually. For instance, IA_ENb3 achieved an accuracy of 91.79%, precision of 91.56%, and recall of 91.79%. Similarly, IA_ENb6 demonstrated strong performance with an accuracy of 91.79%, precision of 91.54%, and recall of 91.79%. The ensembled ISA mechanism in
The evaluation of HASE architectures on independent test data revealed that all three architectures—SSA, PSA, and ISA—delivered strong performance, with the ISA architectures achieving the highest accuracy and F1-score. These results demonstrate the robustness of the MWA framework in effectively combining different attention strategies to enhance model performance on unseen data.
HASE architectures in MWA-Layer 2
The performance of the HASE architecture at MWA_Layer 2 was comprehensively evaluated through Tables 13 and 14, which present the results from the final ensembling layer. These tables demonstrate the effectiveness of combining multiple attention mechanisms in a hierarchical framework to achieve superior classification performance.
Performance evaluation of HASE on test data in MWA_Layer 2.

SSA: serial stacked attention; PSA: parallel stacked attention; ISA: independent stacked attention; MWA: Matthews-correlation-coefficient weighted averaging; HASE: hierarchical attention stacked ensemble.
Performance evaluation of HASE on independent test data in MWA_layer 2.

SSA: serial stacked attention; PSA: parallel stacked attention; ISA: independent stacked attention; MWA: Matthews-correlation-coefficient weighted averaging; HASE: hierarchical attention stacked ensemble.
Table 13 reveals the comparative performance of the three pre-final architectures before final ensembling. The SSA achieved an accuracy of 92.95% with an F1-score of 92.68, while the PSA showed slightly lower performance at 92.41% accuracy. The ISA demonstrated competitive results with 91.65% accuracy and an F1-score of 91.29. These metrics establish a performance baseline for the individual components prior to their integration in the final layer.
The power of the HASE ensemble became evident as the combined architecture outperformed all previous layer architectures. With 93.17% accuracy, 93.09% precision, and a 92.90 F1-score, HASE demonstrated the synergistic effect of integrating multiple attention strategies. The high specificity of 93.01% further confirmed the model’s ability to correctly identify the majority of samples, showcasing balanced performance across all evaluation metrics.
Table 14 presents the crucial validation of these architectures on independent test data, providing a rigorous assessment of generalization capability on completely unseen data. The pre-final architectures maintained strong performance, with SSA leading at 93.48% accuracy, closely followed by PSA at 93.12% and ISA at 93.84%. This consistency between validation and independent test results confirmed the robustness of each attention approach when faced with unseen data.
The most significant achievement emerged in the final HASE ensemble performance on independent data, achieving 93.96% accuracy and a 93.71 F1-score. This represented a measurable improvement over any single attention mechanism, demonstrating that hierarchical ensembling successfully captured the complementary strengths of each approach. The model maintained high precision (93.77%) and recall (93.96%), indicating balanced performance without significant trade-offs among different evaluation metrics.
These results collectively demonstrated that the MWA framework’s layered approach to integrating attention mechanisms yielded substantial benefits. By progressively combining SSA, PSA, and ISA through hierarchical ensembling, the final HASE architecture achieved superior performance that exceeded what any single attention mechanism or stacking architecture could accomplish independently. The consistent results across both validation and independent test sets provided strong evidence of the model’s robustness and generalization capability in complex classification tasks.
Notably, the performance on unseen independent data slightly surpassed or matched that on the standard testing data, indicating that the architecture is highly reliable and can be effectively employed for real-world skin lesion identification.
Results with confidence interval (CI)
The comparative performance of the pre-final and final layers of the proposed architecture is summarized in Table 15, where each metric is reported with its corresponding 95% CI based on a test size.
Performance metrics of pre-final and final layers with 95% confidence intervals.
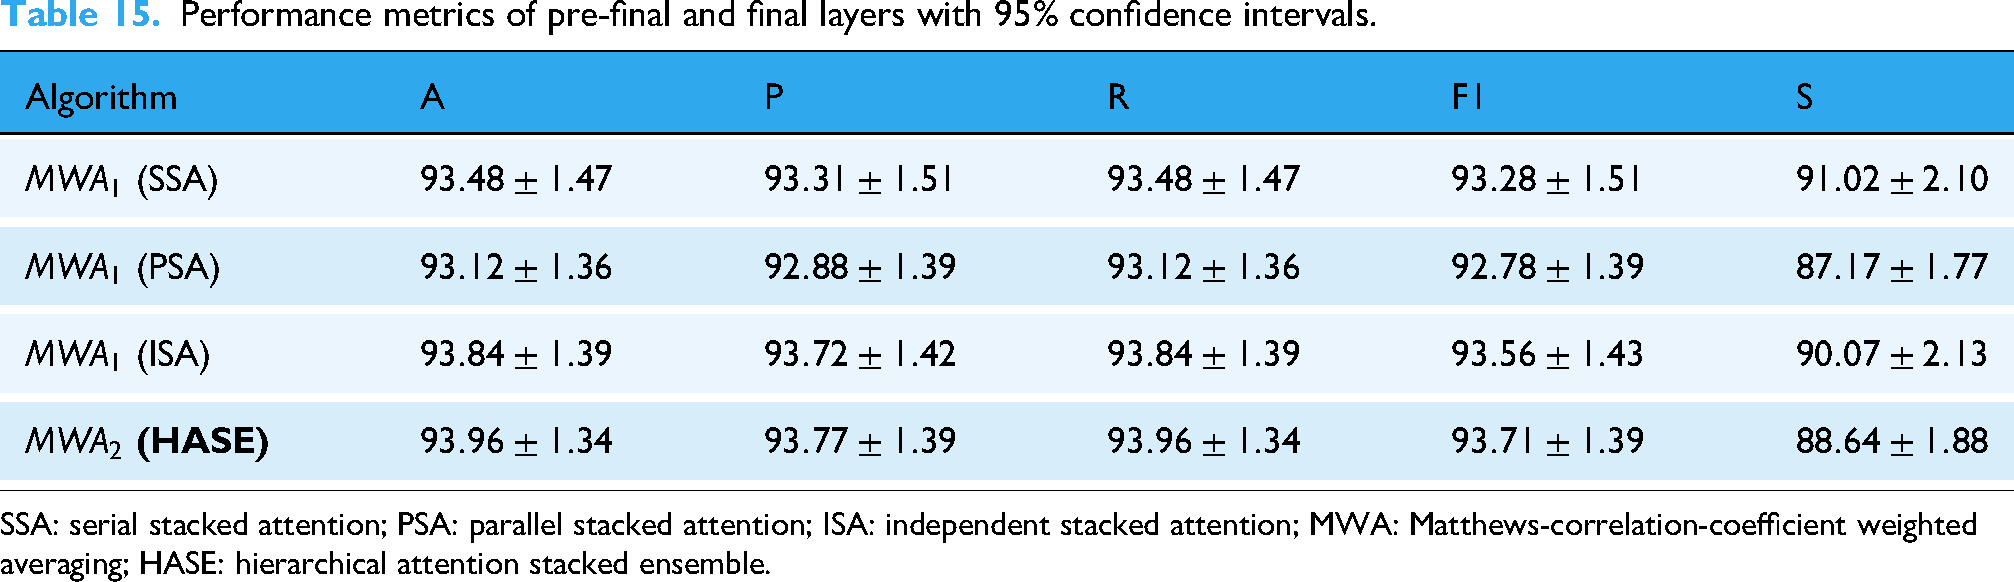
SSA: serial stacked attention; PSA: parallel stacked attention; ISA: independent stacked attention; MWA: Matthews-correlation-coefficient weighted averaging; HASE: hierarchical attention stacked ensemble.
Performance analysis by visualization
To streamline the analysis, confusion matrices were not presented for every classifier due to the diversity of models. Instead, we focused on the final layer of the MWA model, with the corresponding confusion matrices shown in Figures 10 and 11, effectively highlighting per-class accuracy and misclassification rates.

Confusion matrix and ROC-AUC curve obtained by HASE architecture in MWA-Level 2: (a) confusion matrix and (b) ROC-AUC curve. ROC-AUC: receiver-operating characteristic curve area under the curve; MWA: Matthews-correlation-coefficient weighted averaging; HASE: hierarchical attention stacked ensemble.

Confusion matrix and ROC-AUC curve obtained by HASE architecture in MWA-Layer 2 on independent test data. (a) Confusion matrix and (b) ROC-AUC curve. ROC-AUC: receiver-operating characteristic curve area under the curve; MWA: Matthews-correlation-coefficient weighted averaging; HASE: hierarchical attention stacked ensemble.
Similarly, ROC-AUC curves were examined to provide additional insights into model performance. Consistent with the confusion matrices, we presented ROC-AUC curves only for the ML-MWA model in Figures 10 and 11 for uniformity.
The final HASE architecture (
The ROC-AUC scores further highlighted the effectiveness of the HASE (
The HASE (
The VASC class achieved near-perfect accuracy, correctly classifying nine out of 10 samples with only one error and attaining a flawless AUC of 1. Similarly, the DF class performed exceptionally well, accurately identifying four out of six samples, with just two misclassifications, and achieving an outstanding AUC of 0.996.
The AK class showed a moderately balanced outcome, with 14 correct classifications and nine misclassifications, yet maintained a strong AUC of 0.988, reflecting solid discriminative ability. The NV class excelled, correctly classifying 654 out of 663 samples and achieving an AUC of 0.992, demonstrating robust handling of both majority and minority classes.
The BKL class performed strongly, correctly identifying 58 out of 66 samples with a high AUC of 0.986. The BCC class followed closely, correctly classifying 18 out of 26 samples while attaining a robust AUC of 0.993.
Finally, the MEL class, which presented the greatest classification challenge, still achieved 21 correct classifications out of 34 samples, with an AUC of 0.974—demonstrating an improvement over previous architectures.
Overall, the HASE (
GradCAM for interpretability
The obtained gradients were then globally averaged to produce neuron importance weights, which were subsequently multiplied with the corresponding feature maps of the convolutional layer. The resulting weighted combination was passed through a ReLU activation to generate the final class-specific heatmap. This heatmap was then upsampled to match the input image dimensions and overlaid on the original image, visually highlighting the regions that contributed most significantly to the model’s prediction.
Figure 12 presents representative GradCAM visualizations for selected classes in the HAM10000 dataset. These visualizations revealed that the HASE (

Step-by-step implementation of gradient class activation map.
The gradients were spatially pooled by averaging across each feature map channel to determine their relative importance for the target class. These pooled gradients were then used to weight the activation maps of the final convolutional layer, and the resulting weighted activations were aggregated to produce a class-specific activation heatmap. The heatmap was normalized to a [0, 1] range to enhance visualization and overlaid on the original input image using a colormap, clearly highlighting the regions that influenced the model’s classification decision.
To evaluate the model’s attention across different categories, GradCAM visualizations were generated for representative images from each class. The resulting heatmaps demonstrated that the model effectively focused on salient regions, such as lesions in medical images, thereby confirming its ability to extract clinically meaningful features.
However, GradCAM has inherent limitations. Because it relies on the model’s predictions, misclassifications can yield misleading heatmaps. Furthermore, for complex or subtle patterns—such as ambiguous skin lesions—GradCAM may occasionally highlight irrelevant regions, potentially reducing interpretability. These limitations underscore the importance of complementing GradCAM with rigorous quantitative evaluations to ensure reliable and trustworthy model insights.
In Figure 13, GradCAM visualizations are presented for all seven classes, illustrating how the model selectively focused on the most discriminative regions rather than the entire image. This targeted attention contributed to enhanced classification accuracy and highlighted the effectiveness of our approach. The figure displays the original image alongside the corresponding GradCAM and region of interest (ROI), providing clear interpretability of the model’s decision-making process.

GradCAM visualization for each class: (a, d, g, j, m, p, s) NV: nevus; MEL: melanoma; BKL: benign keratosis; BCC: basal cell carcinoma; AK: actinic keratosis; VASC: vascular lesions; and DF: dermatofibroma, (b, e, h, k, n, q, t) GradCAM: gradient class activation map, and (c, f, i, l, o, r, u) ROI: Region of Interest.
A key advantage of GradCAM is its ability to validate model reliability. When the heatmap aligns with the relevant region, it reflects an accurate classification, whereas misaligned heatmaps often indicate misclassifications. By integrating multiple models through our multi-level MWA ensemble, the final predictions achieved superior accuracy. The GradCAM visualizations corroborated this improvement, demonstrating that the ensemble effectively compensated for the limitations of individual classifiers. This emphasizes the superiority of the proposed multi-level MWA framework, showcasing its ability to produce precise predictions even in challenging cases, thereby reinforcing the contribution of our methodology.
Answers to the RQs
Discussion and extended comparison
Our research demonstrated the advantages of combining HASE architectures with the multi-layer MWA ensemble strategy to improve classification outcomes. Through careful data preprocessing, strategic augmentation, and fine-tuning of pre-trained models, we successfully mitigated class imbalance issues and enhanced the extraction of discriminative features, leading to significant improvements in overall model performance.
To optimize feature representation, we employed a TA mechanism that integrates SAI, CAI, and SEAI. This mechanism was incorporated via three specialized stacking strategies: SSA, PSA, and ISA. By leveraging both shallow and deep features, these approaches enabled the construction of a highly effective and flexible architecture. In addition to pre-prediction stacking, post-prediction ensembling across multiple layers further refined the model’s predictions, enhancing accuracy and robustness.
The final evaluation at MWA-Layer 2 highlighted the effectiveness of this hierarchical ensembling framework. The HASE model achieved a notable accuracy of 93.96%, outperforming prior approaches and validating the efficacy of our multi-layer MWA design. Moreover, a high specificity of 88.64% confirmed the model’s ability to correctly identify non-target classes, ensuring consistent and reliable performance across diverse evaluation metrics.
These results affirmed the effectiveness of our methodological framework, highlighting the successful integration of sophisticated attention modules, stacking architectures, and multi-layer ensemble strategies. The observed improvements across performance metrics underscored the model’s capability to produce accurate and generalizable predictions, positioning it as a noteworthy advancement in the field of image classification.
Even in the presence of multiple baseline classifiers, our carefully designed framework consistently outperformed existing approaches, demonstrating superior accuracy, robustness, and reliability across evaluation measures. A comprehensive comparison of our proposed model with prior studies is provided in Table 16, with particular emphasis on research leveraging the HAM10000 dataset.
Comparison of our proposed architecture with existing others.

Additionally, we benchmarked our proposed architecture against contemporary state-of-the-art approaches to demonstrate its comparative advantage. As illustrated in Table 17, our customized model consistently surpassed existing techniques, offering compelling evidence of its efficacy and robustness.
Comparison of our proposed architecture with state-of-the-art methods.

ML-MWA: multi-level Matthews-correlation-coefficient weighted averaging.
Limitations of the study
Although the proposed methodology achieved strong performance in image classification, certain limitations should be acknowledged to inform future improvements:
Computational overhead
The multi-layered MWA framework, while effective, introduces considerable computational demands due to its reliance on multiple HASE architectures and iterative ensemble processing. Both training and inference are impacted by the need to coordinate diverse attention mechanisms and base classifiers, posing challenges for large-scale datasets or environments with limited computational resources.
Dependence on similar base classifiers
The success of the MWA approach depends on the similarity of its constituent models. Using similar or homogeneous architectures may lead to redundant feature representations, thereby limiting ensemble gains. Although this study leverages diverse HASE variants (SSA, PSA, and ISA) to mitigate this risk, incorporating additional architectural or algorithmic diversity could further improve robustness.
Dataset-specific generalization
The evaluation is based on a single benchmark dataset, which may contain domain-specific biases or distributional characteristics not representative of broader settings. Consequently, the model’s performance might decline when applied to cross-domain data, such as variations in imaging protocols, lesion types, or patient demographics.
Future work and research directions
The limitations highlighted in this study also suggest several promising directions for extending the proposed framework’s applicability, efficiency, and robustness. Three primary avenues for future research are outlined below:
Optimizing computational efficiency
Future studies could aim to reduce the computational demands of the multi-layer MWA framework while preserving its ensemble advantages. Strategies may include knowledge distillation to compress multiple HASE architectures into more compact models, dynamic pruning of redundant classifiers during inference, and hardware-aware parallelization to maximize resource utilization. Additionally, adaptive layer depth—where the number of ensembling layers is determined based on dataset complexity—could provide a balanced trade-off between computational cost and performance, facilitating deployment in real-world scenarios.
Enhancing base classifier diversity
To address reliance on manual architectural selection, automated approaches for promoting classifier heterogeneity could be explored. Potential methods include incorporating adversarial decorrelation losses during base model training to reduce redundant feature learning, and leveraging neural architecture search (NAS) to discover optimal combinations of attention mechanisms and transfer learning models. Furthermore, hybrid ensembles that integrate CNNs with transformer-based models or graph neural networks could enrich feature representations, particularly for rare or morphologically complex lesion categories.
Cross-domain generalization and robustness
To enhance the framework’s applicability beyond a single dataset, future work should focus on validating performance across multi-center datasets with diverse imaging protocols, patient demographics, and lesion distributions. Incorporating domain adaptation techniques and evaluating on heterogeneous datasets will help address distribution shifts and improve generalizability. Establishing collaborative benchmarking with clinical partners can create standardized evaluation protocols, particularly for challenging scenarios such as low-quality images or streaming data with class imbalance. Additionally, integrating uncertainty quantification into the MWA ensemble weighting process could enhance reliability in ambiguous cases, supporting greater trust and adoption in clinical settings.
Conclusion
This work proposed a comprehensive framework for image classification by combining HASE architectures with a multi-level MWA (ML-MWA) strategy. The methodology commenced with thorough data preprocessing and the evaluation of four augmentation strategies, selecting the most effective approach based on performance on independent test data. This step ensured that the HASE models were trained efficiently and generalized well.
To improve feature representation and discrimination, three attention-based stacking mechanisms were incorporated: SSA, PSA, and ISA. Each stacking variant contributed complementary strengths to the model, and their outputs were subsequently fused through the proposed MWA ensemble to optimize prediction performance.
The multi-level MWA framework employed a two-tier sequential refinement process, leveraging the complementary capabilities of individual HASE models. This iterative ensembling approach led to a highly robust classification model, achieving substantial improvements in accuracy and reliability across all evaluation metrics.
Detailed GradCAM visualizations further highlighted the interpretability of the proposed framework, providing insights into the regions driving the model’s predictions and confirming its practical relevance. The method established new benchmarks in TL performance, particularly within medical imaging applications. Notably, its capability to support early and accurate diagnosis of skin lesions underscores its potential to enhance patient care and broaden access to reliable diagnostic tools.
Footnotes
Acknowledgements
The authors would like to express their sincere gratitude to their parents for their continuous support and encouragement.
Ethical approval
This study was conducted in compliance with ethical standards, ensuring proper copyright adherence and attribution. The dataset used in this research is publicly available under the CC BY-NC-4.0 license, and it has been utilized with appropriate attribution.
Consent to participants
Informed consent was originally obtained from all individual participants by the creators of the dataset.
Consent to publication
All authors have provided their consent for publication in this journal (Digital Health, Sage). No additional consent is required beyond the authors’ approval.
Author contributions
All authors have read and approved the final manuscript.
Funding
The authors received no financial support for the research, authorship, and/or publication of this article.
Declaration of conflicting interests
The authors declared no potential conflicts of interest with respect to the research, authorship, and/or publication of this article.
Guarantor
All authors accept full responsibility for the integrity of the data and the accuracy of the data analysis, and confirm that they had full access to all data used in the study.
Data availability statement
All data used in this study, including the augmented training dataset, are publicly available in the Kaggle repository: [HAM10000 Dataset]. 35
The use of the HAM10000 dataset 34 complies with the Creative Commons Attribution-NonCommercial 4.0 International License. Proper attribution has been provided, and the recommended citation of the original dataset publication has been included, thereby fulfilling the license requirements. Furthermore, the dataset has been used strictly for non-commercial research purposes in accordance with the license terms.
The source code developed for this study is available from the corresponding author upon reasonable request.