
Abstract
Objective
Parkinson's disease (PD) is a progressive neurodegenerative disorder in which early diagnosis remains difficult due to subtle and heterogeneous symptoms. Speech impairments, particularly hypokinetic dysarthria, often appear early and offer promise as non-invasive biomarkers for detection. This study investigates whether quantitative speech-derived acoustic features can serve as reliable, non-invasive biomarkers for early detection of PD by analysing dysphonia measures extracted from sustained phonation recordings.
Method
A two-pronged analytical framework was used. First, exploratory data analysis was performed on 16 dysphonia features from 5875 sustained phonation samples collected from 42 individuals with idiopathic PD to examine feature distributions, correlations, and redundancies. Second, principal component analysis was applied to address multicollinearity among vocal features, and the resulting components were used as predictors in multiple regression-based machine learning models. Ensemble, kernel-based, and linear models were compared using standard metrics.
Result
Ensemble models delivered the strongest predictive performance. Random forest explained 91% of variance (R2 = 0.910 for motor Unified Parkinson's Disease Rating Scale (UPDRS); 0.901 for total UPDRS), with root mean squared error (RMSE) = 2.39 and 8.33 and mean absolute error (MAE) = 1.85 and 6.95, respectively. Gradient boosting explained 90% of variance (R2 = 0.900 for motor and total UPDRS), with RMSE = 2.52 and 8.42, and MAE = 1.86 and 7.14. Linear models performed substantially worse, consistently yielding R2 < 0.12, indicating limited ability to capture nonlinear patterns in dysphonia characteristics.
Conclusion
Speech-derived acoustic biomarkers, when paired with machine learning, especially ensemble methods, show strong potential for accurate, scalable, and cost-effective assessment of PD severity. These findings highlight the potential of speech-derived acoustic biomarkers, coupled with machine learning, as scalable, cost-effective, and objective tools for improving diagnostic precision and enabling earlier intervention in PD.
Introduction
In spite of major advances in medicine, neurodegenerative diseases remain difficult to treat effectively.1,2 Parkinson's disease (PD) is particularly debilitating, affecting millions worldwide and placing a heavy burden on patients, caregivers, and healthcare systems. 3 It is a progressive disorder characterized by tremors, rigidity, and bradykinesia, caused by the gradual loss of motor control.4,5 Despite advances in neuroscience, diagnosis continues to rely on motor symptoms that appear only after significant neurodegeneration, limiting opportunities for timely intervention. 6
Early detection is hindered by PD's complex and heterogeneous presentation. Prodromal signs are subtle and often overlooked,7,8 while conventional diagnostic tools like neurological exams, imaging, and patient history exist, they lack sensitivity at the earliest stages. 9 Addressing this gap requires sensitive, accessible, and non-invasive biomarkers capable of identifying disease before motor deficits emerge.10,11
Speech has emerged as a promising biomarker. 12 Because it relies on fine motor control of respiratory, phonatory, and articulatory systems, speech is often affected early in PD.13,14 Hypokinetic dysarthria manifesting as reduced loudness, monotone pitch, and imprecise articulation can precede overt motor symptoms. Acoustic features such as jitter, shimmer, pitch variability, and harmonics-to-noise ratios capture these deviations, providing objective measures of early impairment.15,16
Although studies show promise, speech-based assessment is not yet routine in clinical practice. Challenges remain in distinguishing pathological changes from natural inter-speaker variability, and traditional acoustic analysis methods have limited sensitivity and scalability.17–19 Here, machine learning (ML)20,21 and artificial intelligence (AI) 22 offer opportunities to overcome these barriers by identifying subtle, nonlinear patterns in high-dimensional speech data. ML models have demonstrated utility in predicting Unified Parkinson's Disease Rating Scale (UPDRS) scores and distinguishing PD patients from controls with high accuracy.23,24
The integration of ML into speech analysis offers three advantages: (1) discovery of latent patterns linked to disease onset and progression, (2) scalable and automated analysis of large datasets, and (3) development of cost-effective tools for continuous monitoring, supporting personalized and remote healthcare.25–28 Predicting UPDRS scores extends speech biomarkers beyond diagnosis, enabling longitudinal monitoring and individualized treatment.28–30
This study addresses the critical need for early and reliable diagnostic methods in PD by systematically analysing acoustic features and applying ML models. The methodology combines exploratory data analysis 31 with a diverse set of algorithms32,33 such as support vector machines, random forests, and gradient boosting to classify PD and predict clinical scores. Performance is evaluated using established metrics. The aim is not only to improve diagnostic accuracy but also to explore the feasibility of personalized monitoring.
The significance of this work lies in its potential to address the long-standing challenge of delayed PD diagnosis. By demonstrating that subtle speech alterations, when analysed through advanced computational methods, can serve as reliable early biomarkers, the study aligns with broader advances in precision medicine and digital health. Speech-based assessment is inherently non-invasive, cost-effective, and suitable for continuous home-based monitoring, making it particularly valuable in resource-limited settings. When integrated into clinical practice, such tools could facilitate earlier detection, more precise tracking of disease progression, and better-informed treatment strategies. Ultimately, this research contributes to the development of innovative diagnostic frameworks that leverage AI and ML to reshape PD management and improve patient outcomes.
Review of literature
As a neurodivergent disorder, PD is characterized by the progressive degeneration of specific populations of neurons that are particularly vulnerable, distinguishing them from conditions where neuronal loss results from acute metabolic or toxic insults. 34 Clinical manifestations typically emerge once 60%–80% of these neurons are lost, after which both motor and non-motor symptoms become evident. 35 PD is increasingly recognized as a condition in which early vocal changes offer diagnostic value before prominent motor symptoms become clinically evident.36,37 Among the earliest and most pervasive impairments is hypokinetic dysarthria, a speech disorder affecting up to 90% of individuals with PD. It manifests through reduced vocal loudness, monotonic pitch, imprecise articulation, and increased aperiodicity in vocal fold vibration changes arising from basal ganglia dysfunction and impaired neuromuscular control of the phonatory system. 38 A major limitation in managing this disease is the difficulty of early and accurate diagnosis.39,40 Conventional diagnostic methods typically identify disease only after considerable neuronal damage has occurred, thereby reducing the effectiveness of interventions and confining patient care largely to palliative strategies. This diagnostic delay underscores the urgent need for early detection methods that are both reliable and accessible. 41
Neuropathological studies based on large-scale postmortem analyses have demonstrated that PD follows a stereotypical and predictable pattern of progression that can be described in stages as described by Hoehn and Yahr. 42 This stage-wise degeneration helps explain why non-motor symptoms such as sleep disturbances or olfactory deficits may precede motor impairment, as distinct brain regions are affected sequentially over the course of the disease. 2 Among these early manifestations, speech impairments commonly referred to as hypokinetic dysarthria are highly prevalent in individuals with PD and are increasingly recognized as early indicators of disease onset. 38
In many cases, the earliest manifestations of PD are subtle and easily misattributed to normal aging, mood changes, or musculoskeletal conditions, often leading to a diagnostic delay of 2 to 3 years from the initial appearance of symptoms.35,43 While motor signs such as tremor, rigidity, and bradykinesia form the basis of clinical assessment, several non-motor symptoms, including sleep disturbances, cognitive changes, and notably, alterations in speech, may emerge earlier in the disease progression.28,44 Hypokinetic dysarthria affects up to 90% of individuals with PD.38,45,46 Importantly, such vocal and communicative changes can negatively influence quality of life even when speech intelligibility is preserved, as patients report difficulties with participation in social interactions and daily communication.47,48 Acoustic analysis of speech has therefore gained attention as a promising, non-invasive approach for detecting early alterations associated with PD, offering potential both as a diagnostic marker and as a tool for monitoring disease progression.
Speech has emerged as one of the most scalable and clinically practical modalities among digital biomarkers. 49 Unlike gait sensors, handwriting tablets, neuroimaging techniques, or wearable motion-recording devices, voice data can be collected remotely, repeatedly, and at negligible cost, making it suitable for large-scale screening and continuous monitoring.50–54 This accessibility is particularly important given the growing emphasis on telemedicine and decentralized healthcare delivery.
These findings collectively stress on two critical insights56,57: first, that speech contains fine-grained, high-resolution signatures of neural dysfunction that appear early in PD, often before overt motor symptoms are clinically detectable; and second, that ML methods are uniquely capable of extracting complex, multidimensional temporal and spectral patterns embedded in high-dimensional acoustic signals. This has positioned ML and AI as key tools for advancing speech-based diagnostic methodologies.57,58
Despite these advancements, significant gaps remain. 59 While recent research has applied ML to a wide range of physiological and behavioural signals such as neuroimaging, wearable inertial sensor data, handwriting dynamics, typing patterns, and gait kinematics, most multimodal systems rely on specialized hardware, controlled environments, or high-cost instrumentation.60,61 These constraints limit their scalability and feasibility for early-stage or community-level screening, reinforcing the need for accessible, low-burden biomarkers such as speech. Table 1 presents a selection of existing studies that have explored speech and voice-based acoustic biomarkers in the context of PD, along with their key contributions, limitations, and how the proposed research addresses the identified gaps.
Comparative summary of works with similar biomarkers for the detection of PD.

PD: Parkinson's disease; tVSA: triangular vowel space area; VAI: vowel articulation index; UPDRS: Unified Parkinson’s Disease Rating Scale; PCA: principal component analysis; ML: machine learning; GMM: Gaussian mixture model; LDA: linear discriminant analysis; SFS: sequential forward selection; SBS: sequential backward selection; SVM: support vector machine; PNN: probabilistic neural network; GRNN: general regression neural network; RMSE: root mean squared error; MAE: mean absolute error; PLP: perceptual linear prediction; ANN: artificial neural network.
Recent investigations have highlighted the diagnostic potential of nonlinear and complex acoustic measures, including recurrence period density entropy (RPDE), detrended fluctuation analysis (DFA), tremor-related modulation indices, signal perturbation statistics, and spectral-temporal irregularities.67,68 These metrics capture fundamental pathophysiological instabilities in phonatory control driven by basal ganglia dysfunction. 69 While increasingly recognized as sensitive biomarkers, their incorporation into clinically interpretable ML frameworks remains limited. Only a small number of studies attempt to map these features onto established severity metrics such as components of the MDS-UPDRS, leaving a translational gap between algorithmic outputs and clinically meaningful constructs.
The clinical heterogeneity of PD and the progressive nature of its symptoms created an early need for standardized instruments to objectively capture disease severity and track changes over time. Reliance on descriptive clinical observation alone proved insufficient for comparing outcomes across patients or evaluating the effectiveness of therapeutic interventions.58,70,71
To support clinical judgment and ensure standardized evaluation, several rating scales have been developed to quantify disease severity and progression. The most widely used is the UPDRS, which comprehensively assesses motor and non-motor domains of PD across four parts: (I) mentation, behaviour, and mood; (II) activities of daily living; (III) motor examination; and (IV) complications of therapy. 70 Its revised version, the Movement Disorder Society-sponsored UPDRS (MDS-UPDRS), improves sensitivity and reliability by refining item definitions and expanding the range of symptoms evaluated. 72 Importantly, both scales include components related to speech and communication. For example, Parts II and III of the UPDRS assess the impact of speech difficulties on daily activities, while Part III of MDS-UPDRS evaluates speech production alongside key motor features such as tremor, rigidity, and bradykinesia. These inclusions underscore the clinical relevance of speech impairments in PD and their potential utility as measurable markers of disease onset and progression.73,74
The UPDRS (0–199) and MDS-UPDRS (0–260) provide standardized means of quantifying PD severity, though the Movement Disorder Society has not issued formal cutoffs for staging. 75 The MDS-UPDRS is more sensitive to early deficits than the original, as it distinguishes slight from mild impairments. 76 Each item in Parts I–IV is rated 0 (normal) to 4 (severe), with higher scores reflecting greater impairment. While scores from individual parts can be assessed separately, cumulative totals are also used to estimate overall burden. Suggested thresholds for Part III, the motor subscale, include <33 (mild), 33–58 (moderate), and ≥59 (severe), though such cutoffs are not universal since identical totals can result from different symptom combinations. In practice, these scales serve best to guide clinicians toward specific domains of difficulty rather than to provide rigid disease staging. 77
Despite their clinical utility, these rating systems rely heavily on subjective judgment and patient reporting, which limits sensitivity to early or prodromal features. 78 Speech signals, in particular, represent a promising non-invasive biomarker, as PD disrupts vocal tract muscle control, producing changes in loudness, pitch variability, articulation, and vocal tremor. These impairments, often termed as hypokinetic dysarthria, precede overt motor decline yet remain subtle enough to escape perceptual detection. Integrating such objective measures into existing scales, or developing adjunctive tools based on speech biomarkers, could enhance early detection and improve treatment timing.19,79
Here, ML provides a means of capturing and modelling micro-level vocal alterations that are often subtle and difficult to quantify in routine clinical assessments. Acoustic features, including jitter, shimmer, harmonic-to-noise ratio, fundamental frequency, and prosodic measures, can be extracted and analysed to uncover complex patterns of impairment. 80 By integrating these objective speech-derived metrics with existing clinical frameworks, especially Part II (impact of speech on daily life) and Part III (motor examination, including speech and tremor), diagnostic precision can be strengthened. Beyond speech, ML has been applied in PD diagnosis using a variety of modalities, including gait analysis, handwriting patterns, neuroimaging (MRI and DaTscan), and wearable sensor data to capture tremor and motor fluctuations.28,81–84 These approaches demonstrate that PD manifests across multiple motor and non-motor domains and that ML can uncover subtle, multidimensional patterns not easily detected through traditional clinical assessment. However, many of these methods require specialized equipment, laboratory settings, or repeated clinical visits, which can limit their accessibility for routine or early stage screening.85,86 In contrast, hypokinetic dysarthria biomarkers can be collected non-invasively, remotely, and repeatedly with minimal cost and effort, offering a practical avenue for early detection. The success of ML in analysing other physiological and behavioural markers, therefore, underscores the potential of applying similar data-driven techniques to vocal features, justifying our focus on speech as an adjunctive, scalable, and objective tool for identifying early PD-related impairments.
The present study aims to address this gap by a ML framework capable of objectively quantifying subtle speech impairments trained on open-source datasets created by Goetz et al. 90 of extracted vocal features to distinguish individuals with PD from healthy controls. 88 Unlike traditional rating scales, which provide clinician-scored, subjective evaluations, our approach leverages objective, data-driven acoustic markers that capture micro-level speech impairments. By doing so, this study not only evaluates the discriminative power of vocal features but also demonstrates their potential as adjunctive tools for early-stage detection of PD.
Methodology
The analysis of the dataset was done in two segments: firstly, the quantitative acoustic analysis, and secondly, the modelling using different ML algorithms.
About the dataset
This study makes use of the publicly available longitudinal dataset described by Goetz et al., 87 which was collected under the supervision of six U.S. medical centres: Georgia Institute of Technology, National Institutes of Health, Oregon Health and Science University, Rush University Medical Center, Southern Illinois University, and the University of California, Los Angeles. A total of 52 subjects with idiopathic PD were initially recruited with informed consent, of whom 10 were excluded due to early dropout or insufficient test data. The final dataset comprised 42 patients with PD (28 males and 14 females), all within 5 years of diagnosis and unmedicated for the six-month duration of the study. Each subject completed at least 20 valid study sessions during this period. UPDRS assessments were conducted at baseline, and subsequently at 3 and 6 months.
The recordings were obtained using the Intel At Home Testing Device (AHTD), an internet-enabled telemonitoring system designed to remotely measure a range of PD-related motor symptoms, including tremor, bradykinesia, complex motor coordination, speech, and voice. Patients completed tasks at home following audible prompts delivered through the device. Speech data consisted of two modalities: (i) sustained phonations of the vowel /a/ (“ahhh…”), and (ii) running speech, where subjects described static photographs displayed on the AHTD screen. Recordings were captured using a head-mounted microphone positioned 5 cm from the patient's lips, sampled at 24 kHz with 16-bit resolution. The AHTD employed an amplitude threshold detector to trigger recording, which terminated either one second after the signal dropped below threshold or after a maximum of 30 seconds.
Following initial screening to remove flawed samples (e.g. recordings with coughing or interruptions), a total of 5923 sustained phonations were retained for analysis. These high-quality audio recordings form the basis for extracting acoustic features relevant to the detection of early speech impairments in PD.
Feature extraction
The acoustic features used in this study were previously extracted by Tsanas and Little 88 from the 5923 sustained phonation recordings. In total, 16 dysphonia measures were derived using established signal processing algorithms, with each algorithm generating a single numerical descriptor per recording. The feature extraction process combined classical linear acoustic methods, implemented in Praat and benchmarked against the widely used multi-dimensional voice program, with more recent nonlinear techniques specifically developed to capture voice irregularities characteristic of PD.
The extracted dysphonia measures capture perturbations in pitch, loudness, and signal regularity that reflect underlying vocal motor impairments in PD. Classical features such as jitter (percent, absolute, RAP, PPQ, and DDP) quantify cycle-to-cycle variations in fundamental frequency, while shimmer measures (local shimmer, shimmer in decibels, APQ3, APQ5, APQ11, and DDA) capture amplitude instability across vocal cycles. Noise-related features, including the noise-to-harmonics ratio (NHR) and harmonics-to-noise ratio (HNR), assess the degree of turbulent or breathy phonation, often associated with incomplete or inconsistent vocal fold closure. Advanced nonlinear measures RPDE, DFA, and pitch period entropy (PPE) characterize signal irregularity, long-range correlations, and pitch instability, respectively. These abnormalities arise from impaired fine motor control of the laryngeal muscles caused by dopaminergic neuron loss in the substantia nigra, which disrupts basal ganglia signalling and reduces the precision of vocal fold vibration.89–91
Analysis of dataset
The study comprised a two-pronged analytical strategy to ensure both a comprehensive exploration of the dataset and rigorous predictive modelling. In the first stage, exploratory data analysis was undertaken to gain an in-depth understanding of the dataset's structure, distributional properties, and inter-feature relationships. This included assessing central tendencies, dispersion, skewness, kurtosis, and correlations among the extracted dysphonia measures. The aim of this stage was to identify underlying patterns, detect potential anomalies, and evaluate feature relevance, thereby establishing a strong foundation for subsequent modelling.
The second stage focused on dimensionality reduction and predictive modelling. The dataset was first divided into training and test sets at the patient level, ensuring that all recordings from an individual were confined to a single set. Principal component analysis (PCA) was then fitted exclusively on the training set to address multicollinearity among acoustic features and reduce redundancy while retaining the majority of variance. The resulting transformation was subsequently applied to the test set, and the derived principal components were used to train and evaluate a diverse suite of regression models, spanning robust linear methods, ensemble-based approaches, and probabilistic frameworks.
To ensure fairness and robustness in evaluation, rigorous hyperparameter tuning was conducted for each model using grid and randomized search strategies within cross-validation frameworks. Model families included robust linear regressors (Elastic Net, Huber, RANSAC, and quantile regression), kernel-based methods (support vector regression and kernel ridge), ensemble tree-based algorithms (random forest, gradient boosting, and XGBoost), and probabilistic models (Bayesian ridge and Gaussian process regression). Hyperparameters such as regularization coefficients, kernel functions, maximum tree depth, learning rates, and number of estimators were optimized within nested cross-validation to minimize overfitting. All models were assessed using standardized performance metrics, including the coefficient of determination (R2), mean squared error (MSE), root mean squared error (RMSE), and mean absolute error (MAE), ensuring direct comparability across approaches.
Results
Upon preliminary analysis of the dataset, the following was observed. The dataset comprises longitudinal voice recordings from 42 individuals, 28 males and 14 females, showing 16 dysphonia features with no duplication. In total, 5875 entries were collected, providing sufficient duration to capture tremors in speech. The participants ranged in age from 36 to 85 years (mean ≈ 65 years). On average, each test session lasted around 92.86 seconds, as shown in Table 2.
Basic information about the dataset.

It is important to note that the dataset consists of repeated measures per subject across multiple time points since recruitment into the trial (test time), introducing temporal dependence. On average, each patient provided ∼140 observations, leading to a total of 5875 datapoints. As a result, the dataset exhibits temporal dependence and repeated measures within individuals, which implies that observations are not independent and identically distributed.
Importantly, the dataset contains no missing values, which ensures data integrity.
Basic statistics of the dataset are shown in Tables 3 and 4. The table summarizes statistical properties of the dysphonia features, including measures of central tendency, spread, and range. This provided a clear overview of the distribution and variability of the data.
Basic statistics of the features used (first eight features).
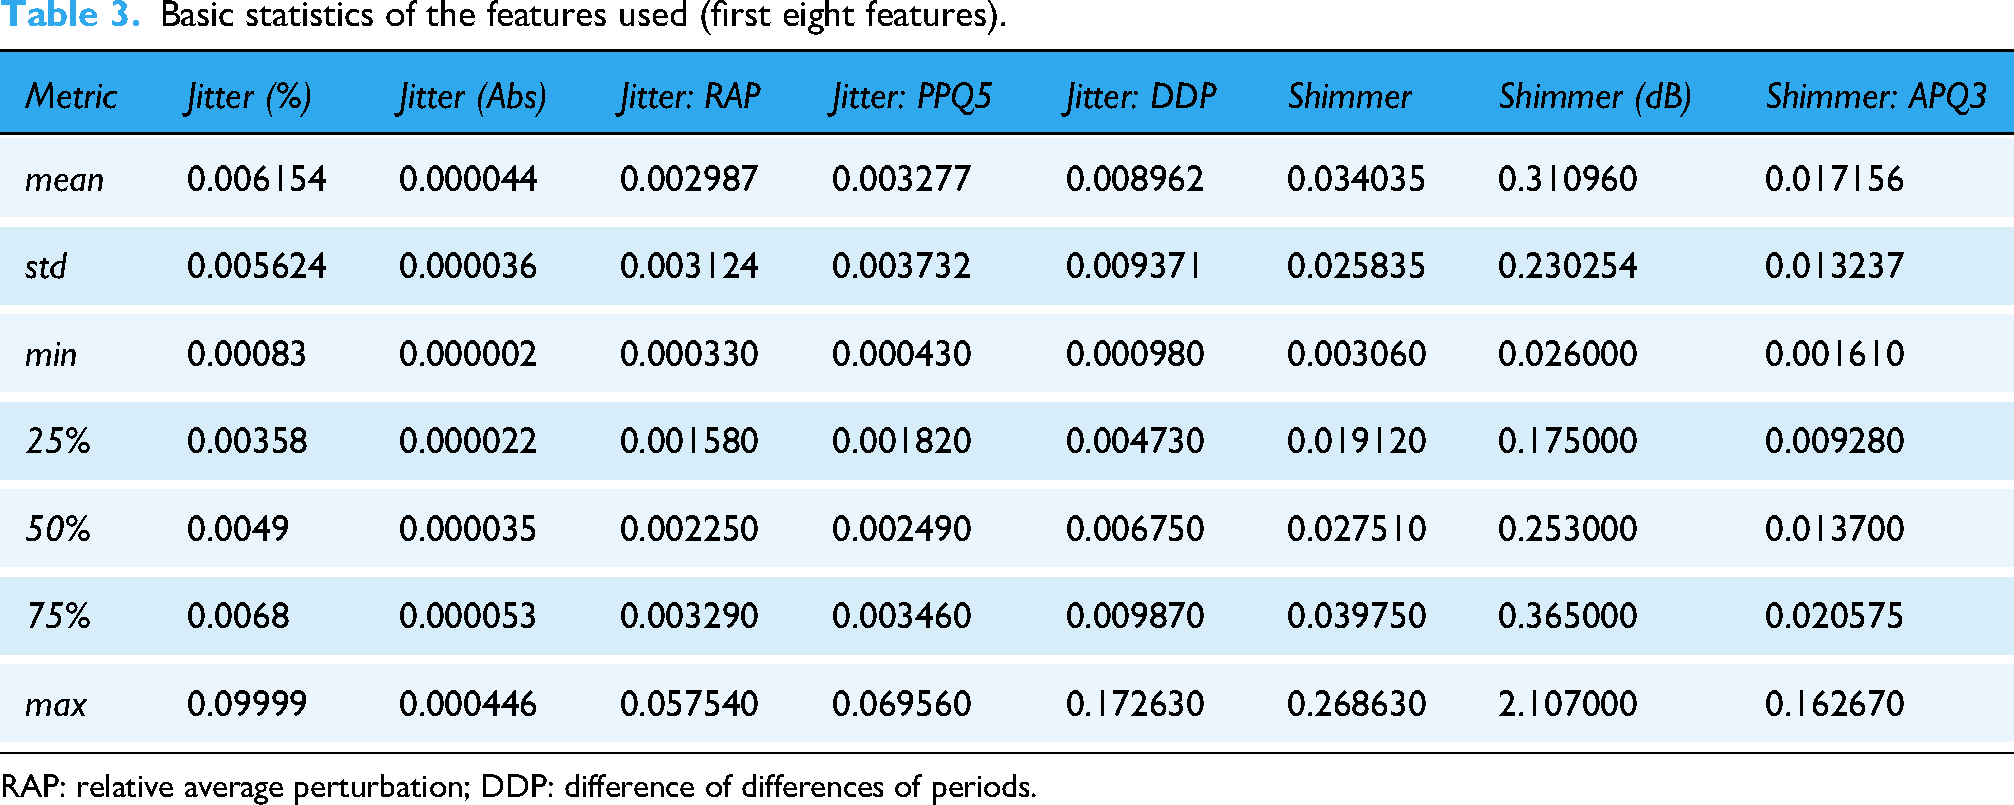
RAP: relative average perturbation; DDP: difference of differences of periods.
Basic statistics of the features used (last eight features).

DDA: direct difference of amplitudes; NHR: noise-to-harmonics ratio; HNR: harmonics-to-noise ratio; RPDE: recurrence period density entropy; DFA: detrended fluctuation analysis; PPE: pitch period entropy.
The distribution of non-acoustic features, the variables that provide essential demographic and clinical context for the dataset, was visualized. These distributions were assessed alongside acoustic features for a more comprehensive understanding of variability in the dataset. The age and gender distributions were visualized as shown in Figures 1 and 2.

Age distribution of participants in dataset.

Sex distribution of participants in dataset, where 0 is male and 1 is female.
The age distribution indicates that the majority of participants fall within the 50–80 age range and only a small proportion of patients are represented in the younger (30–40 years, 2%) and oldest (80–90 years, 4%) categories, which aligns with the typical age of PD onset and progression. Whereas the gender distribution highlights an imbalance in representation, the data has a higher proportion of males (68%) compared to females (32%). This skew reflects both the epidemiological trend of higher PD prevalence in men and possible sample recruitment effects.
Then, the distribution of clinical assessment scores, namely total UPDRS and motor UPDRS, was visualized to assess their variability and to capture differences in disease severity among patients. Figure 3 represents the spread of total and motor UPDRS scores within the dataset. The observed range for motor UPDRS extends from 5.037 to 39.511, while total UPDRS spans from 7.000 to 54.992. These scores predominantly fall within the lower spectrum of the respective scales, indicating that the participants largely exhibit mild to moderate levels of disease severity.
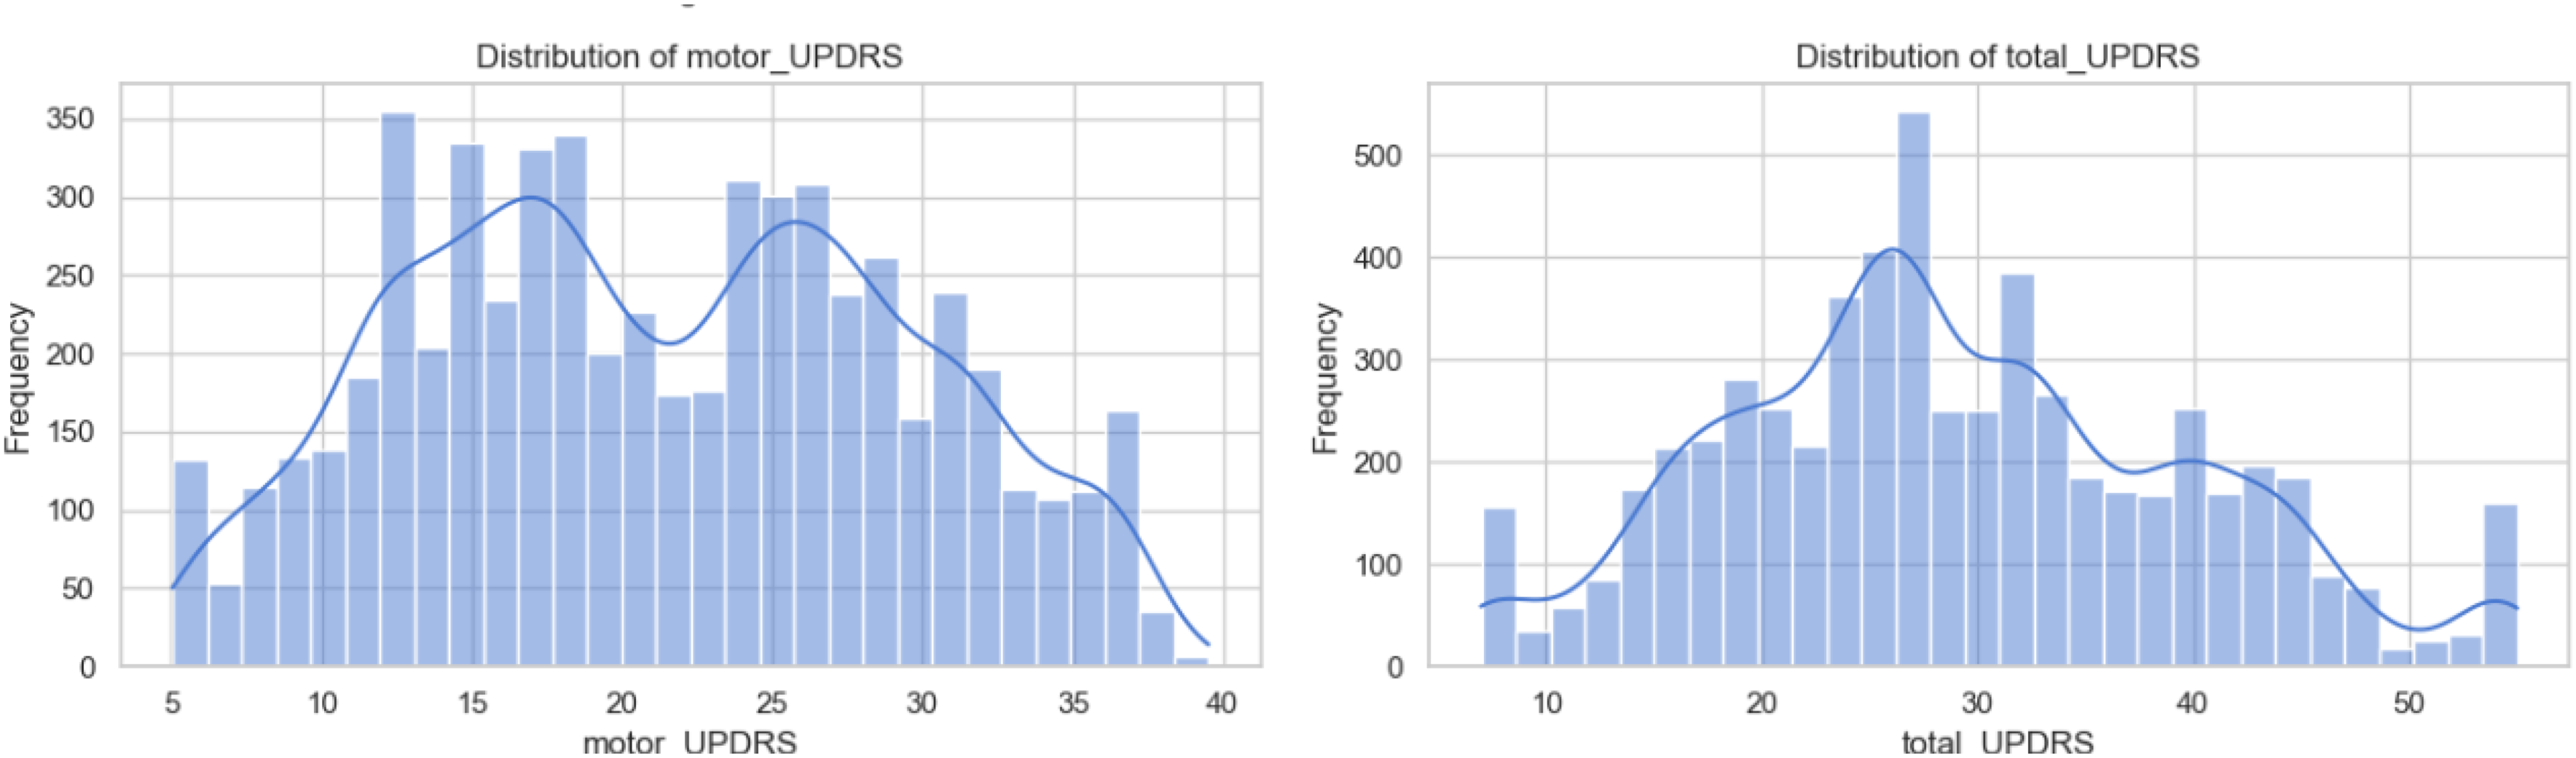
Distribution of motor and total Unified Parkinson’s Disease Rating Scale (UPDRS) in the dataset.
Next, the distribution of the acoustic features was systematically examined, as shown in Figure 4, to characterize their skewness, kurtosis, and variability for a deeper understanding of the statistical behaviour underlying the dataset. It can be observed in Figure 4 that dysphonia features are positively skewed.

Distribution of dysarthria features in the dataset.
Building on the distributional analysis, Figures 5(a), (b) and 6(a), (b) depict the bivariate relationships between the UPDRS scores (motor and total) and the set of dysphonia features.

(a) Relationship between dysphonia features and motor Unified Parkinson’s Disease Rating Scale (UPDRS) score and (b) shimmer (dB) versus motor UPDRS (zoomed for observation).

(a) Relationship between dysphonia features and total Unified Parkinson’s Disease Rating Scale (UPDRS) score and (b) shimmer (dB) versus total UPDRS (zoomed for observation).
In the above figures, while the scatterplots do not reveal strong linear associations, certain patterns emerge that are clinically meaningful. Perturbation-based measures such as jitter and shimmer, along with noise-to-harmonics (NHR and HNR) and nonlinear dynamic features (RPDE, DFA, and PPE), display noticeable clustering whereby higher UPDRS scores are often associated with elevated values of vocal irregularity and reduced harmonic quality. The significance of these findings lies in their translational potential: although no single acoustic measure offers a definitive marker, their collective trends demonstrate sensitivity to increasing disease severity. These feature–UPDRS relationships highlight the value of using ML methods that combine multiple subtle acoustic markers to support early detection of PD. The observed associations are consistent with clinical evidence that hypokinetic dysarthria arises from impaired motor control of the vocal folds, leading to measurable instability in pitch, amplitude, and voice quality.
To further investigate these relationships, locally weighted scatterplot smoothing (LOWESS) regression was applied, as shown in Figures 7(a), (b) and 8(a), (b). The smoothed curves demonstrate consistent tendencies across several dysphonia features: perturbation measures such as jitter and shimmer display gradual increases in alignment with higher UPDRS scores, reflecting the heightened pitch and amplitude instability characteristic of Parkinsonian speech. In contrast, features indicative of vocal quality and signal regularity, including HNR, DFA, and PPE, show declining trends with disease severity, consistent with clinical reports of reduced harmonic structure and impaired vocal fold coordination in hypokinetic dysarthria. Importantly, while the absolute effect sizes remain modest, the LOWESS regression highlights reproducible directional changes across multiple independent features, meaning that despite variability at the individual level, the aggregate trajectories of these features consistently move in clinically expected directions (e.g. perturbation rising and harmonic measures falling) as disease severity increases. This convergence across different acoustic domains reinforces the view that PD impacts voice through diffuse and subtle alterations rather than through a single dominant marker.

(a) LOWESS trend line for all dysphonia features and motor UPDRS score and (b) LOWESS trend line for shimmer (dB) versus motor UPDRS score (zoomed for observation).

(a) LOWESS trend line for all dysphonia features and total UPDRS score and (b) LOWESS trend line for shimmer (dB) versus total UPDRS score (zoomed for observation).
The presence of skewness and kurtosis, as noted earlier, was calculated, as shown in Tables 5 and 6, for each dysphonia feature to quantify the asymmetry and the extremity of tails in their distributions, since these statistical properties provide insight into subtle changes in voice signal patterns that may arise from early stage PD.
Skewness in dataset.

RAP: relative average perturbation; DDP: difference of differences of periods; NHR: noise-to-harmonics ratio; PPE: pitch period entropy; DFA: detrended fluctuation analysis; UPDRS: Unified Parkinson’s Disease Rating Scale; RPDE: recurrence period density entropy; HNR: harmonics-to-noise ratio.
Kurtosis in dataset.

RAP: relative average perturbation; DDP: difference of differences of periods; NHR: noise-to-harmonics ratio; DDA: direct difference of amplitudes; HNR: harmonics-to-noise ratio; PPE: pitch period entropy; RPDE: recurrence period density entropy; DFA: detrended fluctuation analysis; UPDRS: Unified Parkinson’s Disease Rating Scale.
As shown in Figure 9, the jitter, shimmer, and NHR measures (not shown) exhibit sharp peaks near zero with long right tails, reflecting strong positive skewness and high kurtosis (leptokurtic distributions with heavy tails and concentration around the mode). In contrast, HNR and RPDE display more symmetric, bell-shaped curves with moderate tail behaviour, suggesting near-zero skewness and mesokurtic tendencies. PPE shows a mild right skew, while DFA is distinguished by a multimodal distribution rather than a simple skew, indicating complex variability across samples.

Skewness and kurtosis in the dataset (four of 16 features shown for brevity).
The skewness values indicate the asymmetry in the distribution of each dysphonia-related acoustic feature. The positive skewness in jitter and shimmer is indicative of decreased vocal intensity and irregularities in voice frequency and amplitude, which arises from impaired motor control of the vocal apparatus. The rigidity and involuntary dyskinetic movements in the respiratory and laryngeal muscles lead to asymmetrical and extreme voice signal deviations. Such motor impairments disrupt the fine neuromuscular regulation required for smooth, consistent phonation, resulting in asymmetrical and extreme vocal signal deviations captured statistically. 92 High kurtosis values observed in features such as jitter: PQ5 and jitter: RAP indicate the presence of infrequent but extreme deviations from the mean, reflecting intermittent bursts of irregularity or instability in voice production. These values suggest that the voice signal contains sudden, sharp variations likely arising from transient motor dysfunction events such as tremors or spasmodic bursts affecting vocal fold vibrations and respiratory support.
When considered alongside the LOWESS regression trends these higher-order distributional characteristics provide complementary evidence: the presence of skewness and heavy tails indicates that while most patients cluster around mild deviations in voice features, a non-negligible subset shows disproportionately large abnormalities, reflecting heterogeneity in disease manifestation. The smoothed trajectories further demonstrate that these extreme deviations are not random outliers but instead follow systematic patterns that increase or decrease in line with UPDRS severity. This plots together shows the distributional asymmetry and nonlinear regression trends, which strengthens the evidence that dysphonia features capture meaningful gradations of motor impairment, even at early stages of PD.
To address skewness and kurtosis observed above, a range of common transformations were applied, including logarithmic, square-root, and Yeo–Johnson approaches. While these methods provided marginal improvements, they did not meaningfully reduce skewness or bring the distributions closer to normality. This persistence suggests that the observed non-normality is not merely an artefact of scaling but rather an intrinsic characteristic of the underlying physiological processes.93–96
To further explore the relationships among the extracted dysphonia features, a correlation analysis using Spearman's rank correlation coefficient was performed, as shown in Figure 10. This approach was chosen because it captures monotonic associations without assuming linearity or normality, making it suitable for our skewed and heavy-tailed feature distributions observed so far.

Correlation analysis of feature.
Notably, several acoustic features, including jitter (%), jitter: PPQ5, jitter: DDP, and shimmer-related measures, exhibit moderate positive correlations (ρ ≈ 0.12–0.18) with UPDRS scores. Additionally, the strong inter-correlations (ρ > 0.90) observed among jitter and shimmer measures indicate overlapping aspects of vocal instability, highlighting potential redundancy that may be addressed in subsequent feature selection or dimensionality reduction. NHR and PPE also show positive associations with UPDRS, suggesting that irregularities in vocal fold vibration and increased NHRs are linked with disease progression. Negative correlations of HNR with jitter, shimmer, and NHR highlight that increased HNR (i.e. clearer voice quality) is inversely related to vocal perturbations, consistent with the expected physiological changes in PD.
On further examining the dependency structure of the dataset, we found that a considerable proportion of the variance in several dysphonia features was explained by subject identity rather than by independent fluctuations, as shown in Table 7. For example, the intra-class correlation analysis showed that up to 77% of the variance in certain dysphonia features (e.g. DFA and shimmer measures) was attributable to subject identity, indicating that recordings from the same patient were far more similar to each other than to those from different patients. Complementing this, the presence of positive lag-1 autocorrelation across features (median ≈ 0.21) showed that adjacent recordings within a patient were correlated over time, reflecting the gradual evolution of voice characteristics rather than independent observations. When adjusted for these dependencies, the effective sample size was markedly reduced, for instance, from 5875 nominal datapoints to the equivalent of ∼54 independent observations for DFA, highlighting that the dataset carries less independent information than its raw size suggests. This underscores the importance of accounting for both subject-level clustering and temporal correlation to avoid overestimating model performance in early detection tasks.
Temporal dependence in the dataset.

HNR: harmonics-to-noise ratio; DFA: detrended fluctuation analysis; UPDRS: Unified Parkinson’s Disease Rating Scale; NHR: noise-to-harmonics ratio; RPDE: recurrence period density entropy; DDA: direct difference of amplitudes; PPE: pitch period entropy; DDP: difference of differences of periods; RAP: relative average perturbation.
Several acoustic features, particularly the jitter and shimmer variants, exhibited strong positive inter-correlations, indicating the presence of multicollinearity, where multiple predictors convey overlapping information. Accounting for multicollinearity is critical to ensure stable and interpretable model estimates. To address this, PCA was applied as part of a subject-wise pipeline, in which the dataset was first split into training and testing sets at the subject level to prevent information leakage across repeated measures, as shown in Table 8. PCA was then fitted exclusively on the training set and subsequently used to transform both training and testing data. This ensured that the dimensionality reduction process reflected only information available in the training data, thereby preserving the integrity of model evaluation.
Shape of training and testing sets.

Several acoustic features, particularly the jitter and shimmer variants, exhibited strong positive inter-correlations, indicating the presence of multicollinearity, where multiple predictors convey overlapping information. Accounting for multicollinearity is critical to ensure stable and interpretable model estimates. To address this, PCA was applied to the dysphonia features. The cumulative explained variance plot indicates that nine principal components were sufficient to retain over 98% of the variance (marked by the red dotted line), as shown in Figure 11, showing that the original feature space was effectively compressed without substantial information loss.
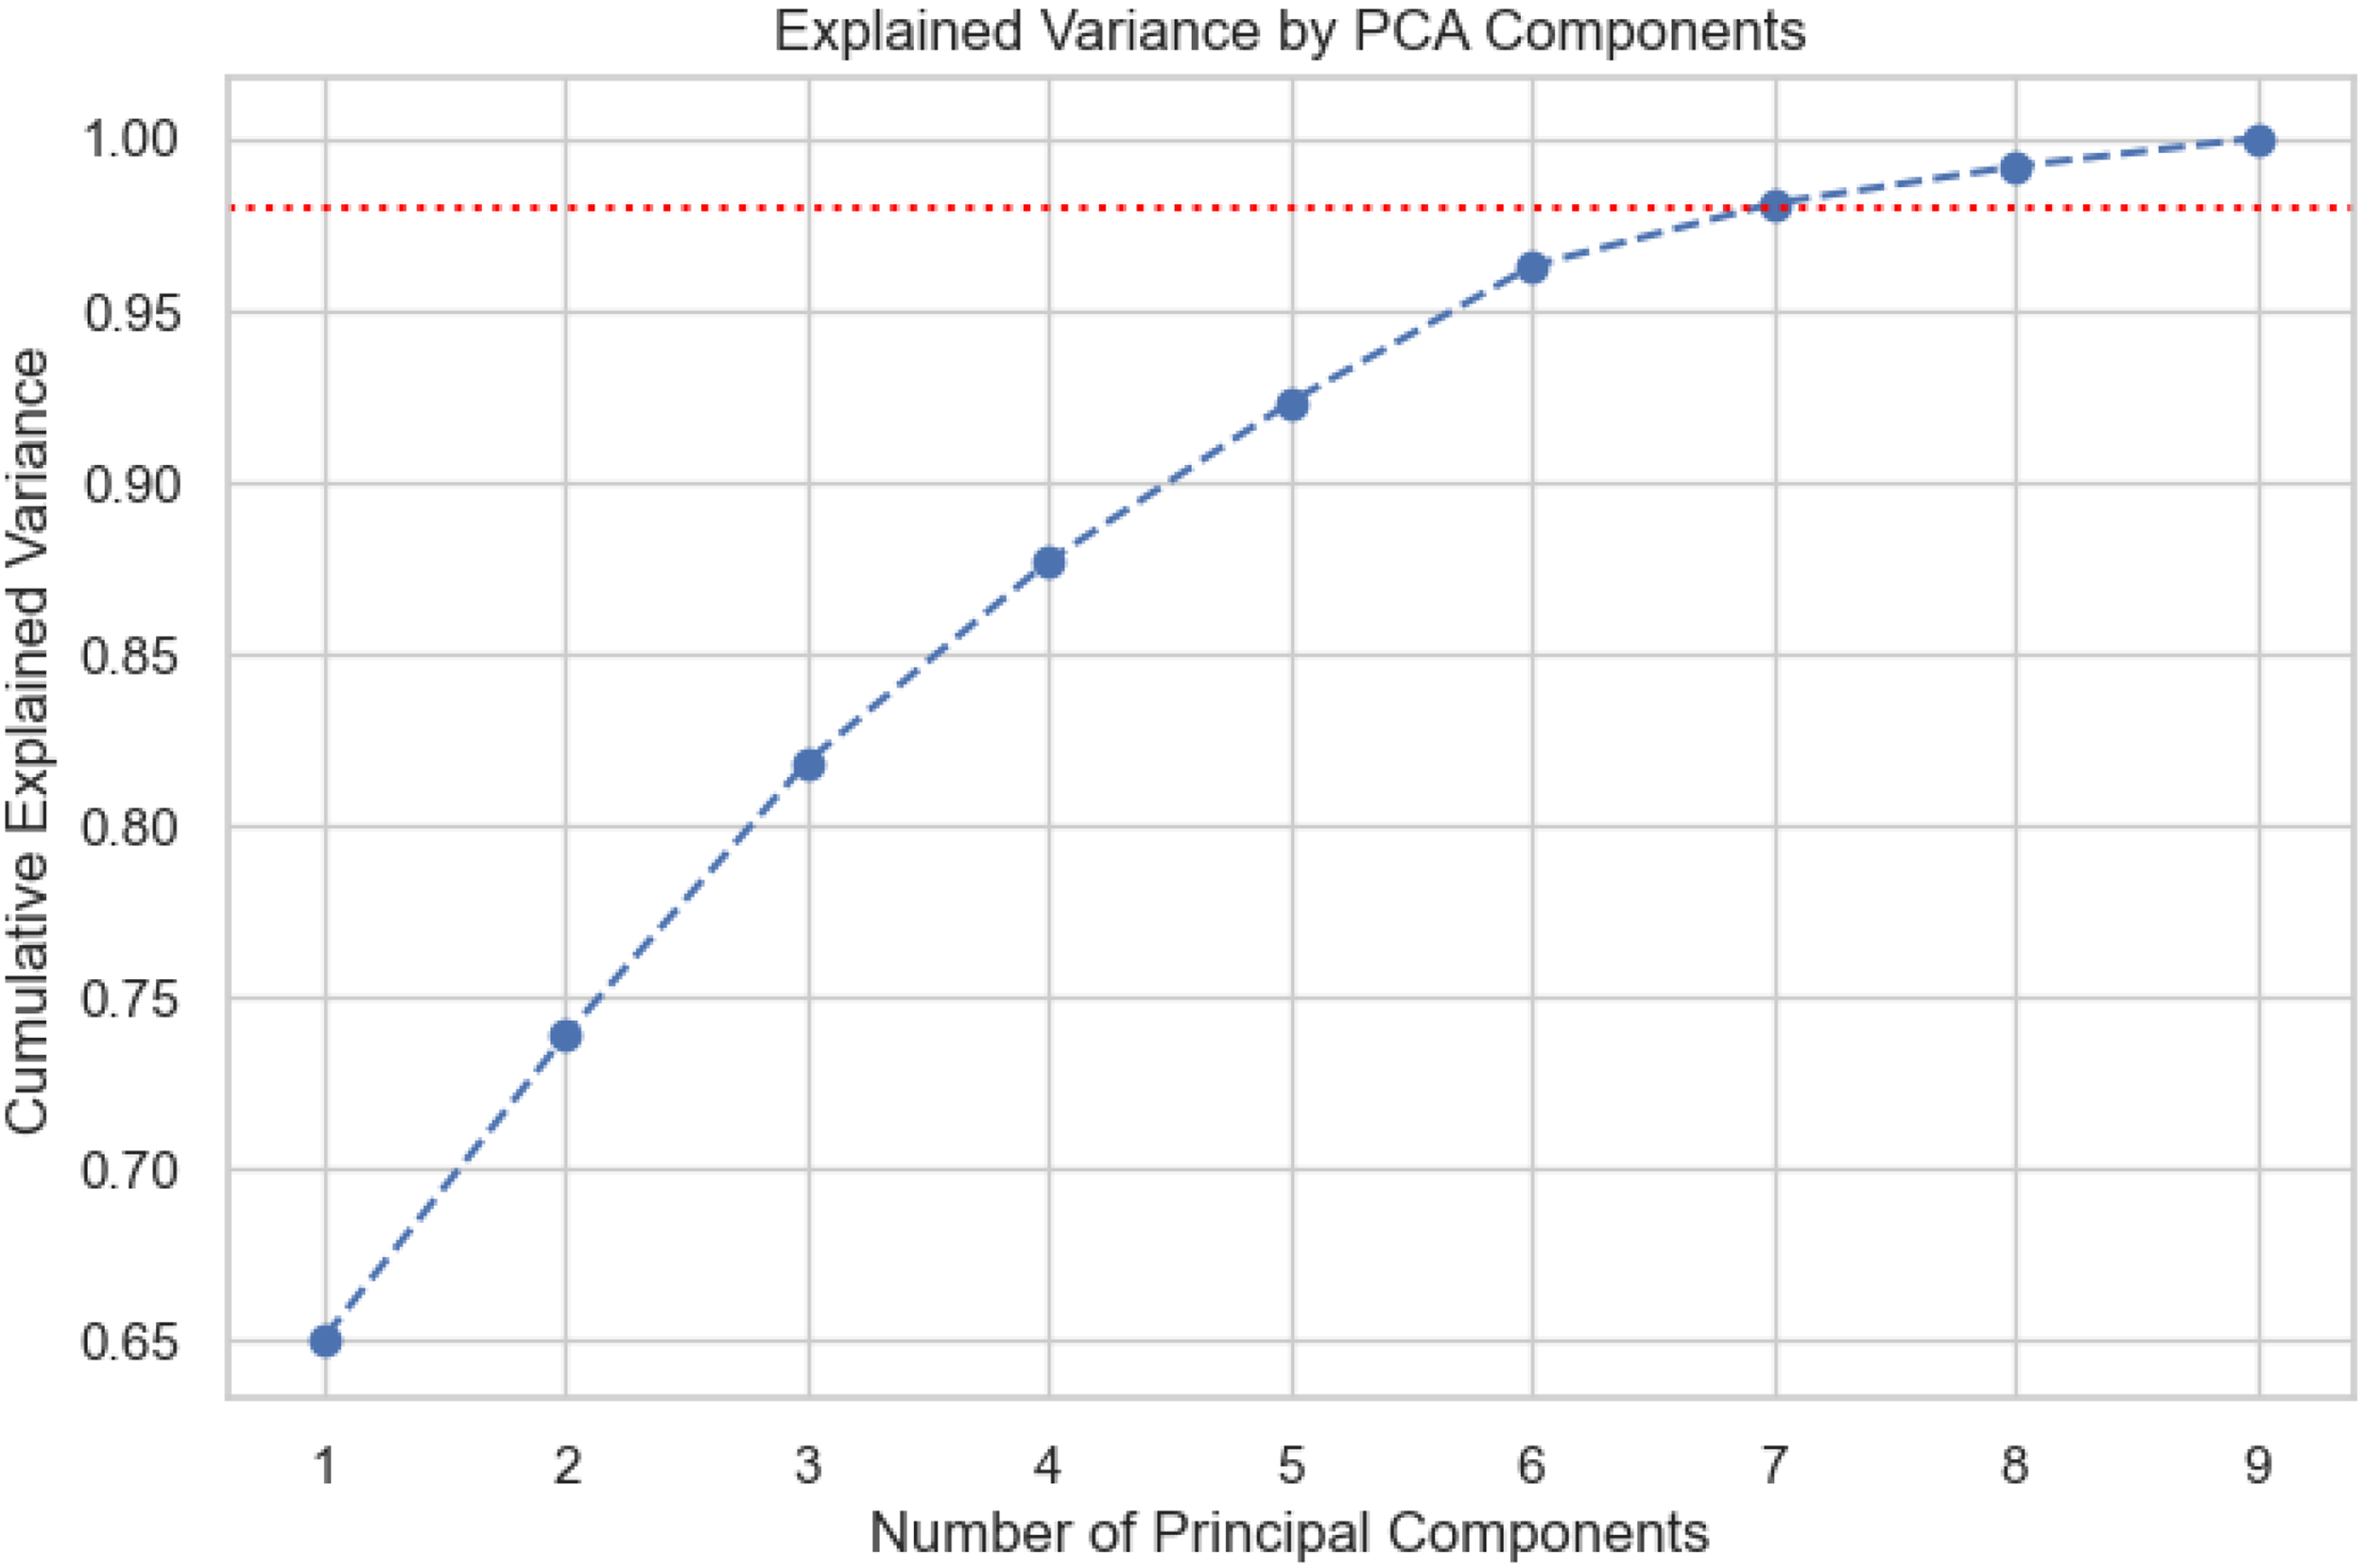
Explained variance of nine principal component analysis (PCA) components.
This approach reduced feature redundancy, eliminated multicollinearity, and produced an orthogonal set of components for subsequent predictive modelling, while preserving nearly all the original information. Component loadings were examined to understand which original features contributed most to each principal component, facilitating interpretation despite the dimensionality reduction, as shown in Table 9.
Top features per PC.

PC: principal component; DDP: difference of differences of periods; RAP: relative average perturbation; DFA: detrended fluctuation analysis; RPDE: recurrence period density entropy; PPE: pitch period entropy; NHR: noise-to-harmonics ratio; DDA: direct difference of amplitudes; HNR: harmonics-to-noise ratio.
Analysis of the component loadings in Table 9 indicates that shimmer (and its variants), jitter (and its variants), and nonlinear vocal dynamics like DFA form the most influential latent dimensions of dysphonia across principal components. Their repeated prominence highlights their relevance as robust biomarkers of hypokinetic dysarthria.
Following PCA, a diverse set of robust and advanced regression models was employed to predict PD early from the principal components. This included robust linear approaches (Huber, RANSAC, Quantile, and Elastic Net), ensemble and tree-based methods (random forest, gradient boosting, XGBoost, LightGBM, and CatBoost), kernel-based support vector regression, and probabilistic frameworks (Bayesian ridge and Gaussian process regression), ensuring resilience to skewness, outliers, multicollinearity, and nonlinear relationships observed in the data.
Rigorous hyperparameter tuning was carried out using both grid search and randomized search strategies to optimize model performance across these methods. Robust linear methods (Huber, RANSAC, quantile, and elastic net) were chosen to reduce the influence of outliers and address multicollinearity, while ensemble and kernel-based approaches (random forest, gradient boosting, XGBoost, LightGBM, CatBoost, and SVR) were included to capture nonlinear relationships and complex feature interactions. In addition, Bayesian ridge and Gaussian process regression were applied to incorporate a probabilistic perspective, providing both predictive accuracy and uncertainty estimates, which are particularly important in clinical decision-making. These models were trained and evaluated using mean squared error (MSE), root mean squared error (RMSE), mean absolute error (MAE), and the coefficient of determination (R2). The results were summarized as shown in Tables 10 and 11.
Performance metrics for the models used (target: motor UPDRS score; sorted by R2 value).

UPDRS: Unified Parkinson’s Disease Rating Scale; MSE: mean squared error; RMSE: root mean squared error; MAE: mean absolute error; KNN: K-nearest neighbors; SVR: support vector regression.
Performance metrics for the models used (target: total UPDRS score; sorted by R2 value).
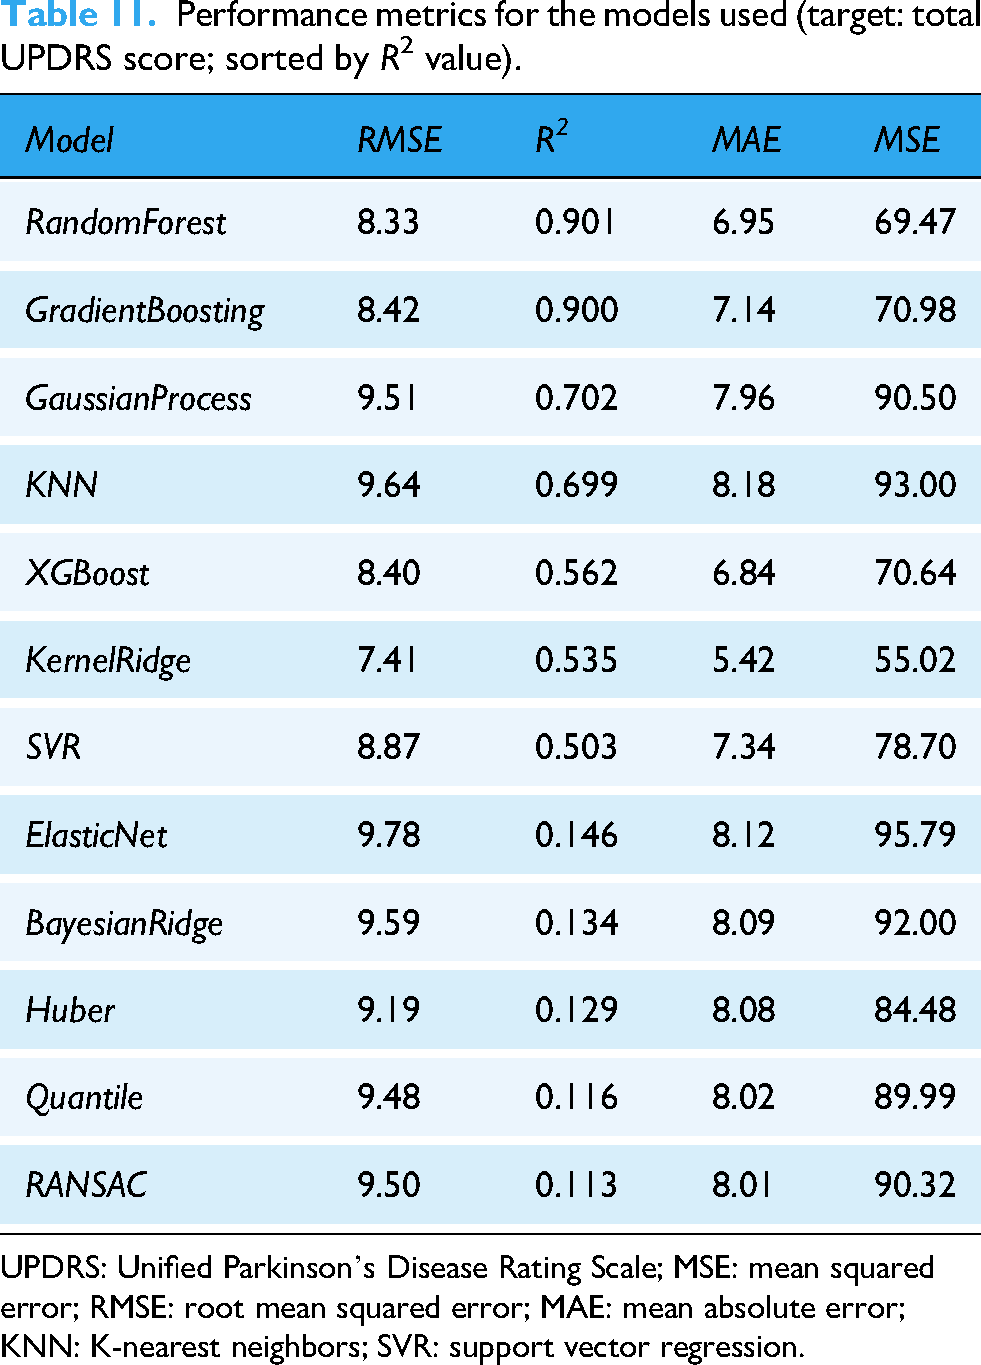
UPDRS: Unified Parkinson’s Disease Rating Scale; MSE: mean squared error; RMSE: root mean squared error; MAE: mean absolute error; KNN: K-nearest neighbors; SVR: support vector regression.
The ensemble methods, particularly random forest and gradient boosting, demonstrated the strongest performance across both targets, motor UPDRS and total UPDRS score. Random forest achieved the lowest RMSE (2.391) and MSE (5.719), coupled with the highest R2 value (0.910), indicating that it explains over 91% of the variance in the target variable. Gradient boosting followed closely with an R2 of 0.900 and similarly low error metrics (RMSE = 2.521 and MAE = 1.857). These findings are consistent when predicting total UPDRS scores, where random forest (R2 = 0.901 and RMSE = 8.33) and gradient boosting (R2 = 0.900 and RMSE = 8.42) again showed the best results, explaining around 90% of the variance despite the broader outcome range.
Among the non-ensemble approaches, Gaussian process regression and KNN regression provided moderate predictive power (R2 ≈ 0.69, RMSE ≈ 4.4–4.5 for motor UPDRS and R2 ≈ 0.70, RMSE ≈ 9.5–9.7), suggesting some ability to capture nonlinear patterns but with less stability across targets, while XGBoost performed slightly lower (R2 = 0.675 for motor UPDRS and R2 = 0.562 for total UPDRS). Kernel ridge regression explained only ∼59% of the motor UPDRS score and ∼53% of the total UPDRS variance, reflecting weaker adaptability to the complex data structure.
In contrast, linear and robust regression models (ElasticNet, Bayesian Ridge, Huber, RANSAC, and quantile regression) consistently failed, with R2 values below 0.14 and RMSE exceeding 7 across both target variables. This underperformance is expected, as dysphonia features derived from hypokinetic dysarthria are inherently nonlinear and high-dimensional, reflecting complex alterations in phonation, articulation, and prosody associated with early PD. Linear models lack the flexibility to capture these intricate relationships, whereas ensemble tree-based methods better disentangle nonlinear feature interactions.
These findings highlight that effective early detection of PD via speech relies on nonlinear, ensemble-based models capable of modelling subtle deviations in vocal fold vibration, reduced pitch variability, and articulatory precision, all hallmark characteristics of hypokinetic dysarthria. By capturing these nuanced acoustic patterns, random forest and gradient boosting achieved superior predictive accuracy, underscoring their suitability for clinical decision-support systems in PD screening.
Discussion and limitations of the study
The quantitative analysis to use speech-derived biomarkers to assess PD severity has shown that the ensemble-based models, particularly random forest and gradient boosting, achieved the strongest performance, explaining over 90% of the variance in both motor and total UPDRS scores. These results indicate that nonlinear modelling approaches are well-suited to capturing the micro-level perturbations characteristic of hypokinetic dysarthria. Specifically, features reflecting frequency instability (jitter), amplitude irregularity (shimmer), and noise-related measures emerged as strong contributors to predictive accuracy, supporting the hypothesis that vocal disturbances carry diagnostically meaningful signatures of PD-related motor dysfunction.
The findings align with previous studies reporting that acoustic perturbation metrics and nonlinear vocal features are sensitive correlates of disease progression and early motor impairment. Earlier work has similarly identified RPDE, DFA, PPE, jitter, and shimmer as markers capable of differentiating PD speech from healthy controls or modelling severity. The superior performance of ensemble and kernel-based models observed here is consistent with prior literature showing that nonlinear classifiers outperform traditional statistical methods when modelling complex dysphonic patterns. However, the present study extends this evidence by systematically evaluating a wide range of regression methods under stringent subject-level splits, thereby reducing information leakage and providing a more rigorous assessment of model generalization.
The clinical implications are notable. Speech-based biomarkers can be collected remotely, repeatedly, and at low cost, making them suited for telemonitoring and resource-limited environments. Their objective quantification also offers a valuable complement to subjective rating scales such as the MDS-UPDRS, with potential to enhance both diagnostic precision and longitudinal tracking.
Despite the promising results, this study has several limitations that must be acknowledged. First, the dataset, while comprehensive in terms of repeated measurements, was limited to 42 patients with PD and did not include a balanced cohort of healthy controls in the same longitudinal framework. This restricts the generalizability of the findings, as the model's performance was evaluated within a single dataset rather than across heterogeneous populations. Validation on larger, multi-centric datasets is essential to establish the robustness of speech biomarkers across demographic and clinical variations. Additionally, the sample exhibited demographic imbalances, most notably the predominance of older adults and a higher proportion of male participants. Age and gender are known to influence acoustic characteristics independently of disease, yet the present analysis did not control for or stratify by these factors. The dataset reflects typical epidemiological patterns of PD, namely, higher prevalence in older adults and a greater proportion of male cases. As a result, the demographic skew is not an artefact of sampling, but rather a known characteristic of PD populations. Adjusting aggressively for these variables in a small dataset could remove meaningful biological signal or inadvertently bias the model against clinically representative distributions.
Second, the speech samples analysed were restricted to sustained phonations of the vowel /a/, which, while controlled and easy to analyse, may not fully capture the dynamic nature of speech impairments in PD. Hypokinetic dysarthria often manifests more prominently in spontaneous, connected speech, where deficits in prosody, rhythm, and articulation are more evident. Relying primarily on sustained phonation may thus underestimate the full spectrum of speech alterations in PD. Although the dataset also included running speech tasks, this study focused primarily on sustained phonations, which could limit ecological validity.
Another limitation of this study is the inherent temporal dependence in the dataset, as each patient contributed multiple recordings over time. This repeated-measures design introduces interdependence between observations, which can inflate model performance if not properly accounted for. Although patient-wise splits were applied to reduce this effect, future work should adopt longitudinal modelling approaches (e.g. mixed-effects models and recurrent neural networks) that explicitly capture disease progression while isolating early diagnostic signals.
A critical point is that the dataset used did not explicitly include prodromal or very early stage patients. Consequently, the models developed here are trained on features observed in already-diagnosed PD cases. However, since the same dysphonic features are known to appear in attenuated form during prodromal stages, these models can still be applied to screen individuals at risk. This represents both a limitation and an opportunity: while external validation is required to confirm performance in prodromal populations, the present study provides a proof-of-concept that such extension is feasible.
Finally, this study focused exclusively on acoustic features, without integrating multimodal biomarkers such as gait, handwriting, or neuroimaging data. While acoustic analysis shows promise, PD is a multifaceted disorder, and a multimodal approach is likely to yield stronger diagnostic and prognostic utility. The absence of healthy control data, combined with a reliance on a relatively small and homogenous sample, further limits the external validity of the results.
In conclusion, while this study establishes speech-derived features as potential biomarkers for early PD detection, its limitations necessitate cautious interpretation. Addressing these challenges through larger, more diverse datasets, inclusion of spontaneous speech tasks, improved model interpretability, and multimodal integration will be critical to advancing the field. Future research should validate these findings across larger, multi-lingual, and demographically diverse cohorts, including prodromal individuals and healthy controls. Incorporating connected and spontaneous speech, as well as modelling longitudinal progression explicitly, may improve ecological validity. Further work on interpretable ML and multimodal integration could strengthen clinical adoption and provide a more comprehensive framework for early PD detection and monitoring.
Conclusion
This study demonstrates that quantitative analysis of hypokinetic dysarthria, combined with ML, offers a promising approach for early detection of PD. Using a two-stage framework, exploratory analysis followed by PCA-driven regression modelling, we showed that speech-derived acoustic features carry strong predictive value. Ensemble methods such as random forest and gradient boosting achieved the highest accuracy, explaining over 90% of the variance in disease severity scores. The advantages of this approach are significant. Acoustic biomarkers are objective, reproducible, non-invasive, and inexpensive, making them especially suitable for at-home or remote monitoring. They can serve as adjuncts to existing rating scales, reduce reliance on subjective clinical judgments, and help overcome diagnostic delays that often hinder timely treatment.
For clinical translation, however, further work is needed. Validation on larger, multi-lingual, and demographically diverse cohorts is essential, as is the inclusion of spontaneous speech tasks to capture the full spectrum of dysarthric features. Model interpretability must also be addressed to ensure clinician confidence and integration into practice.
In conclusion, speech-based digital biomarkers, supported by ML, hold strong potential for enhancing PD detection and monitoring. While external validation is required, this framework provides an accessible, scalable, and cost-effective step toward earlier diagnosis and improved patient care.
Footnotes
Acknowledgements
We thank all the organizations involved for their research throughputs and supportive discussions in the development of this research project.
Author contributions
RC and US wrote the main manuscript. The theoretical concept was designed by RC, while the structural content and framework were designed by DS. The implementation of the research was conducted by RC and DS. The author(s) read and approved the final manuscript.
Funding
The authors disclosed receipt of the following financial support for the research, authorship, and/or publication of this article: This work was supported by the College of Information Sciences and Technology, Pennsylvania State University, and the Cocoziello Institute of Real Estate Innovation seed fund 2025–2026.
Declaration of conflicting interests
The authors declared no potential conflicts of interest with respect to the research, authorship, and/or publication of this article.
Data availability statement
The qualitative data extracted and analysed during the current study is publicly available but can be discussed or made available from the corresponding author on reasonable request. All documents analysed are publicly available and referenced in this article.