
Abstract
Objectives:
To develop and validate a smartphone video-based framework using deep learning for quantifying smooth-pursuit abnormalities in Parkinson’s disease.
Methods:
Smartphone videos (N = 54) from 18 patients with confirmed Parkinson’s disease were rigorously annotated to identify 1767 event-level samples (2-second windows), comprising 941 normal and 826 abnormal smooth-pursuit events. Ocular landmarks were extracted using MediaPipe FaceLandmarker. Preprocessing steps included canthus-referenced spatial normalization, Kalman smoothing, and blink filtering. Event samples were encoded as kinematic feature sequences and classified using DP-MDLA Net, a dual-path multi-scale dilated-LSTM attention architecture that fuses convolutional and recurrent representations.
Results:
Under a random split regimen for event samples, the framework achieved 96.59% accuracy, 97.50% precision, 95.12% recall, 96.03% F1-score, and an AUC of 0.9939 on the test set (n = 176). Five-fold cross-validation yielded a mean accuracy of 93.04% (SD 1.86%) and a mean AUC of 0.9735 (SD 0.0102). Subject-independent validation (disjoint split by patient) produced an accuracy of 93.57% and an AUC of 0.9693. Ablation without normalization decreased accuracy to 84.09% and AUC to 0.9323, indicating the critical role of landmark-based spatial alignment.
Conclusion:
The framework enables robust event-level quantification of smooth-pursuit abnormalities from smartphone video, supporting portable bedside assessment and standardized longitudinal monitoring of Parkinson’s disease without specialized equipment.
Keywords
Introduction
Parkinson’s disease (PD) is the second most common neurodegenerative disorder after Alzheimer’s disease, affecting an estimated 10 million people worldwide. 1 In addition to the core motor symptoms—tremor, 2 rigidity, 3 and bradykinesia 4 —visual impairments and oculomotor abnormalities are also prevalent,5,6 yet often overlooked in clinical practice. Compared with other neurological assessment modalities, eye-movement examination is non-invasive, rapid, quantitative, and less subjective. With advances in eye-tracking technology, its auxiliary diagnostic value for PD and other neurological disorders has attracted increasing attention.6–8
Smooth-pursuit eye movement (SPEM) refers to the ability of the eyes to continuously and uniformly follow a slowly moving target. 9 Numerous studies have confirmed that this function is markedly impaired in PD patients.6,10,11 A typical manifestation is saccadic pursuit, 12 in which the patient fails to generate sustained pursuit and instead compensates for the pursuit with a series of catch-up saccades. 13 These compensatory saccades are frequently dysmetric, 14 predominantly hypometric. 15 Such abnormalities mainly reflect basal ganglia dysfunction 10 and can indicate the severity of motor and cognitive deficits. 16
Current quantitative detection of SPEM abnormalities relies primarily on high-precision eye trackers. 17 Although these devices offer high angular resolution and sampling rates and can systematically evaluate saccades, pursuit, and vestibulo-ocular reflex, 18 they are expensive, require complex operation and laboratory conditions, and demand skilled personnel for data annotation and interpretation. These factors limit their large-scale deployment in primary care and home settings.14,19
Driven by advances in computer vision and deep learning, researchers have attempted to replace dedicated eye trackers with generic camera devices.8,14,20 This approach substantially lowers hardware costs and improves portability; however, existing methods still face challenges in data stability, detection reliability, and clinical usability due to illumination variation, camera angle, head motion, tremor interference, and limited capacity for temporal feature mining.
To address these challenges, the present study focuses on the automatic detection of abnormal eye movements during the smooth-pursuit task in PD patients and proposes a solution based on smartphone video acquisition and deep learning analysis. Specifically, we employ a canthus-normalization algorithm to enhance the comparability and robustness of mobile data, design a multi-level feature engineering pipeline to enrich the quality and representativeness of the signals, and construct a deep model that integrates multi-scale dilated convolution with a dual-channel attention mechanism for accurate identification of complex abnormalities. Compared to traditional methods, the proposed approach lowers detection cost, improves portability and applicability, and better meets clinical requirements in terms of data processing and model performance. This work provides a new technological pathway for quantitative monitoring of smooth pursuit abnormalities and demonstrates promising potential for tracking disease progression and treatment response.
Materials and methods
Participants
We enrolled inpatients with an established clinical diagnosis of PD from the Department of Neurology, Affiliated Zhongshan Hospital of Dalian University. All cases had been diagnosed prior to this study in routine clinical care. At enrollment, a senior neurologist reviewed clinical history and examination findings to confirm eligibility for inclusion in the PD cohort. Inclusion criteria were age 40 years or older; prior PD diagnosis; hospitalization for at least 1 month at the time of enrollment; ability to understand and perform fixation and smooth pursuit tasks; unobstructed periocular region with key landmarks clearly visible in study videos; adequate visual acuity with correction; and written informed consent. Exclusion criteria were acute ocular conditions affecting oculomotor assessment or marked ptosis; severe cognitive impairment precluding cooperation; uncorrected visual impairment preventing clear fixation; coexisting major movement disorders; or refusal to participate.
A total of 18 patients were included (age 45–72 years; mean 60.1, standard deviation 7.8; 11 men and 7 women). Disease duration ranged from 2 to 15 years (mean 4.9, standard deviation 2.9). One participant wore a face mask during recording, with both eyes fully unobstructed. According to clinical workflow and participant tolerance, several patients underwent multiple recording sessions, yielding 54 raw video segments. All participants provided written informed consent, and the study was approved by the Ethics Committee of the Affiliated Zhongshan Hospital of Dalian University. Demographic, disease course, and functional information were obtained at the bedside through routine clinical interviews conducted by the attending neurologist, based on reports from patients or their family members.
Clinically, all participants exhibited bradykinesia to varying degrees; three showed severe rigidity; one reported persistent muscle pain 21 ; and one had leg tremor that prevented ambulation. Three patients walked slowly with a cane, while the remainder could walk independently but with reduced gait speed and difficulties in sit-to-stand transitions and turning. Tremor was observed in six cases, including mild kinetic tremor of the hands 22 and marked rest tremor 23 involving, respectively, the right hand, both legs, tongue, and chin (n = 4), which persisted during recording.
Video acquisition
Recordings were captured with a smartphone (iPhone 14 Pro Max). As illustrated in Figure 1, participants sat on the bedside
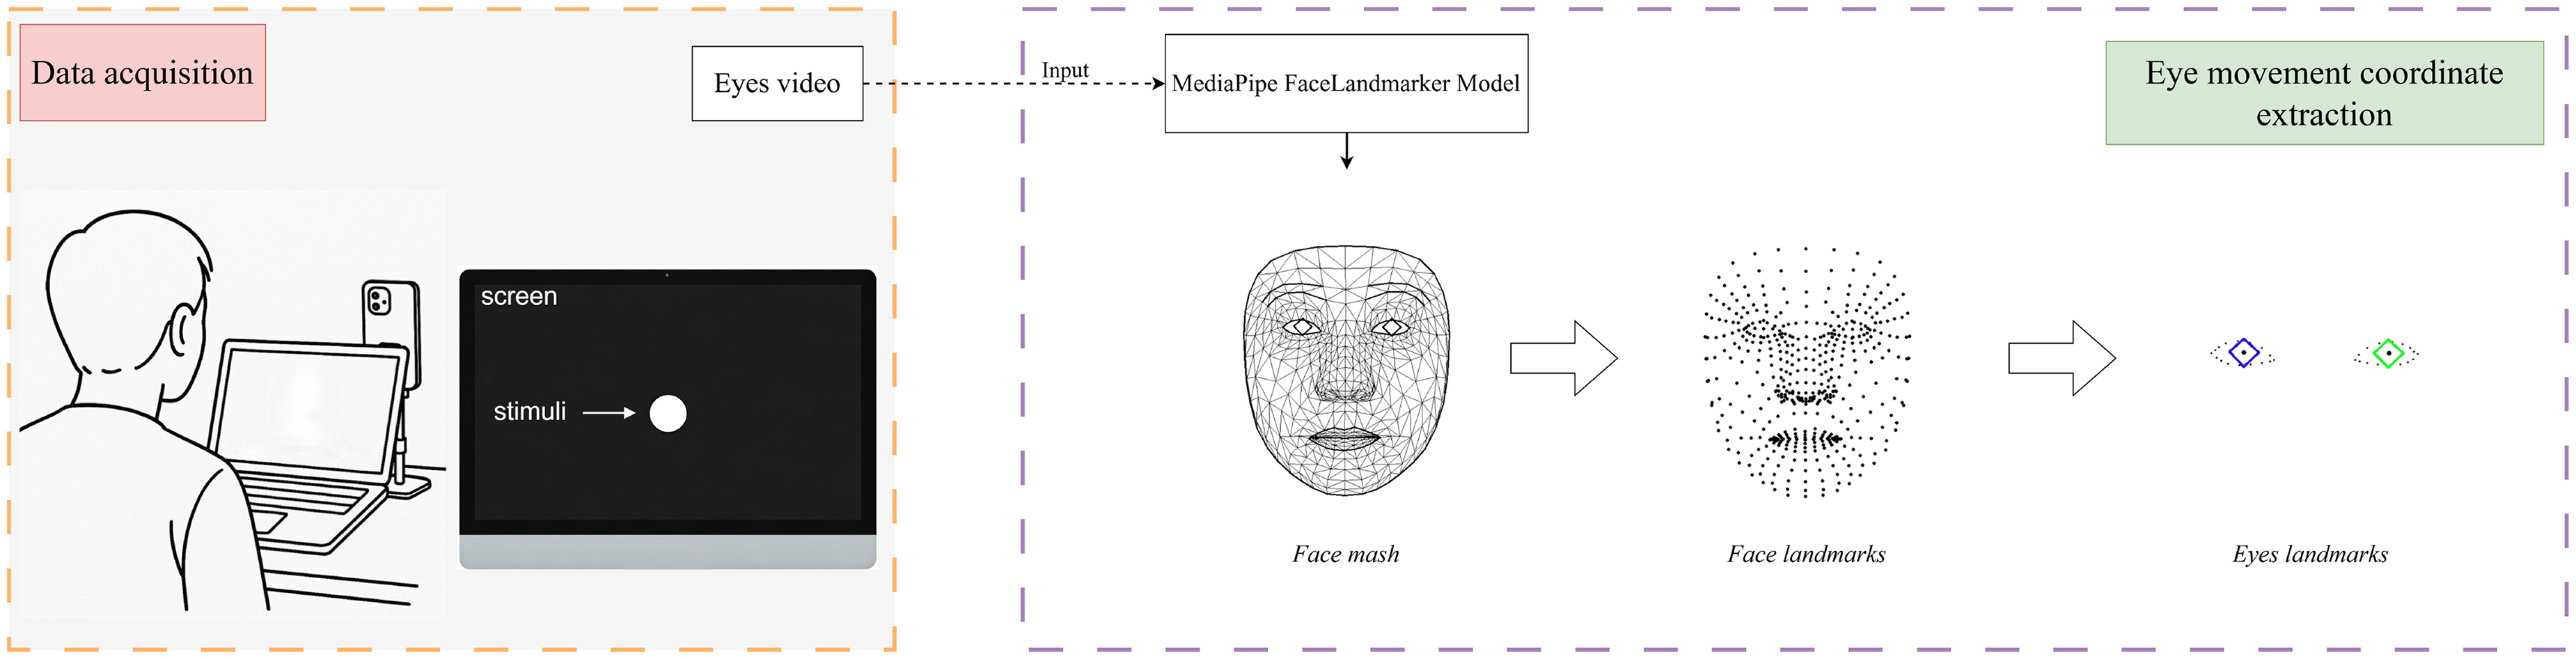
Workflow of video acquisition and eye movement coordinate extraction. The left panel shows the data acquisition setup during a smooth pursuit tracking task performed by the subject. The right panel illustrates the automatic extraction of facial landmarks using the MediaPipe FaceLandmarker model, followed by the selection of eye region landmarks to obtain eye movement coordinates.
Clip segmentation and annotation
Raw videos were annotated using 2-second temporal windows as the basic analysis unit. The first and last 5 seconds of each recording were excluded to avoid start-up and task-disengagement effects.
Each 2-second window was independently reviewed in slow motion (frame-by-frame) by two raters: an experienced neurologist specializing in movement disorders and a research assistant trained in oculomotor pattern recognition. Annotation was performed on continuous video streams using custom timestamping software. Windows were assigned to one of two categories: abnormal event or non-abnormal event. Discrepancies between raters were resolved through consensus discussion.
Abnormal events were defined as the presence of catch-up saccades or other saccadic intrusions interrupting smooth pursuit. Catch-up saccades were identified as rapid eye movements that either advanced the gaze position to “catch up” with the moving target (single-step saccade) or overshot the target followed by a corrective saccade in the opposite direction (two-step pattern). Non-abnormal events were characterized by sustained, uniform horizontal smooth pursuit matching the target velocity without saccadic interruptions or abrupt velocity changes.
Representative examples are illustrated in Figure 2. The non-abnormal event (upper panel) shows synchronized sinusoidal trajectories of both eyes maintaining smooth tracking over the 10-second recording period. The abnormal events (lower panels) demonstrate three characteristic patterns: Abnormal Sample 1 exhibits a single-step corrective saccade; Abnormal Sample 2 shows rapid gaze lag followed by catch-up; and Abnormal Sample 3 displays multiple corrective saccades with overshoot.

Representative examples of annotated eye movement patterns. Upper panel: Non-abnormal event. Lower panels: Three abnormal events showing different abnormal patterns. Data shown after preprocessing.
Windows containing obvious noncompliance (e.g. participant looking away from the screen, excessive talking, or head movement exceeding the camera frame) were excluded prior to category assignment.
Following annotation and quality control procedures, the final dataset comprised 1767 labeled windows from 18 PD patients, of which 826 were classified as abnormal events and 941 as non-abnormal events.
Ocular landmark extraction
Accurate landmark localization is critical for quantitative oculomotor analysis. We therefore adopted Google’s MediaPipe FaceLandmarker, 24 which combines FaceDetector and FaceMesh-V2 to provide stable three-dimensional facial landmarks under varying illumination and viewpoints. The overall workflow for ocular landmark extraction is illustrated in Figure 1.
Raw videos were recorded at 1080 p/60 fps. Landmark extraction was performed by configuring MediaPipe’s video mode to process at 30 fps, which balances temporal resolution with cross-device compatibility (most consumer smartphones default to 30 fps recording) and reduces inter-frame jitter from the landmark detector; consequently, each 2-second analysis window contains 60 annotated frames.
For each frame, the model outputs 478 three-dimensional facial landmarks. To focus on oculomotor analysis, we selected 42 key points for each frame, including 16 peri-ocular points, four iris points, and one pupil point for each eye.
Canthus-based spatial normalization
Static tremor, posture changes, head motion, and variable camera distance introduce substantial noise into PD eye-movement videos. To mitigate these factors we devised a canthus-based normalization scheme (Figure 3(a)). For the right eye, the outer canthus (landmark 33) and inner canthus (landmark 133) define the horizontal bounds, mapped to 0 and 1, respectively. Given the raw horizontal coordinate


Illustration of the data preprocessing workflow. (a) Normalization of eye movement coordinates based on canthus (eye corner) positions. (b) Blink detection and filtering to remove invalid data segments. (c) Extraction of eye movement kinematic parameters, including displacement, velocity, and acceleration, from the preprocessed data.
Trajectory smoothing
High-frequency spikes caused by camera shake and landmark jitter hinder reliable detection of abnormal movements. Each of the 42 landmark trajectories was therefore smoothed with a one-dimensional (1D) linear Kalman filter. 25 By tuning process and measurement noise parameters, the filter suppresses random noise while preserving genuine large-amplitude fluctuations such as saccades.
Blink detection
Blinks introduce abrupt coordinate changes and may confound feature extraction; previous studies routinely exclude blink frames.14,19 We propose a simple vertical-coordinate rule (Figure 3(b)): a blink is flagged when the
Eye-movement feature extraction
For each 2-second sample (60 frames), we engineered a multi-dimensional kinematic feature set (Figure 3(c)). The horizontal pupil position forms the primary time series. From successive frames, we derived instantaneous displacement, velocity, and acceleration to characterize smoothness and transient fluctuations as follows:


The resulting feature vector supplies rich, targeted information for subsequent abnormality-recognition model training.
DP-MDLA Net for horizontal pursuit-abnormality detection
We propose a Dual-Path Multi-scale Dilated-LSTM Attention Network (

The architecture of our proposed Dual-Path Multi-scale Dilated-LSTM Attention Network (DP-MDLA Net) model.
Design motivation
Horizontal SPEM possesses strong temporal dependence and complex dynamics. In normal tracking the eye moves at (quasi-)constant velocity, whereas abnormal behavior is characterized by abrupt velocity changes such as catch-up saccades. Dilated convolution can capture motion patterns at multiple temporal scales without a large computational overhead. 31 By varying the dilation rate the network attends to both fine-grained variations and long-range trends, 32 which is well suited for sequences containing sudden onsets of abnormality.
BiLSTM excels at modeling long-term dependencies in sequential data. 33 Applying BiLSTM on top of convolutional features reinforces temporal integration while the bidirectional structure captures context from both past and future, alleviating the vanishing gradient problem of vanilla recurrent neural networks (RNNs). 34
Since the raw coordinate series, instantaneous derivatives and aggregated statistics differ markedly in information density and difficulty, DP-MDLA Net adopts a dual-path design. Local attention allows each path to focus adaptively on the most discriminative timestamps or dimensions, whereas global attention merges the complementary information, thus balancing richness and tractability and enhancing the detection of complex anomalies.
Input definition

Multi-scale dilated-convolution module
Eye-movement recordings are highly sequential: smooth transitions and sudden jumps jointly determine whether the behavior is normal. Therefore anomaly detection must exploit both short-term variations and longer temporal trends. Path 1 of DP-MDLA Net adopts a multi-scale dilated CNN to capture features at different time scales in parallel.
Let

The resulting feature maps are concatenated along the channel axis,

BiLSTM architecture
Eye-movement sequences exhibit strong temporal dependencies and non-stationary dynamics. To capture both short- and long-range patterns DP-MDLA Net employs a long-short term memory (LSTM) network 35 and its bidirectional extension (BiLSTM). By means of cell state and multiple gating mechanisms, LSTM can model temporal information more effectively than conventional RNNs.
As illustrated in Figure 5, an LSTM cell contains a forget gate


Schematic diagram of the long-short term memory (LSTM) cell structure.
The candidate memory is


Because understanding pursuit failure requires context from both past and future frames, we deploy a bidirectional variant in which forward (

Although BiLSTM already captures sequential dependencies, it may still overlook the few critical instants when the subject fails to follow the stimulus. Therefore, a subsequent attention mechanism 36 is employed to highlight the most discriminative time steps and improve anomaly detection accuracy.
Attention mechanisms
Attention redistributes focus across a sequence by assigning weights to its elements.37,38 In horizontal smooth-pursuit anomaly detection this allows the network to emphasize segments that contain catch-up saccades or velocity drops while down-weighting normal portions. DP-MDLA Net integrates a two-tier attention scheme: local attention is applied within each path, and global attention fuses the two paths.
Local attention
Given the BiLSTM outputs

Global attention
Let


Classifier and training procedure
After obtaining the global attention vector

To provide a systematic view of the end-to-end optimization, Algorithm 1 details the training loop. Step 1 initializes all parameters with Xavier initialization. Steps 2 and 3 iterate over the data for

Experiments
To evaluate the effectiveness of DP-MDLA Net in detecting horizontal smooth-pursuit abnormalities, we conducted experiments on a dataset collected from patients with Parkinson’s disease. This section details the dataset, evaluation metrics, baseline methods, training protocol, and experimental results, along with interpretation and analysis.
Dataset
Through the preprocessing steps outlined earlier, we obtained a total of 1767 samples, each corresponding to a 2-second eye-movement sequence. Among these, 941 samples were labeled as normal (negative) and 826 as abnormal (positive). The dataset was randomly split into training, validation, and test sets in an 8:1:1 ratio, using a fixed random seed (42) to ensure reproducibility. Specifically, the training set contains 1415 samples (753 negative and 662 positive), while both the validation and test sets comprise 176 samples each (94 negative and 82 positive).
Evaluation metrics
We adopted five standard classification metrics: accuracy, precision, recall, F1-score, and the area under the ROC curve (AUC). All metrics were computed using 


Baseline models and training configuration
To provide a comprehensive comparison, we implemented several representative deep learning baselines as follows:
1D-CNN. This model is a conventional 1D CNN with 64 channels and a kernel size of 5, serving as a purely convolutional reference. A dropout rate of 0.1 is used before the final fully connected layer.
BiLSTM. A BiLSTM network with hidden size 128 (dropout 0.1) is employed, enabling the model to capture temporal dependencies in both forward and backward directions.
Transformer. This baseline is a lightweight transformer encoder with four attention heads and a hidden dimension of 32, designed to leverage global self-attention for sequence modeling.
DCNN-BiLSTM-Attn. This hybrid model integrates three dilated convolutions (dilation rates 1, 2, and 3; 128 channels; and kernel size 3) for multi-scale feature extraction, followed by a BiLSTM layer (hidden size 256) and a local attention mechanism to enhance sequential modeling.
BiLSTM-Attn. In this variant, a BiLSTM (hidden size 256) is directly applied to the raw feature sequence, with a local attention layer, omitting any convolutional front-end.
DP-MDLA Net. Our proposed model adopts the same dilation rates and hidden sizes as previously described, including 128 CNN channels (kernel size 3), BiLSTM hidden size 256, two stacked layers, and a dropout rate of 0.1.
All models were trained under an identical protocol: batch size of 2, initial learning rate
Results and analysis
Table 1 summarizes the quantitative results, while Figure 6 provides a visual comparison of the test-set metrics across models. DP-MDLA Net consistently outperforms all baselines by a clear margin across all evaluation metrics.
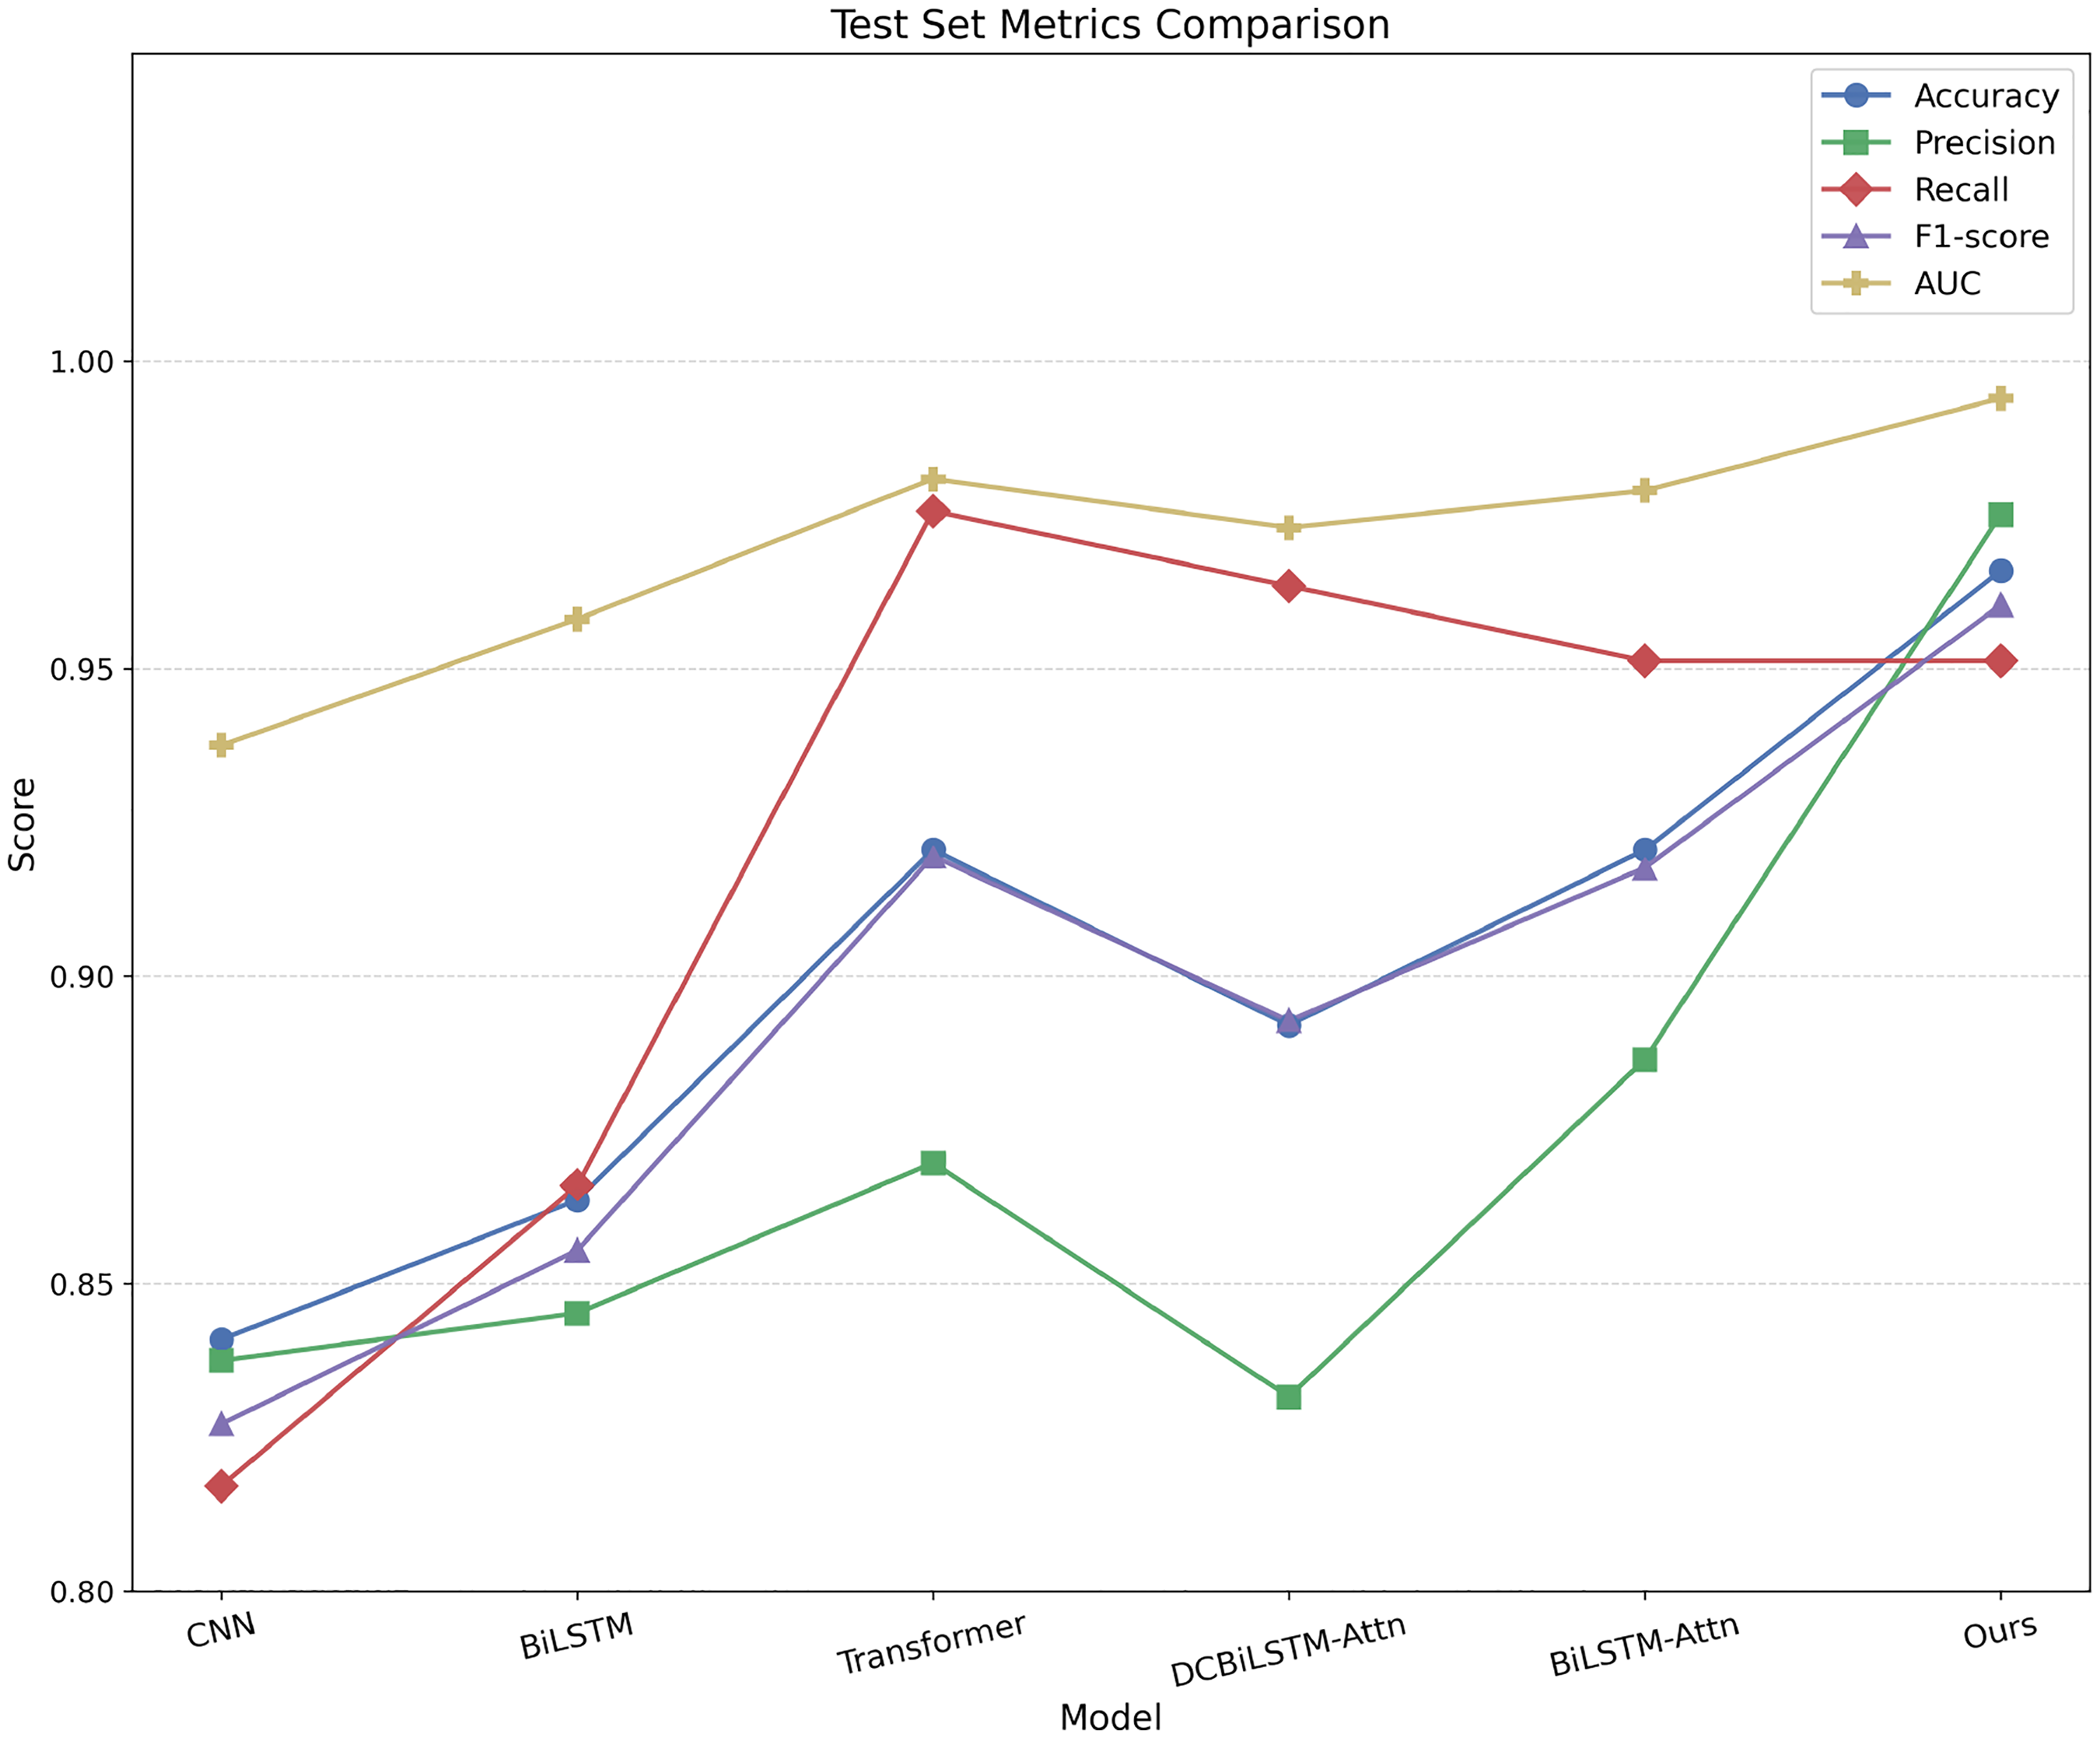
Performance comparison of baseline models and the proposed DP-MDLA Net on the test set across five evaluation metrics: accuracy, precision, recall, F1-score, and AUC. DP-MDLA Net achieves the highest accuracy, precision, F1-score, and AUC, and ranks third in recall. DP-MDLA Net: Dual-Path Multi-scale Dilated-LSTM Attention Network; AUC: area under the ROC curve.
Performance comparison of the proposed model and baselines on smooth-pursuit abnormality detection in Parkinson’s disease.

1D-CNN: one-dimensional convolutional neural network; BiLSTM: bidirectional long-short term memory; DCNN-BiLSTM-Attn: dilated convolutional neural network and bidirectional long-short term memory attention; DP-MDLA Net: Dual-Path Multi-scale Dilated-LSTM Attention Network.
Examining the accuracy results reveals a clear trend. The convolution-only 1D-CNN achieves 0.8409, reflecting its limited capacity for modeling long-range temporal dependencies. Adding bidirectionality raises the BiLSTM’s accuracy to 0.8636. The transformer, benefiting from global self-attention, achieves 0.9205. Integrating attention into the dilated CNN and BiLSTM hybrid (DCNN–BiLSTM-Attn) yields an accuracy of 0.8920, while attaching attention directly to BiLSTM results in 0.9205. In comparison, DP-MDLA Net achieves an accuracy of 0.9659, an improvement of 4.54 percentage points over the best-performing baseline. Similar patterns are observed for precision (0.9750 vs. 0.8864), recall, and F1-score, confirming that our architecture not only reduces false positives but also maintains a high true-positive rate and balanced overall performance.
Figure 7 shows the ROC curves and corresponding AUC values for all models. All models achieve an AUC >0.93, suggesting that the task is intrinsically separable. Notably, DP-MDLA Net obtains an AUC of 0.9939; its ROC curve is nearly indistinguishable from the ideal top-left boundary, demonstrating near-perfect discrimination between normal and abnormal pursuit patterns in PD. These results demonstrate that while attention mechanisms and global context modeling improve performance, the integration of multi-scale dilated convolutions with sequential and attention-based modules in DP-MDLA Net brings further gains, particularly in reducing false positives and improving robustness to subtle abnormal events.
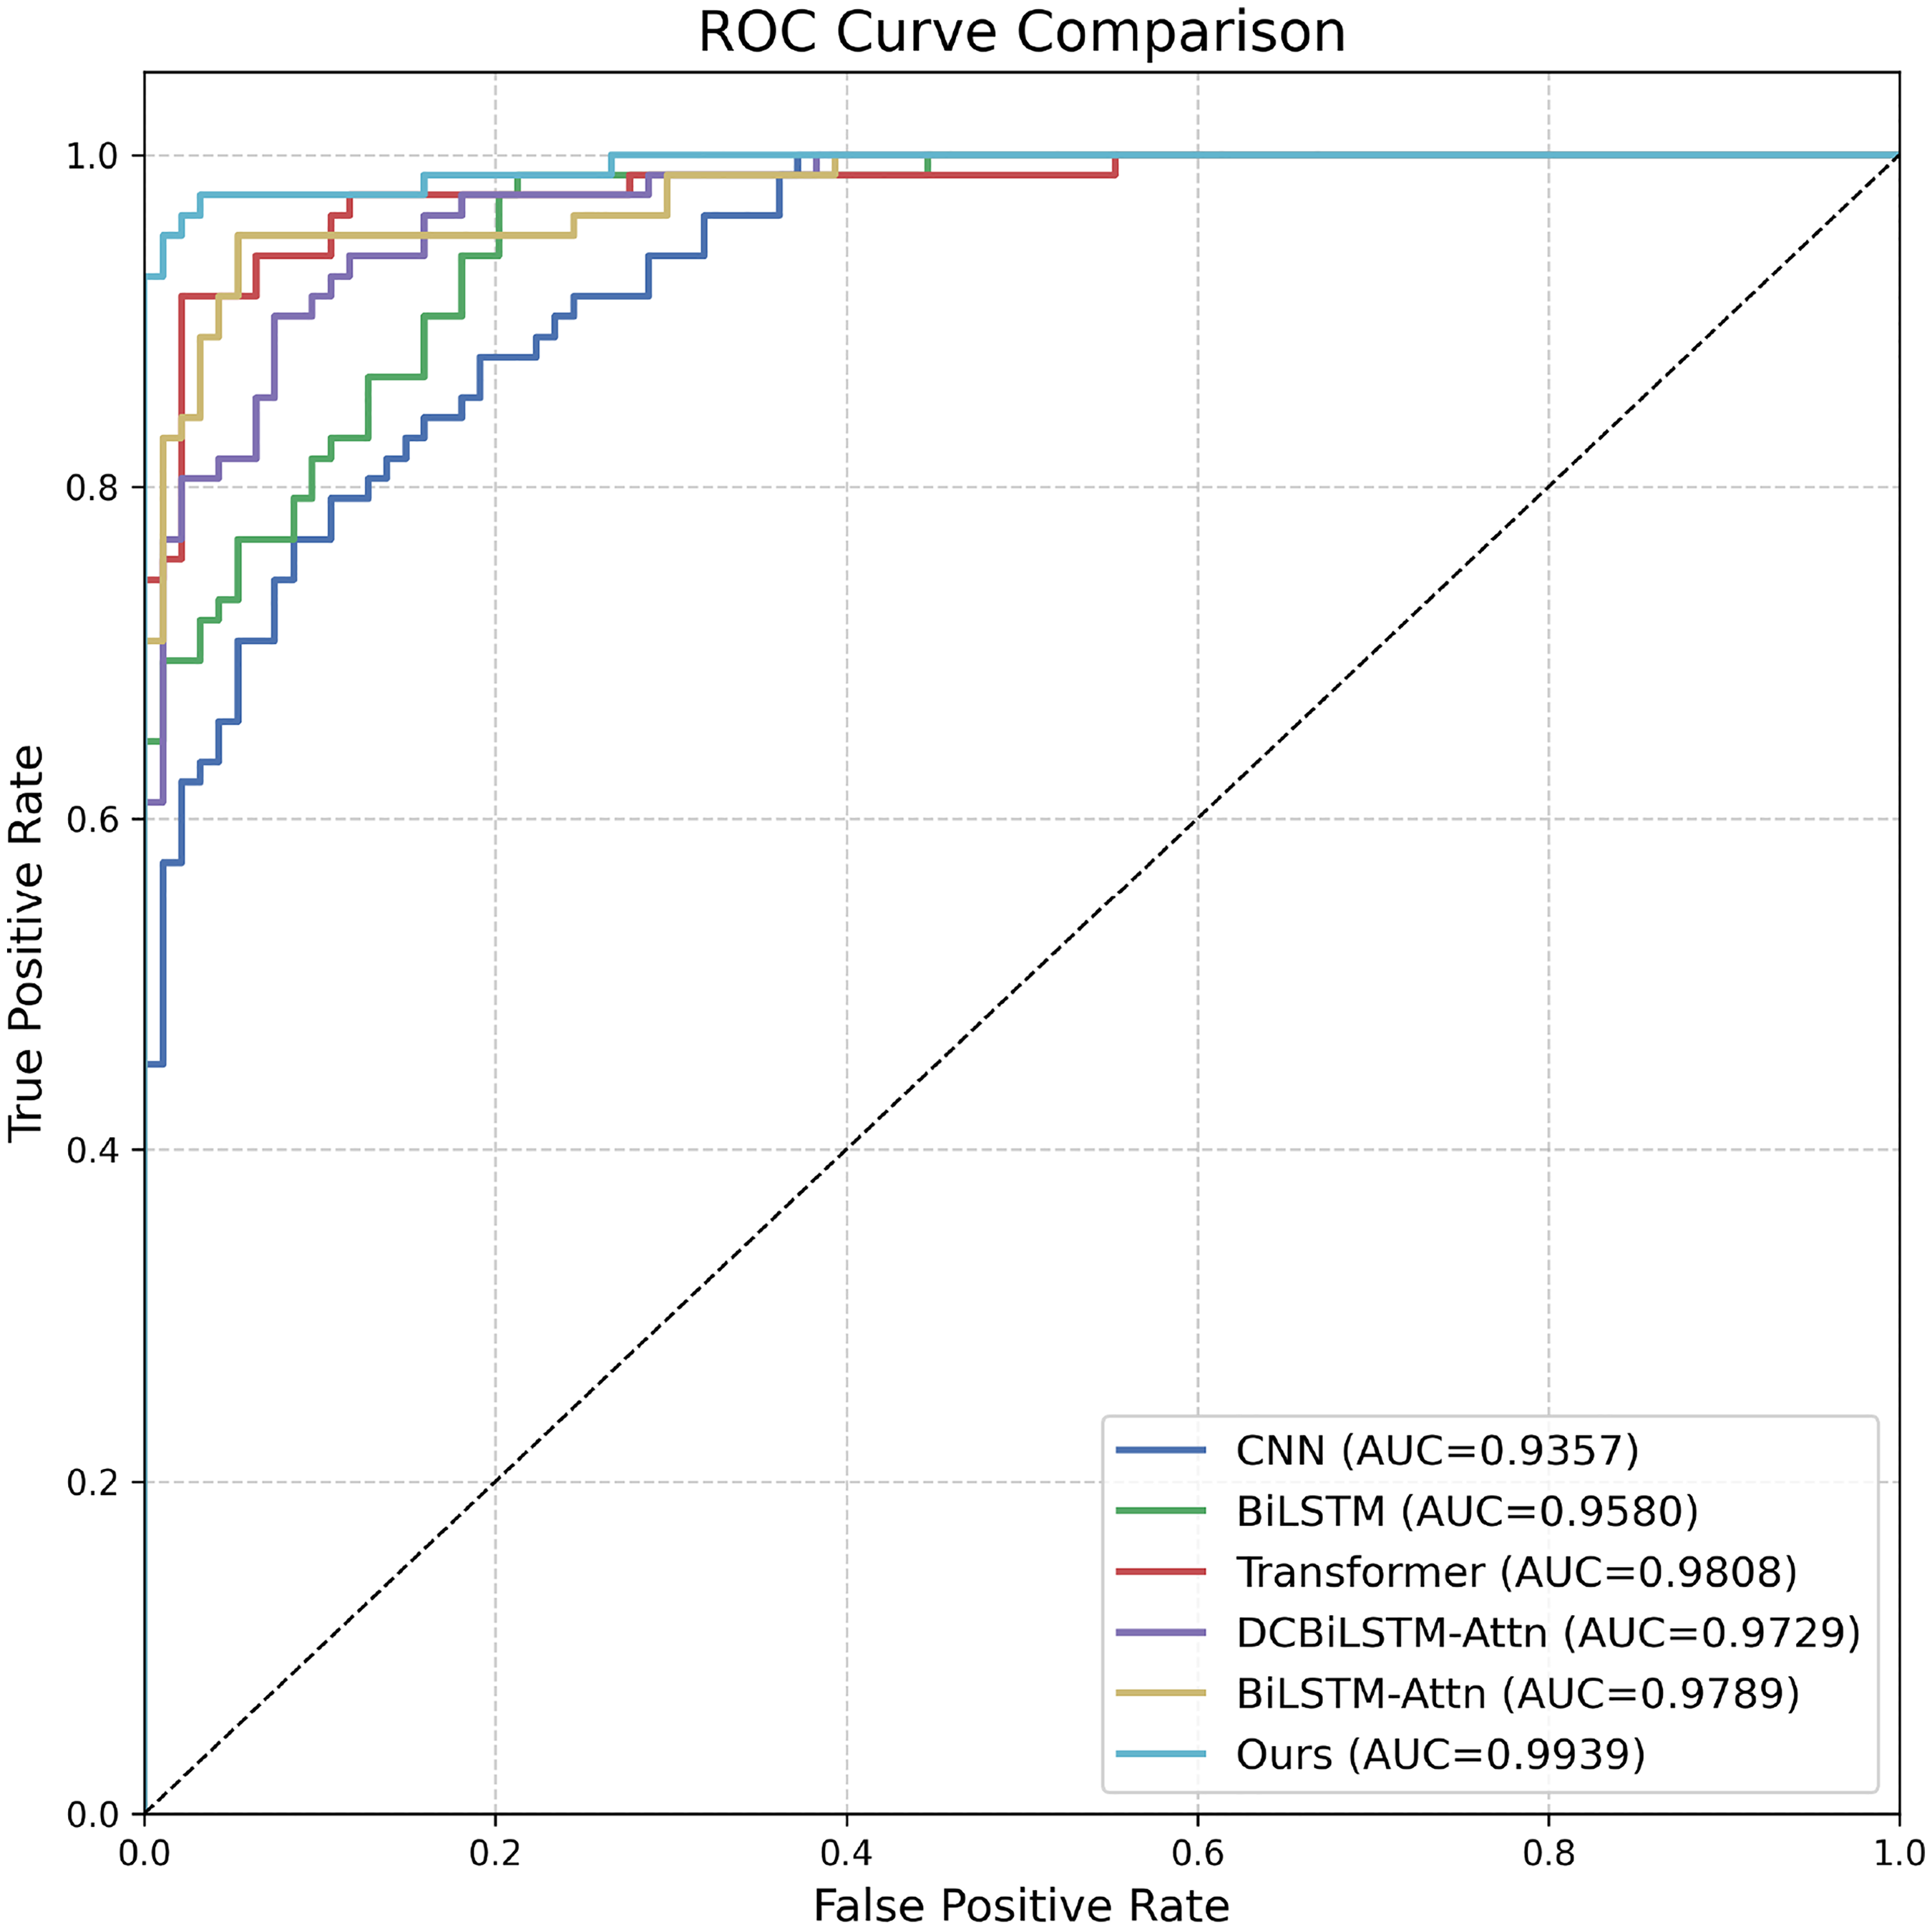
ROC curves of all methods on the test set. DP-MDLA Net almost coincides with the ideal top-left corner (AUC
Five-fold cross-validation
To validate the robustness of DP-MDLA Net across different data partitions, we conducted five-fold stratified cross-validation on the entire dataset (1767 samples: 941 normal and 826 abnormal). Each fold was trained independently for 200 epochs using batch size 2, AdamW optimizer (learning rate
Table 2 summarizes the performance across all five folds. The model achieved a mean accuracy of 93.04%
Five-fold cross-validation results and summary for DP-MDLA Net.

DP-MDLA Net: Dual-Path Multi-scale Dilated-LSTM Attention Network; AUC: area under the ROC curve.
To gain insights into the model’s failure modes, we analyzed the distribution of prediction errors across the five-fold cross-validation. Table 3 summarizes the confusion matrix statistics for each fold. On average, the model produced 7.2 false positives (FP) and 17.4 false negatives (FN) per fold, corresponding to a false-positive rate (FPR) of 3.83% and false-negative rate (FNR) of 10.53%. The higher FNR indicates that the model occasionally fails to detect subtle abnormal pursuit patterns, while the low FPR demonstrates reliable recognition of normal smooth pursuit.
Error distribution across five-fold cross-validation.

TP: true positives; FP: false positives; FN: false negatives; TN: true negatives; FPR: false-positive rate; FNR: false-negative rate.
Figure 8 visualizes the average confusion matrix. The high values along the main diagonal (TN
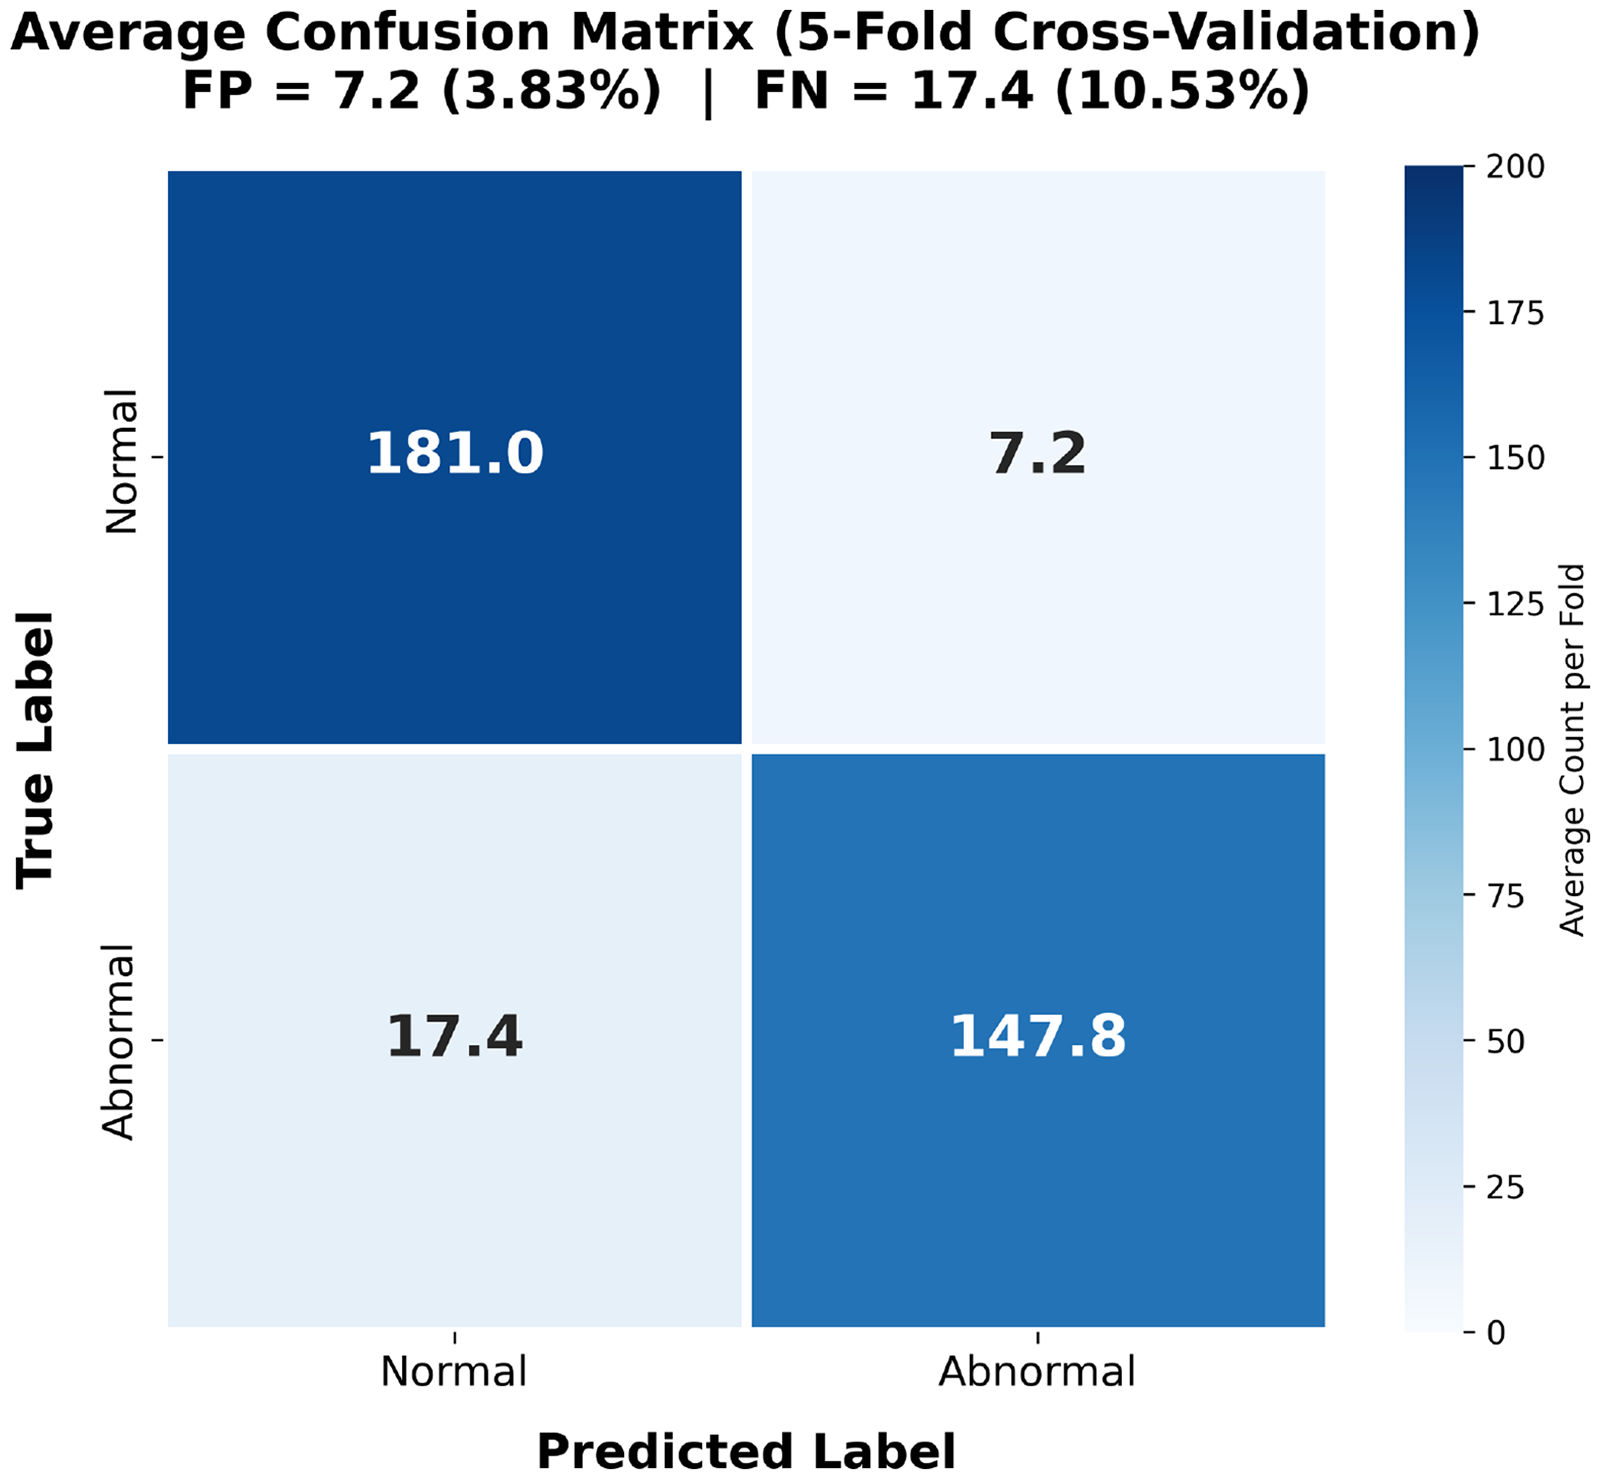
Average confusion matrix across five-fold cross-validation. The higher FNR (10.53%) relative to FPR (3.83%) reflects a conservative classification tendency. FPR: false-positive rate; FNR: false-negative rate.
The fold-to-fold variability in FNR (7.27%–12.73%, SD
Subject-independent evaluation
To further assess the model’s generalization capability on unseen patient data, we reorganized the dataset using a strict subject-independent split strategy: the training set comprised 12 patients (1178 samples: 586 normal and 588 abnormal), the validation set included three patients (247 samples: 144 normal and 103 abnormal), and the test set contained three patients (342 samples: 207 normal and 135 abnormal). This ensured that no samples from the same patient appeared across the training, validation, and test sets, thereby eliminating the influence of patient-specific cues on model performance.
The training configuration consisted of a batch size of 2, the AdamW optimizer (learning rate
On the test set, the model achieved an accuracy of 93.57%, a precision of 96.69%, a recall of 86.67%, and an F1-score of 91.38%. Figure 9 presents the model’s ROC curve, with an AUC of 96.93%, demonstrating that the model maintains excellent classification performance and generalization capability in the subject-independent scenario.
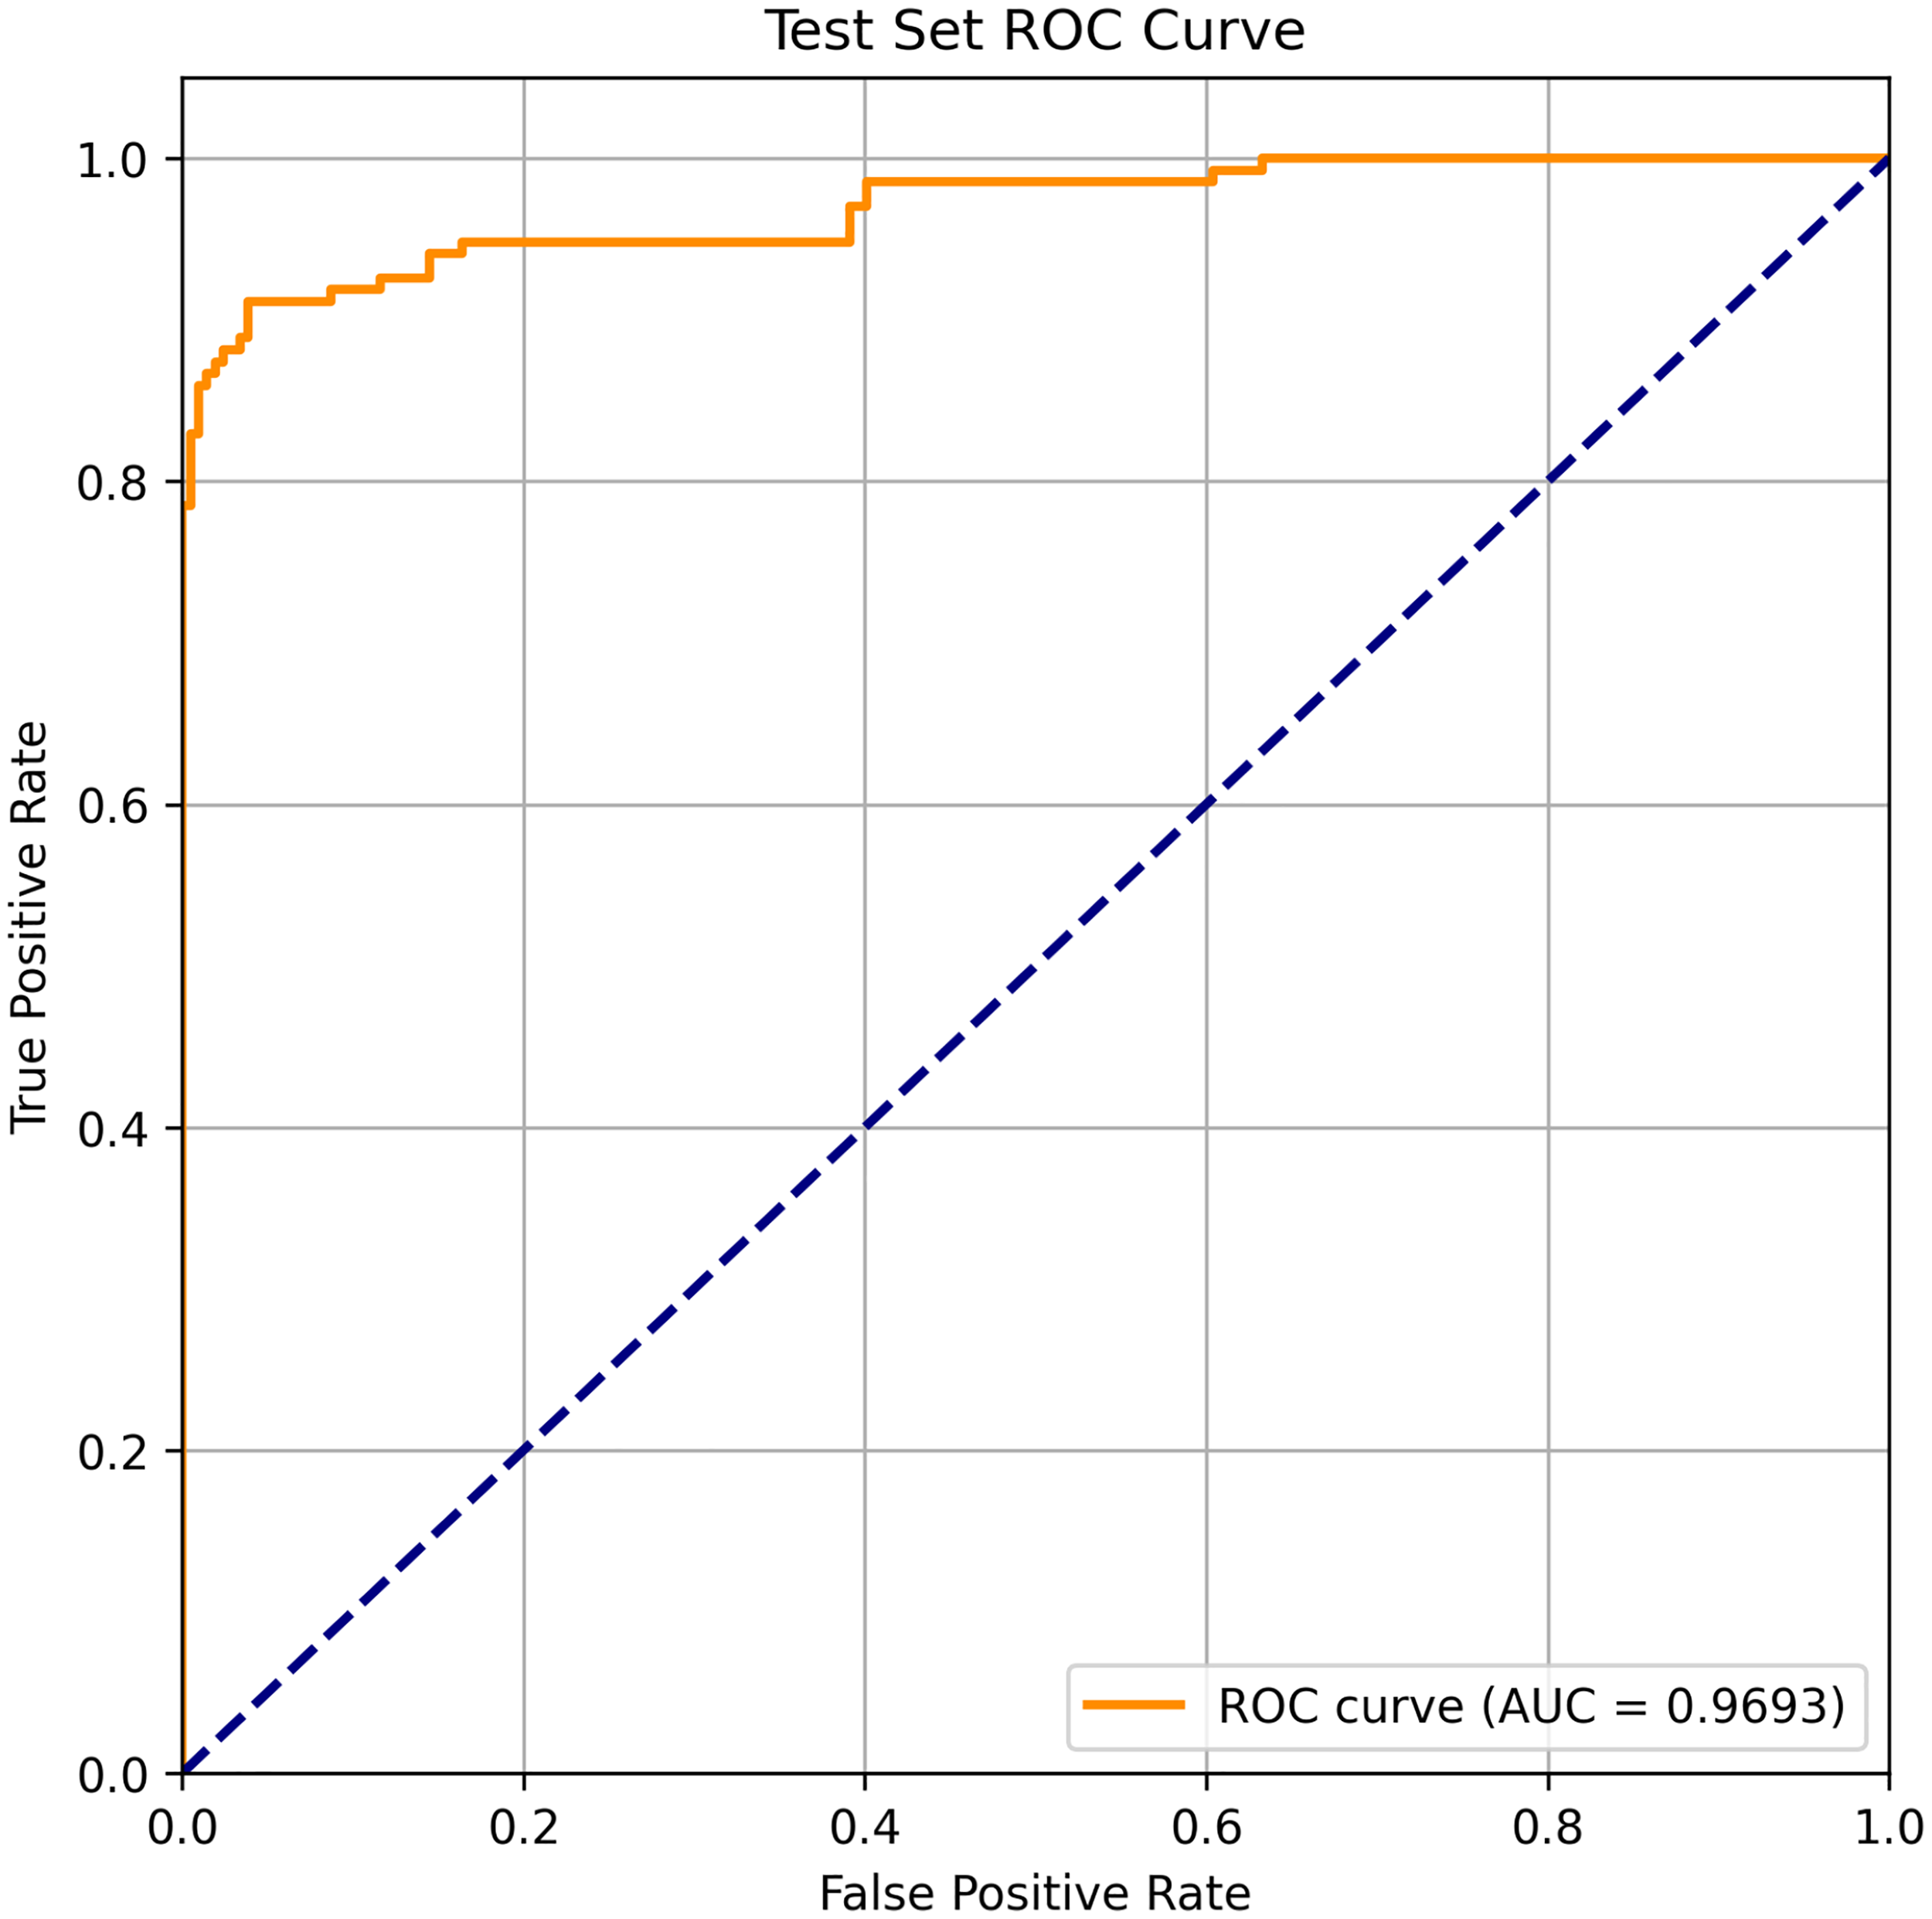
ROC curve of the model on the subject-independent test set. The model achieves an AUC of 96.93%. ROC: receiver operating characteristic; AUC: area under the ROC curve.
Ablation study: Impact of canthus-based normalization
To validate the effectiveness of the proposed canthus-based spatial normalization method, we conducted an ablation study by training and evaluating the DP-MDLA Net without this preprocessing step. The experimental setup was identical to the baseline comparison: an 8:1:1 random split (1415 training, 176 validation, and 176 test samples), 800-epoch training with batch size 2, AdamW optimizer (learning rate
In the ablation variant, raw eye-movement coordinates extracted from MediaPipe were directly used without canthus-based normalization (equation (1)), meaning the model received absolute pixel coordinates susceptible to camera distance, head pose, facial expression, and tremor variations.
Table 4 presents the quantitative comparison between the full model (with normalization) and the ablation variant (without normalization). Removing the canthus-based normalization resulted in substantial performance degradation: accuracy dropped from 96.59% to 84.09% (a decrease of 12.50 percentage points), precision decreased from 97.50% to 88.57%, recall fell from 95.12% to 75.61%, F1-score declined from 96.03% to 81.58%, and AUC reduced from 0.9939 to 0.9323. These results clearly demonstrate that the canthus-based normalization is crucial for suppressing noise introduced by global disturbances and enhancing the model’s ability to detect subtle abnormal eye movement patterns in PD patients.
Ablation study on canthus-based normalization.
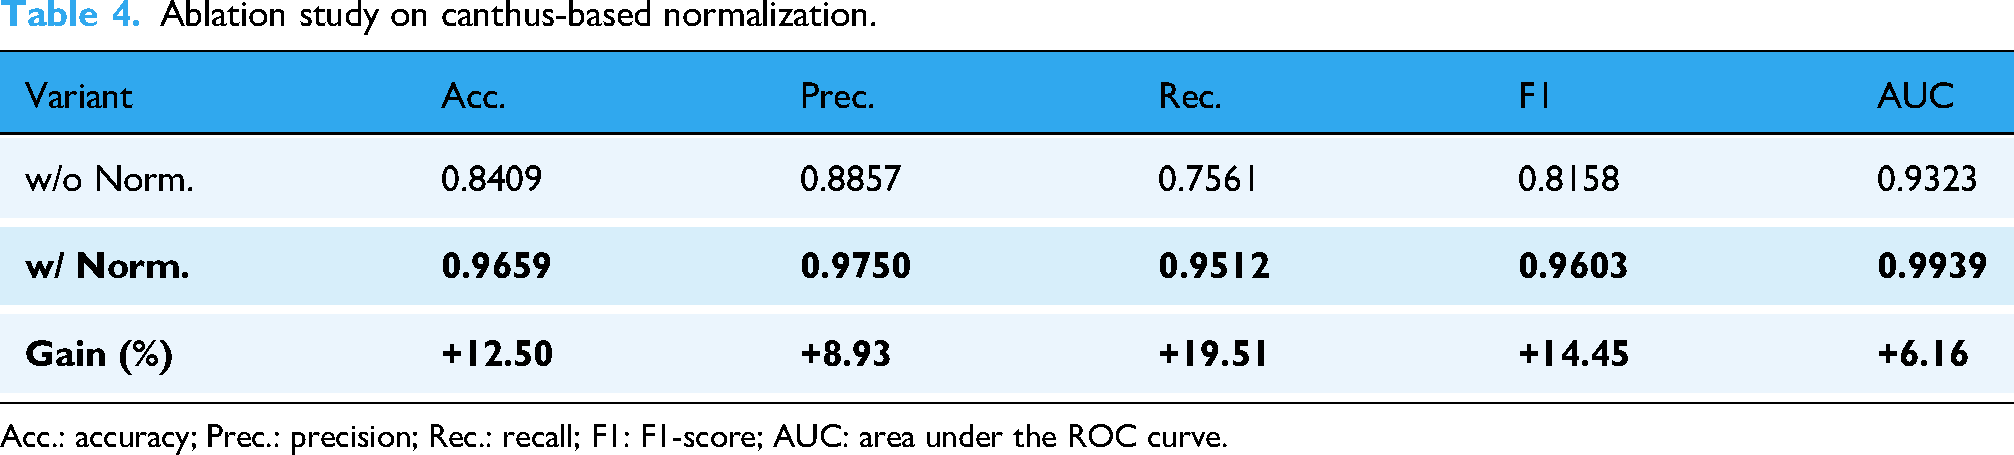
Acc.: accuracy; Prec.: precision; Rec.: recall; F1: F1-score; AUC: area under the ROC curve.
Discussion
Factors contributing to high precision
The high precision (97.50%) achieved by DP-MDLA Net reflects its ability to capture the brief pursuit interruptions that characterize parkinsonian oculomotor control. Wu et al. 41 documented frequent “non-compensatory” saccades during pursuit-intrusions that arise even when gaze is already aligned with, or ahead of, the target—together with progressive binocular misalignment. These transient intrusions are the type of events our model targets and can be overlooked by metrics that average pursuit gain or spectral content over longer windows. The dual-path architecture represents both the slow-phase envelope and the sharp kinematics of catch-up saccades, and hierarchical attention aligns the two streams to improve discrimination in borderline windows while limiting false positives.
AUC performance characteristics
The AUCs are uniformly high across evaluated time windows, suggesting that discriminative information is present throughout the tracking epoch rather than being confined to initiation or a particular phase. Early instrumented studies 42 noted that saccadic peak velocity is largely preserved in PD, whereas amplitudes are reduced (hypometria) and pursuit gain varies widely across individuals. Subsequent reviews 43 cautioned that medication state and task design compound this variability, limiting the diagnostic value of aggregate pursuit metrics. In contrast, event-level features that capture the microstructure of pursuit interruptions—beyond gain alone—appear more stable. Multi-scale integration helps accommodate inter-individual differences by pooling evidence across temporal resolutions, while canthus-referenced normalization reduces acquisition-specific drift. Preprocessing steps such as Kalman filtering and blink removal further enhance separability, and the dual-path design contributes modest, consistent gains in the most difficult windows.
Clinical utility and implications
Beyond a binary label, DP-MDLA Net enables continuous, event-level phenotyping of pursuit control. Recent work by Li et al.
44
showed that automated analysis of pursuit velocity stability and catch-up saccade frequency can separate patients with PD from healthy controls
Distinct neurodegenerative disorders show different patterns of impairment across pursuit and saccadic control, and task- and feature-level choices can help differentiate these profiles. In this setting, a low-cost, event-level digital marker is well suited for research stratification and trial endpoints while remaining usable at the bedside. Digital oculomotor markers also complement fluid biomarkers in PD monitoring: blood-based measures such as neurofilament light chain 45 reflect axonal injury but require sampling and laboratory infrastructure, whereas smartphone-based pursuit assessment provides non-invasive functional readouts that can be obtained frequently at low cost. Combining both modalities may improve longitudinal monitoring by linking structural disease burden with functional control.
Feasibility and innovation
Several design choices distinguish DP-MDLA Net and support practical use. First, reliance on smartphone video removes the need for infrared eye trackers, chin rests, or controlled lighting. Whereas classical studies used magnetic search coils 42 or clinical-grade oculography, our approach trades absolute positional precision for accessibility and shows that velocity-derived features carry sufficient signal for robust event detection. Second, canthus-referenced normalization compensates for camera distance, view angle, and involuntary head motion without prior calibration, lowering barriers in resource-constrained clinics and for patients with motor disability. Finally, the dual-path, multi-scale architecture with hierarchical attention targets nuisance variation at its source and supports event-level detection from commodity video. The resulting accuracy (96.59%) and AUC (0.9939) are within the range reported by instrumented studies for related tasks, motivating prospective validation and pilot integration into clinical workflows.
Limitations and future directions
This work should be interpreted in light of its scope and design. Our focus was event-level detection of pursuit abnormalities in PD, analogous to quantifying the oculomotor items in rating scales such as the UPDRS, rather than differential diagnosis. Trained raters labeled 2-second windows as abnormal or normal based on dysmetric catch-up saccades, gaze jumps, and tracking instability. We did not collect concurrent infrared eye-tracker recordings as a reference standard. Because all recordings were obtained from confirmed PD patients, the training data do not include healthy controls or disease controls such as essential tremor, progressive supranuclear palsy, or cerebellar ataxia.
This design fits the primary objective of building a robust detector to support longitudinal monitoring and complement examiner ratings, but it limits our ability to assess diagnostic specificity or to distinguish PD from other movement disorders. Future work will include same-session validation against clinical-grade eye tracking to establish quantitative correspondence between smartphone-derived and reference measurements, and the recruitment of healthy and disease-control cohorts to test generalization to differential diagnosis.
Although canthus-based normalization mitigates many sources of variation, video quality still depends on illumination, hand-held stability, and device type, which in turn affects landmark detection by MediaPipe or similar frameworks. The present study focuses on horizontal pursuit; vertical tracking and other oculomotor abnormalities remain to be explored. Moreover, the network outputs a binary label and does not grade severity. A clinically useful severity scale will need to be defined with movement-disorder specialists and incorporated into the learning objective. The dataset contains 1767 samples from 18 individuals, limiting demographic diversity. Finally, two mobile devices are currently required—one for stimulus presentation and one for video capture. As mobile hardware evolves, merging these functions into a single unit would further simplify the setup and enhance portability.
Despite these constraints, our results show that smartphone-based video analysis can provide a reliable and scalable alternative to equipment-intensive eye tracking for assessing Parkinsonian smooth-pursuit deficits.
Conclusion
We present a smartphone-based framework for detecting smooth-pursuit abnormalities in PD that combines canthus-referenced normalization, targeted preprocessing, and DP-MDLA Net, a dual-path, multi-scale dilated-LSTM attention model. Evaluated on 1767 2-second eye-movement sequences from 18 patients, the method achieved 96.59% accuracy, 97.50% precision, 96.03% F1-score, and an AUC of 0.9939 on held-out test data, outperforming CNN, LSTM, and transformer baselines.
Generalization was supported by five-fold cross-validation (mean accuracy 93.04% and AUC 97.35%) and a subject-independent split (accuracy 93.57% and AUC 96.93%). An ablation study showed that canthus-based normalization is critical, increasing accuracy by 12.50 percentage points and improving all other metrics.
By removing the need for specialized eye trackers, the framework supports low-cost, portable bedside assessment and event-level phenotyping from commodity video. Window-level outputs can be aggregated into session indices to track within-patient change and medication-state fluctuations, providing a standardized, reproducible complement to examiner-rated scales for longitudinal monitoring of smooth-pursuit impairment in PD.
Footnotes
Acknowledgements
We are deeply grateful to all participants who generously took part in this study.
Ethical approval
This study was approved by the Ethics Review Committee for Scientific Research Projects of Affiliated Zhongshan Hospital of Dalian University (REC number: KY2023-103-1). The study complied with the principles outlined in the Declaration of Helsinki, ensuring that all participants were treated ethically, their rights were respected, and their privacy was protected throughout the research process. Written informed consent was obtained from all participants prior to enrollment.
Consent to participate
Written informed consent was obtained from all participants prior to the study. Participants were informed that their participation was voluntary, that they could withdraw at any time without consequences, and that their data would be anonymized and stripped of identifying information during analysis.
Author contributions
ST and SSL provided the conceptual framework for this research and played a leading role in guiding its direction. ZYT conducted the experiments, collected and processed the data, and designed the models. JZ contributed expertise in the medical field and provided suggestions for experiment design. LWK provided additional assistance, including literature review, experimental support, and guidance on manuscript preparation. QFS provided funding support. YNL and QJZ participated in data annotation. ZYT drafted the initial manuscript. All authors reviewed the manuscript and approved the final version.
Funding
The authors disclosed receipt of the following financial support for the research, authorship, and/or publication of this article: This work was supported by the Interdisciplinary Project of Dalian University (grant numbers DLUXK-2024-QN-014 and DLUXK-2025-FX-001).
Declaration of conflicting interests
The authors declared no potential conflicts of interest with respect to the research, authorship, and/or publication of this article.
Guarantor
JZ
Use of generative AI
Generative artificial intelligence tools (ChatGPT-4 by OpenAI and Claude by Anthropic) were used exclusively for language editing, translation, and improving the clarity and readability of the manuscript text. These tools were not involved in data collection, analysis, interpretation, figure generation, or any substantive intellectual contribution to the research.
Data availability statement
The data supporting the findings of this study are available on request from the corresponding author.