
Abstract
Objectives
Acute kidney injury (AKI) is marked by a rapid decline in renal function, often identified by elevated serum creatinine or reduced urine output. Although stress hyperglycemia ratio (SHR) has been linked to adverse outcomes in various conditions, its association with clinical prognosis in AKI patients remains unclear.
Methods
This cohort study analyzed data from critically ill patients with AKI extracted from the Medical Information Mart for Intensive Care IV (MIMIC-IV, version 3.1) database. The primary outcomes were 28-day and 365-day all-cause mortality, while the secondary outcomes included ICU mortality and in-hospital mortality. The association between SHR and all-cause mortality was explored by Cox proportional hazards regression. The discriminative performance of SHR was evaluated through the Boruta feature selection model, followed by the development of a prognostic prediction model utilizing advanced machine learning
Results
The analysis encompassed 3640 patients with AKI. Multivariable Cox regression analysis demonstrated that elevated SHR significantly predicted increased 28-day mortality [adjusted hazard ratio (HR) 1.19, 95% confidence interval (CI): 1.11–1.29, P < .001, Model 3] and 365-day mortality (HR: 1.17, 95% CI: 1.08∼1.27, P < .001, Model 3). Upon categorizing SHR into quartiles, individuals in the highest quartile (Q4) faced a substantially elevated risk, with a 101% greater likelihood of 28-day death and a 34% elevated hazard of 365-day death relative to those in the lowest quartile (Q1). Boruta feature selection analysis identified SHR as a significant predictor. Among various predictive models evaluated, the CatBoost classifier exhibited the most robust discriminative performance for 28-day and 365-day mortality, achieving an area under the receiver operating characteristic curve of 0.83 and 0.82, respectively, showing comparable discriminative performance to the other models.
Conclusion
The SHR demonstrated a nonlinear association all-cause mortality among critically ill patients AKI, suggesting its potential utility as a reliable prognostic indicator for predicting unfavorable results in AKI patients.
This is a visual representation of the abstract.
Introduction
Acute kidney injury (AKI), defined by a sudden deterioration in renal function, is clinically diagnosed through increased serum creatinine (SCr) concentrations or diminished urine output. 1 This prevalent condition occurs in approximately 20%-50% of individuals requiring intensive care unit (ICU) treatment.2,3 AKI is significantly linked to a range of unfavorable clinical outcomes, such as prolonged hospitalization durations, increased requirement for kidney replacement therapy (KRT), substantial healthcare expenditures, and elevated mortality rates.4–7
The stress hyperglycemia ratio (SHR), combining hemoglobin A1c (HbA1c) and blood glucose, effectively reflect acute stress-induced hyperglycemia levels. 8 The SHR index has been widely recognized as a reliable indicator of stress-induced hyperglycemia and serves as a valuable prognostic marker for assessing disease severity in critically ill patients. 9 Previous studies have demonstrated that elevated SHR was associated with an increased risk of mortality and adverse outcomes in patients with cardiogenic shock, atrial fibrillation, chronic heart failure, sepsis, and sepsis-associated AKI.10–14 Li et al. 15 reported a U-shaped relationship between SHR and AKI in patients with chronic heart failure. An et al. 16 also found a shaped re” relationship between SHR and one-year mortality in patients with chronic kidney disease (CKD). Among diabetes mellitus patients, SHR is a strong indicator of both immediate and long-term prognosis. 17 However, the relationship between SHR and short-term and long-term mortality in AKI patients was unknown.
Given the emerging evidence linking the SHR to adverse outcomes in various clinical settings, this study sought to examine its association on critically ill patients with AKI. We hypothesized that elevated SHR levels are associated with an increased risk of mortality in critically ill patients with AKI.
Methods
Source of database
The data for this study were obtained from Medical Information Mart for Intensive Care IV (MIMIC-IV version 3.1) database (https://mimic.mit.edu/). 18 The database includes a variety of details on 94,458 admissions of critically ill patients admitted to Beth Israel Deaconess Medical Center in Boston during 2008 to 2022. 19 The database encompasses a comprehensive array of data elements, including survival outcomes, physiological parameters, diagnostic information, lab test results, and treatment methods. Due to the MIMIC database's comprehensive and high-quality dataset as well as other advantages, it is increasingly being utilized by researchers for academic studies.20–22 One of the authors, Yingxiu Huang was granted access to the database after successfully completing an online training course and examination (Certificate ID: 56513391). As the dataset ensures patient privacy, consent for participation was not required. The work described was conducted in accordance with the Code of Ethics of the World Medical Association (Declaration of Helsinki) and reported following the REporting of studies Conducted using Observational Routinely-collected Data (RECORD) guideline.
AKI diagnosis and AKI stage
The diagnosis of AKI following the Kidney Disease Improving Global Outcomes (KDIGO) criteria 1 : (a) an elevation of serum creatinine (sCr) levels by at least 50% within a seven-day period, (b) an escalation in sCr serum creatinine (sCr) of ≥0.3 mg/dL within 48 h, or (c) a persistent reduction in urine output to below 0.5 milliliters per kilogram per hour sustained over a period exceeding six hours. AKI Stage 1 was characterized by a maximum-to-baseline change of ≥0.3 mg/dL or a ratio between 1.5 and 1.9 or urine output <0.5 mL/kg/h for 6–12 h. Stage 2 was characterized by a ratio of 2.0–2.9 or urine output <0.5 mL/kg/h for ≥12 h. Stage 3 included a ratio ≥3.0, serum creatinine (sCr) ≥ 4.0 mg/dL, or urine output <0.3 mL/kg/h for ≥24 h or anuria for ≥12 h or initiation of KRT. 23
Inclusion and exclusion criteria
Adult patients (clusion criteria serum creatinine (sCr)ine output <0.5kilogram per hour sustained over a period exceeding six houPatients were excluded if they met the following states: without AKI diagnosis, missing baseline data of glucose and HbA1c. Patients with repeated ICU admissions will be filtered to retain only the first admission record.
Exposure
The primary exposure of interest is the SHR. The SHR is determined as the index derived from admission glucose and HbA1c within the first 24 h of ICU admission, according to the formula below24,25:

The SHR was evaluated in two ways: as a continuous measure and as a categorical indicator. When it was a categorical variable, SHR was divided into four groups according to the quartile division of SHR: Q1 group <0.881, Q2 group 0.881–1.062, Q3 group 1.063–1.318, Q4 group >1.318.
Outcome
The primary outcomes were 28-day and 365-day all-cause mortality, defined as death from any cause within 28 days and 365 days after ICU admission, respectively. The secondary outcomes were in-hospital and ICU all-cause mortality, defined as death occurring during the index hospitalization and during the ICU stay, respectively. The primary outcomes were analyzed from ICU admission as the time zero. To mitigate potential immortal time bias due to AKI occurring after ICU admission, a supplementary 7-day landmark analysis was performed, in which only patients who developed AKI within the first 7 ICU days and survived to the landmark time were included.
Data extraction
Data was extracted from PostgreSQL using structured query language (SQL). 26 Demographic data such as age, sex, and race were gathered. Details on pre-existing conditions, including type 2 diabetes, chronic kidney disease, severe liver disease, heart failure, malignancy, congestive heart failure (CHF), cerebrovascular disease, and chronic pulmonary disease, were identified using International Classification of Diseases (ICD) codes (Supplementary Table S1), and sepsis was defined according to the Sepsis-3 criteria by the presence of documented or suspected infection and an acute increase in the SOFA score of ≥2 points. Vital signs, including heart rate, mean blood pressure (MBP), respiratory rate, and peripheral oxygen saturation (SpO₂), along with laboratory results such as serum glucose, HbA1c, hemoglobin, white blood cell count (WBC), platelets, electrolytes (sodium, potassium, chloride), anion gap, bicarbonate, pH, international normalized ratio (INR), prothrombin time (PT), blood urea nitrogen (BUN), and serum creatinine, were collected. The first 24-h urine output was also collected. Additionally, the severity of illness was evaluated using several scoring systems, including the Sequential Organ Failure Assessment (SOFA), Acute Physiology Score III (APS III), Charlson Comorbidity Index (CCI), Oxford Acute Severity of Illness Score (OASIS), and Simplified Acute Physiology Score II (SAPS II). Intervention included KRT, vasoactive use, and ventilation. Baseline data collection window is shown in Supplementary Figure S1.
Statistical analysis
Patients were divided into four groups according to their SHR quartiles. Descriptive statistics were used in the summary of the attributes. For data with a normal distribution, continuous variables were presented as mean and standard deviation (SD); for data with a skewed distribution, they were presented as median and interquartile range (IQR). Proportions (percentages) were used to display categorical variables. To analyze baseline characteristics, we compared data using the chi-square test for categorical data and the Kruskal‒Wallis test for continuous factors. Patients with missing baseline glucose or HbA1c data were excluded from the study. For covariates with missing data rates below 20%, missing values were imputed using the K-Nearest Neighbors (KNN) method. 27
We employed multivariable Cox proportional hazard regression models to evaluate the independent relationship between SHR and outcome, yielding HRs and 95% CIs for risk assessment. The proportional hazards assumption was tested using residual-based methods. Accordingly, hazard ratios from the Cox models were interpreted as average relative effects over the follow-up period. A refined Cox regression model was applied, which were adjusted for multiple variables. Covariates were chosen based on their established clinical relevance and prior evidence. The reference group was defined as the lowest quartile of SHR. Model 1: Unadjusted. In Model 2, the analysis was adjusted for demographic factors including age, race, and sex. In Model 3, the analysis accounted for age, sex, race, diabetes, CHF, severe liver disease, sepsis, chronic kidney disease (CKD), chronic pulmonary disease, cancer, KRT, ventilation, vasoactive drug use, SOFA score, WBC, MBP, platelets, and INR. Trend tests were carried out, wherein the median values of each quartile of SHR were incorporated as continuous variables. Additionally, survival curves were produced by Kaplan‒Meier analysis and compared using log-rank analysis. Restricted cubic splines (RCS) were employed to examine the potential non-linear relationship between the SHR and clinical outcomes. Subgroup analysis assessed SHR on mortality varied by subgroup. The secondary outcome was adjusted for confounders in Model 3. Sensitivity analyses were conducted by excluding patients with ICU stays shorter than 24 h, and by using AKI onset within the first 2 ICU days to further assess the robustness of the findings. The predictive performance of the SHR, SOFA, and SAPSII was compared using Receiver Operating Characteristic (ROC) curve analysis.
The feature selection process was conducted using the Boruta algorithm, a machine learning-based approach that ranks variables according to their relative importance in predicting all-cause mortality. To avoid data leakage, Boruta was applied exclusively to the training set. Statistically significant predictors identified through this process were subsequently incorporated into predictive modeling. The dataset was randomly split into 70% training and 30% testing sets. Five distinct machine learning algorithms - logistic regression (LR), random forest (RF), gradient boosting classifier (GBC), LightGBM, and CatBoost - were systematically implemented to evaluate 28-day and 365-day all-cause mortality risk in AKI patients. Default hyperparameter settings were used for all models, without additional tuning. Model descriptive performance was quantitatively assessed through receiver operating characteristic (ROC) curve analysis and area under the curve (AUC) calculations. All analyses were performed with a fixed random seed of 123 to ensure reproducibility.
Free Statistics software version 2.0 28 and R statistical software version 4.2.2 (http://www.R-project.org, The R Foundation) were used for all studies. A statistically significant test was defined as a two-tailed test with a significance level of p < .05.
Result
Baseline characteristics of participants
The cohort study population comprised 3640 critical AKI patients selected from the MIMIC-IV v3.1 dataset (Figure 1). The cohort included 58% male participants with a mean age of 68 years. During the 28-day follow-up period, 609 deaths occurred, with an overall mortality rate reaching 16.7%. Within 365 days, the mortality rate reached 27.6%, with 1005 patients died. The detailed baseline characteristics of the study population are summarized in Table 1.

Flow chart of the study.
Baseline characteristics of patients with AKI.

Note: SHR: stress hyperglycemia ratio; WBC: white blood cell; BUN: blood urea nitrogen; PH: potential of Hydrogen; INR: international normalized ratio; PT: prothrombin time; HbA1c: glycosylated hemoglobin; CKD: chronic kidney disease; SOFA: sequential organ failure assessment; CCI: charlson comorbidity index; APS III: acute physiology score III; SAPS II: simplified acute physiology score II; OASIS: oxford acute severity of illness score; KRT: kidney replacement therapy.
Kaplan‒Meier survival curve analysis
The Kaplan‒Meier (KM) curve demonstrated that the 28-day and 365-day cumulative survival rates were significantly lower in the Q4 group compared to the Q1 groups, indicating a clear disparity in survival outcomes among the quartiles (P < .0001) (Figure 2A and 2B).

Kaplan‒Meier survival analysis curves for all-cause mortality: (A) 28-day mortality; (B) 365-day mortality.
Landmark analyses
To mitigate immortal time bias, we conducted a landmark analyses at 7 days post-ICU admission. Survival curves before and after the landmark were plotted according to SHR quartiles. As illustrated in Figure 3, the highest SHR quartile (Q4) was associated with the most rapid decline in survival by day 28 (Figure 3A) and, consistently, with the lowest cumulative survival over 365 days (Figure 3B).

Landmark survival analysis from day 7 for (A) 28-day and (B) 365-day mortality, according to SHR quartiles.
The association between SHR and 28-day and 365-day mortality in patients with AKI
Three models were employed to assess the relationship between SHR and primary outcomes. In the unadjusted model (Model 1), each unit increase in SHR was associated with a 33% higher risk of 28-day mortality (HR: 1.33, 95% CI: 1.26–1.4; P.4; 001) and a 17% higher risk of 365-day mortality (HR = 1.17, 95% CI: 1.08–1.1.27; P.1.2001) (Table 2). After controlling for confounding variables in Model 2, SHR showed a 34% increase in 28-day mortality (HR = 1.34, 95% CI: 1.27–1.41; P.34,001) and a 33% rise in 365-day mortality (HR = 1.33, 95% CI: 1.26–1.40; P.33,001). After accounting for all potential confounders in Model 3, SHR remained significantly associated with 28-day mortality (HR = 1.19, 95% CI: 1.11–1.29, P.19,001) and 365-day mortality (HR = 1.17, 95% CI: 1.08–1.27, P.17,001). When SHR was categorized into quartiles, the Q4 group exhibited a markedly elevated risk of 28-day (HR = 2.01, 95% CI: 1.51–2.68, P.01,001) and 365-day mortality (Model 3: HR = 1.34, 95% CI: 1.09–1.65, P = .006) compared to the Q1 group. The P-values for trend test were both less than .05 in all three models.
Cox proportional hazard models for 28-day and 365-day all-cause mortality.

Note: Model 1: Unadjusted. Model 2: Adjusted for sex, age, race. Model 3: Adjusted further for diabetes, CHF, sepsis, CKD, chronic pulmonary disease, severe liver disease, malignant cancer, SOFA score, KKRT, ventilation, vasoactive drug use, WBC, MBP, platelets, and INR.
The non-linear association between SHR and 28-day and 365-day mortality
The restricted cubic spline (RCS) analysis, adjusted for covariates including age, sex, race, diabetes, CHF, sepsis, CKD, chronic pulmonary disease, cancer, severe liver disease, KKRT, SOFA score, ventilation, vasoactive drug use, WBC, MBP, platelets, and INR, revealed a non-linear relationship linking SHR with primary outcomes. Specifically, P-values indicating non-linearity were 0.014 for 28-day mortality (Figure 4A) and 0.015 for 365-day mortality (Figure 4B). The RCS curve inflection points were identified at approximately SHR ≈ 0.92 for 28-day mortality and SHR ≈ 0.75 for 365-day mortality, indicating a threshold effect in the SHR-mortality relationship (Table 3).
The threshold effect of SHR on 28-day and 365-day all-cause mortality.
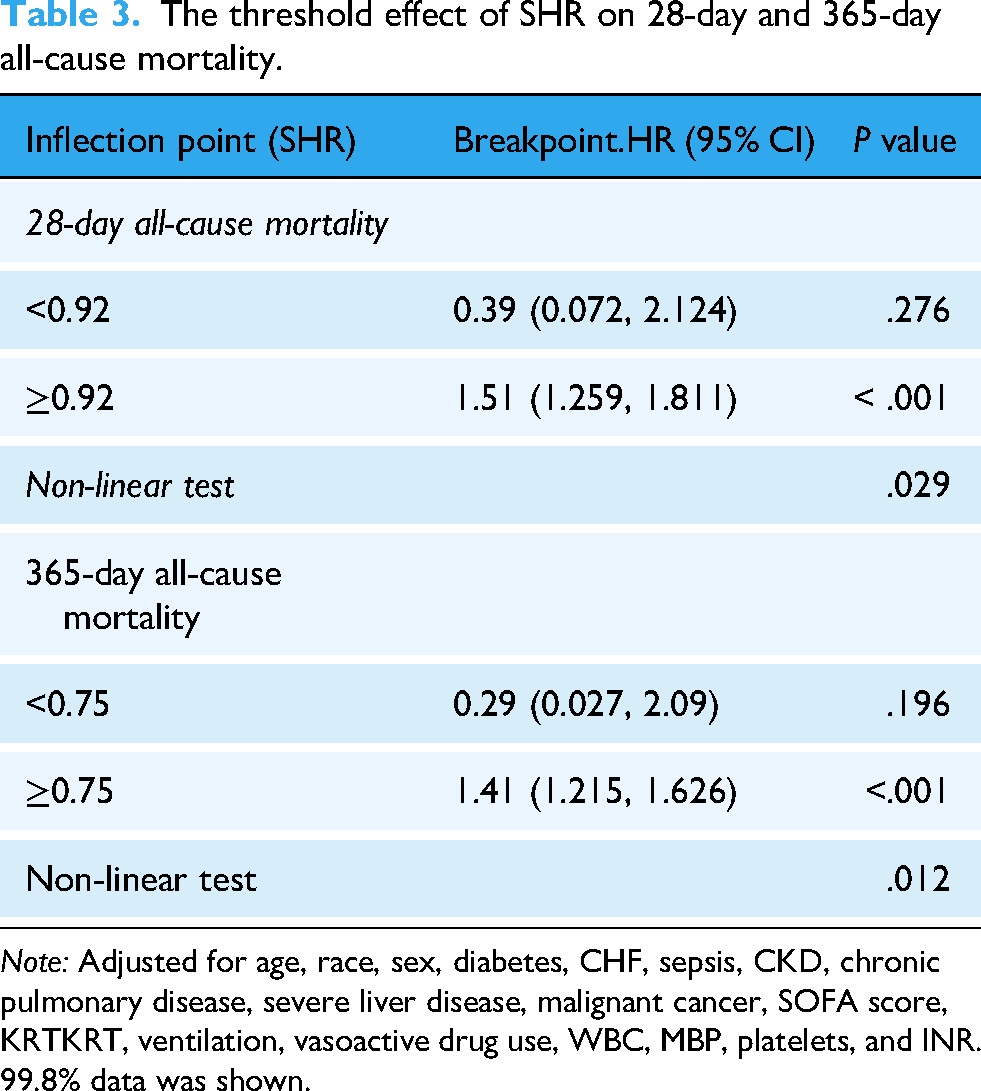
Note: Adjusted for age, race, sex, diabetes, CHF, sepsis, CKD, chronic pulmonary disease, severe liver disease, malignant cancer, SOFA score, KRTKRT, ventilation, vasoactive drug use, WBC, MBP, platelets, and INR. 99.8% data was shown.
Subgroup analyses
A comprehensive subgroup analysis was conducted, stratifying by age (<65 years and ≥65 years), sex, race, diabetes, chronic pulmonary disease, CHF, and myocardial infarct, to evaluate the robustness of the association between SHR and all-cause mortality at 28 and 365 days. The results presented in Figure 5, demonstrated a consistent correlation between SHR and mortality within different subgroups. Interaction tests revealed no significant interactions between subgroups except age (P for interaction > .05).

RCS analysis of SHR with all-cause mortality: (A) 28-day mortality; (B) 365-day mortality. Adjusted for age, race, sex, diabetes, CHF, sepsis, CKD, chronic pulmonary disease, severe liver disease, malignant cancer, SOFA score, KRT, ventilation, vasoactive drug use, WBC, MBP, platelets, and INR. 99.8% data was displayed. 99.8% of data was shown.
Sensitivity analysis
To assess the robustness of our primary findings, sensitivity analyses were conducted by excluding patients with ICU stays shorter than 24 h, and by using AKI onset within the first 2 ICU days. The consistency between the sensitivity analyses and the primary analysis supports the robustness of our findings (Table 4).
Sensitivity analysis of SHR on 28-day and 365-day mortality excluding patients with ICU stay less than 24 h and AKI onset within the first 2 ICU days.

Note: Adjusted for age, race, sex, diabetes, CHF, sepsis, CKD, chronic pulmonary disease, severe liver disease, malignant cancer, SOFA score, KRT, ventilation, vasoactive drug use, WBC, MBP, platelets, and INR.
Secondary outcome
KM curve analysis showed that in-hospital and ICU all-cause mortality were significantly greater in Q4 group compared to Q1 group (both P < .001). The association between SHR and both in-hospital and ICU all-cause mortality were assessed using Cox proportional hazard analysis. The findings revealed that elevated SHR levels correlated with higher in-hospital mortality (adjusted HR = 1.17, 95% CI: 1.07–1.27, P.17,001) and ICU-mortality (adjusted HR = 1.18, 95% CI: 1.08–1.29, P.18,001) (Table 5). RCS analysis further revealed a non-linear relationship linking SHR to mortality during hospitalization and in the ICU.
Secondary outcome.
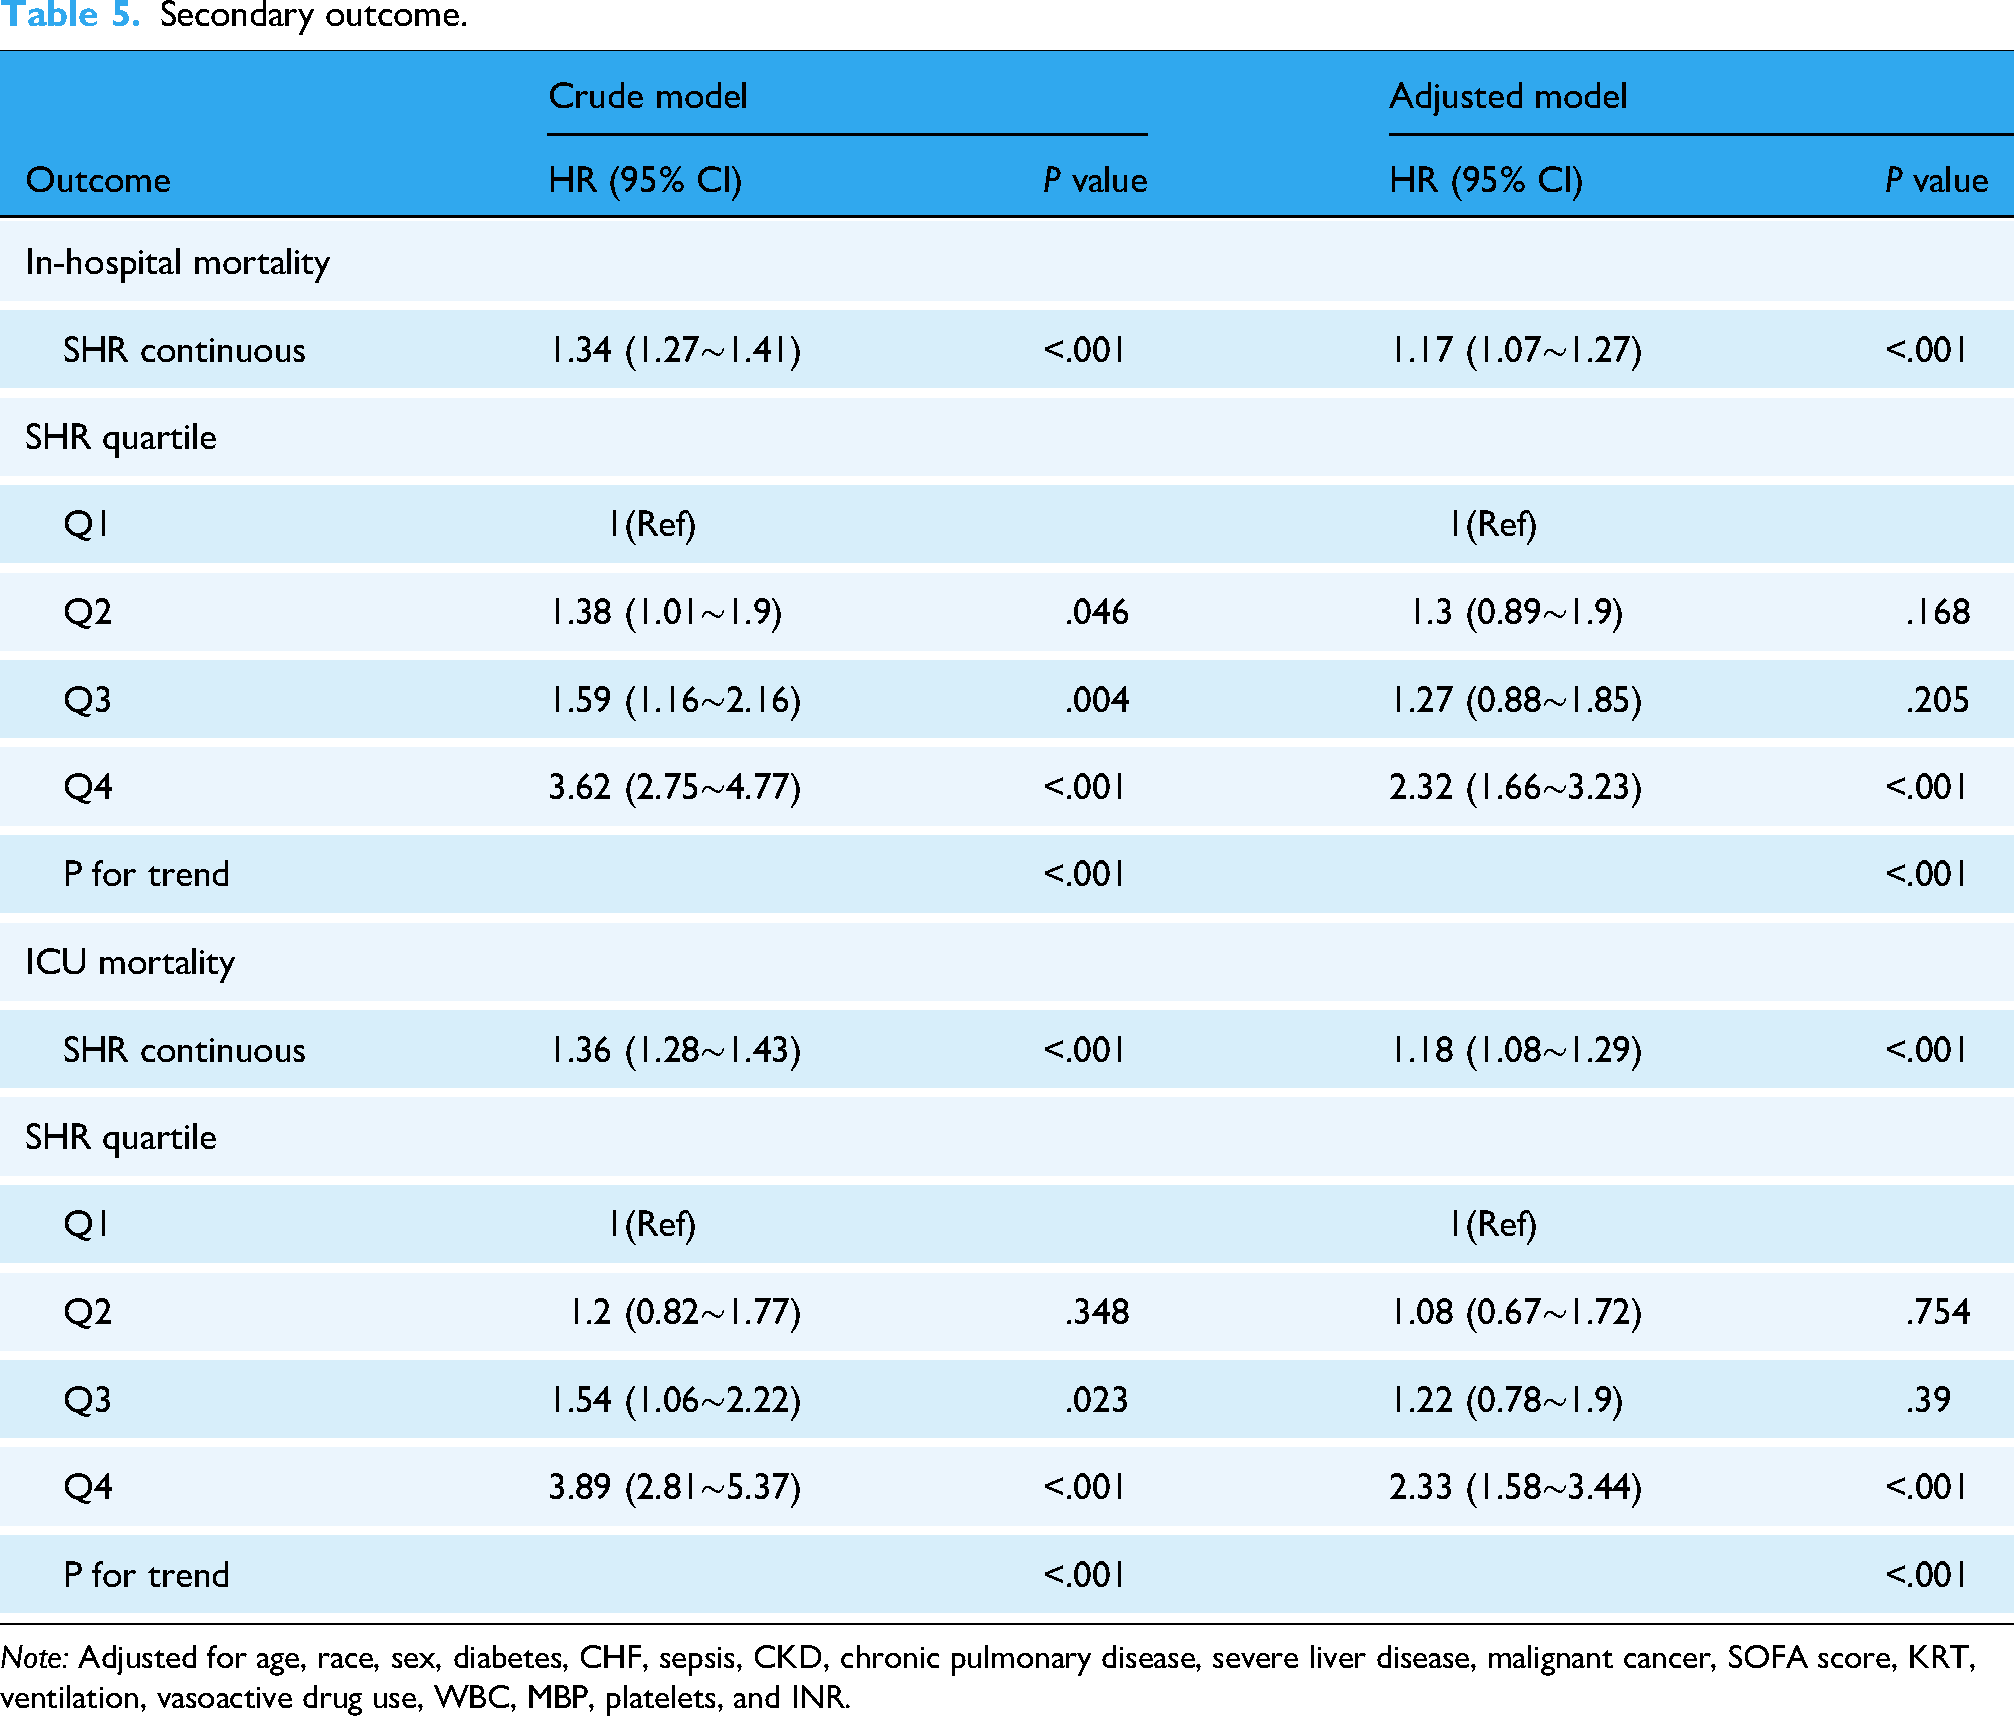
Note: Adjusted for age, race, sex, diabetes, CHF, sepsis, CKD, chronic pulmonary disease, severe liver disease, malignant cancer, SOFA score, KRT, ventilation, vasoactive drug use, WBC, MBP, platelets, and INR.
Receiver operating characteristic analysis
To evaluate the discriminative performance of SHR for both short- and long-term mortality, we conducted ROC analyses for 28-day and 365-day outcomes (Figure 6). For 28-day mortality (Figure 6A), SHR demonstrated moderate discriminative ability with an AUC of 0.633 (95% CI: 0.607–0.658), whereas SOFA (95% CI: 0.669–0.714) and SAPS II (95% CI: 0.74–0.78) showed higher discriminative performance with AUCs of 0.692 and 0.760, respectively. For 365-day mortality (Figure 6B), SHR exhibited a lower AUC of 0.579 (95% CI: 0.557–0.60), while SOFA and SAPS II maintained higher predictive capacities with AUCs of 0.666 (95% CI: 0.647–0.685) and 0.755 (95% CI: 0.739–0.772), respectively.

Subgroup analysis forest plot for all-cause mortality: (A) 28-day mortality; (B) 365-day mortality.

ROC curve analysis of SHR, SOFA, and SAPSII. (A) 28-day mortality. (B) 365-day mortality. SHR: stress hyperglycemia ratio; SOFA: sequential organ failure assessment; SAPSII: simplified acute physiology score II; AUC: area under the curve.

Importance of potential risk factors of 28-day mortality ranked by Boruta algorithm. The horizontal axis is the name of each variable, and the vertical axis is the Z value of each variable. The box plot shows the Z value of each variable during model calculation. The green boxes represent important variables, the red boxes represent unimportant variables, and the yellow boxes represent potentially important variables. CHF: congestive heart failure; MI: myocardial infarction; KRT: kidney replacement therapy; BUN: blood urea nitrogen; SHR: stress hyperglycemia ratio; WBC: white blood cell; INR: international normalized ratio; SOFA: sequential organ failure assessment; CCI: charlson comorbidity index; APS III: acute physiology score III; SAPS II: simplified acute physiology score II; OASIS: Oxford acute severity of illness score; KRT: kidney replacement therapy.
Boruta algorithm
The Boruta algorithm-based feature selection results are shown in Figure 7. In the Boruta method, variables in the red area are deemed irrelevant, while those in the green area are identified as critical features.
Machine learning
The discriminative performance of five machine learning models—Random Forest (RF), Gradient Boosting Classifier (GBC), Logistic Regression (LR), Light Gradient Boosting Machine (LightGBM), and Categorical Boosting (CatBoost)—was evaluated for predicting 28-day and 365-day mortality. Among them, the CatBoost classifier achieved the highest AUC values of 0.83 and 0.82 for 28-day and 365-day death, respectively, showing comparable discriminative performance to the other models (Figure 8A and 8B). Comparable performance was seen across additional metrics, including accuracy (0.83 and 0.79), recall (0.45 and 0.48), precision (0.48 and 0.66), F1-score (0.47 and 0.56), Brier score (0.17 and 0.21), and Matthews correlation coefficient (MCC; 0.36 and 0.43) (Supplementary Table S1).

The machine learning algorithm predicts in-hospital and 360-day all-cause mortality. AUC: Area under the curve; LR: Logistic regression; RF: Random forest; GBC: Gradient boosting classifier; LightGBM: Light gradient boosting machine; and CatBoost: Categorical boosting.
Discussion
Our retrospective cohort analysis revealed a non-linear relationship between SHR and clinical outcomes, including 28-day, in-hospital, ICU, and 365-day all-cause mortality, among critically ill patients with AKI. To our knowledge, this is the first study to examine the relationship between SHR levels and both short- and long-term clinical outcomes in patients with AKI.
Stress hyperglycemia, reflecting inflammatory and neuro-hormonal disturbances during acute conditions or critical illness, is a more reliable biomarker than admission glucose levels or fasting blood glucose.15,16 The SHR was introduced by Roberts et al. to quantify the stress hyperglycemia response. 29 Stress-induced hyperglycemia is common in critically ill patients and is associated with increased risk of all-cause mortality. 9 Previous studies have shown that SHR was independently associated with adverse outcomes in various conditions, including cardiogenic shock, atrial fibrillation, chronic heart failure, and sepsis.10–13 For instance, Xia et al. 30 reported that SHR was independently associated with ICU mortality in AKI patients from MIMIC III database. Similarly, Zhou et al. 14 found that higher SHR correlated strongly with 30-day and 1-year mortality in 1161 patients with sepsis-associated AKI. Cao et al. 31 also demonstrated a J-shaped relationship between SHR and all-cause mortality, and a U-shaped link with cardiovascular mortality in CKD patients. Collectively, these studies suggest that increased SHR index correlate with greater risks of unfavorable clinical outcomes. Our study adds further evidence supporting this association in critical patients with AKI.
Our ROC analyses demonstrated that SHR has moderate discriminative ability for both short- and long-term mortality, with AUCs of 0.633 and 0.579 for 28-day and 365-day mortality, respectively, compared with higher AUCs for SOFA (0.692 and 0.666) and SAPS II (0.760 and 0.755). Although SHR alone is less predictive than these established scoring systems, it offers several practical advantages. Calculation of SHR requires only two routinely available laboratory values—admission glucose and HbA1c—making it feasible for rapid bedside assessment. This simplicity is particularly valuable in resource-limited settings or when immediate severity scoring is not available. Therefore, SHR could serve as a complementary marker alongside conventional scores like SOFA, providing additional prognostic information to improve early risk stratification and guide clinical decision-making in critically ill patients.
The influence of SHR on clinical outcomes may be mediated through various biological pathways. Elevated SHR levels could drive adverse effects via mechanisms including insulin resistance, oxidative stress, and inflammatory reactions. 32 Under stress conditions, the neuroendocrine system activates, increasing sympathetic activity and levels of catecholamines, glucocorticoids, inflammatory cytokines, and glucagon. 33 These alterations may trigger insulin resistance by accelerated breakdown of hepatic glycogen and enhanced gluconeogenesis. Furthermore, increased SHR may amplify the systemic inflammatory response by stimulating the renin–angiotensin–aldosterone system (RAAS) and inducing the release of pro-inflammatory cytokines, such as interleukin-1, interleukin-6, and tumor necrosis factor-α. These cytokines can further injure the kidneys. 34 Additionally hyperglycemia stimulates the production of plasminogen activator inhibitor type 1 (PAI-1). Elevated PAI-1 levels not only reduce local fibrinolysis but also increase the risk of thrombus formation, thereby exacerbating the deterioration of renal function.35,36 While these mechanisms are plausible and supported by prior studies, our findings only demonstrate an association between SHR and clinical outcomes in AKI; causal pathways remain to be investigated in future studies.
To address the potential risk of immortal time bias arising from the time-dependent nature of AKI and stress hyperglycemia assessment, we performed landmark analyses as a robustness evaluation. The results of the landmark analyses were consistent with those of the primary analysis, with similar direction and magnitude of the association between SHR and all-cause mortality in critically ill patients with AKI. Therefore, the landmark analyses did not materially alter the interpretation of the study outcomes but rather reinforced the robustness of our main findings.
This study has several advantages. First, it leverages a large-scale sample from the high-quality MIMIC-IV dataset, a real-world dataset. Second, we employed diverse statistical methods, including RCS analysis, KM analysis, subgroup analysis, sensitivity analysis, Cox regression analysis, the Boruta algorithm, and machine learning, to comprehensively investigate and validate the association between SHR and clinical prognosis.
Limitations
However, the research also has limitations. First, its retrospective nature may introduce selection bias. Second, patients with missing baseline glucose or HbA1c data were excluded, which may have introduced additional selection bias and could limit the representativeness of our study population. Third, we only used SHR data on the first day of ICU admission, limiting our ability to assess SHR variations and potentially affecting the precision of our result. Fourth, as an observational study, we could not confirm the mechanism linking higher SHR levels to AKI prognosis. Fifth, another limitation of our study is that it was conducted solely using the MIMIC-IV database, which may limit generalizability. External validation of SHR in independent or prospective cohorts, ideally spanning multiple centers and diverse populations, is warranted to confirm its prognostic value across varied clinical settings. Finally, landmark analyses were conducted to reduce immortal time bias and evaluate the robustness of the primary findings. However, these analyses may introduce depletion of susceptible, as patients who experience early events are excluded, potentially attenuating the estimated effect size. Therefore, while landmark analyses strengthen the confidence in our results, their inherent selection process should be considered when interpreting the findings.
Conclusion
In this study, SHR emerged as a non-invasive prognostic marker for both short-term and long-term mortality in patients with AKI. These findings suggest that SHR may be useful for risk stratification and for identifying patients at higher risk of adverse outcomes. Further prospective studies with larger sample sizes are needed to confirm these findings and explore the clinical utility of SHR in improving AKI outcomes.
Supplemental Material
sj-docx-1-dhj-10.1177_20552076261421140 - Supplemental material for Stress hyperglycemia ratio and machine learning model for prediction of all-cause mortality in critically ill patients with acute kidney injury: A cohort study from MIMIC-IV
Supplemental material, sj-docx-1-dhj-10.1177_20552076261421140 for Stress hyperglycemia ratio and machine learning model for prediction of all-cause mortality in critically ill patients with acute kidney injury: A cohort study from MIMIC-IV by Yingxiu Huang, Ting Ao, Ming Hu and Peng Zhen in DIGITAL HEALTH
Footnotes
Abbreviations
Acknowledgments
The authors thank Dr Qilin Yang of Department of Critical Care, The Second Affiliated Hospital of Guangzhou Medical University and the Physician Scientist Team for guidance on data extraction and analysis.
Ethics approval and consent to participate
MIMIC-IV database used in the present study was approved by the Institutional Review Boards (IRB) of Institutional Review Boards of Beth Israel Deaconess Medical Center (2001-P-001699/14) and the Massachusetts Institute of Technology (No. 0403000206). The individual information of the participants included in this database was anonymous, and informed consent was waived.
Author contribution statement
Yingxiu Huang designed the protocol and wrote the manuscript. Ting Ao extracted, collected, and analyzed data. Ming Hu prepared tables and figures. Peng Zhen designed the protocol, wrote the manuscript, reviewed, and edited the manuscript. All authors reviewed the manuscript and all authors have approved to the final version of the manuscript.
Funding
The authors received no financial support for the research, authorship, and/or publication of this article.
Declaration of conflicting interests
The authors declared no potential conflicts of interest with respect to the research, authorship, and/or publication of this article.
Data availability
Supplemental material
Supplemental material for this article is available online.
References
Supplementary Material
Please find the following supplemental material available below.
For Open Access articles published under a Creative Commons License, all supplemental material carries the same license as the article it is associated with.
For non-Open Access articles published, all supplemental material carries a non-exclusive license, and permission requests for re-use of supplemental material or any part of supplemental material shall be sent directly to the copyright owner as specified in the copyright notice associated with the article.