
Abstract
Objectives
Sepsis-associated encephalopathy (SAE) is a prevalent complication among critically ill sepsis patients with poor outcomes. This study aimed to develop and validate an interpretable machine learning model for predicting mortality in SAE patients to support clinical decision-making.
Methods
The study utilized two large critical care databases: the Medical Information Mart for Intensive Care IV (MIMIC-IV, version 3.1) database for model construction and internal validation, and the eICU Collaborative Research Database (eICU-CRD, version 2.0.1) for external validation. The XGBoost model was trained to predict patient mortality at 28 and 90 days after ICU admission, and performance was assessed by indicators including the area under the curve (AUC). To improve the interpretability of the model, SHapley Additive exPlanations (SHAP) analysis revealed key features affecting prognosis at both population and individual levels.
Results
A total of 4922 SAE patients were included, with 39 variables selected for model development. The XGBoost model performed best, with internal validation AUCs of 0.930 (95% CI: 0.917–0.942) and 0.906 (95% CI: 0.891–0.919) for 28-day and 90-day predictions, respectively. Notably, external validation achieved AUCs of 0.771 (95% CI: 0.748–0.792) and 0.759 (95% CI: 0.736–0.782), respectively. The Shapley value analytical framework was systematically applied to decode feature importance patterns and illuminate individual prognostic determinants.
Conclusions
Validated across two large critical care databases, the interpretable XGBoost model serves as a reliable tool for mortality prediction in SAE patients, which may help clinicians identify high-risk SAE patients early and optimize management to improve patient outcomes.
Introduction
Sepsis-associated encephalopathy (SAE) is the most prevalent form of secondary brain dysfunction in sepsis patients, with an incidence rate of over 70%.1,2 Its pathogenesis is driven by microglia-mediated neuroinflammation induced by heat shock proteins, among other multifactorial mechanisms. 3 Clinically, SAE manifests as a spectrum of neurological impairments, ranging from altered consciousness and cognitive decline to delirium and coma, all of which substantially worsen patient outcomes.4,5 SAE is associated with significantly higher mortality compared to sepsis without encephalopathy, with rates reported between 50% and 70%, particularly among elderly patients and those with multiple organ dysfunction. 6 Beyond acute mortality, SAE leads to persistent neurological deficits that cause long-term cognitive impairments and a diminished quality of life, 7 making it both a major determinant of short-term mortality and a critical predictor of long-term prognosis in sepsis patients. 8
Accurate mortality prediction in SAE patients is essential for guiding clinical decisions, as it facilitates early, targeted intervention in high-risk patients. Although widely used, conventional scores such as APACHE II and SOFA demonstrate limited predictive performance in this population.9,10 Thus, there is an urgent need for the development of more precise and personalized prognostic models to improve risk stratification and clinical management strategies.
Recent machine learning (ML) models have made substantial contributions to the medical field, especially in disease prediction and prognosis. These models are adept at handling high-dimensional, nonlinear clinical data, revealing intricate relationships missed by traditional statistics.11,12 Furthermore, the integration of explainable artificial intelligence (XAI) techniques, such as SHapley Additive exPlanations (SHAP), has greatly enhanced model transparency by elucidating the contribution of individual features to prediction outcomes. 13 By revealing the decision-making process, this interpretability fosters clinician trust and facilitates the creation of personalized treatments, thereby maximizing the clinical utility of ML.
In this study, we aimed to develop and externally validate an explainable ML model to predict mortality in SAE patients. Additionally, we sought to clarify the importance of various features and to elucidate the model's workings through the SHAP method.
Methods
Data source
In this retrospective cohort study, data were obtained from two large-scale public databases. The Medical Information Mart for Intensive Care IV (MIMIC-IV, version 3.1) and the eICU Collaborative Research Database (eICU-CRD, version 2.0.1).14–16 The MIMIC-IV database was used for model development and internal validation. It includes clinical data from over 380,000 patients admitted to the Beth Israel Deaconess Medical Center in Boston, Massachusetts, between 2008 and 2019. For external validation, the eICU-CRD dataset, which includes clinical data from over 200,000 ICU admissions across 208 US hospitals between 2014 and 2015, was utilized. Both databases provide comprehensive patient information, including demographics, vital signs, laboratory results, and treatment details.
The study was approved by the Institutional Review Boards (IRBs) of Beth Israel Deaconess Medical Center (Boston, Massachusetts) and the Massachusetts Institute of Technology (Cambridge, Massachusetts). Individual patient consent was waived, as all protected health information was de-identified. Access to the databases was granted to individuals who completed the Collaborative Institutional Training Initiative (CITI) examinations. One author (Ziyi Wang) obtained access to both databases and was responsible for data extraction (Certification Number: 66982272).
Participant selection
At present, there is no unified diagnostic standard for SAE. In this study, SAE was defined as sepsis that met the Sepsis-3 criteria upon admission to the ICU, combined with Glasgow Coma Scale (GCS) <15 or delirium within the first 24 h of ICU admission.8,17
Exclusion criteria included6,817–19: (1) age < 18 years; (2) not the first ICU admission; (3) ICU stay duration < 24 hours; (4) presence of primary brain injury (e.g. traumatic brain injury, ischemic stroke, hemorrhagic stroke, epilepsy, or intracranial infection); (5) mental disorders; (6) long-term alcohol abuse or drug addiction; (7) metabolic encephalopathy, hepatic encephalopathy, hypertensive encephalopathy, hypoglycemic coma, and other liver and kidney diseases that affect consciousness; (8) acute or chronic liver disease; and (9) severe electrolyte or glucose disturbances, including hyponatremia (<120 mmol/L), hyperglycemia (>180 mg/dL), or hypoglycemia (<54 mg/dL), or partial pressure of carbon dioxide (PaCO2) ≥ 80 mmHg.
Observation indicators
In this study, we used Navicat Premium (version 17.0) to extract data on patients admitted to the ICU within the first 24 hours from two databases using structured query language (SQL). Six key categories of characteristics from the first day of ICU admission were included (1) demographics: age, gender, weight, and race; (2) ICU length of stay (Los icu); (3) scale scores: Acute Physiology and Chronic Health Evaluation II (APACHE II), the Sequential Organ Failure Assessment (SOFA) score and the Glasgow Coma Scale (GCS) score; (4) treatment: mechanical ventilation, hemodialysis continuous, continuous renal replacement therapy (CRRT), and vasoactive agent use; (5) vital signs: heart rate, systolic blood pressure (SBP), diastolic blood pressure (DBP), mean blood pressure (MDP), respiratory rate, temperature, and percutaneous arterial oxygen saturation (SpO2); (6) laboratory indicators: white blood cells (WBC), creatinine, blood urea nitrogen (BUN), platelets, calcium, chloride, hemoglobin, potassium, lactate, and glucose. For variables with multiple measurements within 24 hours, both the maximum and minimum values were considered.10,20 To reduce bias from missing data, variables with more than 20% missing values were excluded (Supplemental Figure S1), while others were handled using the multiple imputation by chained equations (MICE) method. The primary outcome measure was 28-day mortality in patients with SAE, and the secondary outcome measure was 90-day mortality.
Establishment and validation of the prediction models
The Boruta algorithm is a feature selection technique designed to identify the most influential features affecting a target variable within a dataset. 21 It works by generating g selection technique designed to identify the most influential features affecting a target variable within a datasety. glucose. For vscore for each feature. A feature is deemed important if its Z-score significantly exceeds the maximum Z-score of the shadow features over multiple independent tests.
For this study, the MIMIC-IV dataset was divided into training and internal validation sets using five-fold cross-validation, while the external validation set was derived from the eICU-CRD dataset. To predict 28-day and 90-day mortality in SAE patients, we employed eight ML models: XGBoost, AdaBoost, decision tree, K-nearest neighbors (KNNs), multi-layer perceptron (MLP), Naive Bayes (NB), support vector machine (SVM), and logistic regression (LR). To optimize the prediction model, we employed cross-validation grid search to optimize the hyperparameters of each algorithm, and applied both undersampling and synthetic minority over-sampling technique (SMOTE) resampling methods to address the issue of data imbalance. Model performance was assessed using a variety of metrics, including the area under the receiver operating characteristic (ROC) curve (AUC), sensitivity, specificity, accuracy, and F1 score. The model exhibiting the highest AUC was selected as the best model. Additionally, decision curve analysis (DCA) was employed to evaluate clinical utility, and a clinical impact curve (CIC) was generated to determine the optimal threshold probability for our model.
Statistical analysis
For continuous variables, the data are expressed as the mean ± standard deviation when normally distributed. For non-normal distributions, the data are expressed as the median with the interquartile range (IQR). Categorical variables are expressed as numbers and percentages. Continuous variable comparisons were performed using the t-test or the Wilcoxon rank-sum test, and categorical data were analyzed using the chi-square test or Fisher's exact test.
While ML models are powerful predictors, their lack of interpretability remains a barrier to clinical use. Our study leveraged the SHAP method to illuminate these hese ML models are. 13 By computing the Shapley values for each feature, SHAP can quantify its specific contribution to individual predictions. This provides clinicians with intuitive visual representations of how and to what extent each factor influences the result, building faith in the model's decision-making process (Supplemental Method S1).
Statistical significance was determined using a two-tailed P-value < 0.05. All statistical analyses were conducted using R software (version 4.4.2) and Python (version 3.7.2).
Results
The inclusion and exclusion criteria for patient selection are illustrated in Figure 1. This study enrolled a total of 4922 patients with SAE, comprising 2027 patients from the MIMIC-IV database and 2895 patients from the eICU-CRD database. Based on their survival status at 28 or 90 days, the patients were categorized into two groups: “survival” and “non-survival.”

Patients recruitment flowchart. GCS: Glasgow coma scale; SAE: sepsis-associated encephalopathy; SpO2: percutaneous arterial oxygen saturation.
Baseline characteristics
The differences in characteristics between the survival and non-survival groups at 28 days in the MIMIC-IV dataset are summarized in Table 1, with a 28-day mortality of 17.67% (n = 358). Univariate analysis revealed significant differences between the groups for the following variables: age, gender, weight, los_icu, APACHE II, SOFA, GCS, mechanical ventilation, CRRT, and various physiological parameters, including minimum and maximum values for heart rate, SBP, DBP, respiratory rate, temperature, SpO2, WBC, creatinine, BUN, calcium, lactate, and glucose, as well as the minimum values of MBP and potassium, and the maximum values of temperature, platelets, and hemoglobin (P < 0.05).
Baseline characteristics of the SAE patients in the MIMIC-IV dataset.

SAE: sepsis-associated encephalopathy; MIMIC-IV: Medical Information Mart for Intensive Care IV; APACHE II: acute physiology and chronic health evaluation II; SOFA: sequential organ failure assessment; GCS: Glasgow coma scale; SBP: systolic blood pressure; DBP: diastolic blood pressure; MDP: mean blood pressure; SpO2: percutaneous arterial oxygen saturation; WBC: white blood cells; BUN: blood urea nitrogen.
Feature selection
The results of feature selection using the Boruta algorithm are shown in Figure 2. The 39 variables most strongly associated with 28-day mortality, ranked by their Z-values, include los_icu, SOFA, age, weight, GCS, CRRT, APACHE II, along with the maximum and minimum values of platelets, hemoglobin, calcium, BUN, lactate, creatinine, heart rate, chloride, WBC, potassium, glucose, respiratory rate, SpO2, DBP, and SBP. Additionally, minimum MBP and maximum temperature were also selected.
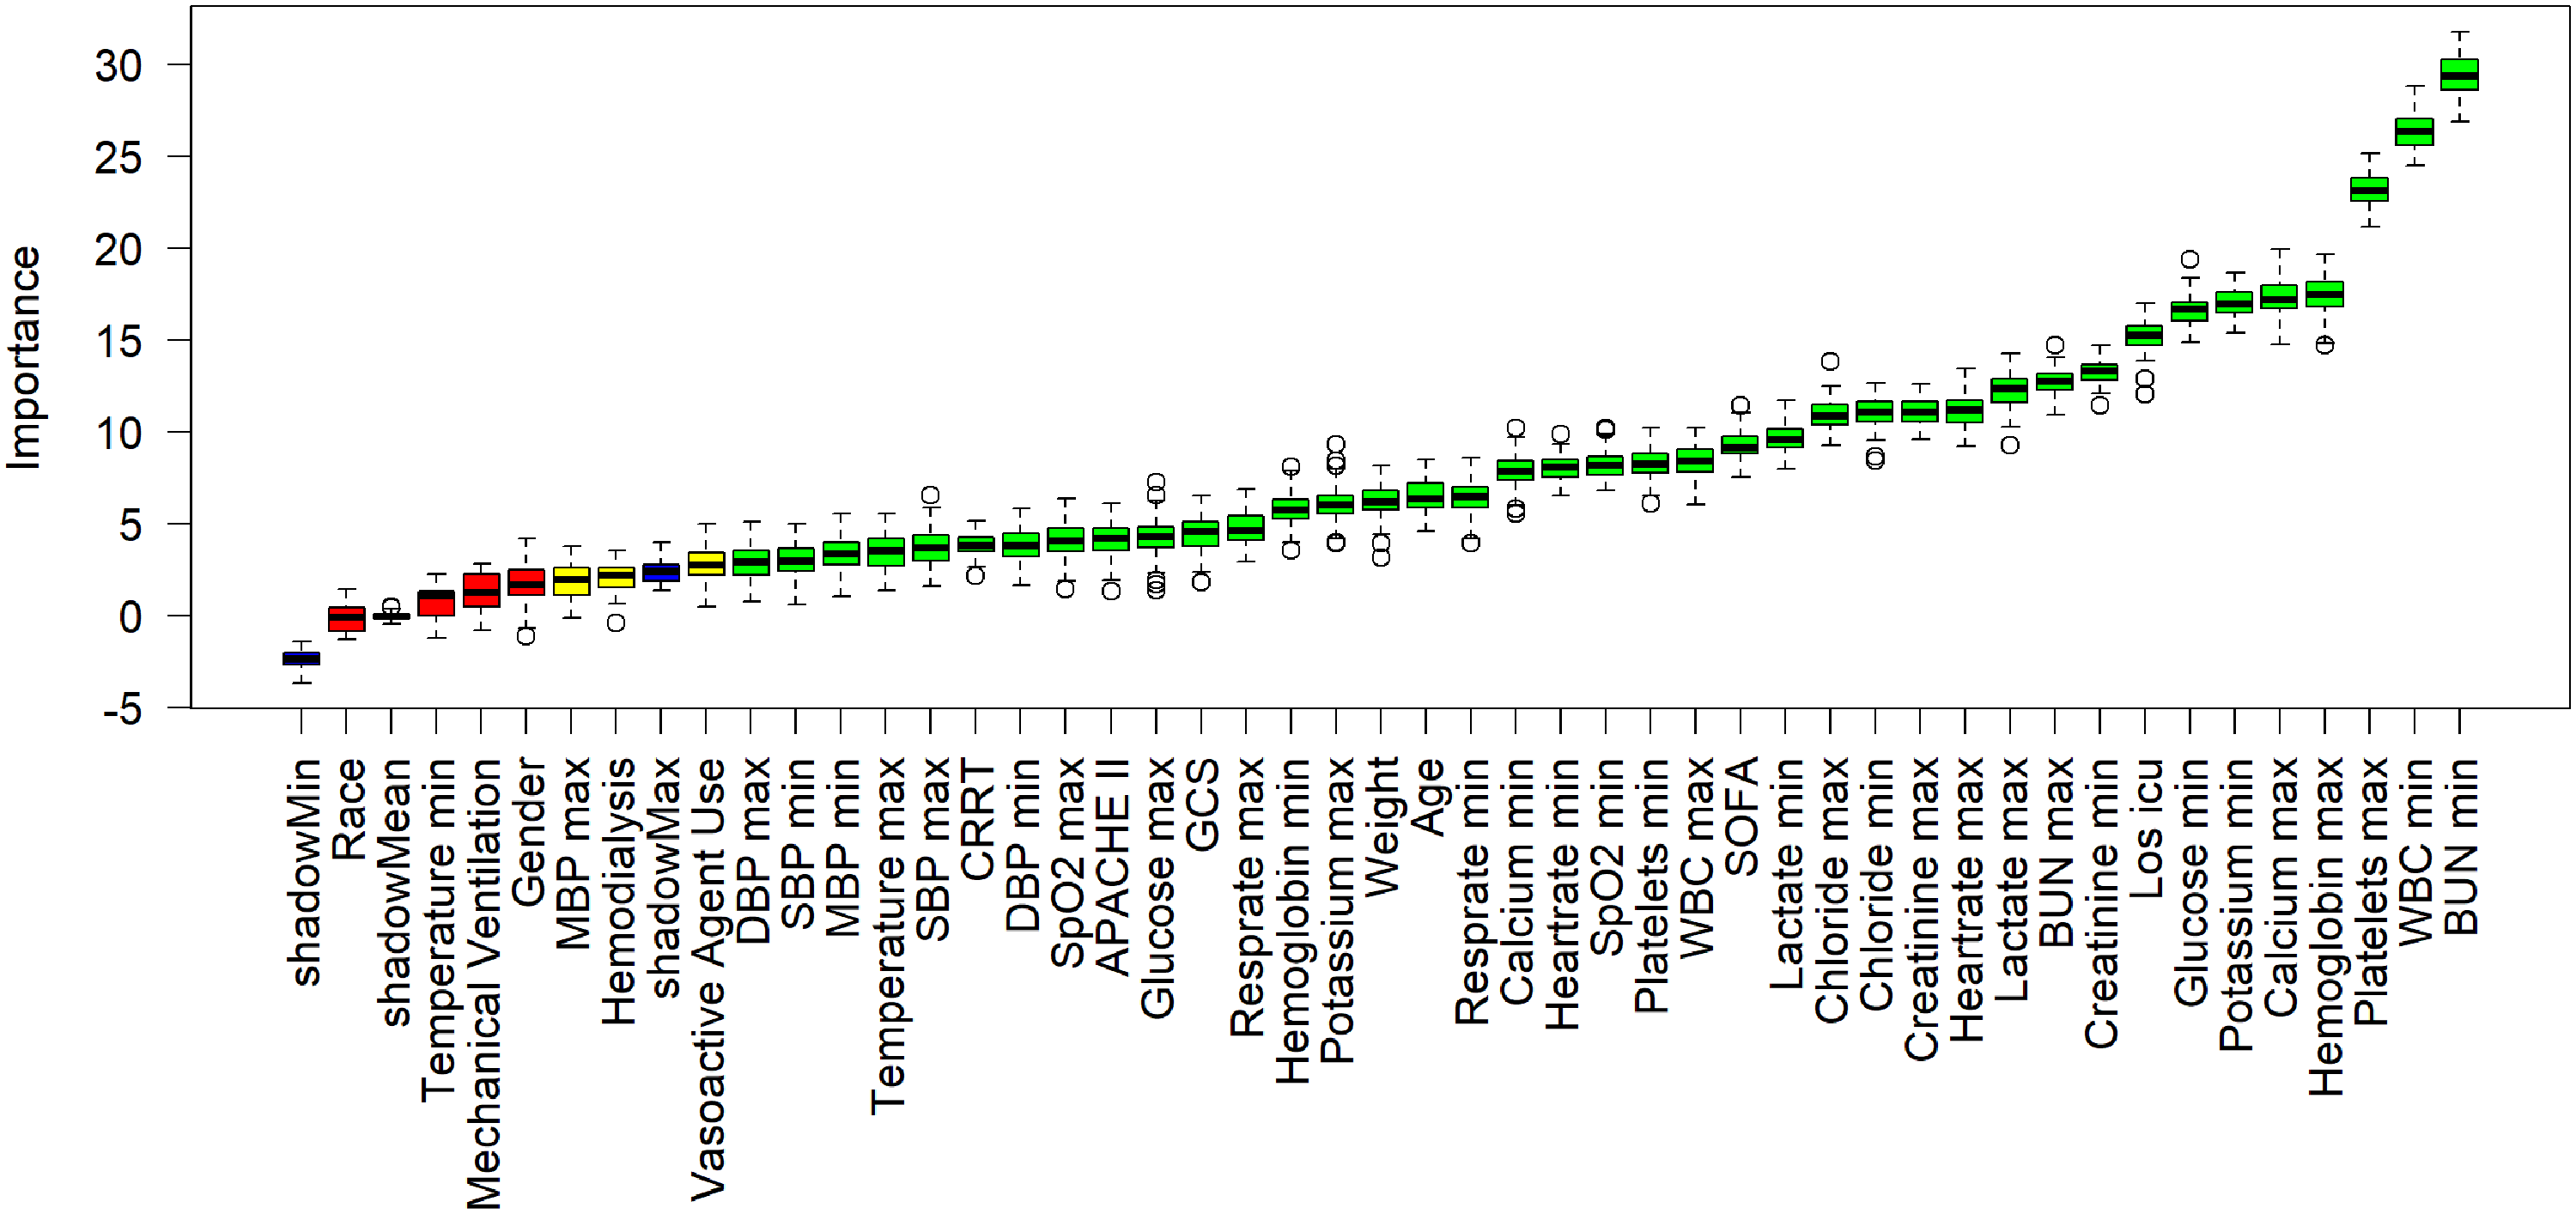
Feature selection based on the Boruta algorithm. The horizontal axis denotes the name of each variable, while the vertical axis illustrates the Z-value corresponding to each variable. The box plot displays the Z-values for every variable throughout the model computation. Green boxes indicate the top 36 significant variables, yellow boxes represent provisional attributes, and red boxes signify variables deemed unimportant. APACHE II: acute physiology and chronic health evaluation II; SOFA: sequential organ failure assessment; GCS: Glasgow coma scale; CRRT: continuous renal replacement therapy; SBP: systolic blood pressure; DBP: diastolic blood pressure; MDP: mean blood pressure; SpO2: percutaneous arterial oxygen saturation; WBC: white blood cells; BUN: blood urea nitrogen; Los icu: ICU length of stay.

Comparison of AUCs among eight machine learning models. AUCs for the prediction of 28-day (a) and 90-day mortality (b) in the internal validation cohort. AUCs for the prediction of 28-day (c) and 90-day mortality (d) in the external validation cohort. AUC: area under the receiver operating characteristic curve.
Model performance comparisons
The accuracy, recall, specificity, precision, and F1 score for the eight ML models are presented in Table 2. We first evaluated the predictive performance of the APACHE II and SOFA scores. During internal validation, the AUC of APACHE II was 0.562 (95% CI: 0.529–0.597) for 28-day and 0.611 (95% CI: 0.584–0.637) for 90-day mortality, while SOFA achieved AUCs of 0.634 (95% CI: 0.603–0.670) and 0.638 (95% CI: 0.610–0.664), respectively. Performance in the external validation cohort was similarly limited, with APACHE II showing AUCs of 0.537 (95% CI: 0.509–0.568) for 28-day and 0.607 (95% CI: 0.581–0.633) for 90-day mortality, and SOFA achieving 0.602 (95% CI: 0.572–0.630) and 0.641 (95% CI: 0.615–0.666), respectively.
Performance metrics for predicting 28-day and 90-day mortality of SAE patients in the internal and external validation cohorts.

SAE: sepsis-associated encephalopathy; APACHE II: acute physiology and chronic health evaluation II; SOFA: sequential organ failure assessment; AUC: area under the receiver operating characteristic curve.
In contrast, all eight ML models demonstrated strong predictive performance (Figure 3). The XGBoost model achieved the highest discriminative ability, with AUCs of 0.930 (95% CI: 0.917–0.942) for 28-day mortality and 0.906 (95% CI: 0.891–0.919) for 90-day mortality, representing a 65.8% and 48.3% increase, respectively, over the APACHE II score, and a 46.7% and 42.0% increase over the SOFA score. Other ML models, including AdaBoost (28-day: 0.903; 90-day: 0.884) and LR (28-day: 0.899; 90-day: 0.883), also performed strongly. In contrast, simpler models such as decision tree and KNN showed more moderate performance, with AUCs ranging between 0.779 and 0.841 for 28-day and 0.781 and 0.815 for 90-day predictions. In the external validation cohort, predictive performance declined overall but remained acceptable for several models. XGBoost again yielded the highest AUCs: 0.771 (95% CI: 0.748–0.792) for 28-day mortality and 0.759 (95% CI: 0.736–0.782) for 90-day mortality, corresponding to a 43.6% and 25.0% improvement over APACHE II, and 28.1% and 18.4% over SOFA, respectively. LR was the second-best performer in this setting, with AUCs of 0.754 and 0.747, respectively. Model performance was lowest for KNN and decision tree, with AUC values between 0.633 and 0.710 across timepoints.
Given the class imbalance inherent in mortality outcomes, we further evaluated model performance using the F1 score (Table 2). The XGBoost model consistently achieved the highest F1-scores in internal validation (28-day: 0.882; 90-day: 0.852) and competitive scores in external validation.
The DCA curves for the eight prediction models are shown in Figure 4. In both datasets, the XGBoost model provided a significantly higher net benefit than the other models. Furthermore, the CIC curve in Figure 5 was used to intuitively determine the optimal risk threshold for clinical application. A threshold of 0.6 was found to optimally balance sensitivity and specificity for identifying high-risk mortality, and was, therefore, chosen to inform clinical decision-making.

Decision curve analysis (DCA) for different machine learning models. DCA curves for 28-day (a) and 90-day mortality (b) in the internal validation set. DCA curves for 28-day (c) and 90-day mortality (d) in the external validation set.
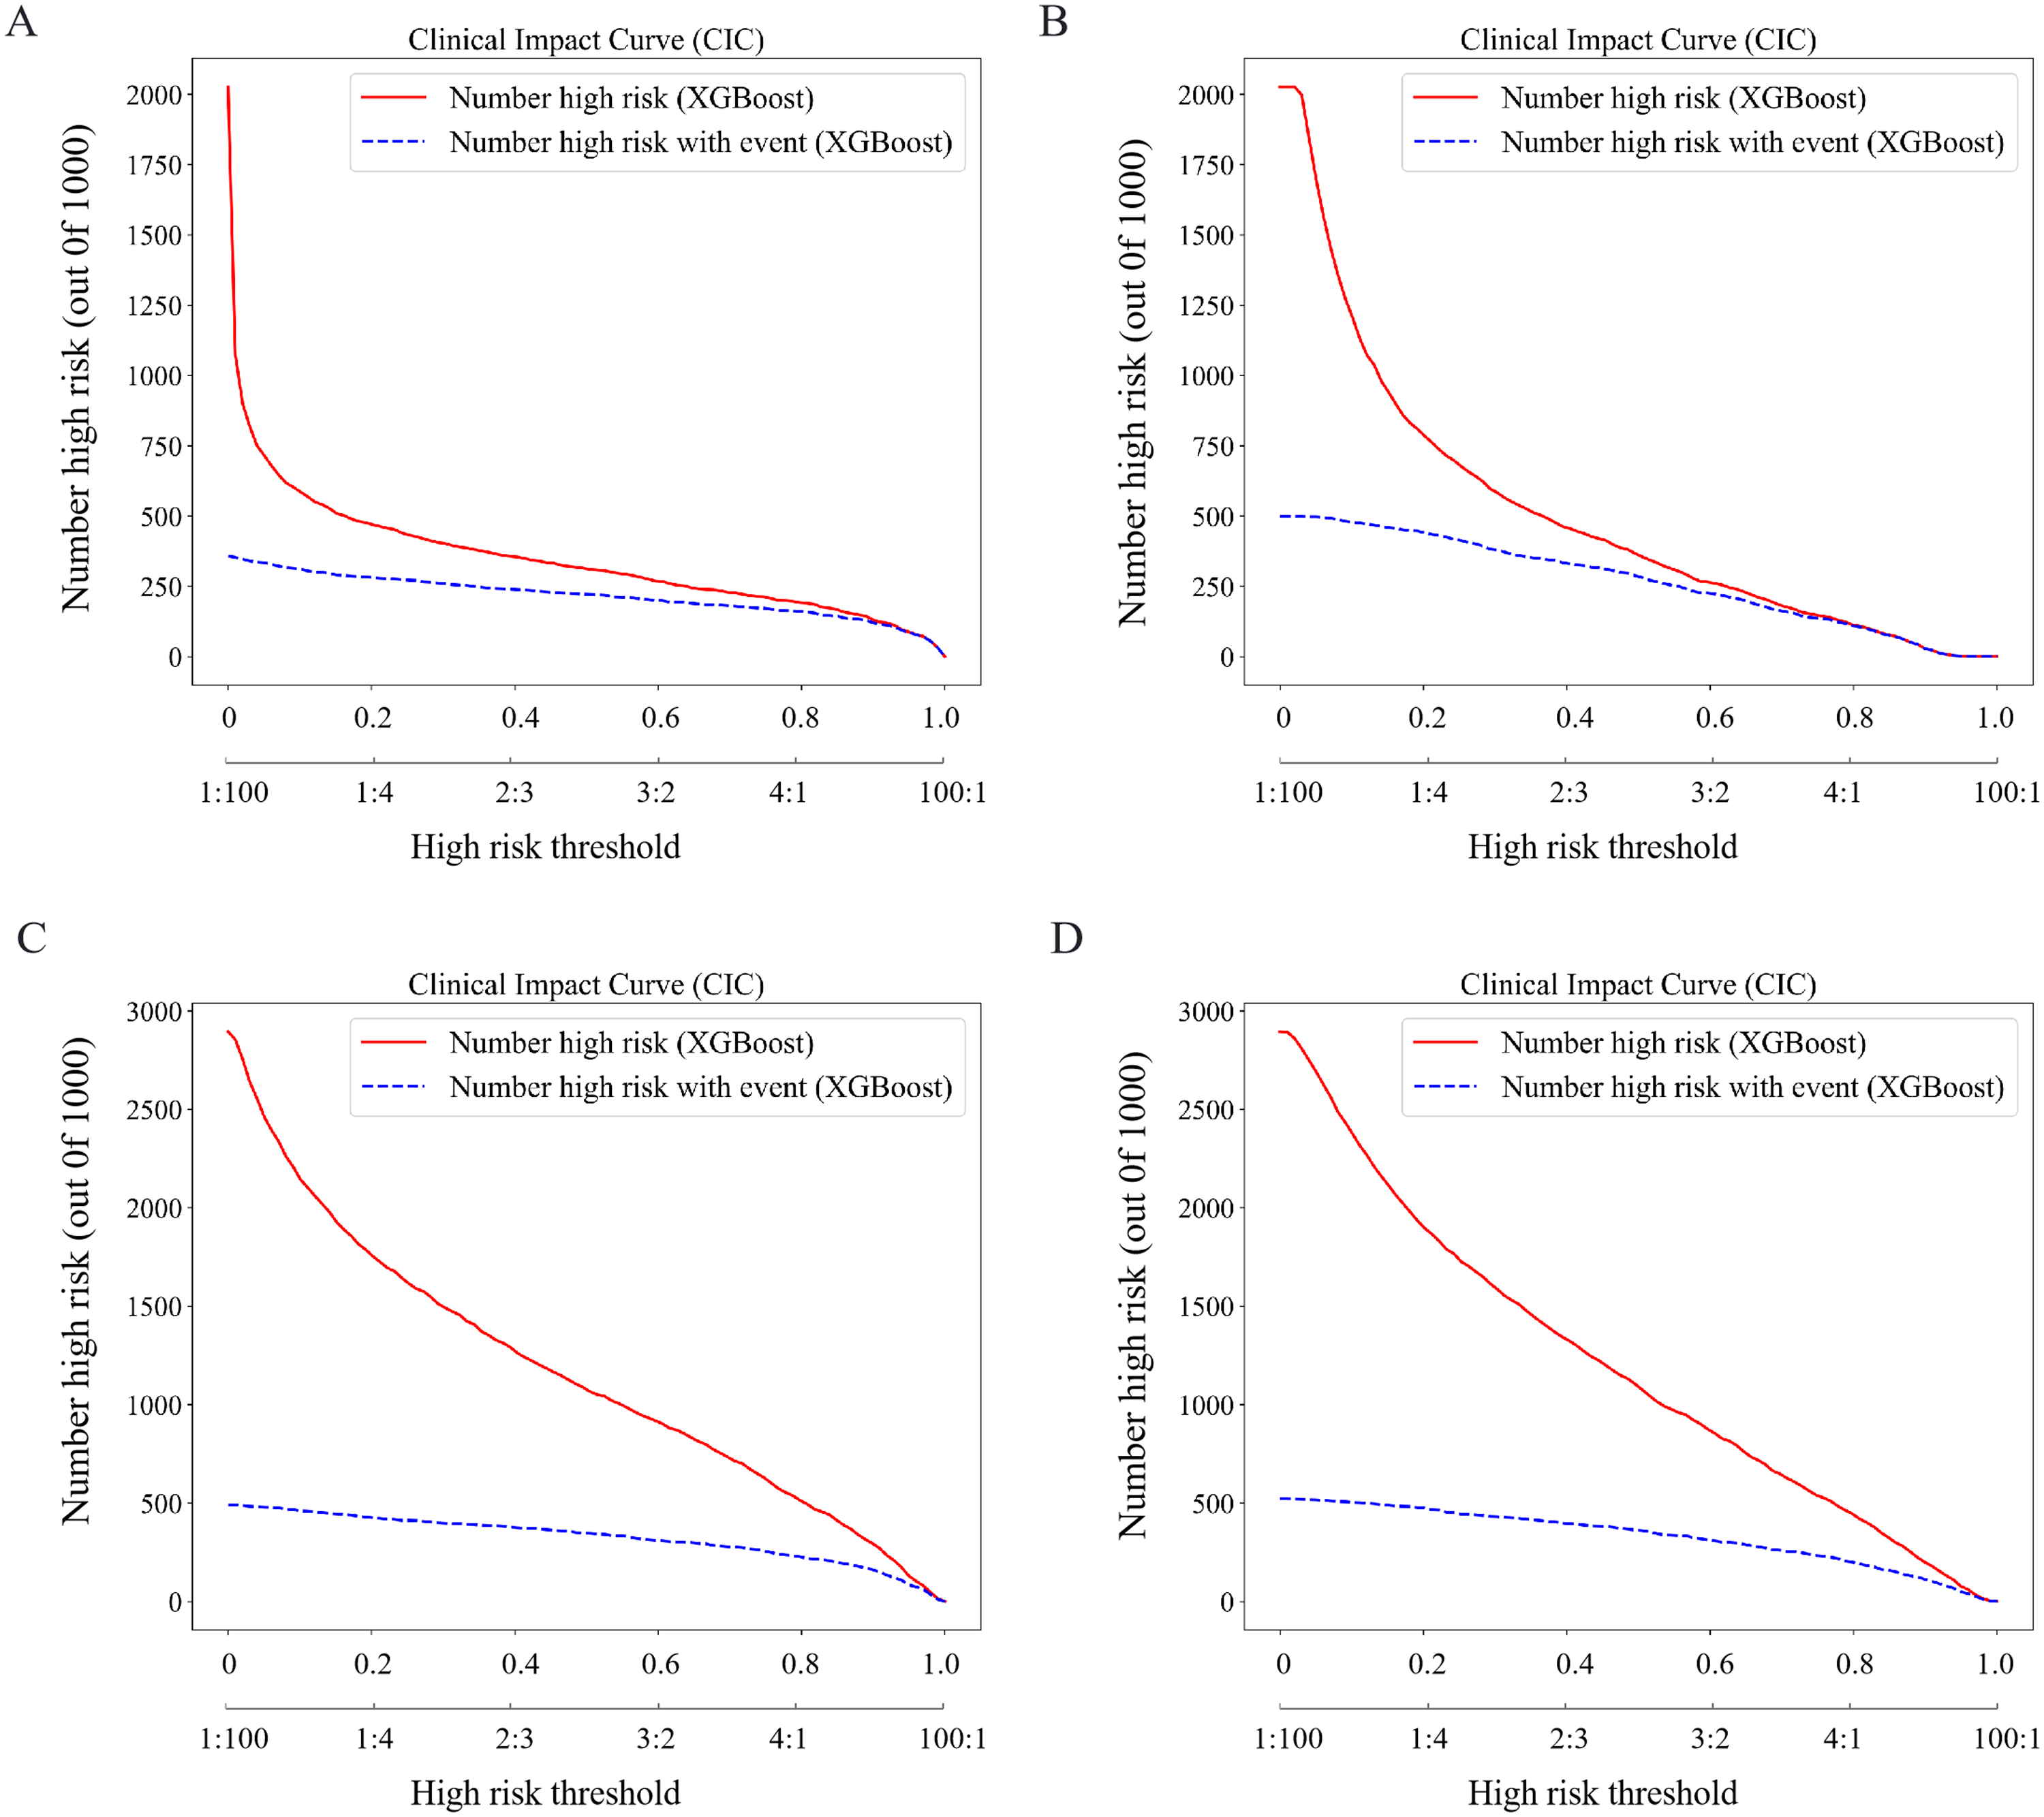
Clinical impact curves (CICs) are used to evaluate the clinical utility of different models. CICs for 28-day (a) and 90-day mortality (b) in the internal validation set. CICs for 28-day (c) and 90-day mortality (d) in the external validation set. In CICs, the horizontal axis represents the risk threshold and its corresponding cost–benefit ratio, while the vertical axis compares the number of positive patients identified by the model to the actual number of true-positive patients.
Subgroup analysis
In the subgroup analysis, we evaluated the performance of the XGBoost model across different age groups. Table 3 presents the detailed results of the subgroup analysis. Compared with patients under 65 years old, the model demonstrated better performance in predicting prognosis for patients aged 65 years or older.
Summary of the performance analysis of the XGBoost model in age subgroups.

AUC: area under the receiver operating characteristic curve.
Interpretability analysis
In both the 28-day and 90-day mortality groups, the XGBoost model achieved the highest AUCs across all models, establishing it as the best model. We utilized SHAP analysis to interpret the model's predictions. Figure 6(a) and (c) displays the top 20 predictors of 28-day and 90-day mortality in the external validation set. Figure 6(b) and (d) provides a more detailed display of the positive and negative relationships between features and results. The key predictors common to both time points include lowest BUN, highest calcium, highest chloride, lowest chloride, GCS, highest glucose, lowest glucose, highest heartrate, highest hemoglobin, Los icu, highest platelets, highest temperature, lowest WBC, and weight. Figure 7 demonstrates a prediction result generated by the XGBoost model for a patient with SAE who died within 28 days of ICU admission. Features marked with red arrows increase the risk of mortality, while those with blue arrows decrease the risk. By integrating the collective contributions of these factors, the model calculated a mortality probability of 77% for this patient, corresponding to the output value f(x) shown in the figure.

Visually interpret the XGBoost model using SHAP. Feature-ranking plots (a) and summary plots (b) for predicting 28-day mortality SAE. Feature-ranking plots (c) and summary plots (d) for predicting 90-day mortality in SAE. (e) Inference process of the model with (c) a non-surviving patient. BUN: blood urea nitrogen; WBC: white blood cells; Los icu: ICU length of stay; SpO2: percutaneous arterial oxygen saturation; GCS: Glasgow coma scale; DBP: diastolic blood pressure; SBP: systolic blood pressure; SHAP: SHapley Additive exPlanations; SAE: sepsis-associated encephalopathy.
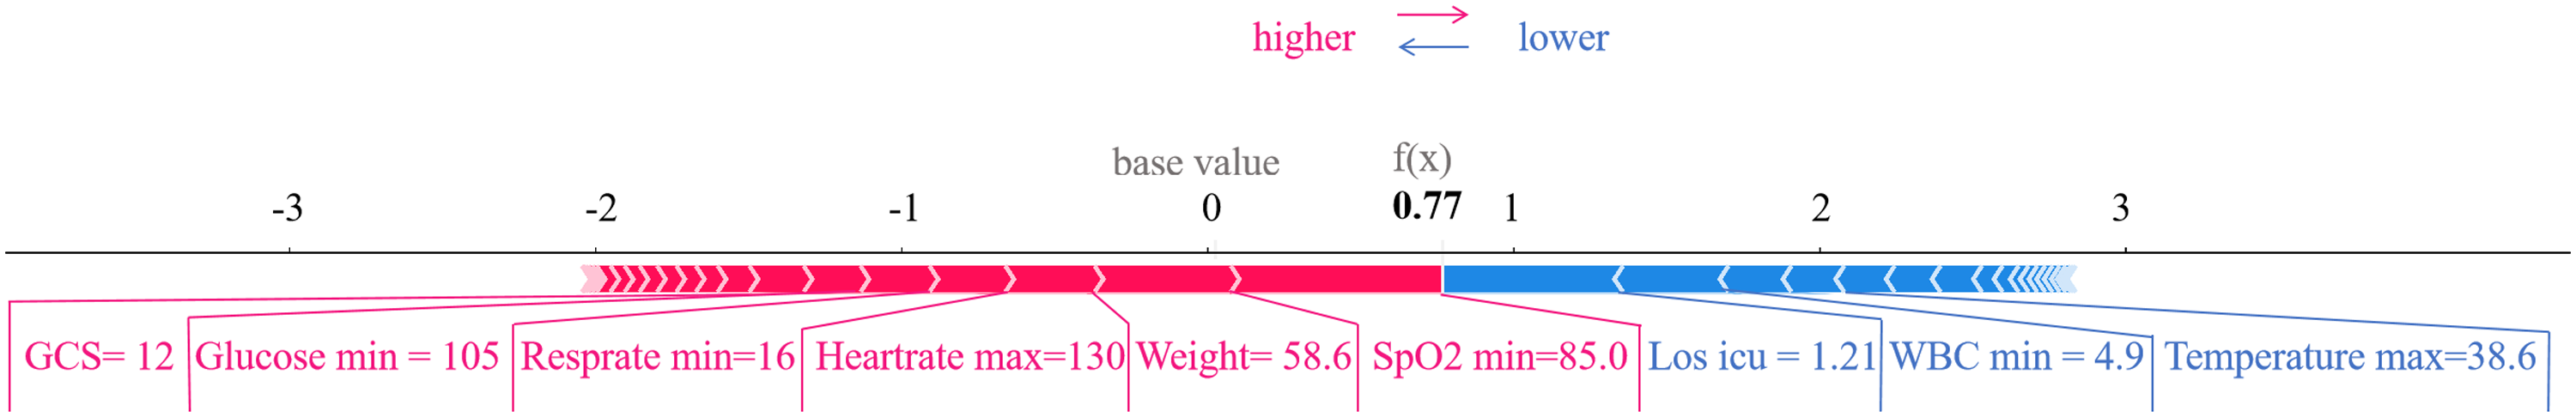
Inference process of the model with a non-surviving patient. GCS: Glasgow coma scale; SpO2: percutaneous arterial oxygen saturation; Los icu: ICU length of stay; WBC: white blood cells.
Discussion
SAE is a severe complication of sepsis, contributing to high mortality rates. This study leveraged two large public databases, MIMIC-IV and eICU-CRD, to develop predictive models for estimating 28-day and 90-day mortality in SAE patients. Eight ML algorithms were utilized to develop a predictive model, incorporating 39 clinical variables recorded within the first 24 hours of ICU admission.
Previous studies have attempted to develop SAE mortality prediction models. Some studies relied on traditional LR methods, despite achieving an average AUC of 0.799, and often lack external validation and model interpretability.8,19,22 Several recent ML approaches have also been proposed, yet most focus on a single mortality endpoint, thereby overlooking the dynamic progression and individualized risk trajectories of SAE patients.17,18 In contrast, our study introduces an interpretable multi-timepoint ML framework that not only predicts both 28-day and 90-day mortality but also incorporates SHAP-based explanations to clarify feature contributions. This study has the following contributions.
First, we developed predictive models using eight ML algorithms capable of handling high-dimensional, nonlinear clinical data, uncovering hidden relationships, and improving predictive accuracy. To ensure robustness, we performed hyperparameter tuning via grid search cross-validation and addressed class imbalance with undersampling and SMOTE. Among the models, the XGBoost model demonstrated superior performance, outperforming the others in discriminative power, accuracy, and robustness. Its ensemble learning approach effectively captures nonlinear relationships while mitigating overfitting, making it particularly well-suited for clinical applications. In contrast, traditional scoring systems such as APACHE II and SOFA showed limited predictive performance for SAE mortality, likely due to their insensitivity to subtle clinical changes and inability to capture nonlinear risk factor interactions.
Second, our model simultaneously predicts mortality at both 28 and 90 days, offering a comprehensive risk profile that supports clinical decision-making across different time horizons. The 28-day mortality prediction directly correlates with acute neuroinflammatory cascades, enabling clinicians to prioritize interventions such as EEG monitoring and immunomodulatory therapies during the critical early phase.23,24 In contrast, the 90-day mortality prediction reflects the long-term consequences of SAE, including persistent neuroinflammation and sepsis-induced immunosuppression, which are associated with secondary infections and delayed cognitive decline.3,25 This dual timepoint approach aligns with the biphasic nature of SAE pathophysiology, thereby bridging the gap between acute management and chronic care planning.
Furthermore, we employed SHAP to interpret the XGBoost model's decision-making process, thereby enhancing its clinical transparency and trustworthiness. Analysis revealed that the five most influential features, including minimum BUN, minimum WBC, maximum hemoglobin, Los icu, and weight. For instance, high BUN signals renal dysfunction and impaired perfusion. 26 A decrease in WBC indicates immune paralysis, predisposing to secondary infections and uncontrolled neuroinflammation. Abnormal elevation of hemoglobin suggests hemoconcentration and microcirculatory failure, which can exacerbate cerebral hypoxia. 27 A prolonged ICU stay often signifies irreversible organ dysfunction and heightened exposure to iatrogenic risks. Thus, SHAP analysis not only elucidates the predictive process but also provides evidence for the underlying pathophysiological mechanisms influencing SAE outcomes.
Finally, subgroup analysis revealed that the model performed more effectively in patients aged 65 years or older, exhibiting a significantly higher AUC compared to younger patients. This age-related disparity may be attributed to the more distinct physiological characteristics and higher baseline mortality risk among older adults, which likely enhances the model's discriminative capacity. Furthermore, we plotted the DCA and CIC curves to confirm the superior clinical utility of the XGBoost model. Collectively, these findings demonstrate that the model not only accurately identifies high-risk SAE patients but also offers a tangible foundation for guiding clinical decisions, with the potential to optimize treatment planning and ultimately improve patient outcomes.
Although this study has achieved significant results, there are still some limitations. Firstly, the data used in this study were all sourced from public databases, and the cohort was restricted to SAE patients; the model's generalizability to broader ICU populations may be limited. Future studies should incorporate multi-center data, including from private hospitals, and expand inclusion criteria to improve applicability. Second, despite including a wide range of variables, potential confounders such as sedation use, specific infection sites, and detailed treatment responses were not consistently available, which may affect outcome interpretation. Third, the decline in performance during external validation suggests the need for strategies such as domain adaptation or larger, more diverse samples. Future work will focus on real-time implementation and prospective validation in multicenter ICUs to further assess clinical utility.
Conclusion
In summary, this study develops and validates an interpretable, multi-timepoint ML model that significantly improves mortality prediction for SAE patients over conventional scoring systems. Future research should focus on refining the model, incorporating additional risk factors, and validating its performance across diverse patient populations to enhance its generalizability and clinical applicability.
Supplemental Material
sj-docx-1-dhj-10.1177_20552076251393281 - Supplemental material for Construction and validation of a mortality prediction model for patients with sepsis-associated encephalopathy: Interpretable machine learning approach
Supplemental material, sj-docx-1-dhj-10.1177_20552076251393281 for Construction and validation of a mortality prediction model for patients with sepsis-associated encephalopathy: Interpretable machine learning approach by Ziyi Wang, Lingling Ge, Yongkui Zhu, Xiaoli Chen and Xia Cheng in DIGITAL HEALTH
Footnotes
Ethical statement
This study was approved by the Institutional Review Boards (IRBs) of Beth Israel Deaconess Medical Center (Boston, Massachusetts) and the Massachusetts Institute of Technology (Cambridge, Massachusetts). Individual patient consent was waived, as all protected health information was de-identified. Access to the databases was granted to individuals who completed the Collaborative Institutional Training Initiative (CITI) examinations. One author (Ziyi Wang) obtained access to both databases and was responsible for data extraction (Certification Number: 66982272).
Authors’ contributions
Ziyi Wang: conceptualization, data curation, formal analysis, investigation, methodology, project administration, resources, software, supervision, validation, visualization, writing–original draft, and writing–review and editing. Lingling Ge: conceptualization, writing–original draft, and writing–review and editing. Yongkui Zhu: conceptualization, writing–original draft, and writing–review and editing. Xiaoli Chen: conceptualization, project administration, supervision, and writing–review and editing. Xia Cheng: conceptualization, project administration, supervision, and writing–review and editing.
Funding
The authors received no financial support for the research, authorship, and/or publication of this article.
Declaration of conflicting interests
The authors declared no potential conflicts of interest with respect to the research, authorship, and/or publication of this article.
Data availability statement
The data are open-source and freely available at https://www.physionet.org/content/mimiciv/3.1/ and https://www.physionet.org/content/eicu-crd-demo/2.0.1/. All original code has been deposited at ![]() .
.
Guarantor
Ziyi Wang
Supplemental material
Supplemental material for this article is available online.
References
Supplementary Material
Please find the following supplemental material available below.
For Open Access articles published under a Creative Commons License, all supplemental material carries the same license as the article it is associated with.
For non-Open Access articles published, all supplemental material carries a non-exclusive license, and permission requests for re-use of supplemental material or any part of supplemental material shall be sent directly to the copyright owner as specified in the copyright notice associated with the article.