
Abstract
Objective
Early and accurate diagnosis of pulmonary tuberculosis (PTB) is critical for disease control. This study aimed to develop and validate a clinical prediction model to differentiate adult inpatients with suspected PTB.
Methods
A retrospective cohort of 602 adults admitted to Changsha Central Hospital (January–October 2019) with suspected PTB was randomly divided into a modeling group (n = 421) and an internal validation group (n = 181). Univariate and multivariate logistic regression analyses in the modeling cohort identified independent clinical and radiological predictors. Model performance was assessed by the area under the receiver operating characteristic curve (AUC), calibration (Hosmer–Lemeshow test), and decision curve analysis. External validation was performed using 213 similar patients from Hunan Chest Hospital (January–October 2019).
Results
Five independent predictors were retained: age (years), erythrocyte sedimentation rate (mm/h), upper-lobe or dorsal-segment infiltration on chest imaging, presence of multifocal polymorphic pulmonary lesions, and pleural thickening (all p < 0.05). In the modeling cohort, AUC = 0.977 (95% confidence interval (CI): 0.964–0.989); at the optimal cutoff probability of 0.611, sensitivity was 95.9% and specificity 89.4%. Calibration was satisfactory in both internal (Hosmer–Lemeshow p = 0.815) and external (p = 0.973) validation cohorts. Decision curve analysis demonstrated net clinical benefit across relevant threshold probabilities.
Conclusions
The proposed five-variable model exhibited excellent discrimination, calibration, and clinical utility in both internal and external cohorts. Its simplicity and reliance on routinely available data make it a practical adjunct for clinicians in diagnosing PTB among adults with suspected disease.
Introduction
Tuberculosis is a chronic infectious disease caused by an infection with Mycobacterium tuberculosis (MTB), affecting approximately a quarter of the world's population. 1 In 2020, China ranked as the second-highest tuberculosis burden country worldwide. 1 Pulmonary tuberculosis, which refers to tuberculous lesions occurring in the lung tissue, trachea, bronchi, and pleura, is the most predominant type of tuberculosis, accounting for 80% to 90% of all tuberculosis in all organs. 2 Pulmonary tuberculosis is diagnosed based on clinicoradiological correlation with microbiological evidence of MTB or pathological findings.1,3 However, in 2020, only 59% of the 4.8 million patients with pulmonary tuberculosis worldwide were diagnosed pathogenically. 1 Moreover, most patients are reluctant to undergo invasive examinations and further pathological investigations.4–7 The use of molecular rapid diagnostic tests recommended by the World Health Organization to detect MTB is not yet widespread in primary care settings in China. Thus, a comprehensive model of multiple indicators such as demographic data, symptoms, signs, chest imaging, and laboratory findings could prove valuable in the early diagnosis of pulmonary tuberculosis.
A clinical prediction model involves leveraging the relationship between various factors and subsequent outcomes to estimate the probability of an individual presently having a disease or experiencing a future outcome based on a mathematical formula. 8 Depending on the problem being studied, the model can be divided into diagnostic and prognostic. Moreover, it is widely used for screening high-risk groups, individualized disease diagnosis, treatment, and prevention.8–10 Previous studies used the clinical prediction model to screen patients for suspected pulmonary tuberculosis and rapidly perform respiratory isolation and further confirmatory tests, including molecular techniques.11,12 However, systematic reviews have shown that the methodological quality and reporting of prediction studies remains deficient. 13 Most existing prediction models for tuberculosis are used in specific settings, such as HIV clinics14–16 and contact surveys.17,18 Conversely, prediction models for estimating adult pulmonary tuberculosis prevalence remains poorly reported and validated, and are not useful for tuberculosis screening.19,20 Moreover, the larger the variations across regions and population, the more pronounced the impact on the predictive efficacy of clinical prediction model. With the increasing interest in the development and validation of clinical prediction models, it is critical to consider how these tools can best be built and implemented in clinical practice to improve the treatment process and patient prognosis.21,22
Thus, we aimed to develop a diagnostic clinical prediction model for suspected pulmonary tuberculosis and fully validate its predictive efficacy to rapidly identify patients with suspected pulmonary tuberculosis, shorten the diagnosis time, and improve the diagnosis rate, allowing for rapid diagnosis and effective treatment, reducing transmission, and providing a basis for referral and confirmatory testing in primary care settings.
Methods
Study participants and setting
We consecutively included 602 adult inpatients between January and October 2019 at Changsha Central Hospital, and randomly divided into the modeling (n = 421) and internal validation (n = 181) group at a ratio of 7:3 (Figure 1). Additionally, 213 adult inpatients between January and October 2019 at Hunan Chest Hospital were included as the external validation group.

Flow chart of the study population. (a) The study population flow at Changsha Central Hospital, while (b) depicts the study population flow at Hunan Chest Hospital. The exclusion criteria were as follows: (1) those who were already receiving antituberculosis drugs before admission, (2) those who were diagnosed with antituberculosis after admission, and (3) those with incomplete clinical information.
The inclusion criteria are as follows: (1) age ≥ 15 years; (2) patients with suspected pulmonary tuberculosis: identified according to the 2017 China pulmonary tuberculosis diagnostic criteria (WS 288-2017) 3 and the 2019 World Health Organization guidelines for tuberculosis. 23 The identification was based on set of clinical symptoms, including cough for more than 2 weeks, coughing sputum or blood in sputum or hemoptysis, chest pain, fatigue, loss of appetite, weight loss, fever and night sweats, and with active pulmonary tuberculosis imaging features.
The exclusion criteria were as follows: (1) those who were already receiving antituberculosis drugs before admission, (2) those who were diagnosed with antituberculosis after admission, and (3) those with incomplete clinical information.
For the sample size estimation, a minimum of 10 positive outcome events per predictor variable was required for the logistic regression analysis.24,25
According to the diagnostic criteria for pulmonary tuberculosis (WS 288-2017), 3 a patient is considered to be diagnosed if one of the following conditions is met: (1) two sputum smears positive for acid fast bacilli; (2) one sputum smear positive for acid fast bacilli in conjunction with imaging features of active pulmonary tuberculosis; (3) one sputum smear positive for acid fast bacilli in conjunction with one sputum positive for mycobacterial culture; (4) imaging features of active pulmonary tuberculosis in conjunction with at least two negative sputum smears with positive mycobacterial culture; (5) imaging features of active pulmonary tuberculosis in conjunction with positive MTB nucleic acid test; and (6) positive lung histopathology for tuberculosis.
Data collection methods
Clinical data were collected from the modeling as well as the internal and external validation groups, which include: (1) demographic data: age, sex, and occupation; (2) risk factors: history of pulmonary tuberculosis or exposure, smoking, malnutrition, HIV infection, history of diabetes, history of pneumoconiosis, and use of glucocorticoids/immunosuppressants; (3) typical pulmonary tuberculosis symptoms: cough and coughing sputum for 2 weeks or longer (or blood in sputum or hemoptysis), chest pain, night sweats, fatigue, intermittent or persistent afternoon fever, loss of appetite, and weight loss; (4) laboratory tests: neutrophil-to-lymphocyte ratio (NLR), hemoglobin, albumin, erythrocyte sedimentation rate (ESR), purified protein derivative (PPD) skin test; and (5) pulmonary imaging: infiltration of the upper lobe or dorsal segment of the lung, multifocal polymorphic lesions with multidensity in the lungs, pulmonary cavity, pleural thickening, and mediastinal and hilar lymphadenopathy. After removing missing information, the final predictive variables included the following: age, sex, past history of pulmonary tuberculosis, history of exposure to pulmonary tuberculosis, smoking, history of diabetes, history of pneumoconiosis, use of glucocorticoids/immunosuppressants, cough and coughing sputum for 2 weeks or more, blood in sputum or hemoptysis, chest pain, night sweats, fatigue, intermittent or persistent afternoon fever, loss of appetite, weight loss, NLR, hemoglobin, albumin, ESR, infiltration of the upper lobe or dorsal segment of the lung, multifocal polymorphic lesions with multidensity in the lungs, pulmonary cavity, pleural thickening, and mediastinal and hilar lymphadenopathy.
Statistical analysis
EmpowerStats version 4.1 was used to analyze the data for clinical characteristics. The R software version 4.1.2 was used to perform a single factor unconditional logistic regression analysis to initially screen single indicators that were predictive of the diagnosis of pulmonary tuberculosis. Subsequently, a multifactor unconditional logistic regression analysis was performed on indicators that were significant in the single factor analysis and clinically indicated with p < 0.05 for statistical significance. The β coefficients of the independent predictors in the multifactor logistic regression analysis were used to build the prediction model, and alignment diagrams were drawn using the R software version 4.1.2 rms package, with an alignment diagram as the presentation of the model. Using the R software version 4.1.2 pROC package, the receiver operating characteristic (ROC) curves were plotted. The area under the ROC curve (AUC) was used to evaluate the discriminatory ability of the model, and the cut-off values and corresponding sensitivity and specificity were determined using the Youden index. Finally, the predictive efficacy of the model was evaluated through internal and external validations. The calibration curve was used to evaluate the agreement between observed and expected outcomes, and the decision curve analysis method was used to evaluate the clinical usefulness of the prediction model. The calibration curves were plotted using the R software version 4.1.2 rms and foreign packages, and the decision analysis curves were plotted using the rmda, rms, and foreign packages.
Results
Clinical characteristics of the three groups of patients
Measurement data with a normal distribution were expressed as mean ± standard deviation, and those with a skewed distribution were expressed as median (maximum, minimum). The enumeration data were described by the number of cases and constituent ratio. Table 1 shows the clinical characteristic across the three groups of patients. The modeling group (n = 421) comprised 298 males (70.78%) and 123 females (29.22%), with ages ranging from 15 to 93 years. Majority of the cases consisted of 317 (75.30%) individuals with pulmonary tuberculosis, while 104 (24.70%) were nontuberculosis-related cases, which include 62 (59.62%) pneumonia, 17 (16.35%) chronic obstructive pulmonary disease, 3 (2.88%) chronic bronchitis, 12 (11.54%) lung cancer, 5 (4.81%) bronchiectasis, 4 (3.84%) lung abscess, and 1 (0.96%) pulmonary embolism. The internal validation group (n = 181) comprised 118 males (65.19%) and 63 females (34.81%), with ages ranging from 16 to 94 years. Among these, 134 (74.03%) comprise those with pulmonary tuberculosis and 47 (25.97%) with nontuberculosis diseases, including 27 (57.45%) cases of pneumonia, 6 (12.76%) chronic obstructive pulmonary disease, 4 (8.51%) chronic bronchitis, 6 (12.76%) lung cancer, 2 (4.26%) bronchiectasis, and 2 (4.26%) lung abscess. The external validation group (n = 213) comprised of 142 males (66.67%) and 71 females (33.33%), with ages ranging from 15 to 87 years. Of these, 109 (51.17%) and 104 (48.83%) were pulmonary tuberculosis and nontuberculosis cases, respectively. Of the nontuberculosis cases, 61 (58.65%) were pneumonia, 22 (21.15%) chronic obstructive pulmonary disease, 3 (2.88%) chronic bronchitis, 15 (14.42%) lung cancer, 2 (1.92%) lung abscess, and 1(0.96%) interstitial lung disease.
Analysis of the clinical characteristics of the three groups of patients.
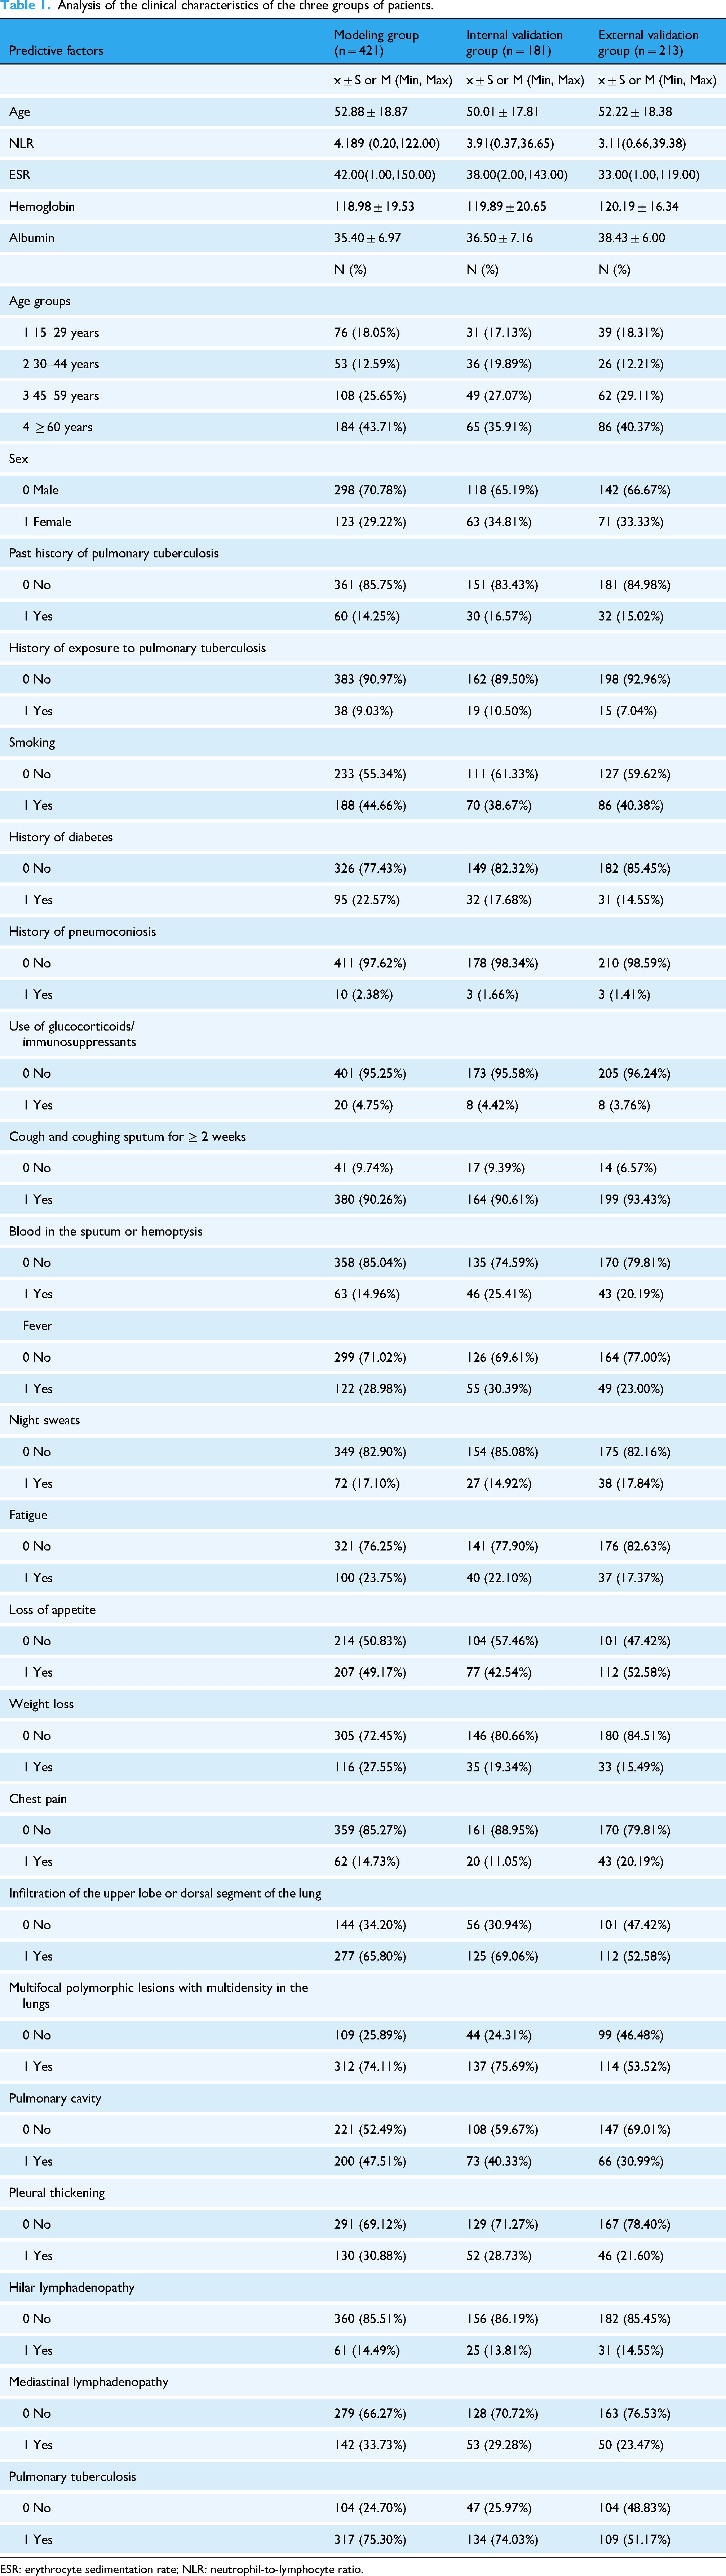
ESR: erythrocyte sedimentation rate; NLR: neutrophil-to-lymphocyte ratio.
Single-factor analysis of predictors of pulmonary tuberculosis
This study employed a single-factor unconditional logistic regression analysis, and the results indicated that age, NLR, ESR, hemoglobin, albumin, infiltration of the upper lobe or dorsal segment of the lung, multifocal polymorphic lesions with multiple densities in the lungs, pulmonary cavity, and pleural thickening were predictors of pulmonary tuberculosis (p < 0.05), as shown in Table 2.
Results of single factor logistic regression analysis.

CI: confidence interval; ESR: erythrocyte sedimentation rate; NLR, neutrophil-to-lymphocyte ratio; OR: odds ratio.
Multifactor analysis of predictors of pulmonary tuberculosis
This study performed a multifactor unconditional logistic regression analysis on indicators that were significant in both the single-factor analysis and those that were clinically significant. The results indicated that age, ESR, infiltration of the upper lobe or dorsal segment of the lung, multifocal polymorphic lesions with multiple densities in the lungs, and pleural thickening were independent predictors of pulmonary tuberculosis (p < 0.05), as shown in Table 3.
Results of multifactor logistic regression analysis.

CI: confidence interval; ESR: erythrocyte sedimentation rate; OR: odds ratio.
Development of diagnostic clinical predictive models for suspected pulmonary tuberculosis in adults
Based on the β coefficients of the independent predictors in the multifactor logistic regression analysis of pulmonary tuberculosis predictors, a diagnostic prediction model has been developed with the mathematical formula: P = 1/{1 + exp[–(–3.64–0.47 Age+0.04 ESR+3.61 infiltration of the upper lobe or dorsal segment of the lung+4.20 multifocal polymorphic lesions with multidensity in the lungs+1.65 pleural thickening)]}, followed by a nomogram as the presentation of the model (Figure 2). The ROC curve analysis was conducted on the modeling group, resulting in an AUC of 0.977. The Youden index determined a cut-off value of 0.611, where a score ≥ 0.611 and < 0.611 was considered as a high and low probability of pulmonary tuberculosis, respectively. The analysis revealed a sensitivity of 0.959 and a specificity of 0.894 (Figure 3). The calibration curve was evaluated for accuracy, and it fitted well (S: p-value =0.842), as shown in Figure 4. The decision curve analysis (DCA) was used to evaluate the clinical usefulness of the prediction model, yielding a good result (Figure 5).

Nomogram of the diagnostic prediction model. v1 represents age, q2 represents erythrocyte sedimentation rate (ESR), v17 represents infiltration of the upper lobe or dorsal segment of the lung, v18 represents multifocal multidensity polymorphic lesions of the lung, v20 represents pleural thickening. Points assigned for age categories were: 15–30 years (21 points), 30–45 years (14 points), 45–60 years (7 points), and ≥60 years (0 point); ESR in 0–20 mm/h corresponded to a point of 0–12.5, 20–40 mm/h to a point of 12.5–25, 40–60 mm/h to a point of 25–37.5, and so forth; the presence of infiltration of the upper lobe or dorsal segment scored 55 points, otherwise 0; the presence of multifocal multidensity polymorphic lesions scored 63 points, otherwise 0; the presence of pleural thickening scored 25 points, otherwise 0; by adding up the points for each predictor and obtaining the total points, the predicted probability of pulmonary tuberculosis can be obtained.
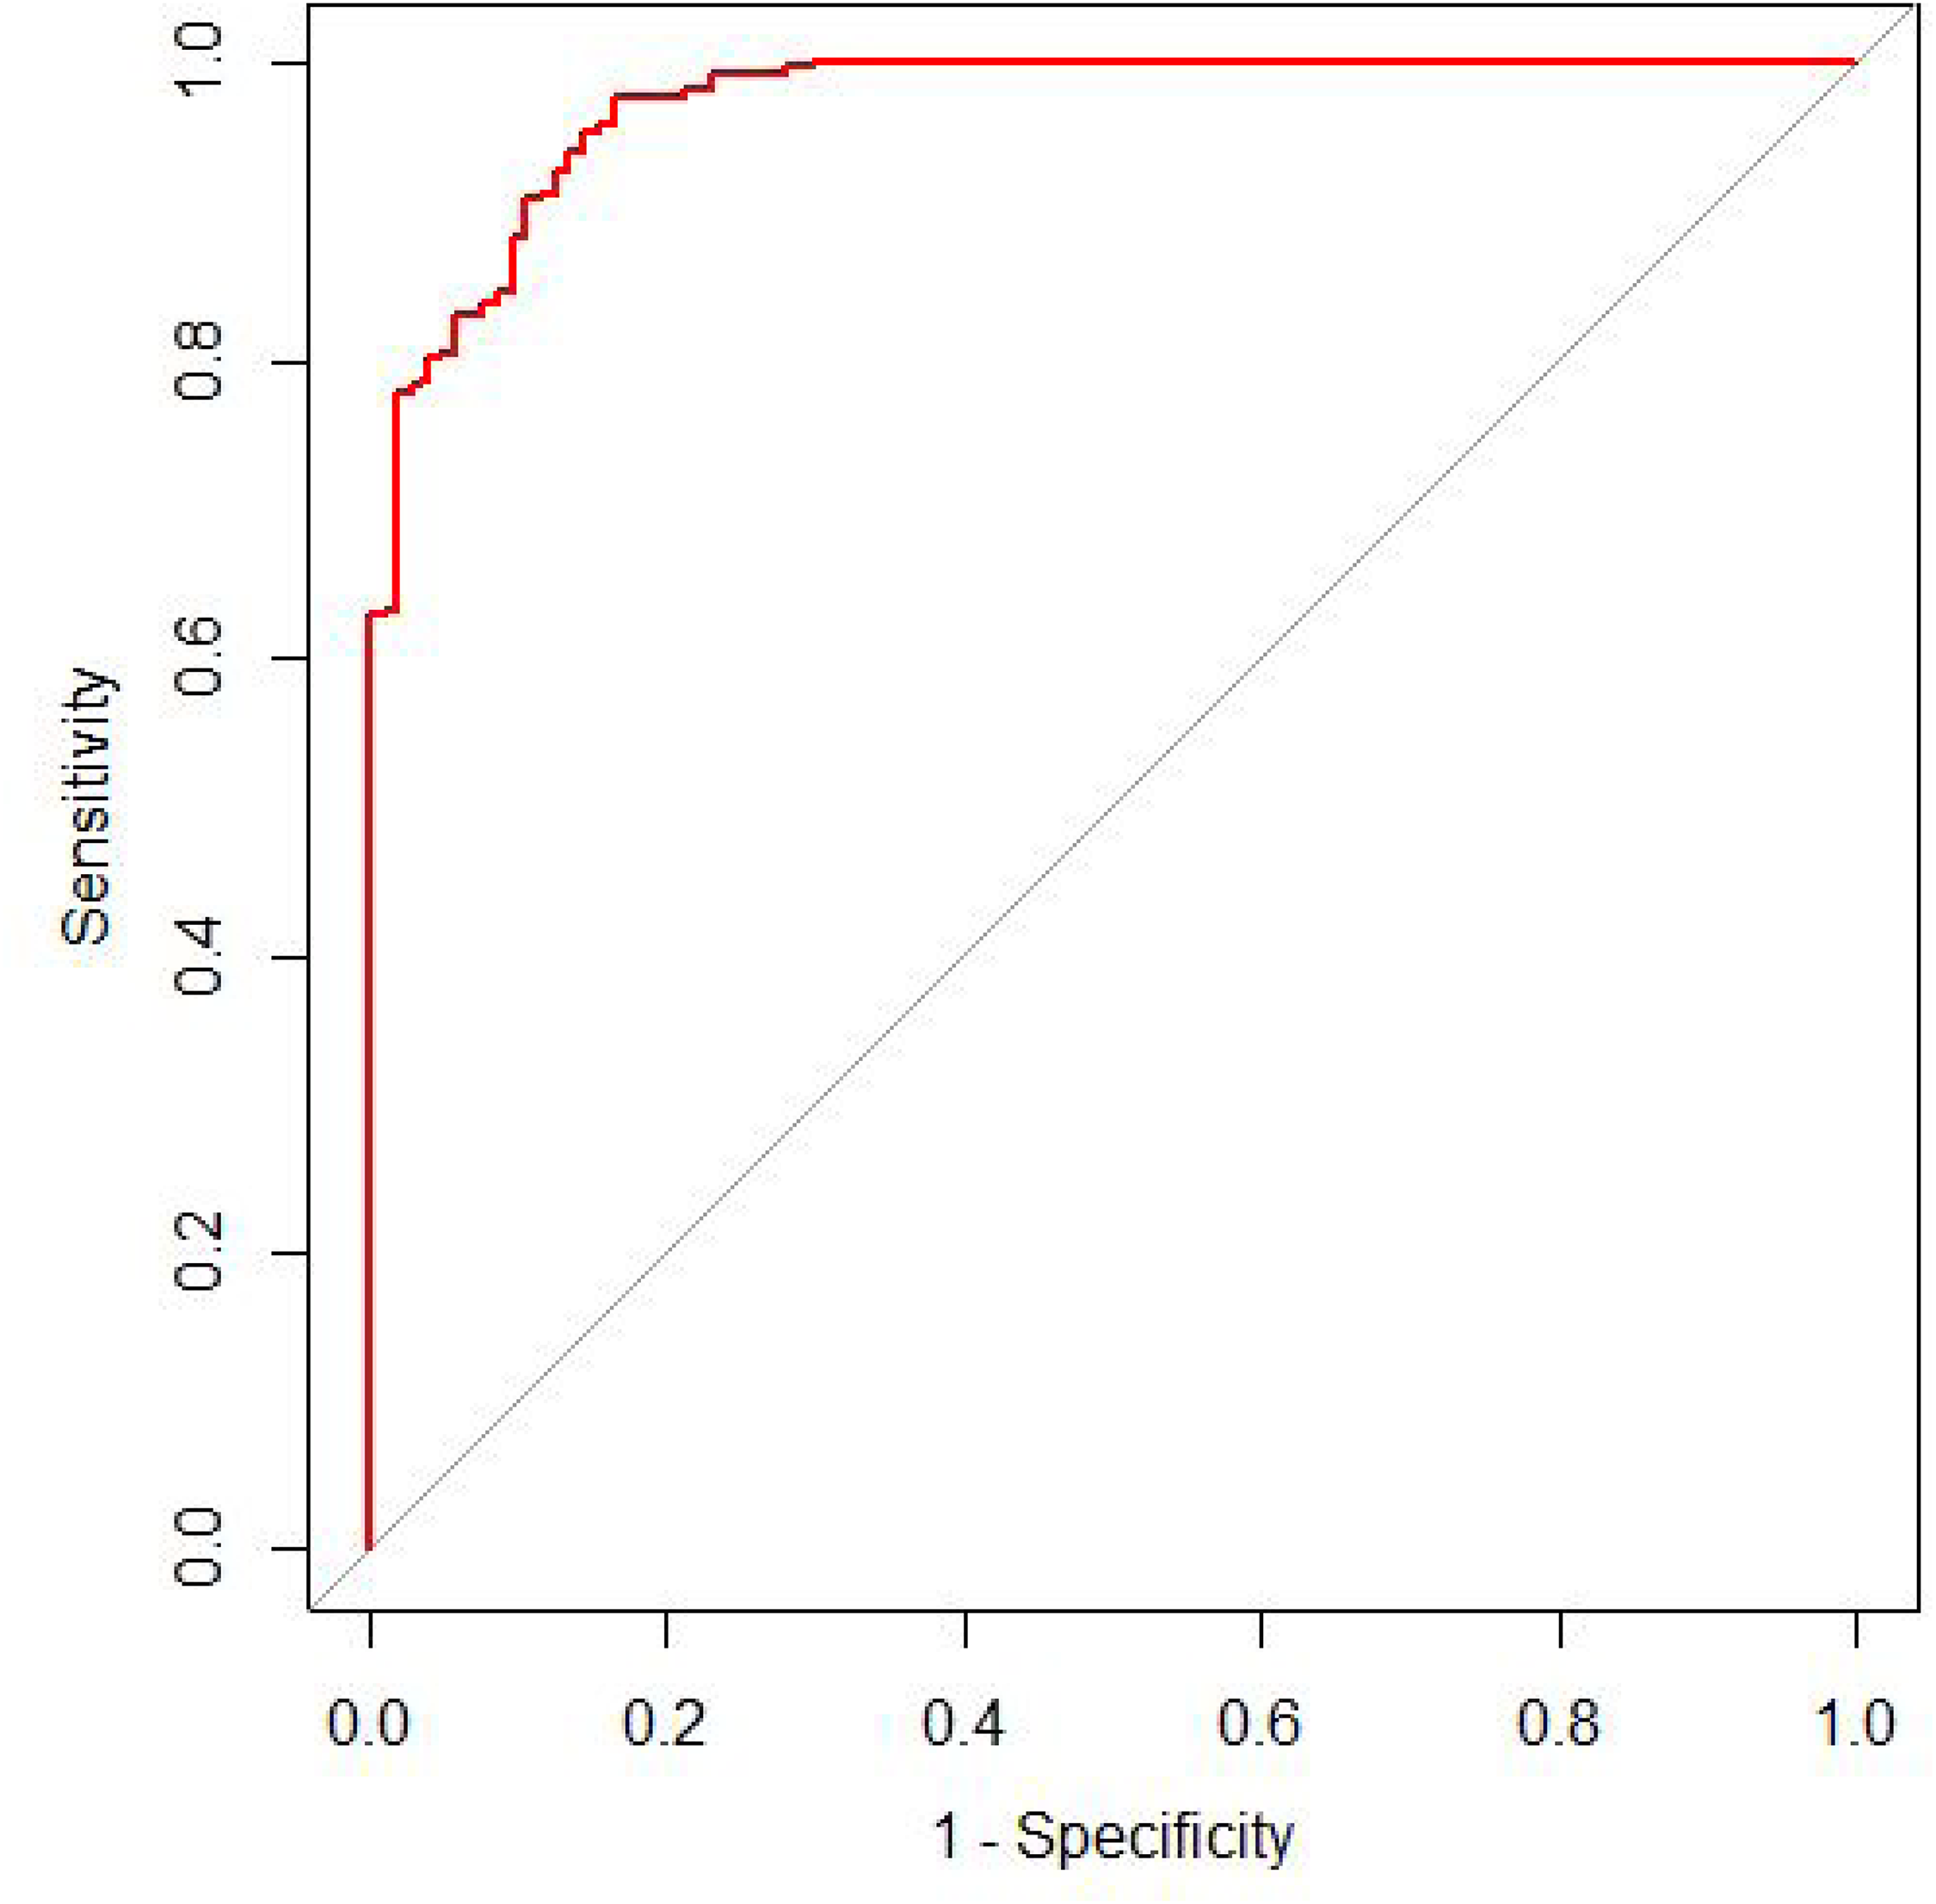
ROC curve and cut-off value for modeling group. The horizontal and vertical coordinates indicate 1-specificity and sensitivity, respectively. The AUC indicates the area under the ROC curve, which is 0.977. An AUC of 0.50–0.70, 0.71–0.90, and >0.90 signifies low, moderate, and high discriminatory power, respectively. The cut-off value (specificity, sensitivity) determined by the Youden index is 0.611 (0.894, 0.959) at the upper left tangent. ROC: receiver operating characteristic.

Calibration curve for modeling group. The horizontal coordinate is the predicted probability and the vertical coordinate is the observed probability. The intercept is 0 and the slope is 1, which is consistent with good calibration. The dashed line represents perfect calibration and the solid line corresponds to the calibration of this model in the modeling group, showing that the calibration curve highly overlaps with the perfect calibration curve. S: p-value is 0.842, and S: p > 0.05 is statistically significant.
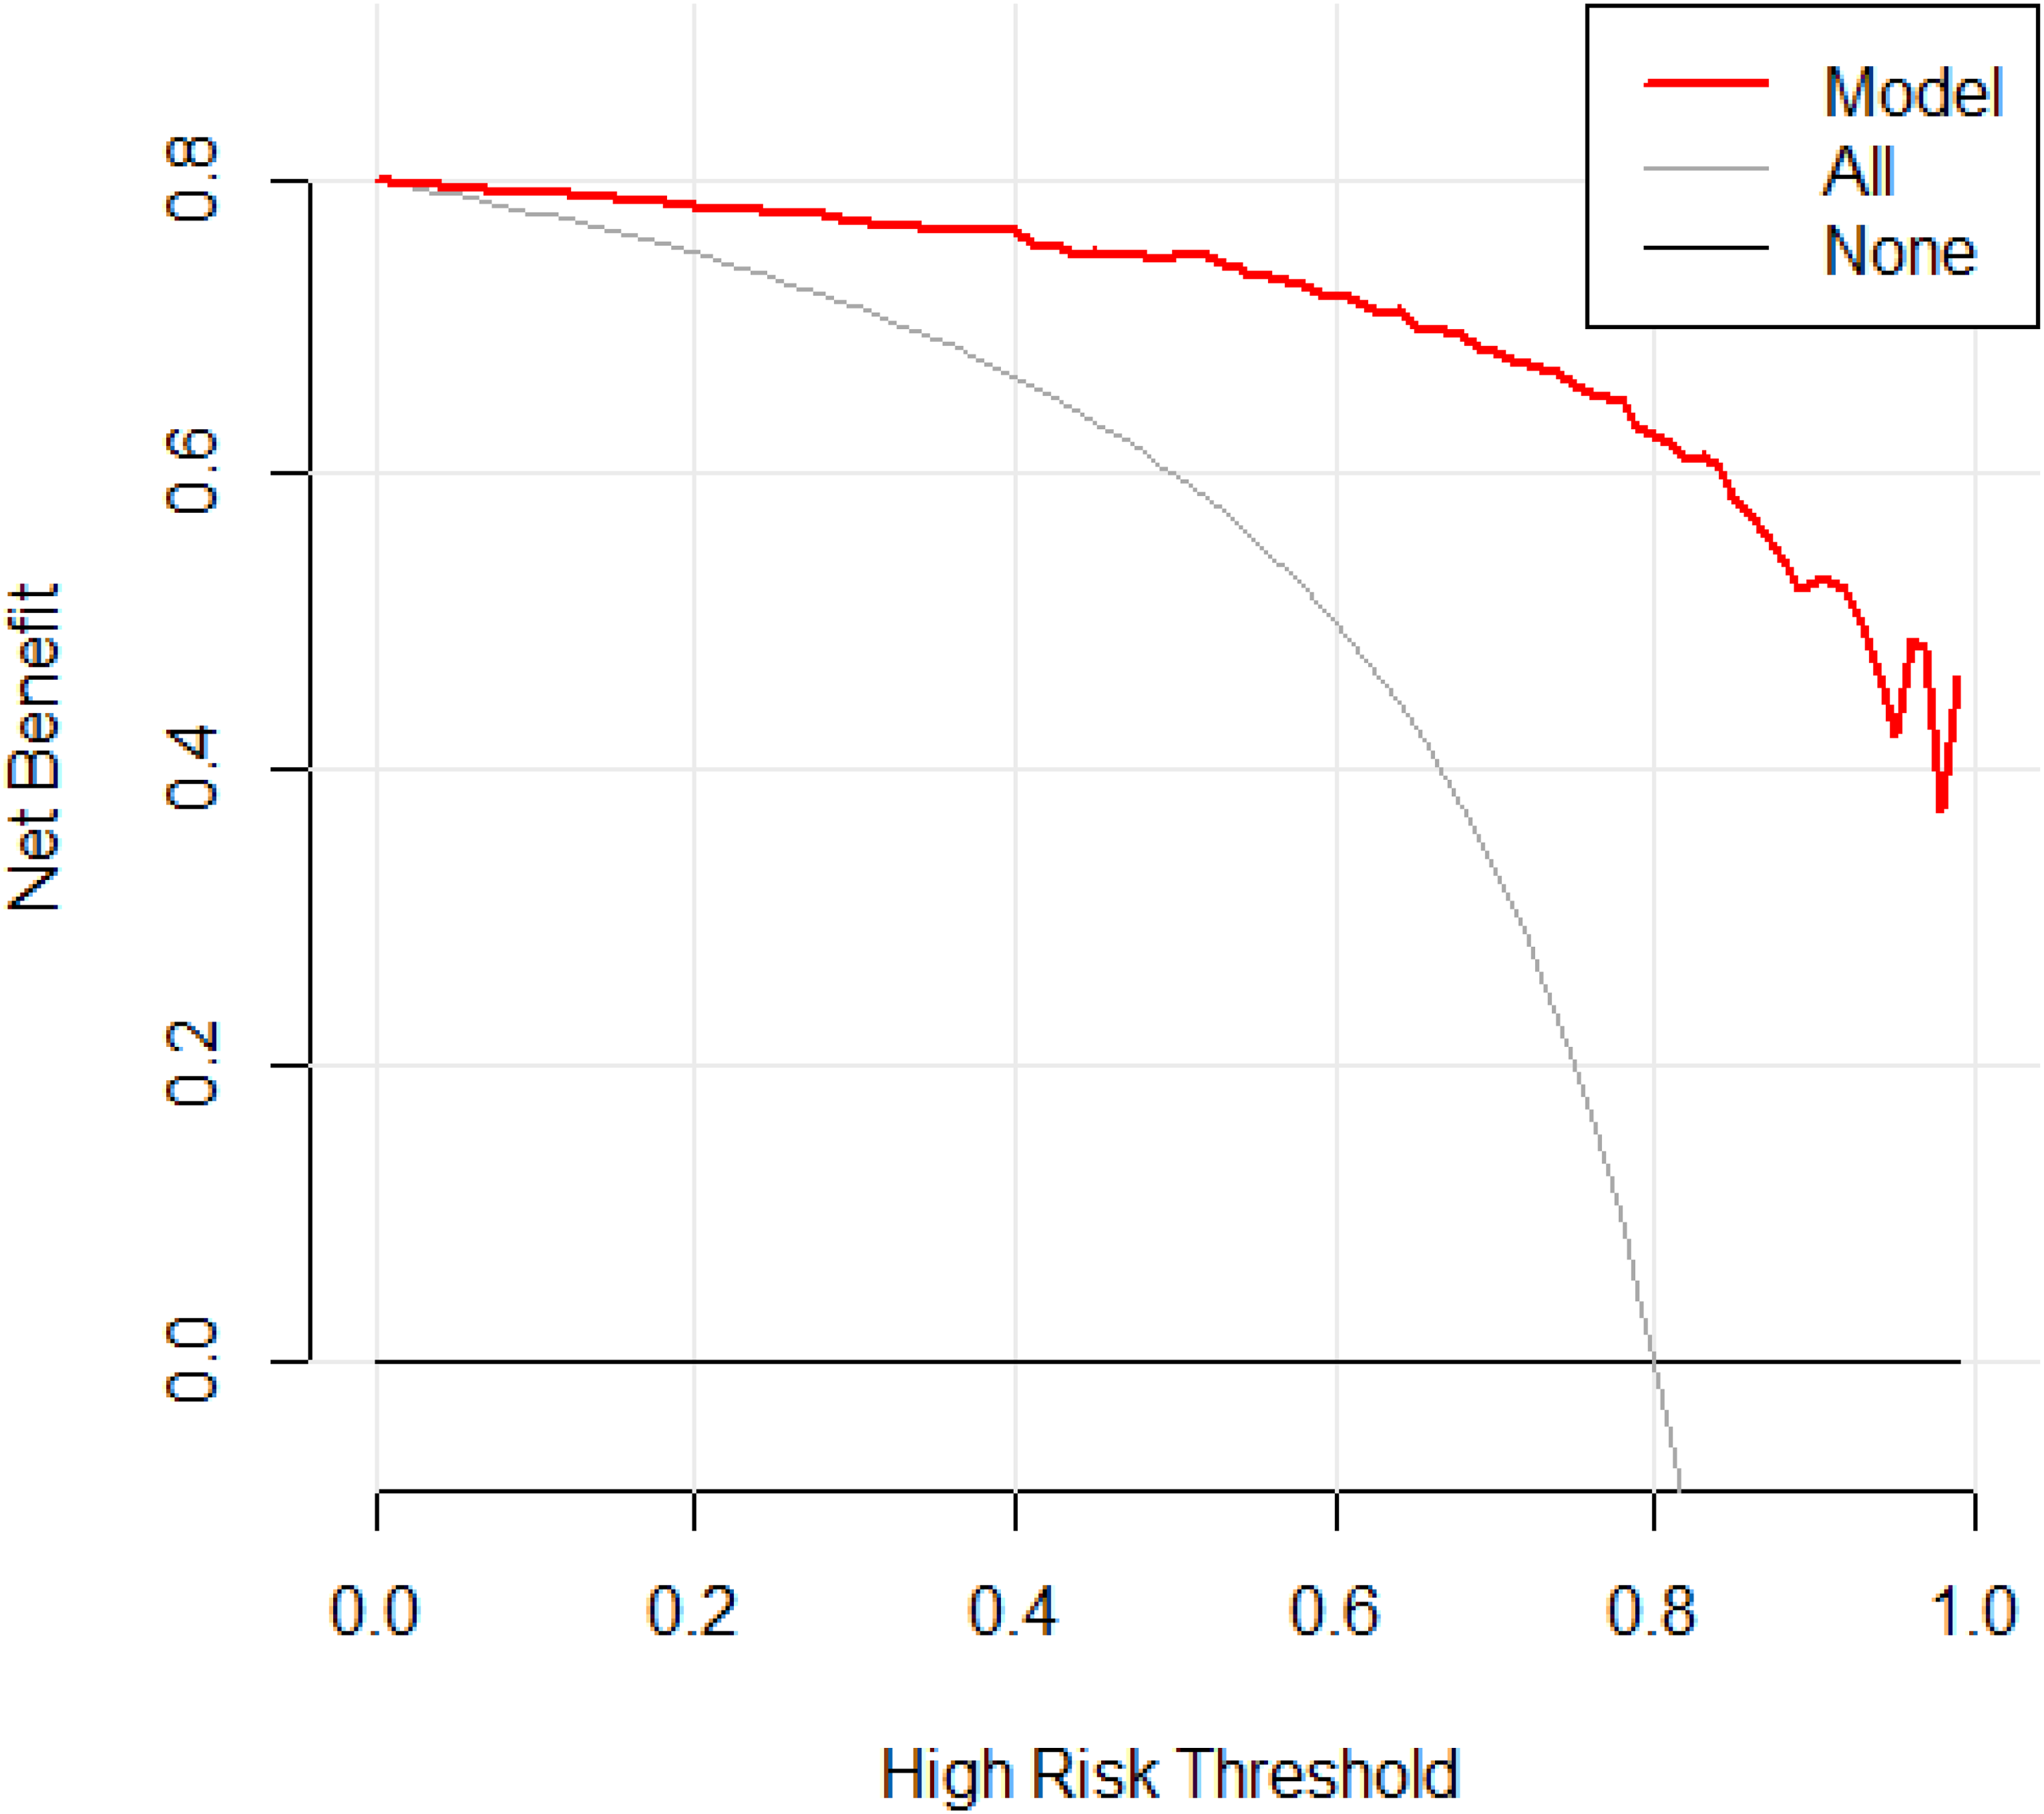
Decision analysis curve for modeling group. The decision curve analysis compared the net benefits of different treatment strategies. The horizontal coordinate indicates the high risk threshold, that is, equal benefit of with and without treatment at that probability, and the vertical coordinate indicates the net benefit, calculated as the total benefit (treatment of true pulmonary tuberculosis patients) minus the total harm (treatment of false positive pulmonary tuberculosis patients). The gray line represents the net benefit of predicting treatment for all patients with the disease, the horizontal solid line represents the net benefit of predicting no treatment for all patients without the disease, and the red line shows the decision analysis curve for the model in the modeling group. The farther the model from the two reference lines, the better the clinical usefulness of the model.
Validation of diagnostic clinical predictive models for suspected pulmonary tuberculosis in adults
The predictive efficacy of the model was evaluated through internal and external validations, and the AUC was used to evaluate the discriminatory ability of the model, yielding an AUC of 0.990 and 0.985 for the internal and external validation groups, respectively (Figures 6 and 7). The calibration curves were evaluated for accuracy, and the calibration curves for the internal and external validation fitted well (S: p-values = 0.815 and 0.973, respectively), as shown in Figures 8 and 9. The DCA was used to evaluate the clinical usefulness of this prediction model, which was good, as shown in Figures 10 and 11.
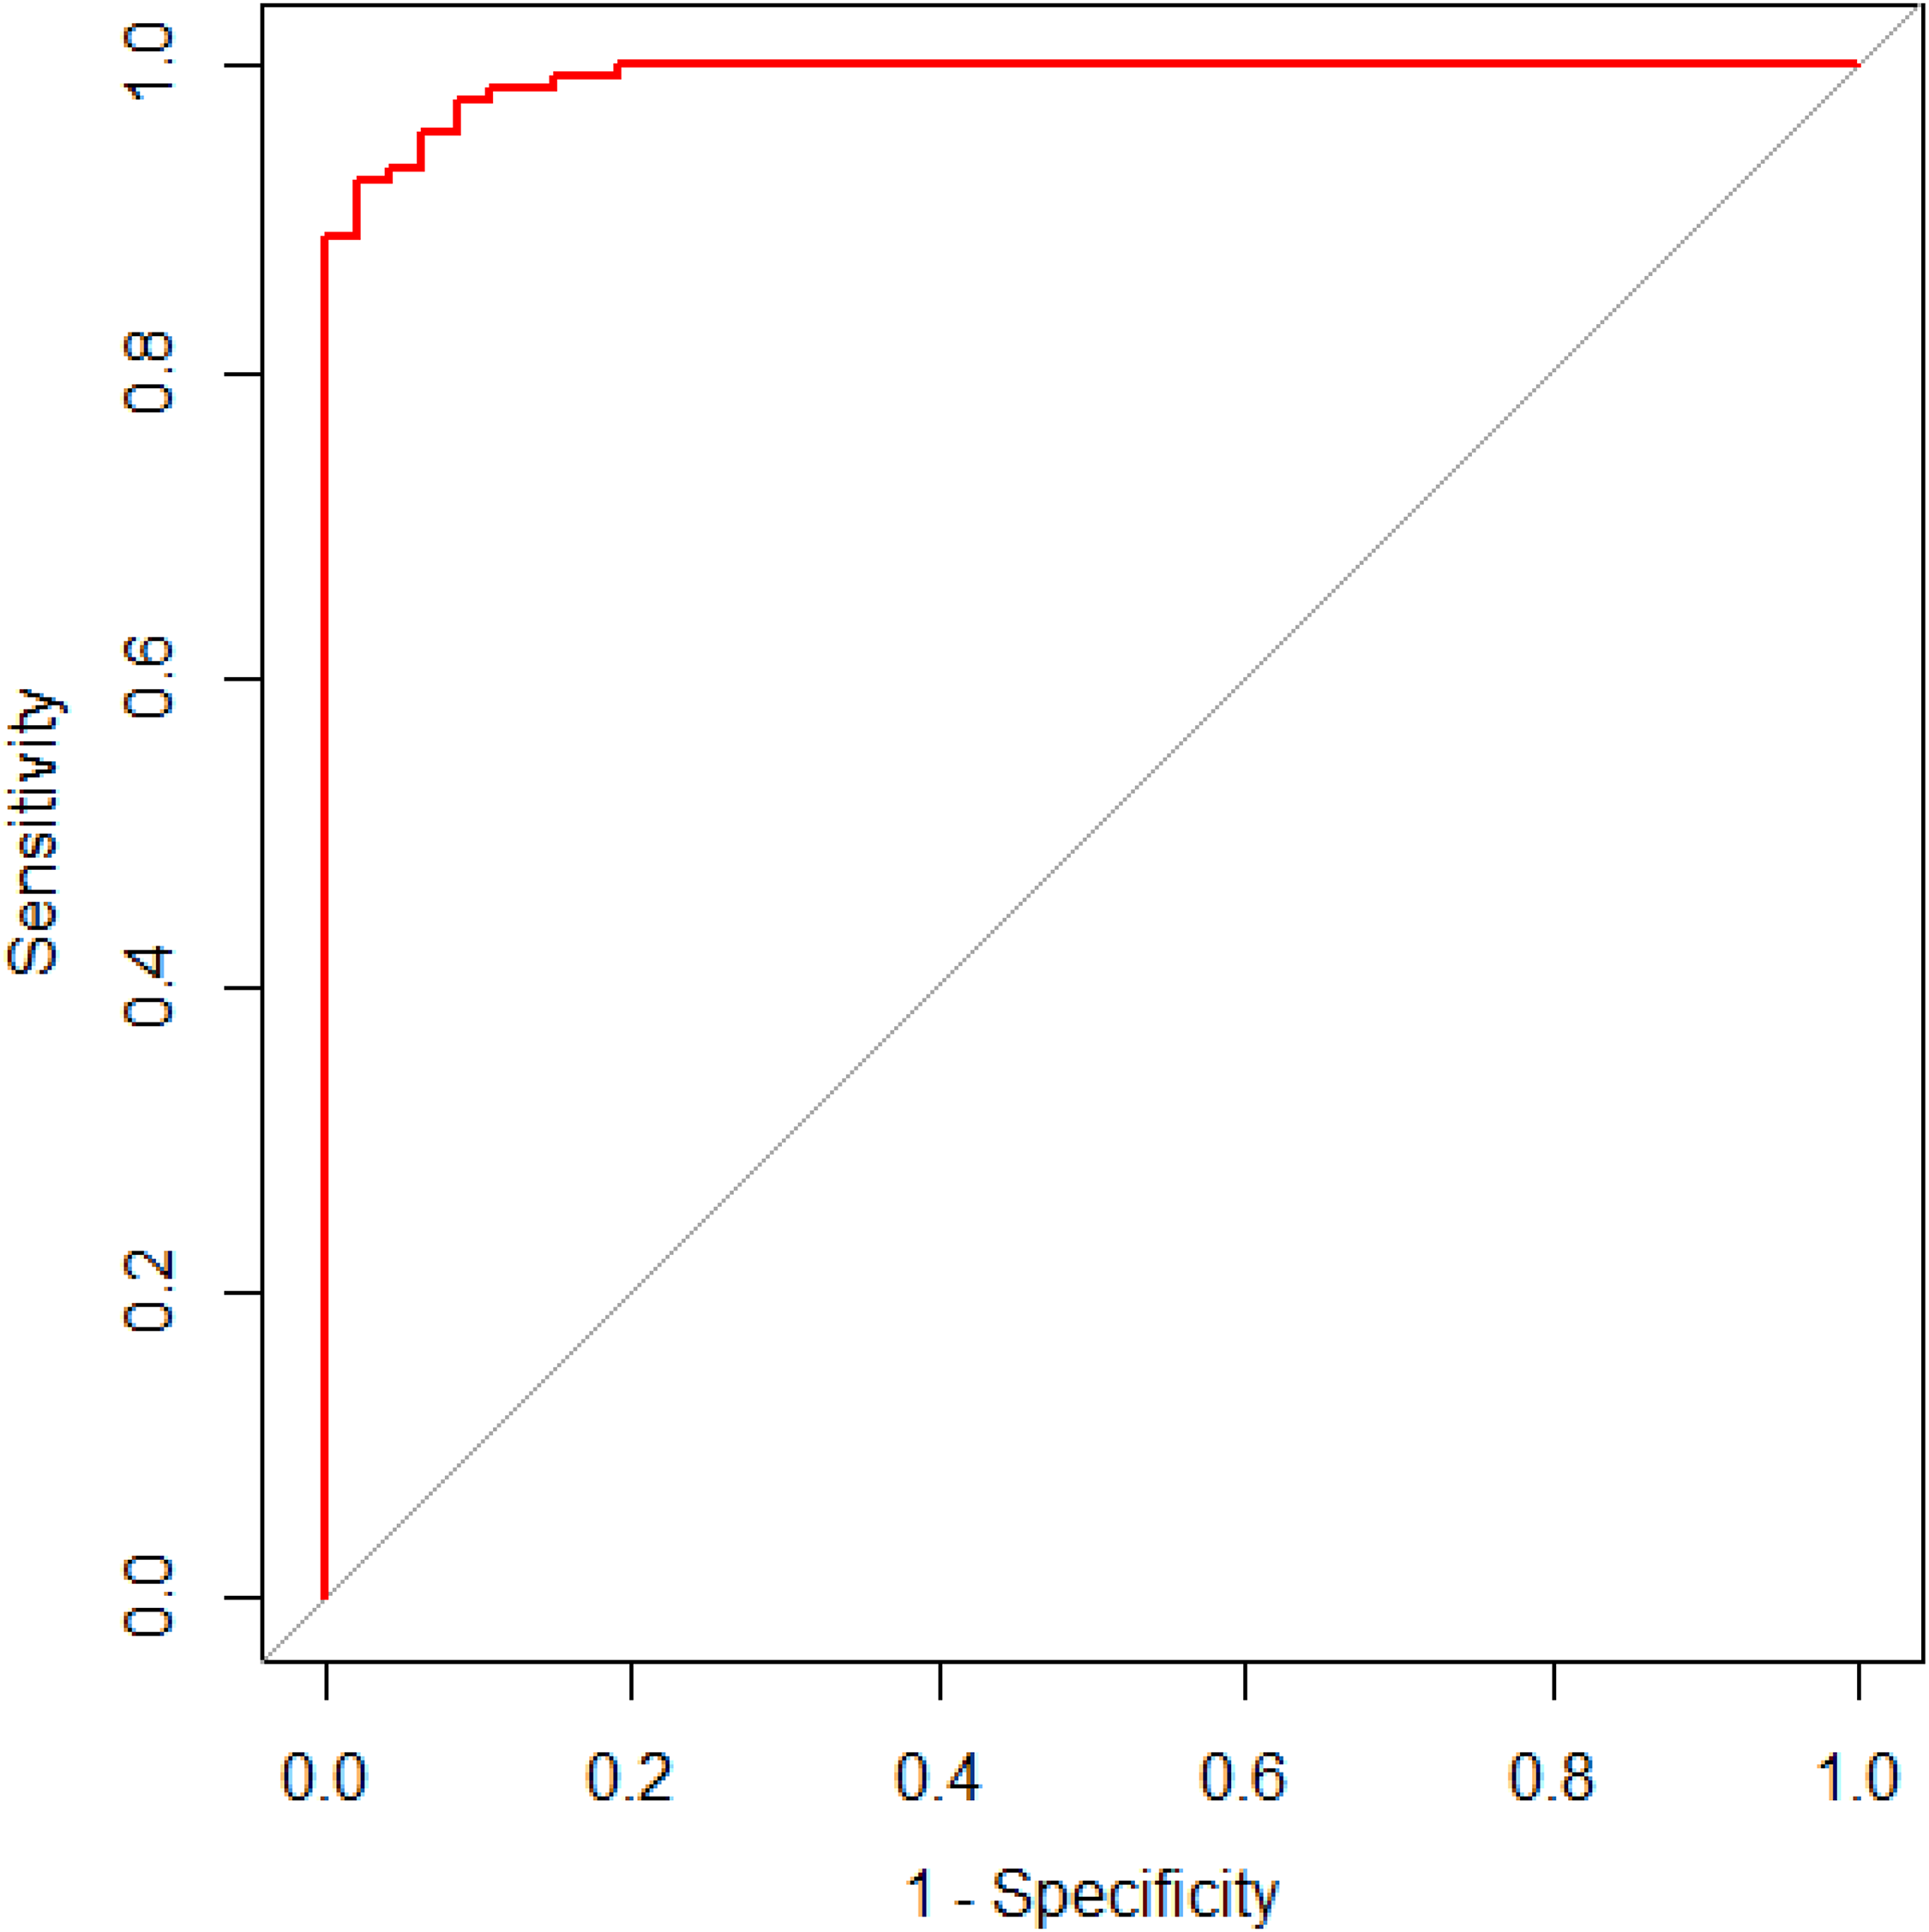
ROC curve for the internal validation group. The horizontal and vertical coordinates indicate the 1-specificity and sensitivity, respectively. The AUC is the area under the ROC curve, which was 0.990. The upper left tangent indicates the cut-off value (specificity, sensitivity) determined by the Youden index, which was 0.842(0.957, 0.963). ROC: receiver operating characteristic.

ROC curve for the external validation group. The horizontal and vertical coordinates indicate 1-specificity and sensitivity, respectively. The AUC indicates the area under the ROC curve, which was 0.985. The upper left tangent indicates the cut-off value (specificity, sensitivity) determined by the Youden index, which was 0.878 (0.990, 0.890). ROC: receiver operating characteristic.

Calibration curve for the internal validation group. The horizontal and vertical coordinates indicate the predicted and observed probability, respectively. The intercept was 0 and the slope was 1, which was consistent with good calibration. The dashed line represents perfect calibration, the solid line corresponds to the calibration of this model in the internal validation, and the S: p-value was 0.815, which was statistically significant.
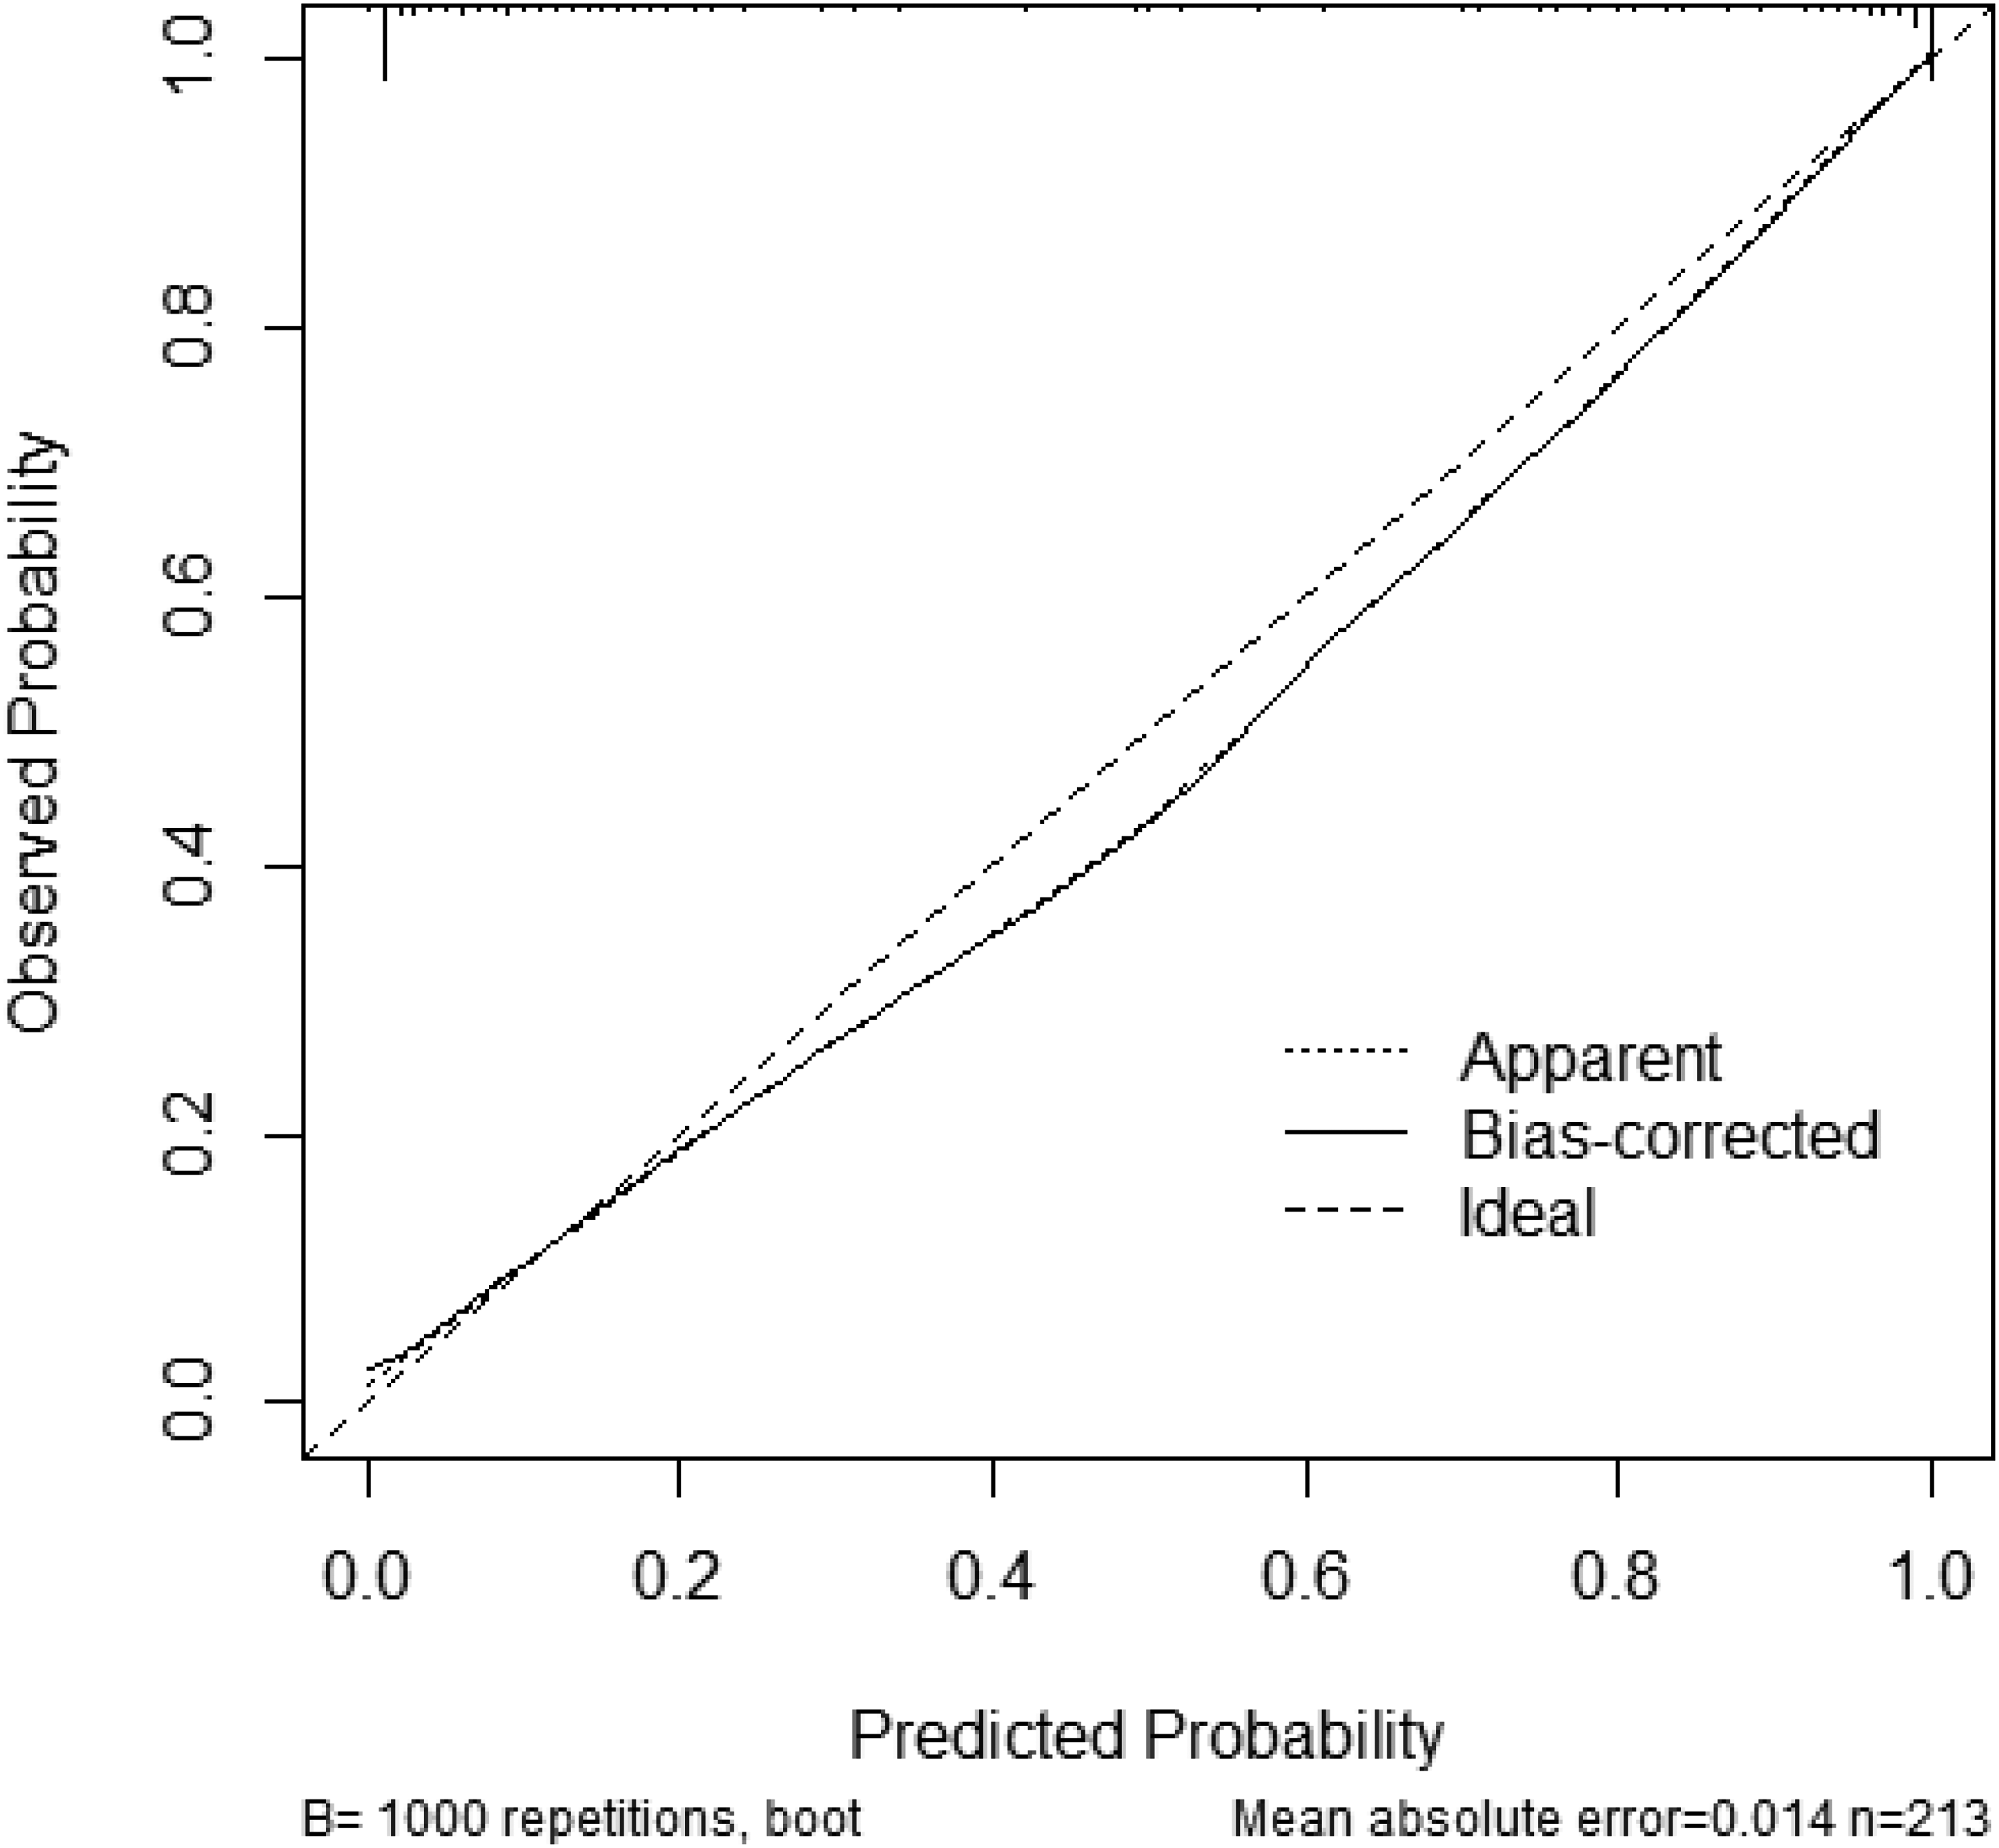
Calibration curve for external validation group. The horizontal and vertical coordinates indicate the predicted and observed probability, respectively. The intercept was 0 and the slope was 1, which was consistent with good calibration. The dashed line represents perfect calibration, the solid line corresponds to the calibration of this model in the external validation, and the S: p-value was 0.973, which was statistically significant.
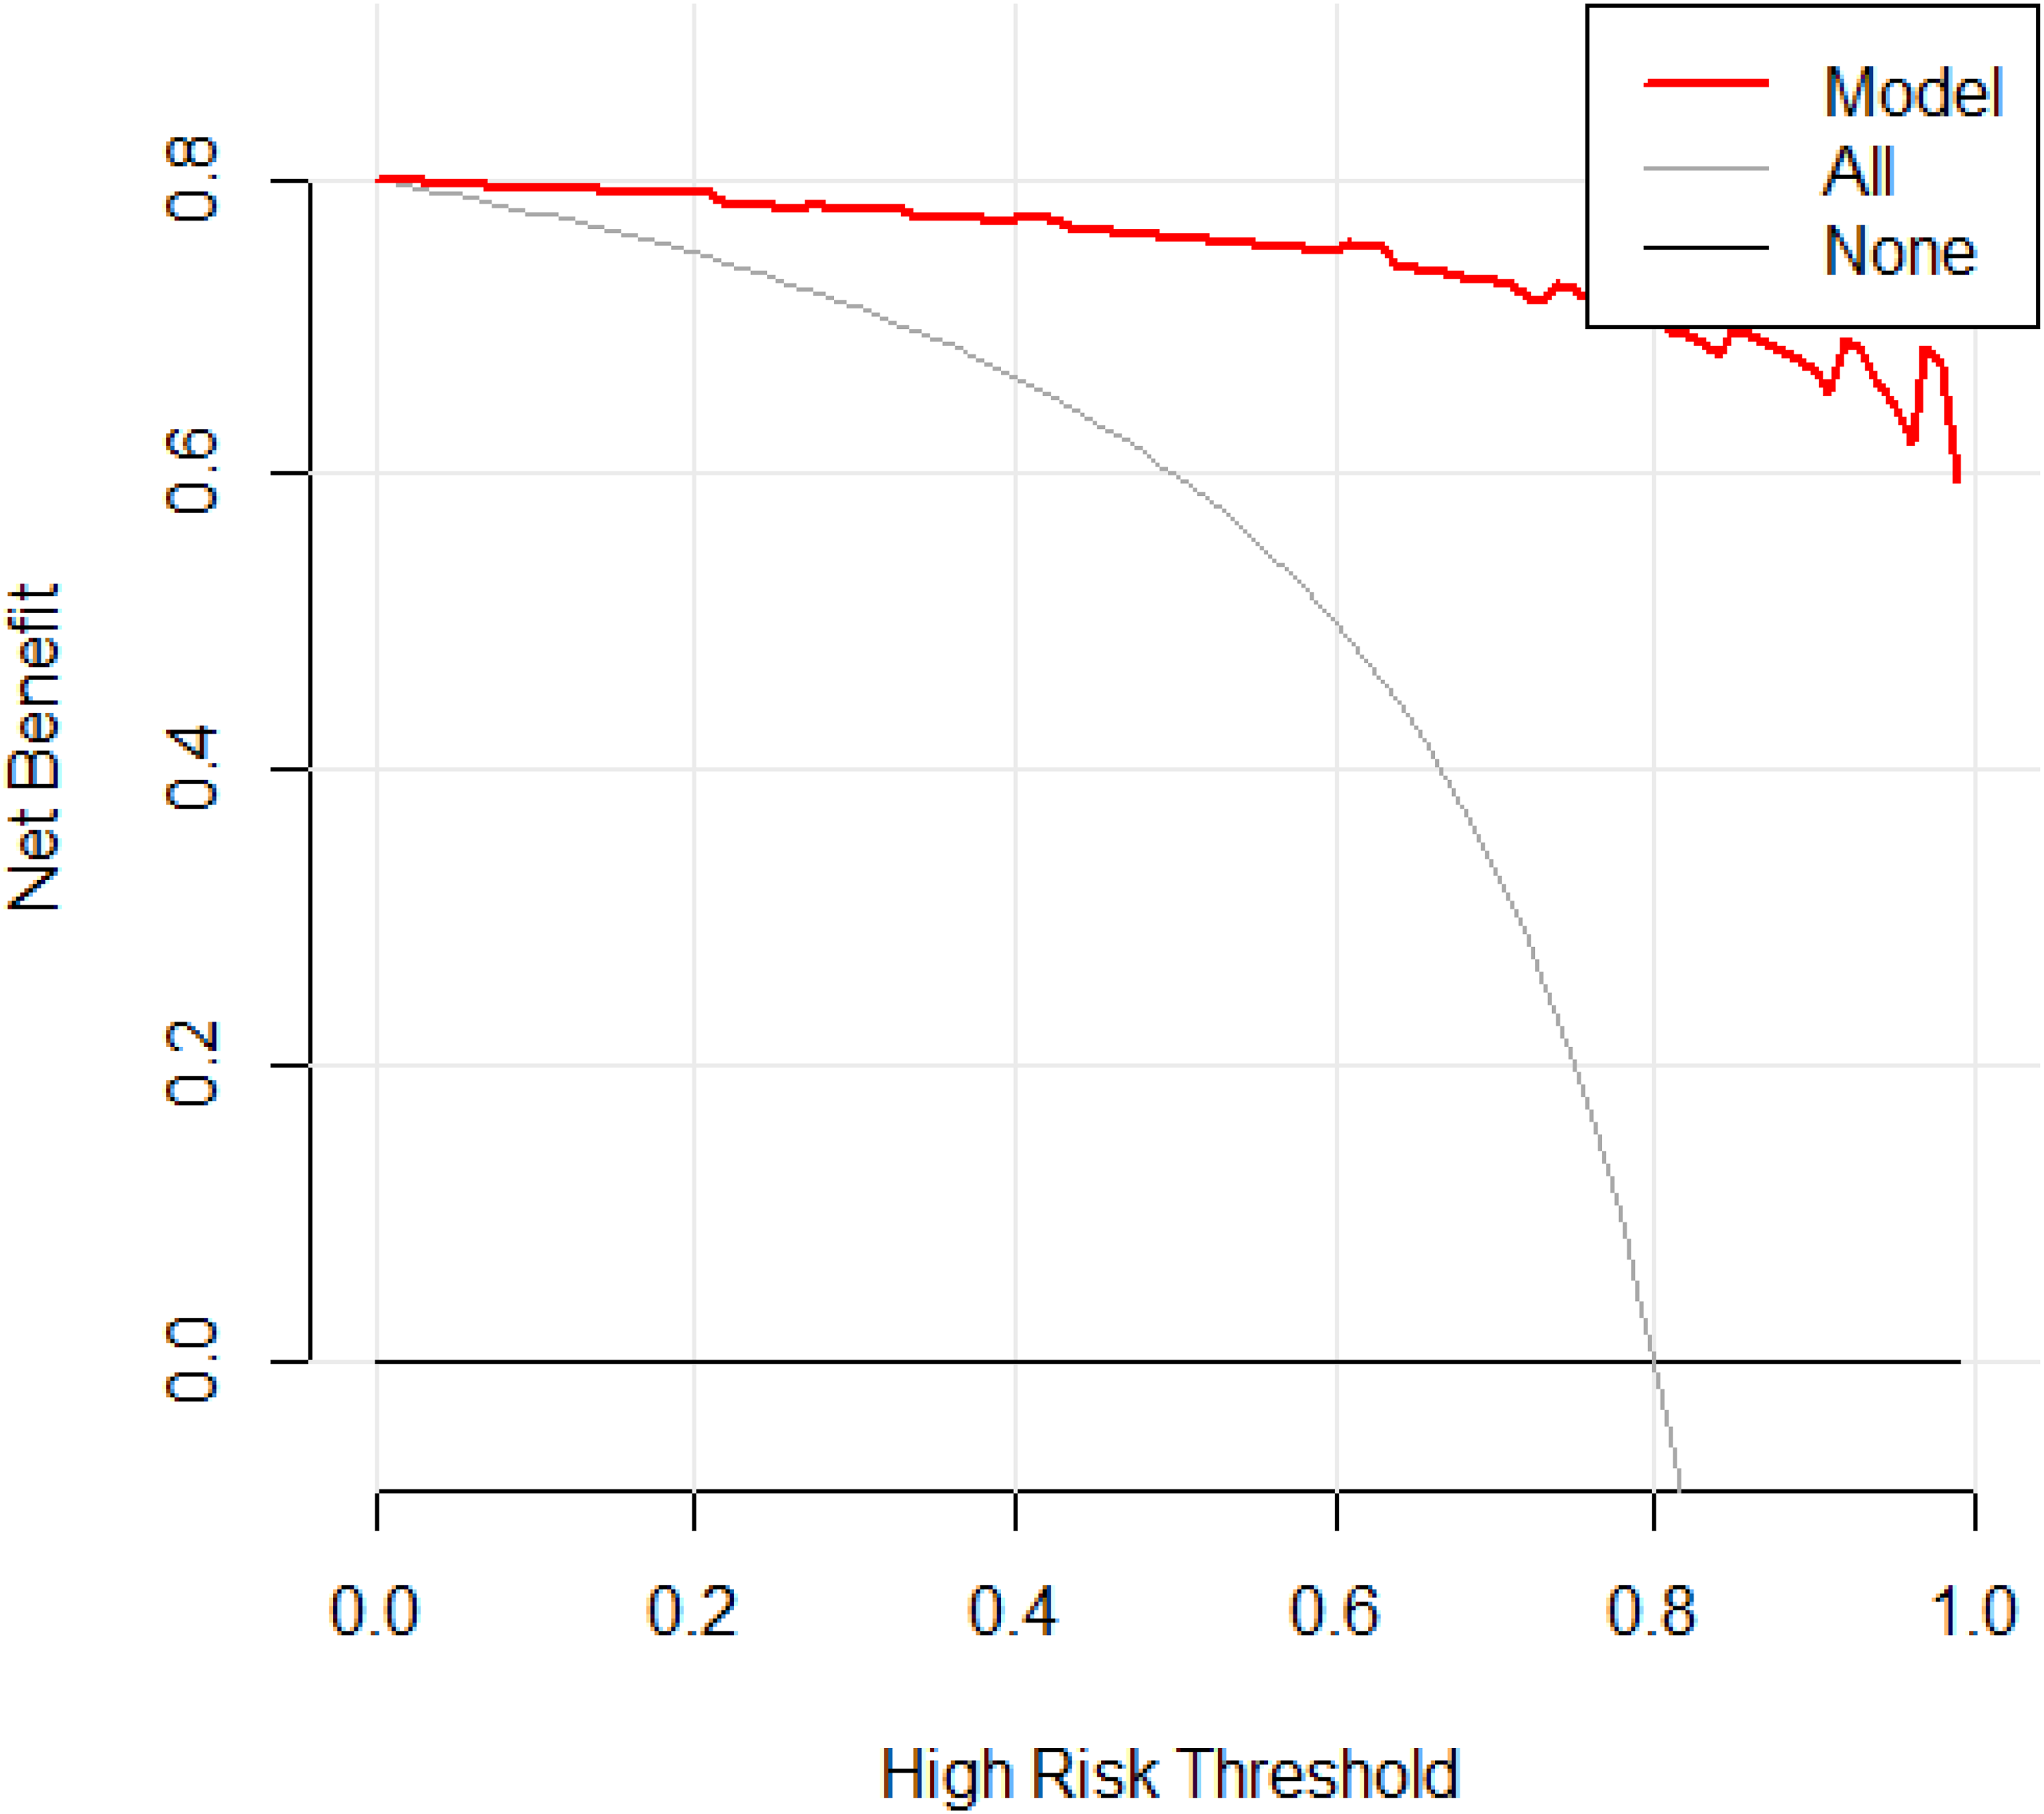
Decision analysis curve for the internal validation group. The decision curve analysis compared the net benefits across different treatment strategies. The horizontal coordinate indicates the high risk threshold, that is, equal benefit of with and without treatment at that probability. The vertical coordinate indicates the net benefit, calculated as the total benefit (treatment of true pulmonary tuberculosis patients) minus the total harm (treatment of false-positive pulmonary tuberculosis patients). The gray line represents the net benefit of predicting treatment for all patients with the disease, while the horizontal solid line represents the net benefit of predicting no treatment for all patients without the disease. The red line shows the decision analysis curve for the internal module; the farther the model from the two reference lines, the better the clinical usefulness of the model.
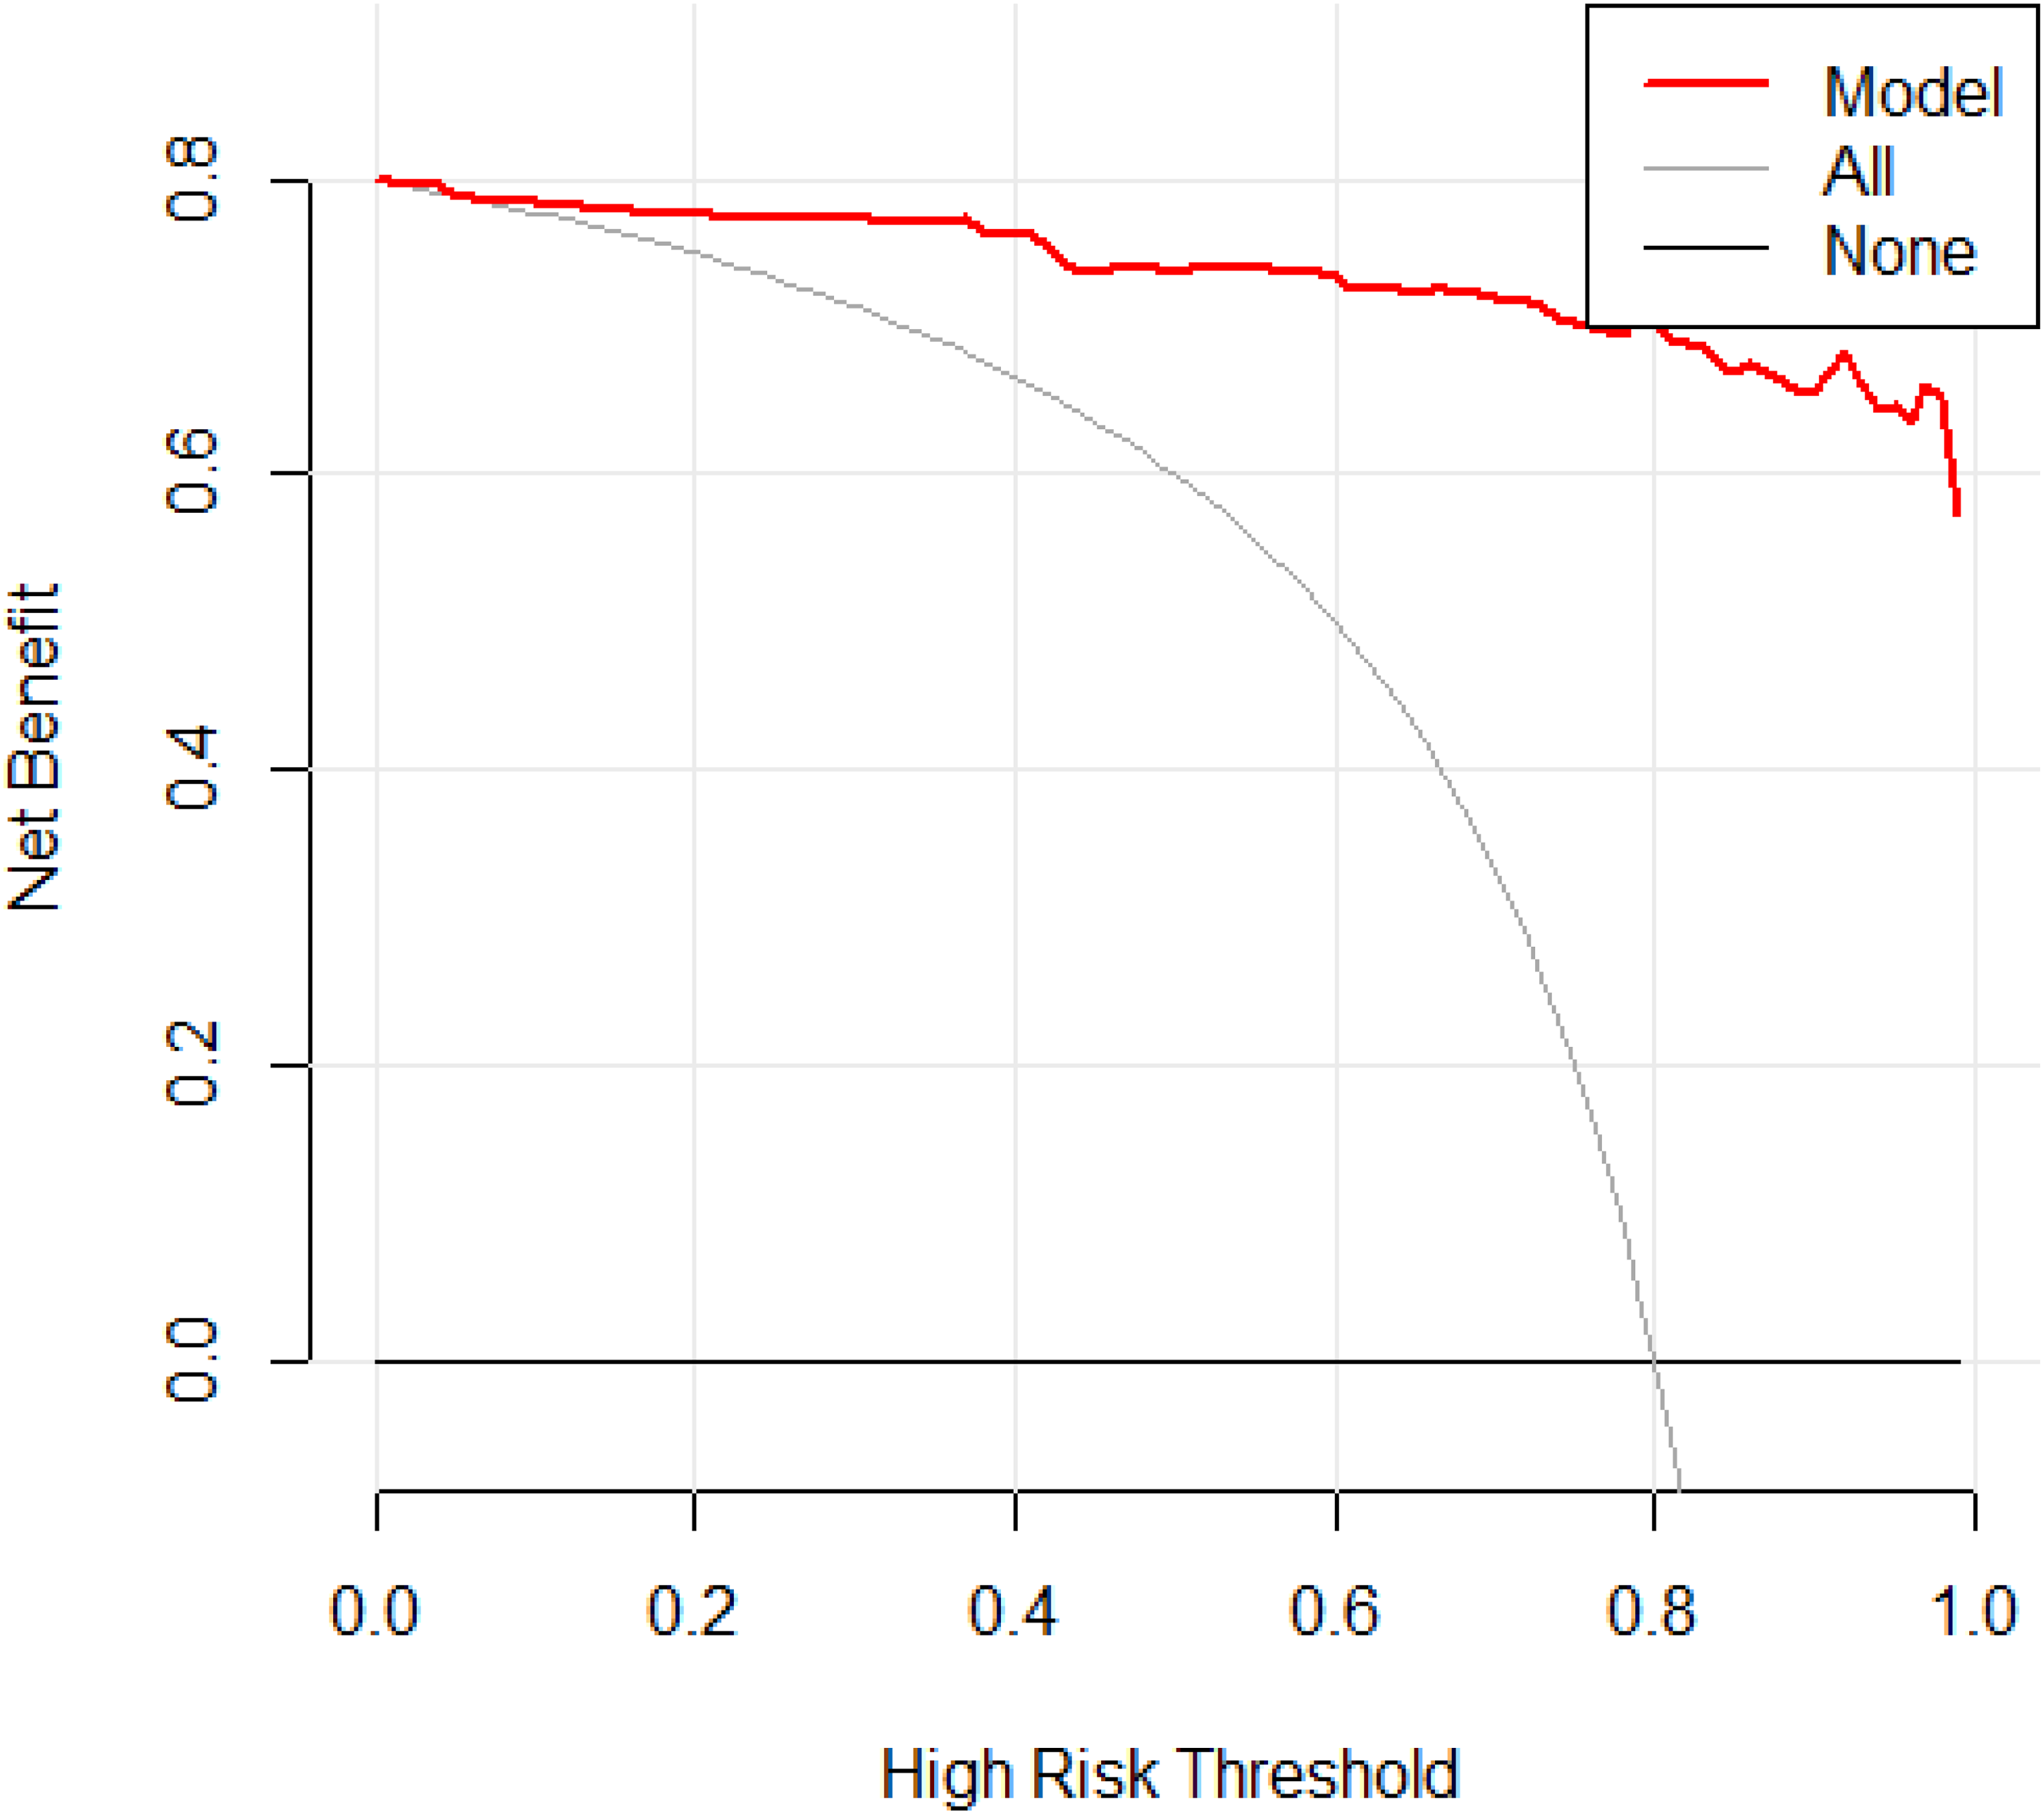
Decision analysis curve for the external validation group. The decision curve analysis compared the net benefits across different treatment strategies. The horizontal coordinate indicates the high risk threshold, that is, equal benefit of with and without treatment at that probability, and the vertical coordinate indicates the net benefit, calculated as the total benefit (treatment of true pulmonary tuberculosis patients) minus the total harm (treatment of false-positive pulmonary tuberculosis patients). The gray line represents the net benefit of predicting treatment for all patients with the disease, and the horizontal solid line represents the net benefit of predicting no treatment for all patients without the disease. The red line shows the decision analysis curve for the external module; the farther the model from the two reference lines the better the clinical usefulness of the model.
Discussion
Tuberculosis is a preventable and curable disease, and approximately 85% of patients with tuberculosis can be successfully cured through 6 months of drug treatment, 1 while reducing the continued spread of infection. However, the current tuberculosis prevention and treatment remains far from satisfactory, and tuberculosis still ranking among the leading causes of death worldwide, and its incidence continuous to rise. This is largely attributed to the difficulty in diagnosing pulmonary tuberculosis, owing to the following reasons. First, most patients show atypical clinical symptoms, especially older patients. 7 Second, the PPD skin test and γ-interferon release test are influenced by a variety of factors related to the immune status of the body and are mostly used to detect tuberculosis infection,26,27 however, it can only indicate the presence of latent tuberculosis infection and have limited value in assessing the activity of pulmonary tuberculosis. 28 Third, there exists a prevailing pessimism or outright rejection of MTB antibody testing both domestically and internationally. 29 Fourth, atypical pulmonary tuberculosis is increasing and its imaging manifestations are becoming more diverse owing to the misuse of antibiotics and the increasing number of immunosuppressed patients. 30 Last, smear microscopy has low sensitivity and specificity, and the MTB culture may take several weeks to provide results, while molecular techniques are relatively expensive and not yet widely accessible in low- and middle-income countries, especially in primary care hospitals. Moreover, pathology diagnosis is mostly combined with invasive examination, which are not easily accepted by patients. 1 Hence, further studies are required to significantly progress in the diagnosis of pulmonary tuberculosis to ensure early detection, diagnosis, and treatment.
Clinical prediction models have been widely used in the screening of high-risk groups, individualized disease diagnosis, and treatment and prevention. Thus, the establishment of a clinical prediction models with good predictive efficacy is essential to improve the treatment process and patient prognosis. The current status of pulmonary tuberculosis remains far from satisfactory, and a large proportion of patients with pulmonary tuberculosis are being omitted and misdiagnosed. There is an urgent need to develop a rapid, simple, and accurate clinical prediction model to guide clinicians in the early detection, diagnosis, and treatment to reduce morbidity and mortality. Hence, several studies have been conducted to establish and validate diagnostic clinical prediction models for pulmonary tuberculosis. Solari et al. 31 found that age, history of pulmonary tuberculosis, weight loss, pulmonary cavity, upper lobe infiltration, and pulmonary miliary, were independent predictors of pulmonary tuberculosis using information collected from patients with respiratory symptoms in the emergency department of a hospital in areas with a high prevalence of pulmonary tuberculosis. In sub-Saharan Africa, Baik et al. 32 developed a prediction model for active pulmonary tuberculosis comprising six variables: age, sex, HIV infection, history of diabetes, number of typical tuberculosis symptoms, and duration of symptoms for more than 14 days. Chen et al. 33 found that age, hemoglobin, lymphocyte count, γ-interferon release test, weight loss, night sweats, polymorphic lesions in the lungs, and foci of pulmonary calcification were associated with pulmonary tuberculosis. Among HIV-infected patients, eight statistically significant differences were observed between patients with pulmonary tuberculosis and those with nontuberculous lung infections, including fever, highest body temperature, ESR, cervical lymphadenopathy, hilar and/or mediastinum lymphadenopathy, pulmonary cavity, pleural effusion, and pulmonary miliary nodules. 14 The results of a study by Hanifa et al. 34 on HIV patients showed that predictors of pulmonary tuberculosis included antiretroviral treatment status, body mass index (BMI), CD4+ T cell count, and the number of typical tuberculosis symptoms. Saunders et al. 18 found that among adult pulmonary tuberculosis contacts, the predictors of pulmonary tuberculosis included age, sex, BMI, history of previous pulmonary tuberculosis, index of continuous exposure, lower household socioeconomic status, indoor air pollution, and fewer windows in the room in which they lived. A systematic review found that infiltration of the upper lobe of the lung and pulmonary cavity was significantly associated with pulmonary tuberculosis. 35 Some studies have suggested that a history of pneumoconiosis, 36 NLR, 37 and pleural thickening 38 are some significant predictors of pulmonary tuberculosis. Studies have also suggested that C-reactive protein level at the first visit is not an independent predictor of pulmonary tuberculosis. 16
Our study included 26 predictors associated with pulmonary tuberculosis, and a diagnostic clinical prediction model for suspected pulmonary tuberculosis in adults has been developed using statistical methods, which included five independent predictors: age, ESR, infiltration of the upper lobe or dorsal segment of the lung, multifocal polymorphic lesions with multiple densities in the lungs, and pleural thickening. The results of the present study differ from those of the aforementioned studies. These five factors, including the three imaging indicators, are simple and clinically accessible, underscoring the indispensable role of imaging in the early diagnosis of pulmonary tuberculosis. All typical pulmonary tuberculosis symptoms in this study were eliminated in the single factor analysis, suggesting that the contribution of symptoms to the early diagnosis of pulmonary tuberculosis was not significant and may be related to the following reasons. First, some patients were asymptomatic or had no obvious symptoms at the onset of the disease, but were admitted with imaging findings suggestive of pulmonary lesions as the main complaint. Second, most of the nontuberculosis patients included had pneumonia, acute exacerbation of chronic obstructive pulmonary disease, and lung cancer. Additionally, they exhibit symptoms such as chronic cough, coughing sputum, hemoptysis or blood in sputum, and fever, which were similar to those of patients with pulmonary tuberculosis. Some studies have suggested that malnutrition, 1 BMI, 34 PPD skin test, 15 and HIV infection 32 are independent predictors of pulmonary tuberculosis. Due to the fact that height was not recorded in the medical record system of Changsha Central Hospital, that PPD skin test results were not fully recorded and that the number of HIV cases was considerably small, these three indicators were not included in this study. Moreover, age was found to be statistically insignificant when used as a continuous variable. After classifying age into four groups and subsequently performing single and multifactor logistic regression analysis, the results showed that age was an independent predictor of pulmonary tuberculosis diagnosis, which was similar to the findings of Solari et al. 31 and Baik et al. 32 Thus, there is a need to consider whether continuous variables such as hemoglobin, albumin, and ESR need to be transformed into classified variables prior to statistical analysis, which can be trialed in subsequent studies to build new prediction models. In addition, the results of single-factor analysis suggested that a history of diabetes was not statistically significant. Given that a history of diabetes is one of the risk factors for tuberculosis proposed by the World Health Organization and that pulmonary tuberculosis is commonly associated with diabetes in clinical practice, the inclusion of diabetes in the multifactor analysis for modeling led to a better predictive performance than a model that included only indicators that were meaningful for the single-factor analysis.
The discriminatory ability of this simple clinical prediction model was evaluated by an AUC (AUC=0.982) and was broadly similar, or superior to the previously published prediction models that incorporated parameters including HIV infection (AUC=0.82), 32 diabetes (AUC=0.84), 39 BMI (AUC=0.79), 34 hemoglobin (AUC=0.89), 40 CD4+ T cell count (AUC=0.79), 34 PPD skin test (AUC=0.8751), 15 and chest imaging features (AUC=0.84). 39 Notably, some prediction models have been explicitly designed for use in HIV-positive populations,14,15 where pulmonary tuberculosis tends to be more difficult to diagnose. Hence, there is a risk that these prediction models may have a limited ability to be generalized to HIV-negative populations. Other prediction models have been developed for tuberculosis contacts,17,18 and most of these contacts are asymptomatic for pulmonary tuberculosis, which has implications for generalization. A systematic review highlighted that the existing clinical prediction models for pulmonary tuberculosis lacked or had inadequate validation.19,20 Chen et al. 41 established a diagnostic model for pathogen-negative first-treatment pulmonary tuberculosis patients, which showed good discriminatory ability; however, clinical usefulness evaluation and external validation were not performed. Our model was evaluated for accuracy in both the internal and external validation groups, and the results showed that the calibration curves fit well with S: p-values of 0.815 and 0.973, respectively, and both performed well in the clinical usefulness evaluation. The clinical prediction model showed good discriminatory power, accuracy, and clinical usefulness, and the external validation results indicated that the model had some generalizability. Our ultimate goal was to develop a diagnostic clinical prediction model with good predictive performance to rapidly identify patients with suspected pulmonary tuberculosis, shorten the diagnosis time, enable rapid diagnosis and effective treatment, reduce transmission, and provide a basis for referral from primary care hospitals for confirmatory testing and even diagnostic antituberculosis treatment to guide clinical practice.
Limitations and prospects
Our study has certain limitations. Some of the factors that may be relevant to the prediction of pulmonary tuberculosis were not included in our study owing to missing data. The data were collected at specialized tuberculosis hospitals, where the number of pulmonary tuberculosis cases was significantly higher than that of nontuberculosis cases, and no further case information was collected from other populations to ensure a natural population for the sample. Additionally, the positive outcome event of our study was only a definite diagnosis of pulmonary tuberculosis, so clinically diagnosed pulmonary tuberculosis cases were excluded from the study design.
This study proposes the following prospects: the model's predictive performance can be enhanced through prospective data collection. Ongoing data gathering can facilitate the development of new diagnostic predictive models, by incorporating indicators, which may hold significance but were not yet considered in this study. These comprise the data of clinically diagnosed pulmonary tuberculosis inpatients, PPD skin test, BMI, and immune-related indicators, including lymphocyte count, biomarkers related to transcriptomics, proteomics, and metabolomics.
Conclusions
Our study developed a prediction model comprising age, erythrocyte sedimentation rate, infiltration of the upper lobe or dorsal segment of the lung, multifocal polymorphic lesions with multiple densities in the lungs, and pleural thickening to predict pulmonary tuberculosis in adults suspected of having pulmonary tuberculosis. This model serves as a valuable tool to assist clinicians in the decision-making process.
Footnotes
List of abbreviations
Acknowledgements
We thank all patients and their families involved in this study. We would like to thank Mr Quan Zhou and Mrs Xueqing Zhang of the First People's Hospital of Changde City for their help in the revision process.
Ethics approval
This study was approved by the Ethics Committee of the Hunan Provincial People's Hospital (NO.2021-31), Changsha Central Hospital (NO.2022-S0132), and Hunan Chest Hospital (NO.2022-031).
Consent for publication
Not applicable.
Contributorship
ZH, DF, and TL conceived and designed the study. DF and TL drafted the manuscript. DF, TL, JC, MX, XY, and HT collected the data. TL, JC, MX, XY, and HT analyzed the data. XY and HT prepared figures and tables. ZH, AD, and RH edited and revised the manuscript. ZH approved the final version of this manuscript. All authors have read and approved the final manuscript. The study we carried out strictly complies with the Declaration of Helsinki.
Funding
The authors disclosed receipt of the following financial support for the research, authorship, and/or publication of this article: This work was supported by the Changsha Science and Technology Plan Project, Natural Science Foundation of Hunan Province, Innovation Platform Project of Department of Science and Technology of Hunan Province, Key Project of Hunan Provincial Department of Education (grant number No. kq2004112, No. 2022JJ70094, No. 2023Sk4056, No. 20A298).
Informed consent
Due to the nature of the retrospective study and the anonymous processing of data prior to analysis, the Ethics Committee of the Hunan Provincial People's Hospital, Changsha Central Hospital and Hunan Chest Hospital approved the waiver of informed consent.
Declaration of conflicting interests
The authors declared no potential conflicts of interest with respect to the research, authorship, and/or publication of this article.
Availability of data and materials
The datasets used and/or analyzed during the study are available from the corresponding author upon reasonable request.