
Abstract
Objective
Tuberculosis remains a major global health challenge, with delayed diagnosis contributing to increased transmission and disease burden. While microbiological tests are the gold standard for confirming active tuberculosis, many cases lack microbiological evidence, necessitating additional clinical and laboratory data for diagnosis. The complete blood count (CBC), an inexpensive and widely available test, could provide a valuable tool for tuberculosis diagnosis by analyzing disturbances in blood parameters. This study aimed to develop and evaluate a machine learning (ML)-based web application, TubIAgnosis, for diagnosing active tuberculosis using CBC data.
Methods
We conducted a retrospective case-control study using data from 449 tuberculosis patients and 1200 healthy controls in Oran, Algeria, from January 2016 to April 2023. Eight ML algorithms were trained on 18 CBC parameters and demographic data. Model performance was evaluated using balanced accuracy, sensitivity, specificity, positive predictive value, negative predictive value, and area under the receiver operating characteristic curve (AUC).
Results
The best-performing model, Extreme Gradient Boosting (XGB), achieved a balanced accuracy of 83.3%, AUC of 89.4%, sensitivity of 83.3%, and specificity of 83.3% on the testing dataset. Platelet-to-lymphocyte ratio was the most influential parameter in this ML predictive model. The best performing model (XGB) was made available online as a web application called TubIAgnosis, which is available free of charge at https://yh5f0z-ghermi-mohamed.shinyapps.io/TubIAgnosis/.
Conclusions
TubIAgnosis, a ML-based web application utilizing CBC data, demonstrated promising performance for diagnosing active tuberculosis. This accessible and cost-effective tool could complement existing diagnostic methods, particularly in resource-limited settings. Prospective studies are warranted to further validate and refine this approach.
Introduction
In its latest report, the World Health Organization (WHO) estimates that there were 10.6 million incident cases of tuberculosis (TB) and 1.3 million related deaths in 2022. This makes TB the world's deadliest infectious disease. 1 Despite a decline in the TB epidemic since the early 2000s, the progress is insufficient to meet the targets set by the WHO's “End TB” program and the United Nations’ Sustainable Development Goals, which aim to eliminate the epidemic by 2030–2035. 2
Achieving these goals will undoubtedly require improving the quality and timeliness of diagnosis. A significant delay between symptom onset and diagnosis confirmation increases the risk of transmission. Additionally, a substantial gap (3.1 million cases) exists between the reported cases and the estimated number of people with TB, mainly due to limited access to healthcare and diagnostic challenges. 1 While microbiological evidence (microscopy and culture) is the “gold standard” for confirming active TB cases, many cases are negative for these tests, necessitating clinical, radiological, or cytohistological data for diagnosis. This poses a challenge for therapeutic decision-making, particularly in extrapulmonary tuberculosis (EPTB) cases, where pathogen isolation is difficult.3,4 Although new molecular tests have improved diagnostic sensitivity, their use is limited by specimen quality, high costs, and the need for well-equipped laboratories and skilled personnel, which can be challenging in low-income, TB-endemic countries.
Numerous host-associated biological markers are currently being analyzed, including cytokines and chemokines, immune cell expression profiles, and transcriptomic signatures.5–8 However, implementing tests based on these biomarkers will heavily depend on the socio-economic status of the most affected countries and patients. Conversely, the complete blood count (CBC) is an inexpensive and widely available immunohematology test that provides comprehensive information about red blood cells, white blood cells, and platelets. 9
All the data obtained from the CBC could serve as immuno-hematological markers of TB infection. Several authors have described disturbances in blood count parameters in TB patients.10–13 However, these biomarkers are less informative and less specific for TB infection when analyzed individually. Therefore, their combination needs exploration to identify a signature associated with active TB. Artificial intelligence, particularly machine learning (ML) algorithms, is increasingly used to diagnose and predict TB clinical and therapeutic outcomes due to their multidimensional analytical capabilities. These ML algorithms have allowed the construction of statistical models using the increasing amount of clinical, radiological, serological, and especially genomic and/or transcriptomic data.14–17 However, it has not yet been demonstrated whether ML techniques can be applied to CBC data for diagnostic purposes. Therefore, we developed an ML-based web application called TubIAgnosis that utilizes CBC data to aid in the diagnosis of active TB, including pulmonary TB (PTB) and EPTB.
Methods
Study design and population
This retrospective case-control study was conducted in the Wilaya of Oran (North Western Algeria) using data from January 2016 to April 2023. A total of 449 TB patients were enrolled in the Tuberculosis and Respiratory Diseases Control Service of the Es Senia locality (Oran), and 1200 healthy controls (HC) were enrolled in the Occupational Medicine Service of the Oran University Hospital Center as part of their pre-employment check-up.
The diagnosis of active TB cases was made based on the national anti-TB program manual which is inspired by the WHO guidelines. 18 Imaging and microscopy were primarily utilized to confirm PTB cases in addition to the epidemiological and clinical context. For EPTB, imaging, histology (necrotic caseofollicular granuloma), and cytology were employed. All patients included in the study were newly diagnosed with no prior history of TB and had received less than 7 days of antituberculous treatment. The study did not include individuals (HC and TB) under the age of 16 or those with infectious diseases or cancer.
Data collection
The medical records were used to collect sociodemographic, clinical, and CBC data, which was done anonymously by the healthcare team using a web form from the KoboToolbox platform (https://www.kobotoolbox.org). To ensure the anonymity and confidentiality of the participants, all data were fully de-identified. Finally, the dataset was transferred to the authors responsible for statistical analysis.
Statistical analysis
Data preparation and analysis
The following variables were used for statistical analysis and ML model training: age, sex, and 18 blood count parameters, as displayed in Table 1. The normality of variable distribution was statistically examined using the Shapiro-Wilk test and graphically using Q-Q plots. Depending on whether the variables were quantitative or qualitative, results were reported using median and interquartile range (IQR) or as proportions. Accordingly, univariate comparisons were performed using the Mann–Whitney or Chi-square test. A p-value under 0.05 was considered statistically significant.
List of analyzed features for statistical analysis and ML models.

Observations with a missing data proportion greater than 25% were eliminated from the dataset employed for ML. A simple imputation method was used to replace the remaining missing data.
ML design
Due to the imbalance within our dataset, two different approaches were adopted: (1) A sub-dataset was generated by randomly selecting as many controls as patients; (2) Generating synthetic data to increase the minority class (TB) using the SMOTE (Synthetic Minority Oversampling TEchnique) algorithm, which is an oversampling technique that generates synthetic samples for the minority class. 19 The generation of synthetic data was applied only to training data and not to testing data. The flowchart diagram is illustrated in Figure 1, which explains the methodology we followed during this study.

Flow chart depicting the strategies used for the ML model's development.
To build ML models, we trained eight different algorithms using 80% of the dataset, including Logistic Regression (LR), Regularized LR (RLR), Naive Bayes (NB), K-Nearest Neighbors (KNN), Random Forest (RF), Gradient Boosting Machine (GBM), Extreme Gradient Boosting (XGB), and Support Vector Machine (SVM). This training was done by optimizing the hyperparameters through repeated (n = 3) cross-validation (n = 5) using accuracy as a reference metric. The tuned hyperparameters for each model are listed in Table 2. The remaining 20% of the dataset was used to analyze the performance metrics of these models. This was done using confusion matrices between predicted and observed values as well as by performing receiver operating characteristic curve (ROC) analysis. Randomization was controlled to ensure the repeatability of the experiments at all stages of model development. Data were analyzed using RStudio (2023.12.1; R version 4.3.2) software.
Hyperparameters of studied ML models.

The best-performing ML model was deployed as a web application we called TubIAgnosis using shinyapps.io, a platform that facilitates the hosting and sharing of interactive web applications built with R Shiny. This approach enabled users to access the TubIAgnosis application through a web interface, allowing them to input CBC data and obtain diagnostic predictions without the need for local software installation. In addition to providing a prediction (TB or not), the web interface also displays its associated probability.
TRIPOD guideline for Model Development and Validation was followed for reporting this study. 20 All of the participants have given their written informed consent to be included in the study. The study protocol was approved by the scientific committee of the natural and life sciences faculty (University of Oran1, Algeria) in agreement with the World Medical Association Declaration of Helsinki.
Results
Descriptive and statistical analysis
This study enrolled 1200 HCs (men: 55.00%) and 449 TB patients (men: 50.11%) with a median age of 36 (29–44) and 35 years (25–47), respectively. PTB was diagnosed in 42.10% of TB cases. Among them, bilateral localization, positive smear, and cavitation lesions were found in 43.5%, 90.3%, and 57.1%, respectively. The remaining patients were diagnosed with EPTB (51.23%) or EPTB + PTB (6.67%). The three most frequent EPTB localizations were lymph nodes (51.9%), pleural (17.3%), and multi-visceral (8.1%).
For the 19 quantitative variables that were used for statistical analysis and ML model training, none followed a normal distribution. Detailed analysis of descriptive statistics and distribution of these variables are available in Figure S1, Tables S1 and S2.
When comparing TB and HC, we found that all parameters except age, sex, and MPV were significantly different. TB patients were characterized by a significantly lower value of LY, LY_prct, RBC, HB, HT, MCV, MCH, and MCHC. In contrast, they have a higher value of WBC, MONO, MONO_prct, MLR, GRANULO, GRANULO_prct, GLR, PLT, and PLR (Table 3). Boxplots depicting the distribution of these parameters among the compared groups are available in Figure S2.
Univariate comparison between TB patients and healthy controls.

n (%), Median (IQR).
Pearson's Chi-squared test, Mann–Whitney U-test.
ML models
The frequency of missing data in our dataset ranged from 0% to 3.82% except for MPV (17.95%). In addition, all variables did not have a normal distribution. Then, a simple imputation was used to replace missing data with the median of the corresponding group (TB or HC).
Balanced dataset
The balanced dataset comprised an equal number of TB cases and HCs (449 each) by randomly under-sampling the majority class. The performance metrics of the eight ML models trained on this dataset are summarized in Table 4. Among the evaluated models, the XGB, GBM, and SVM with a polynomial kernel exhibited the best overall performance.
Performances of the ML models (balanced dataset).
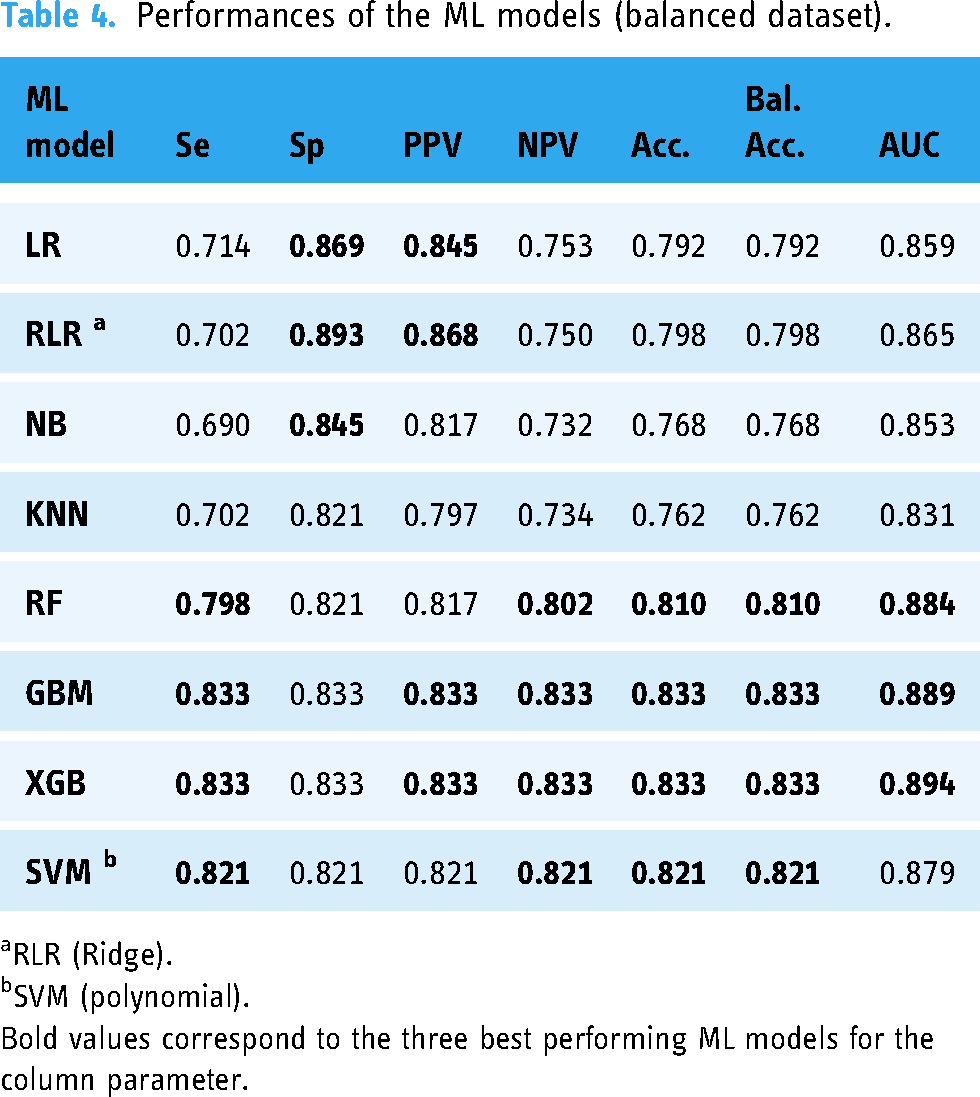
RLR (Ridge).
SVM (polynomial).
Bold values correspond to the three best performing ML models for the column parameter.
Both GBM and XGB models achieved a balanced accuracy of 83.3% and the highest area under the receiver operating characteristic curves (AUCs; 88.9% and 89.4%, respectively), indicating an excellent ability to discriminate TB cases from HCs. They also attained a sensitivity, specificity, PPV, and NPV of 83.3%, suggesting a well-balanced performance in correctly identifying true positives and true negatives.
The SVM model also demonstrated notable balanced performance, with a slightly lower balanced accuracy, sensitivity, specificity, PPV, NPV (82.1%), and AUC (87.9%).
SMOTE dataset
To handle the class imbalance while utilizing the entire dataset, we applied the SMOTE algorithm to generate synthetic samples for the minority class (TB cases). The performance metrics of the models trained on this SMOTE dataset are presented in Table 5.
Performances of the ML models (SMOTE dataset).

RLR (Ridge).
SVM (polynomial).
Bold values correspond to the three best performing ML models for the column parameter.
Again, the XGB
Best performing models
The XGB model trained on the balanced dataset exhibited superior performance across most metrics, with higher balanced accuracy (83.3% vs 82.4%), sensitivity (83.3% vs 77.2%), and PPV (83.3% vs 71.7%) when compared to the SMOTE-based GBM model. However, the SMOTE-based XGB model achieved a slightly higher AUC (90.6% vs 89.4%), specificity (87.7% vs 83.3%), and NPV (90.5% vs 83.3%) (Figure 2). The ROC curves for these two models are shown in Figure 3. The hyperparameters associated with each of these two best performing models are shown in Figure S3 and Figure S4. As the balanced dataset-based XGB model was more performant for detecting TB cases, it was used for deploying a web application named TubIAgnosis which is accessible on this link (https://yh5f0z-ghermi-mohamed.shinyapps.io/TubIAgnosis/).
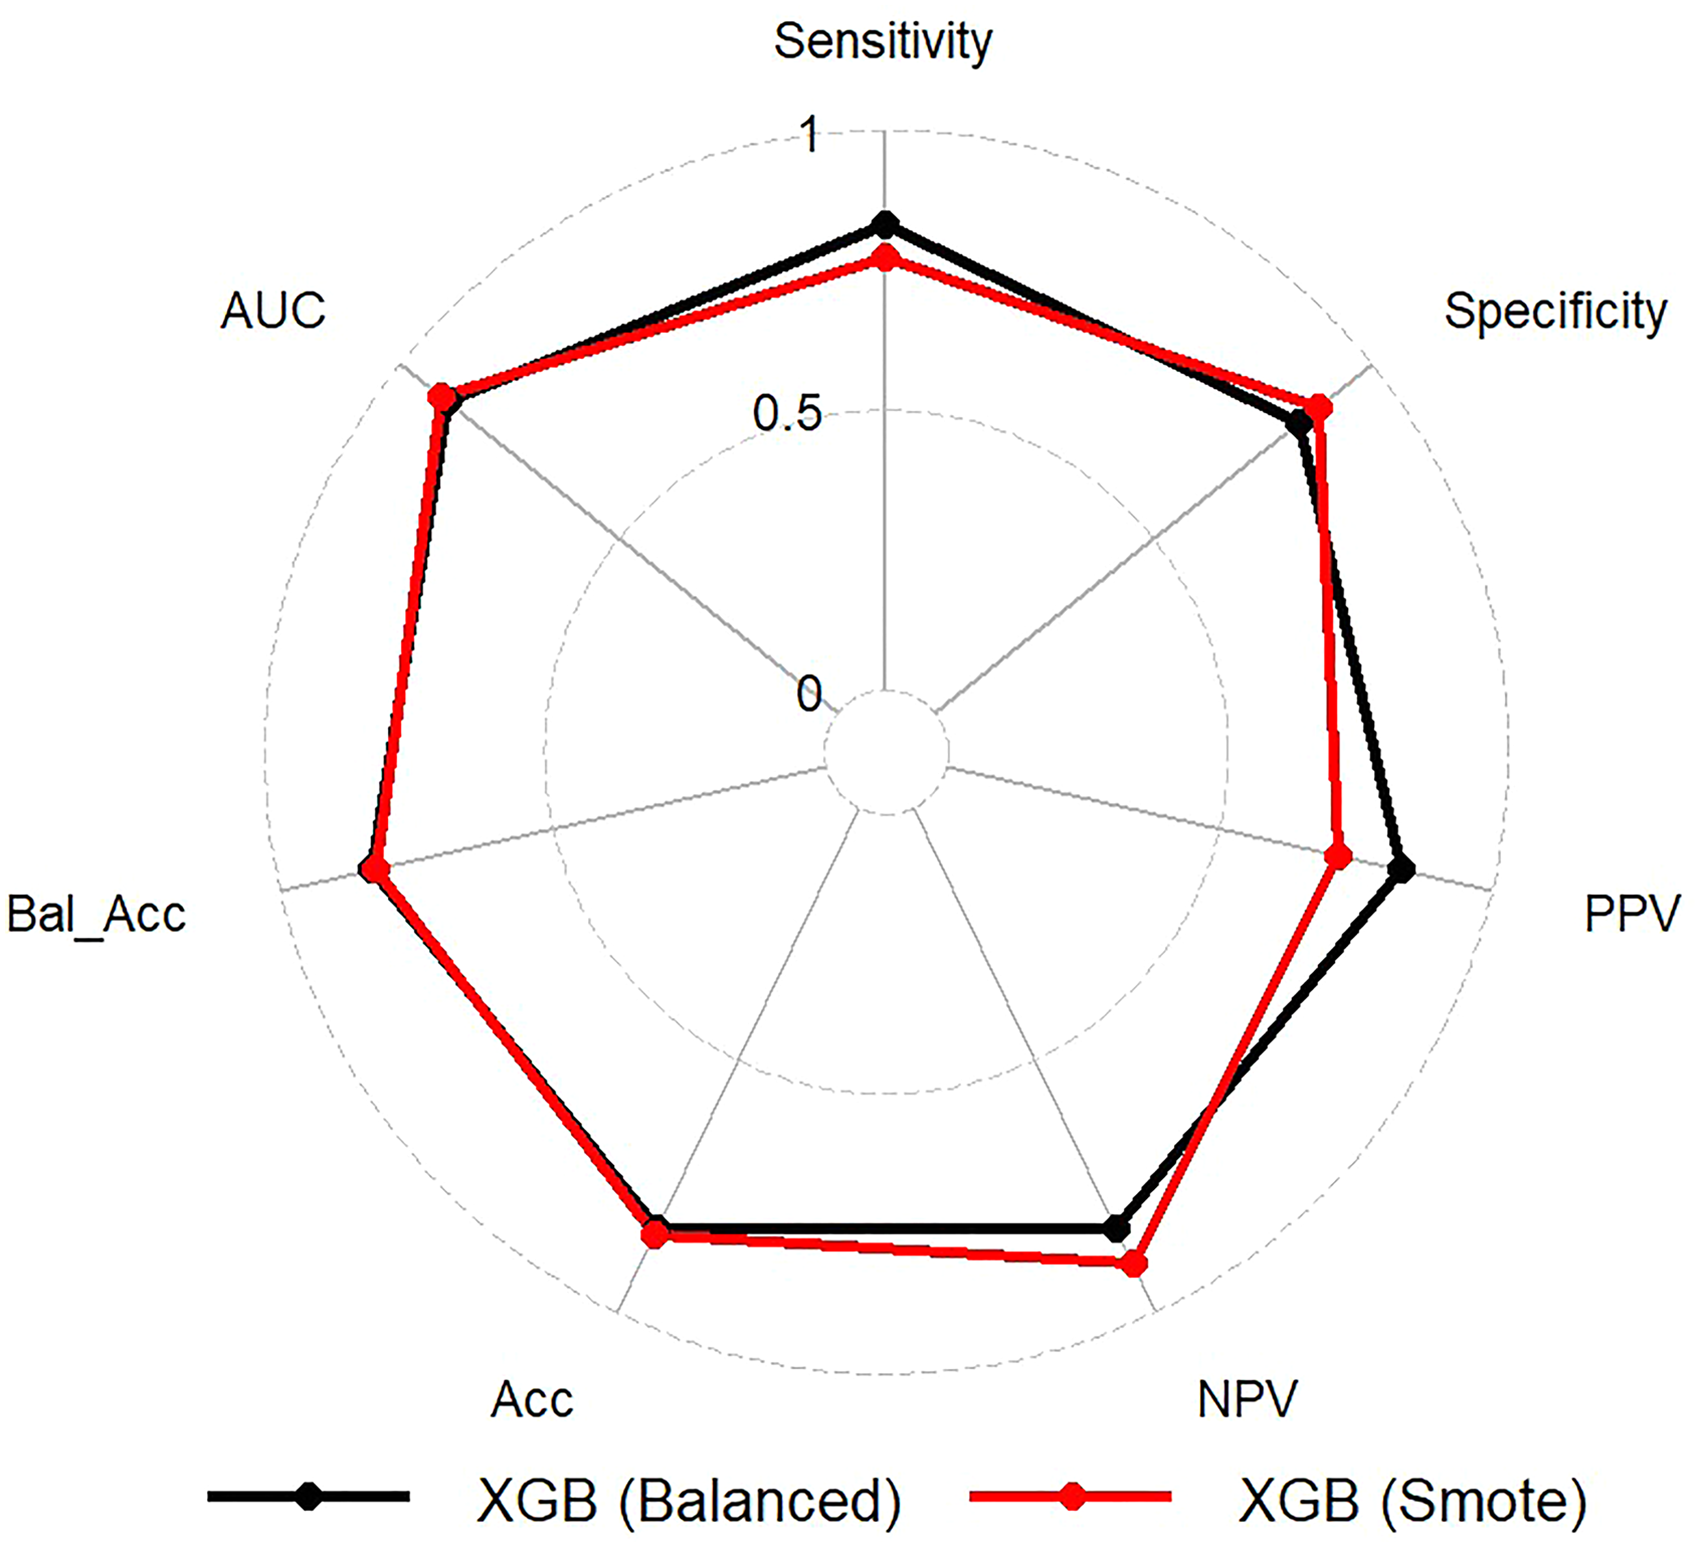
Radar chart comparing metrics of XGB models trained on balanced and SMOTE dataset.

ROC curves of XGB models trained on balanced and SMOTE dataset.
The top 10 most important features of the XGB models trained on the balanced and SMOTE datasets are illustrated in Figure 4. Notably, platelet-to-lymphocyte ratio (PLR) emerged as the most influential feature in distinguishing TB cases from HCs across both models. PLR marginal effect on the model when “integrating” out the other variables is illustrated by its partial dependence plot (PDP) (Figure 5). While both models capture the general positive relationship between PLR and TB diagnosis, the balanced dataset approach provided a smoother and more consistent interpretation of the PLR feature. In both cases, a PLR value of around 250–300 would serve as a reasonable cut-off point for both models.
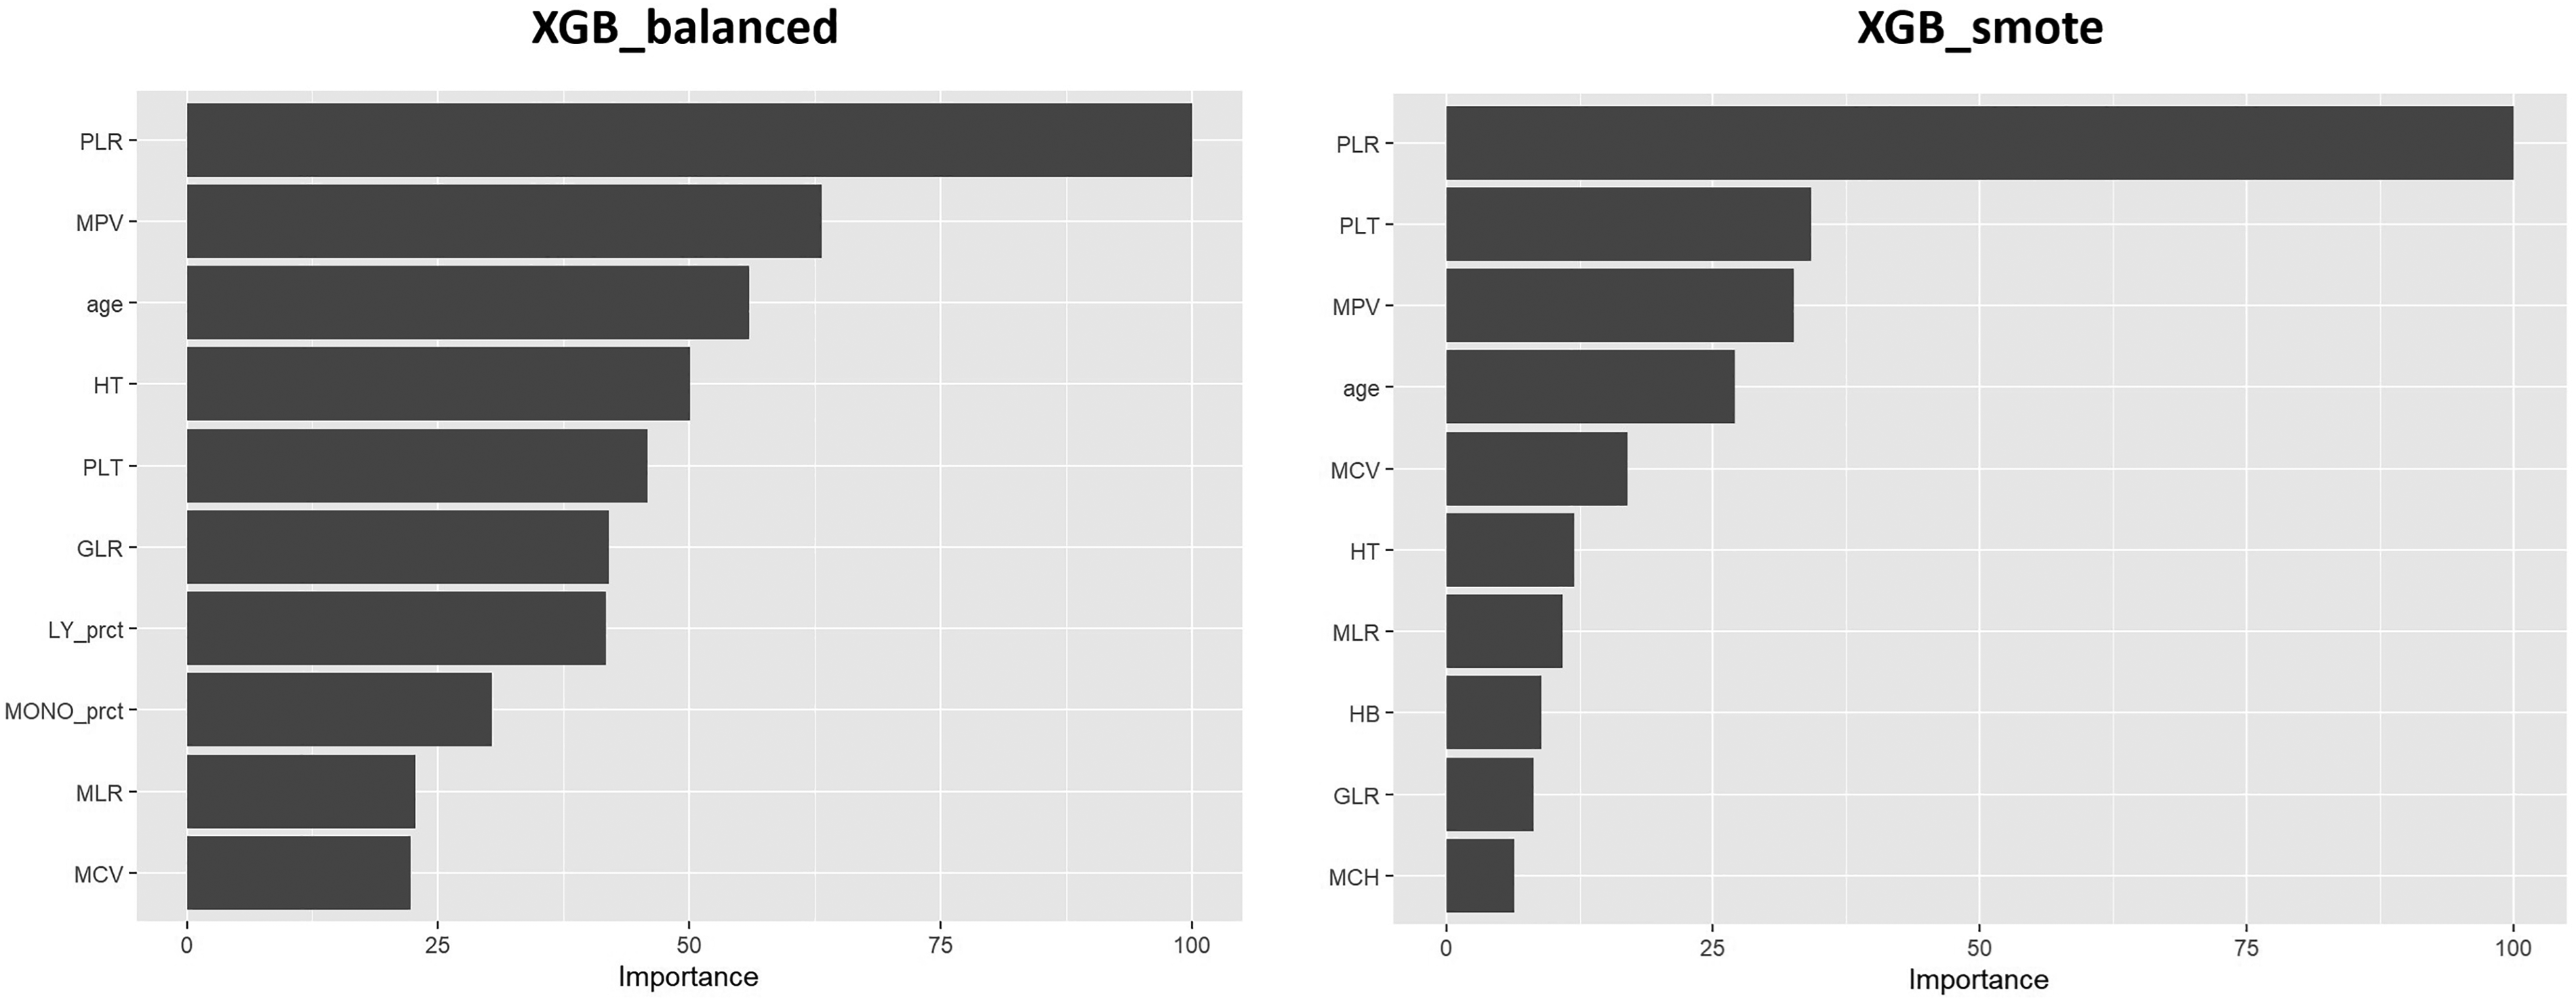
Top10 feature importance for XGB models trained on balanced and SMOTE dataset.

Partial dependence plots for PLR (XGB models).
Discussion
Given the persistently high global burden of TB, the integration of artificial intelligence (AI) into diagnostic workflows may have the potential to enhance patient outcomes and contribute to the ultimate goal of TB elimination, as set by the WHO EndTB program. 1 Computer-aided detection (CAD) is nowadays the most widely used application of AI algorithms for TB diagnosis. It is based on analyzing medical imaging data, such as chest X-rays and computed tomography (CT) scans, to identify abnormalities.21–24 WHO issued a recommendation that CAD may be used in place of a human reader for interpreting digital chest radiography in both screening and triage for TB disease in adults aged 15 years or more. Five CE-certified CAD programs are available for the detection of TB (CAD4TB, InferRead®DR, DR AI-assisted PTB diagnosis, Lunit INSIGHT CXR, and qXR).25,26 However, there are implementation challenges, such as the need for users to select threshold scores and the lack of resources and data at some sites. 27 Furthermore, AI tools are primarily used for diagnosing PTB, while it is worth noting that more than half of all TB cases are extrapulmonary (EPTB) forms, which are the most challenging to diagnose. 1 Because of its insidious clinical presentation, pauci-bacillary nature, and limited laboratory facilities in resource-limited settings, EPTB is often delayed or missed. 28 Therefore, AI tools that are easier to implement and target broader forms of the disease would have a greater impact on improving performance and early diagnosis.
CBC is a routinely performed, minimally invasive, and cost-effective diagnostic test that provides valuable information about the patient's overall health status, including the presence of infection or inflammation.12,13,29 Then, integration of CBC data into AI-based diagnostic models may offer a promising approach to improve early detection, facilitate timely treatment initiation, and contribute to global efforts in TB control and elimination.
Other respiratory diseases, such as COVID-19, have been extensively studied for the development of CBC-based AI models with very interesting performances.30–33 To our knowledge, no validated AI model based on routine blood parameters has been developed to diagnose active TB, both pulmonary and extrapulmonary forms.
In this study, we developed TubIAgnosis, a ML-based web application that utilizes routine CBC data to aid in the diagnosis of active TB, including pulmonary and extrapulmonary forms. For this purpose, two distinct techniques were employed (SMOTE and balanced dataset generation) to address the class imbalance present in our TB diagnosis dataset.
Among all eight ML models we evaluated, the XGB model exhibited the best overall performances in both scenarios (balanced dataset and SMOTE dataset) with high accuracies (83.3% and 82.4%, respectively) and AUCs (89.4% and 90.6%, respectively). Compared to the SMOTE model, the balanced data approach, achieved by under-representing the majority class of HCs, resulted in a substantial improvement in model sensitivity (+6.1%) and positive predictive value (+11.6%) for TB case detection. The improvement in the model can be attributed to the reduced influence of redundant or noisy samples from the majority class. This allows the model to learn better the patterns associated with the minority class, which in this case are TB cases. By retaining the original samples without introducing synthetic data, the true class distributions and decision boundaries were likely preserved. This facilitated more accurate identification of TB cases.34,35
Conversely, the SMOTE-based oversampling technique, which generated synthetic samples of the minority class (TB cases), demonstrated a slight advantage in specificity (+4.4%) and negative predictive value (+7.2%) for identifying healthy individuals. It is important to note that oversampling techniques like SMOTE can potentially introduce synthetic samples that do not accurately represent the underlying distribution of the minority class, especially in high-dimensional or complex data spaces.36,37 Additionally, excessive oversampling may increase the risk of overfitting, as the model may learn to memorize the synthetic samples instead of capturing the true decision boundaries. 38 These factors could have contributed to the relatively modest performance gains observed with the SMOTE-based model in our study. While both techniques aimed to address class imbalance, the balanced dataset approach (using under sampling method) appeared to be more effective in improving the overall performance for TB diagnosis in our specific dataset.
While ML models have demonstrated remarkable performance in disease diagnosis tasks, the issue of interpretability remains a significant challenge. Interpretability refers to the ability to understand and explain the decision-making process of these complex models, which is crucial for establishing trust and accountability in their clinical applications.39,40
XGB models are powerful ensemble learning techniques that have gained widespread popularity in various applications, including disease diagnosis. While these models are known for their impressive predictive performance, they are often criticized for their lack of inherent interpretability. XGB are considered “black-box” models because they consist of an ensemble of weak decision tree models, where each subsequent tree is trained to correct the errors of the previous trees. This iterative process results in a highly complex model that can capture intricate patterns and nonlinearities in the data, but at the cost of interpretability. 41
Several techniques have been proposed to improve the interpretability of XGB models: Feature Importance indicating the relative contribution of each feature to the model's predictions and PDPs which are graphical representations that illustrate the marginal effect of one or more features on the model's predictions while accounting for the average effects of the other features.40–42 Using these two techniques, the PLR emerged as the most influential feature in both best-performing XGB models. The PDP for the balanced dataset exhibited a smoother, monotonically increasing curve, suggesting a stable and consistent interpretation of the positive relationship between higher PLR values and increased probability of TB diagnosis. In contrast, the PDP for the SMOTE dataset displayed fluctuations, particularly in the lower range of PLR values, potentially indicating instability or inconsistency in the model's interpretation of low PLR levels concerning TB diagnosis. These fluctuations could be attributed to the presence of synthetic samples generated by the oversampling technique, which may not accurately represent the underlying distribution of the minority class.
The PLR contribution to the most performing models is consistent with previous studies reporting alterations in these parameters among TB patients, reflecting the immune system's response to Mycobacterium tuberculosis infection. PLR was higher in our TB patients than in controls (p < 0.001). Very few studies have analyzed this parameter under the spectrum of TB. Chen et al. demonstrated that a PLR threshold of 216.8 identified TB patients among those with chronic obstructive pulmonary disease (Sensitivity = 92.4%; Specificity = 84.5%; AUC = 0.87). 43
Stefanescu et al. found that this parameter decreased after the intensive phase of treatment, indicating that it is associated with bacterial load. The same authors developed a binary logistic regression model to predict culture negativity at two months of treatment, which included this parameter. 44 This ratio is not only associated with active TB but also with its severity. Indeed, Nakao et al. found that a PLR > 200 was associated with cavitary forms of PTB. 11 These PLR values align with the cut-off point for our both XGB models, which is approximately 200–250 as estimated from PDPs.
These higher PLR values reflect both thrombocytosis and lymphopenia in TB patients. This has also been reported by numerous authors.44–47 Kassa et al. found a decrease in platelet count and an increase in lymphocyte count after the intensive phase of anti-TB treatment. 48 This thrombocytosis may be linked to an increase in interleukin-6, known to promote megakaryocytopoiesis during the acute phase of infection.49,50
Lymphopenia, especially of CD4+ LT, has been associated with active TB,51–54 greater severity,11,55 a higher risk of therapeutic failure, 56 and increased mortality. 57 These lymphocytes play a crucial role in coordinating the various anti-TB defenses that culminate in the formation of a granuloma to contain the initial infectious focus. 58
The ability of ML algorithms to capture these complex relationships and patterns highlights their potential for improving TB diagnosis. These findings suggest that the combination of CBC parameters when analyzed using advanced ML techniques, may effectively differentiate between TB cases and healthy individuals.
The balanced dataset-based XGB model was more performant for detecting TB cases; it was used for deploying the web application TubIAgnosis. It has been developed to make it more accessible and user-friendly for healthcare professionals. The application has a simple and intuitive interface that allows users to input their CBC data easily by using sliders, which helps to avoid errors caused by manual data input. TubIAgnosis provides diagnostic predictions without requiring any local software installation or specialized computational resources, making it a convenient tool for healthcare professionals. This approach facilitates its integration into clinical workflows, potentially improving the timeliness and accuracy of TB diagnosis, particularly in resource-limited settings. 59
While our study demonstrates the potential of ML models for TB diagnosis using CBC data, certain limitations warrant consideration. Firstly, the heterogeneity in the forms of TB (pulmonary vs extrapulmonary) and the severity of the included patient profiles may have influenced the model's performance. Additionally, the possibility of latent TB infection among the control group could have affected the discriminative ability of the models. Furthermore, the absence of a control group with other infectious pathologies limits the specificity evaluation of the models in differentiating TB from other conditions with similar hematological manifestations. Also, the heterogeneity in the automated hematology analyzers used during the creation of the full blood count data could have introduced variability in the feature values, impacting the model's generalizability.
Finally, a notable methodological limitation of the present study is the absence of an a priori sample size estimation based on anticipated effect sizes, desired precision, and statistical power. This oversight is compounded by the inherent complexities involved in sample size calculations for multivariable ML models, which necessitate intricate considerations such as the number of predictors, their anticipated effect magnitudes, and the type of employed algorithm. Furthermore, the dearth of preceding comparable investigations precluded the ability to inform assumptions underpinning such calculations. Future studies should address these limitations by including more diverse and well-characterized patient cohorts, as well as considering additional control groups to asses confounding factors such as HIV status, diabetes, immunosuppressive therapies, or age-related differences (geriatric and pediatric populations). These comorbidities and conditions can influence the immune response, disease manifestation, and laboratory parameters, potentially affecting the performance and generalizability of our predictive model.
Conclusion
To conclude, it is important to note that while TubIAgnosis demonstrated promising diagnostic performance, it should be considered a supportive tool to aid clinicians in decision-making rather than a standalone diagnostic method. Microbiological confirmation remains the gold standard for TB diagnosis, and TubIAgnosis should be used in conjunction with other clinical, radiological, and laboratory findings. The application can also indicate the probability associated with the prediction obtained. This would enable the clinician to decide whether or not to include the prediction obtained as an argument in making a final decision. Furthermore, the performance of this model could be further improved by incorporating other clinical, radiological, and biological data. Finally, further validation on larger and more diverse patient populations is warranted to assess the generalizability and robustness of the developed models.
Supplemental Material
sj-docx-1-dhj-10.1177_20552076241278211 - Supplemental material for TubIAgnosis: A machine learning-based web application for active tuberculosis diagnosis using complete blood count data
Supplemental material, sj-docx-1-dhj-10.1177_20552076241278211 for TubIAgnosis: A machine learning-based web application for active tuberculosis diagnosis using complete blood count data by Mohamed Ghermi, Meriam Messedi, Chahira Adida, Kada Belarbi, Mohamed El Amine Djazouli, Zahia Ibtissem Berrazeg, Maryam Kallel Sellami, Younes Ghezini and Mahdi Louati in DIGITAL HEALTH
Footnotes
Acknowledgments
We would like to express our sincere gratitude to all the participants, including the tuberculosis patients and healthy controls, for their voluntary participation in this study. The research was made possible thanks to the cooperation and willingness of the participants for providing their medical data. Additionally, we extend our thanks to the healthcare professionals at the Tuberculosis and Respiratory Diseases Control Service of Es Senia (especially to Dr N. Ghoumari, Dr N. Mened, Mrs. F. Saïchi and Mrs. S. Bossi) and the Occupational Medicine Service of the Oran University Hospital Center for their invaluable contributions to this study.
Contributorship
MG, MM, and ML contributed to the experimental design of the study. CA, KB, and ZIB were responsible for data collection, curation, and analysis. MG trained, tested, and deployed the machine learning application and wrote the manuscript. MM and ML reviewed the data analysis and application development. The manuscript was reviewed and edited by MKS, MD, and YG, and its final version was approved by them.
Declaration of conflicting interests
The authors declared no potential conflicts of interest with respect to the research, authorship, and/or publication of this article.
Ethical approval
All participants provided written informed consent prior to being included in the study. Additionally, the study protocol was approved by the scientific committee of the Faculty of Natural and Life Sciences at the University of Oran1, Algeria, in accordance with the World Medical Association Declaration of Helsinki.
Funding
The authors received no financial support for the research, authorship, and/or publication of this article.
Guarantor
MG
Supplemental material
Supplemental material for this article is available online.
References
Supplementary Material
Please find the following supplemental material available below.
For Open Access articles published under a Creative Commons License, all supplemental material carries the same license as the article it is associated with.
For non-Open Access articles published, all supplemental material carries a non-exclusive license, and permission requests for re-use of supplemental material or any part of supplemental material shall be sent directly to the copyright owner as specified in the copyright notice associated with the article.