
Abstract
Objective
The thyroid gland plays a vital role in human body functions, including metabolism, and any dysfunction of the organ may exacerbate health risks. Early recovery from these conditions depends on the accurate diagnosis of accurate type of thyroid gland disorder. This study aims to develop an automated system for assisting physicians in clinical diagnosis of thyroid gland disorders.
Method
The transfer learning capability of the deep neural network model DenseNet-201 was leveraged, and the model was tailored by altering its fully connected layer and the classification layer for the classification of thyroid gland conditions into seven categories, namely cold nodule, hot nodule, multi-nodular goiter, nodular goiter, thyroiditis, toxic diffuse goiter and normal.
Results
The class-wise and overall performance of the method was evaluated by computing quantitative metrics like accuracy, specificity, precision, sensitivity, F1-score, and area under the curve (AUC). The degree of similarity between the true labels of thyroid disorders annotated by experts and those predicted by the method was gauged using the kappa coefficient. For the five-fold cross-validated experimental results, we obtained an accuracy of 91.48 ± 2.79%, specificity of 98.58 ± 0.47%, precision of 91.57 ± 2.76%, sensitivity of 91.48 ± 2.77%, F1-score of 91.38 ± 2.82%, and AUC of 0.988 ± 0.006. Additionally, the degree of similarity in the diagnostic capability of the proposed method and medical experts was measured by computing the kappa coefficient as 0.9148.
Conclusion
The experimental results of the proposed method were compared with contemporary methods and illustrate relatively better performance in terms of accuracy, sensitivity, precision, and F1-score. The value of the kappa coefficient, 0.9148, also depicts that the proposed method has the potential for applicability in clinical diagnosis to assist physicians in assessing the accurate type of thyroid disorders.
Introduction
The thyroid gland is an endocrine organ and is responsible for many functions of the human body in regulating the body's metabolism by producing hormones that influence essential functions, including heart rate, blood pressure, body temperature, and weight management. 1 Any dysfunction in the thyroid gland can lead to hormonal imbalance and can cause life-threatening risks if left unattended. Thyroid nodules have been detected in up to 65% of the general population, with most of the nodules being benign and approximately 10% malignant. 2 The most common types of thyroid gland disorders include cold nodule, hot nodule, multi-nodular goiter, nodular goiter, thyroiditis, and toxic diffuse goiter. These conditions vary in their severity levels, with nodular goiter being the least severe, multi-nodular goiter classified as low-medium, and hot nodule and thyroiditis as medium, and toxic diffuse goiter and cold nodule as more severe. Based on their severity levels, the thyroid disorders are treated differently. Early recovery from these conditions depends on the accurate diagnosis of accurate type of thyroid gland disorder. 3
Medical healthcare monitoring, 4 and radiology imaging modalities such as computed tomography (CT), sonography, and magnetic resonance imaging5–7 can play an important role in the diagnosis of thyroid disease but fail to offer a physiological study of the organ.8,9 A nuclear medicine scan using technetium pertechnetate (Tc-99m) is superior for the assessment of the physiology and function of the organ.10–12 For hyper-spectral image classification based on group former and group attention is also applied suitable technique in medical imaging 13 and also for thyroid disorders. To achieve an accurate diagnosis, a combination of diagnostic methodologies is deployed. These include comprehensive clinical assessments, 14 high-resolution ultrasound imaging 15 to evaluate the size, structure, and composition of the nodule, and the quantification of serum thyrotropin (TSH) levels to assess thyroid function. Additionally, in cases where malignancy is suspected, a fine-needle aspiration biopsy (FNAB) is often performed to obtain cellular samples for cytological analysis, enabling a more definitive diagnosis.16–18 These diagnostic tools collectively aid in distinguishing benign from malignant thyroid nodules, thereby guiding appropriate clinical management and treatment strategies. Despite the widespread use of conventional diagnostic methods, they often exhibit limitations in accurately distinguishing between malignant and benign thyroid nodules. 19 This diagnostic ambiguity can sometimes lead to inappropriate clinical decisions, resulting in either overtreatment, where unnecessary procedures or interventions are performed, or under treatment, where a malignant condition is not adequately addressed.
Such inefficiencies highlight the need for more precise and reliable diagnostic techniques to improve patient outcomes and optimize treatment strategies.20,21 Contrary to that [AQ6], thyroid scintigraphy, which utilizes a radiopharmaceutical agent labeled with a radioactive isotope, us used to identify and evaluate morphological dysfunctions within the thyroid gland. But this technique also has its limitations, including lower image resolution and time-consuming manual analysis by nuclear physicians, which can cause human error. It is also to mention that the inter- and intra-observer variability can be a major cause of subjective image interpretation, which leads to different treatment decisions. The availability of nuclear medicine physicians is also limited in many regions, which causes an overburden on the available experts. This excessive workload may induce fatigue in experts and result in improper diagnosis from low-resolution images.22,23
The specific contributions of this study are as follows:
This research work depicts the first detailed classification of seven thyroid disorders, namely, cold nodule, hot nodule (HN), multi-nodular goiter (MNG), nodular goiter, thyroiditis, toxic diffuse goiter, and normal, which had not been considerably investigated in prior research. The proposed modified DenseNet-201 convolutional neural network (CNN) model effectively improved feature extraction and classification from low-resolution scintigraphy images. We have used a real-world dataset of 1599 thyroid scintigraphy scans collected over 10 years from BINOR Cancer Hospital, providing moderate diversity in data and high relevance. The focus of this study is only on thyroid scintigraphy data instead of high-resolution anatomical data from other diagnostic modalities. It is aligned with real-world nuclear medicine workflows used in nuclear medicine departments. The rest of the paper is organized as follows:
The second section provides a brief overview and comparison of the available literature in relation to the classification of thyroid glands disorder with machine learning and deep neural networks (DNNs) applied to scintigraphy scans. In the third section, materials and methods that were used in this study are described along with the data acquisition procedure followed and architecture of the proposed classification model. The experimental results are presented in the fourth section based on the evaluation of the model and analysis of its performance. Lastly, the findings of this research are discussed in the fifth section, which indicates the strengths and limitations of the proposed approach in contrast to the current methodologies available.
Literature review
In recent years, artificial intelligence (AI) has emerged as a transformative force and is applied in the hot research domains such as cybersecurity, industrial Internet of things, 24 and medical diagnostics, particularly in the detection and management of complex diseases. Among AI-driven approaches, deep learning (DL) has garnered significant attention due to its capacity to process vast amounts of medical data with remarkable accuracy. 25 Specifically, CNNs have shown exceptional promise in enhancing the diagnostic precision of thyroid nodule evaluation. 26 By analyzing extensive datasets of medical images, CNNs can identify intricate patterns and features that may be imperceptible to the human eye, thereby improving early detection and reducing diagnostic errors. As AI technologies continue to evolve, their integration into clinical practice is expected to revolutionize thyroid disease diagnosis, leading to more accurate assessments and personalized treatment approaches. 27
In their retrospective study, Currie and Iqbal 28 compared the scintigraphy and biochemical status for hyperthyroidism using artificial neural network (ANN) and CNN models. Their ANN and CNN models performed well and obtained accuracies of 84.6% for their ANN model and 80.5% accuracy for their CNN model, highlighting the added value of AI in secondary evaluations. Medhus et al. 29 aimed to explore the potential of CNNs to detect the hyper-functioning lesions of thyroid scintigraphs. Their comparison showed that there was no statistically significant disparity in accuracy seen between the AI system and proficient nuclear medicine consultants in the diagnosis of hypo-functional lesions in the thyroid. He et al. 30 used an AI system to evaluate thyroid nodules. The findings of this research indicate that the diagnosis performance of junior radiologists who were assisted by AI has improved the sensitivity to 86.8% and the area under the curve (AUC) to 0.816, a level of senior radiologists’ AUC of 0.816. While the AI alone has an AUC of 0.816, which proves that AI can assist less experienced specialists.
In addition, a CNN model ThyNet was developed by Peng et al., 31 which was trained on more than 18,000 thyroid images and outperformed the junior and senior radiologists with a sensitivity of 94.9% and an AUC of 0.944. Additionally, the performance of their model was better than the existing compared models, where they reduced unnecessary biopsies from 61.9% to 35.2% to diagnose malignancies. The studies on thyroid nodule malignancy diagnosis using non-invasive methods based on CNN and DL methods are presented. Song et al. 32 trained an Inception-v3 network to diagnose thyroid nodules to reduce FNAB. Their model showed comparable results with specialists in diagnosing malignant from benign thyroid nodules. Kim et al. 33 also reported that support vector machine (SVM) and CNN performed better in terms of sensitivity, while they did not perform well in terms of accuracy and specificity for thyroid nodules diagnosis. Similarly, Wei et al. 34 developed a precise localization method based on an ensemble of DL classification models for thyroid nodules (EDLC-TN). The inter-comparisons of the CNN models have also been carried out by many researchers.
Park et al. 35 reported that CNNs performed better than SVM in differentiating malignant and benign thyroid nodules. They also shared that the CNN model's diagnosis performance was better than young specialists and was nearly equivalent to experienced specialists. While Nguyen et al. 36 and Thomas and Haertling 37 combined handcrafted methods with CNNs to enhance the differentiating ability of CNNs and achieved an accuracy of 92%. These enhanced AI systems also outperformed specialists with 6 to 10 years’ experience. Thomas and Haertling 37 also proposed their model AIBx, which outperformed CNNs in sensitivity of 87.8% and accuracy of 81.5%.
Yang et al. 38 used CNNs to classify thyroid scintigraphy scans into four uptake patterns and indicated a performance accuracy of more than 90%. Qiao et al. 39 developed CNN models to differentiate Graves' disease and sub-acute thyroiditis. Similarly, Ma et al. 40 reported that their CNN model can efficiently differentiate between hyperthyroidism, hypothyroidism, methylene inflammation, and Hashimoto's disease. Hajianfar et al. 18 reported that different augmentation techniques affect the training of CNNs and later on the results of the performance of the model. They used four classifications of thyroid scintigraphy scans.
Our research focuses on utilizing a modified DenseNet-201 model, a DL architecture that has gained widespread recognition for its superior performance in image classification tasks. The DenseNet-201 model is characterized by its densely connected layers, which facilitate efficient feature reuse through dense blocks, making it particularly well-suited for the precise evaluation of medical imaging data, including the assessment of thyroid nodules. By leveraging this advanced model, we aim to enhance the accuracy and reliability of thyroid disease diagnosis, ultimately contributing to improved patient outcomes. DL techniques, particularly CNNs and the modified DenseNet-201 model, represent a significant breakthrough in the detection and management of thyroid disorders.
Materials and methods
This section describes data requisition, preparation of the dataset, and labeling, along with a performance evaluation matrix used for the analysis of the proposed DNN model.
Dataset
The dataset used in this research was acquired from BINOR Cancer Hospital, Bannu, Pakistan, after getting ethical approval from the Institutional Ethical Committee. For inclusion in the research, subjects were assessed by medical experts based on their clinical history, biochemical tests like thyroid function test (e.g. TSH, T3, and T4), and sonography (if required).
Thyroid scintigraphs of the patients were obtained using a GE Infinia Dual Head gamma camera at the Nuclear Medicine Department of Bannu Institute of Nuclear Medicine, Oncology and Radiotherapy (BINOR). All the scans were obtained according to the standard protocol, where a patient was injected with 3–5 mCi of eluted technetium-99m (Tc-99m) intravenously 30 min prior to the scan. The scanning protocol was defined to collect a radiation count of 300–500k to construct an image of size 128 × 128 pixels, which can be imported in Digital Imaging and Communications in Medicine (DICOM) format. The study cohort comprises 1546 thyroid scintigraphs from 2013 to 2023. The demographic distribution of patients is shown in Table 1.
Demographic distribution of the patients.

MNG: multi-nodular goiter.
The images were clinically classified into cold nodule, hot nodule, MNG, nodular goiter, thyroiditis, toxic diffuse goiter, and normal. The image classification was performed by two experienced nuclear medicine physicians with more than 5 years of experience at BINOR.
Architecture of the proposed model
Various convolutional neural models with different architectures have been deployed for diagnosis purposes in the medical domain. In this research study, DenseNet-201 41 has been selected and modified to cope with the requirements of clinical application (classification of thyroid gland disorders). In fact, the transfer learning capability of pre-trained DenseNet-201 was leveraged, and the model was fine-tuned. In this process, the fully connected layer and last classification layer were modified to make the model able to classify the thyroid gland disorders into their respective seven categories. The design of the DenseNet-201 architecture is vastly superior in terms of information flow, promotes reuse of features, and mitigates the vanishing gradient issue during learning. A significant attribute of DenseNet-201 design is the rate of growth that defines the number of new feature maps that each layer adds. This allows the model to remain parameter-efficient at great depth. Fine-tuned pre-trained model of DenseNet-201 can produce promising results on small datasets as well. At the beginning of the network, there is a sequence of layers including an input layer, a convolutional layer, batch normalization, ReLU (rectified linear unit), and a pooling layer, as shown in Figure 1. After this sequence of layers, the architecture is further sub-divided into four dense blocks. Each dense block is composed of a number of layers, such as batch normalization, ReLU, 1 × 1 convolution, and a 3 × 3 convolution. In particular, DenseNet-201 consists of four dense blocks with 6, 12, 48, and 32 dense layers, respectively. Transition layers are placed among these dense blocks in order to decrease the spatial dimension and number of feature maps, which can help in regulating the complexity of the model. Each transition layer consists of several other layers involving batch normalization, ReLU, convolutional, and average pooling, as shown in Figure 1. Following the last dense block, the model contains a global average pooling layer, which compresses each feature map into a single value. The fully connected layer associates feature vectors with raw class scores. The SoftMax layer computes class probabilities, and finally, the classification layer selects the class label based on the maximum probability score.

Flow diagram of the proposed model.
DenseNet-201 layers inter-connectivity
In DenseNet-201, output of the current layer Xl depends on all previous layers. This relationship can be mathematically expressed as follows:
Transition layer operations
The transition layer basically performs several operations in a particular order as shown in Figure 2. The transition layers reduce the size of feature maps to control model complexity and improve efficiency. The sequence of steps can be mathematically represented as:
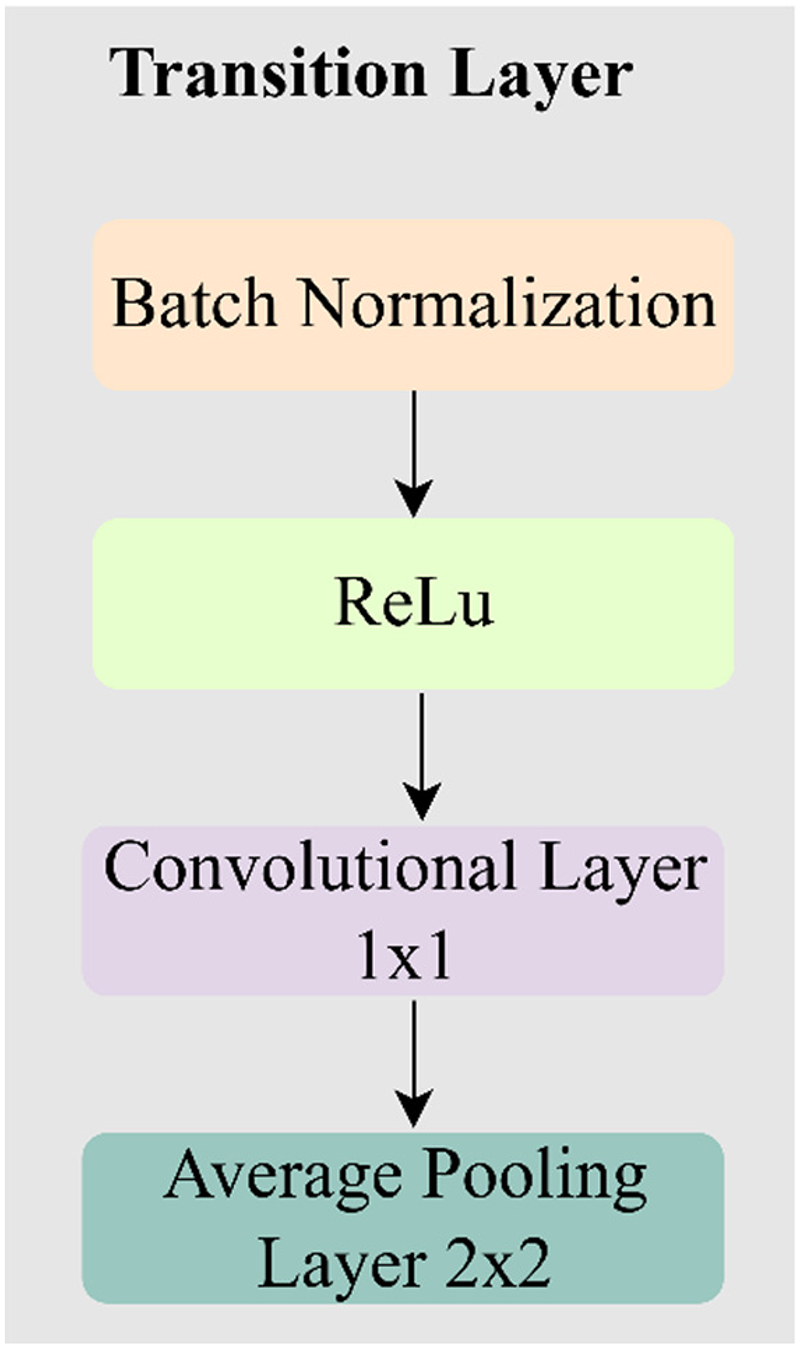
Composition of the transition layer.
Batch normalization
It is used for normalizing features and obtaining steady training. For an input tensor Xin at any layer, then the batch normalization will be expressed as: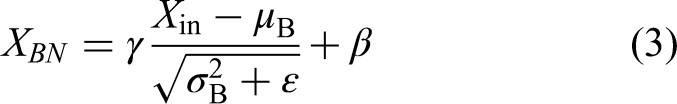
ReLU activation function
ReLU adds non-linearity to the model. It removes negative values from the feature maps by replacing with zero. This selective activation increases the capacity of the model to learn complex patterns without making much difference to the gradient flow. The operation of ReLU mathematically is described as:
1 × 1 Convolution
Within the CNNs, the 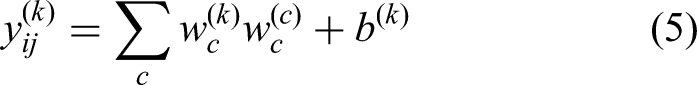
Average pooling layer
The averaging pooling layer is usually applied to shrink the spatial locations (height and width) of feature maps. It operates in such a manner that it sub-divides the input feature map into non-overlapping structures and calculates the mean of each region. Such down-sampling assists in suppressing the computational complexity and overfitting by condensing the features in a short format. With the average pooling, more bits of subtle information will be maintained than with max pooling, in which there will be the selection of the highest value. DenseNet-201 follows this convention, with average pooling in such transition layers gradually reducing spatial resolution between dense blocks and also employs global average pooling as an operation at the end of the network to combine spatial information before classification. The mathematical expression is as follows: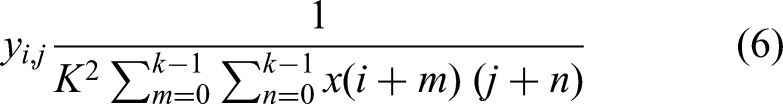
Pre-processing of the dataset
The input layer of the DenseNet-201 model requires images in 224 × 224 × 3 format, that is, color images of size 224 × 224. Therefore, the original grayscale images (128 × 128) were resized to 224 × 224 pixels using a bilinear interpolation method. For the transformation from gray level to color images, the values of gray level were replicated to all three planes, that is, red (R), green (G), and blue (B), and concatenated to form a pseudo-color image as depicted in Figure 1.
Our dataset consists of classes with unequal number of samples. The issue of imbalanced classes was dealt with by applying a random hybrid technique. It can make the dataset balanced without overfitting the model. The size of majority classes is reduced while that of minority classes is increased. Thus, the number of samples in all seven classes is made equal to prevent a model from bias toward a particular class.
Lack of variability in a dataset usually leads deep neural models to overfitting. During the training phase, the dataset was augmented to add variability by applying random rotation in the range −10 to 10, random translation along the X-axis and Y-axis in the range −5 to 5. Similarly, random scaling was applied in the range 0.9 to 1.1. Reflection along the X-axis was also enabled.
Selection of hyper-parameters
The performance of a CNN also depends on choosing optimal values for the model's hyper-parameters. The values of the hyper-parameters described here were chosen after several trials. Five-fold cross-validated results are generated using the dataset, in which the dataset is divided into five folds. A minimum batch size of 8 was selected, with an initial learning rate of 0.0001; the number of epochs was set to 50, with 77 iterations per epoch. A validation frequency of 30 was selected. For finding optimal weights, stochastic gradient descent with the momentum optimizer was deployed. Shuffling of data was enabled on the completion of each epoch to increase randomness.
Experiment environment
The proposed method was implemented in MATLAB R2025a trial version, and the results were generated using a computer system with AMD Ryzen R9 7950x 16-core processor, 5.7 GHz, 16 cores, 32 CPUs, RAM 64 GB Kingston 6000 MHz, GPU: GEFORCE RTX 4080 SUPER 16 GB (cores = 10,240).
Performance evolution
Performance of the proposed model is quantitatively analyzed by computing several metrics, including accuracy, precision, sensitivity, F1-score, and kappa coefficient. These metrics are based on parameters such as true positive (TP), true negative (TN), false positive (FP), and false negative (FN) derived from a confusion matrix. TP represents the correct identification of a medical condition by the model. When the absence of a medical condition is correctly identified, it is called TN. FP represents the incorrect identification of a medical condition. When the absence of a medical condition is incorrectly identified, it is called FN. Accuracy, one of the most common metrics for measuring the overall performance of a model, is mathematically represented as:
It is the proportion of correct decisions to the total decisions made by the model:
The ratio of the actual TPs to the total identified TPs:
It is the TN predicted rate, the proportion of predicted TNs to total actual TNs:
The proportion of correctly identified TPs to the total TPs:
F1-score is the most used metric for the evaluation of a model's performance. The degree of agreement among different evaluators can be measured by calculating the kappa coefficient as:


Results
The experimental results were generated with the dataset and execution environment described in the previous sections. The performance and effectiveness of the proposed model were evaluated with metrics commonly used in the medical domain. The generalizability of the proposed model was assessed by conducting five-fold cross validation. The dataset was divided into five folds, each one having the same of number of samples. The model was trained on four folds and tested on the remaining fifth fold. The process was repeated five times; the model was tested on each of the five folds, one by one while the other four folds were used for training.
Cross-validated results of the proposed model
The five-fold cross-validated results of the proposed model are presented below. Confusion matrices, receiver operating characteristic (ROC) curves, and class-wise sensitivity, specificity, precision, and overall accuracy are computed for each fold. For each of the five folds, the obtained confusion matrices are shown in Figure 3.

Confusion matrices for different folds: (a) confusion matric for fold-1, (b) confusion matric for fold-2, (c) confusion matric for fold-3, (d) confusion matric for fold-4, and (e) confusion matric for fold-5.
The obtained quantitative metrics for each of the seven classes and for fold-1 to fold-5 are presented in Tables 2 to 6. For fold-1, the obtained accuracy is 90.91%. The high values of sensitivity for hot nodule and normal demonstrate that most of their positive cases are correctly identified with a minimum number of FNs. The low values of the same metric for nodular goiter and multi-nodular goiter indicate that the proposed is not performing well in identifying their positive cases. The high values of precision for cold nodule and normal show that most of their TP cases are correctly identified with a few numbers of FPs. The low value of precision for nodular goiter shows a high number of FP cases. The F1-score can provide useful information about the performance of the model. High values of F1-score show that both type I (FP) and type II (FN) errors are low. Low values of F1 show that type I and II errors are high.
Results of the proposed model on fold-1.
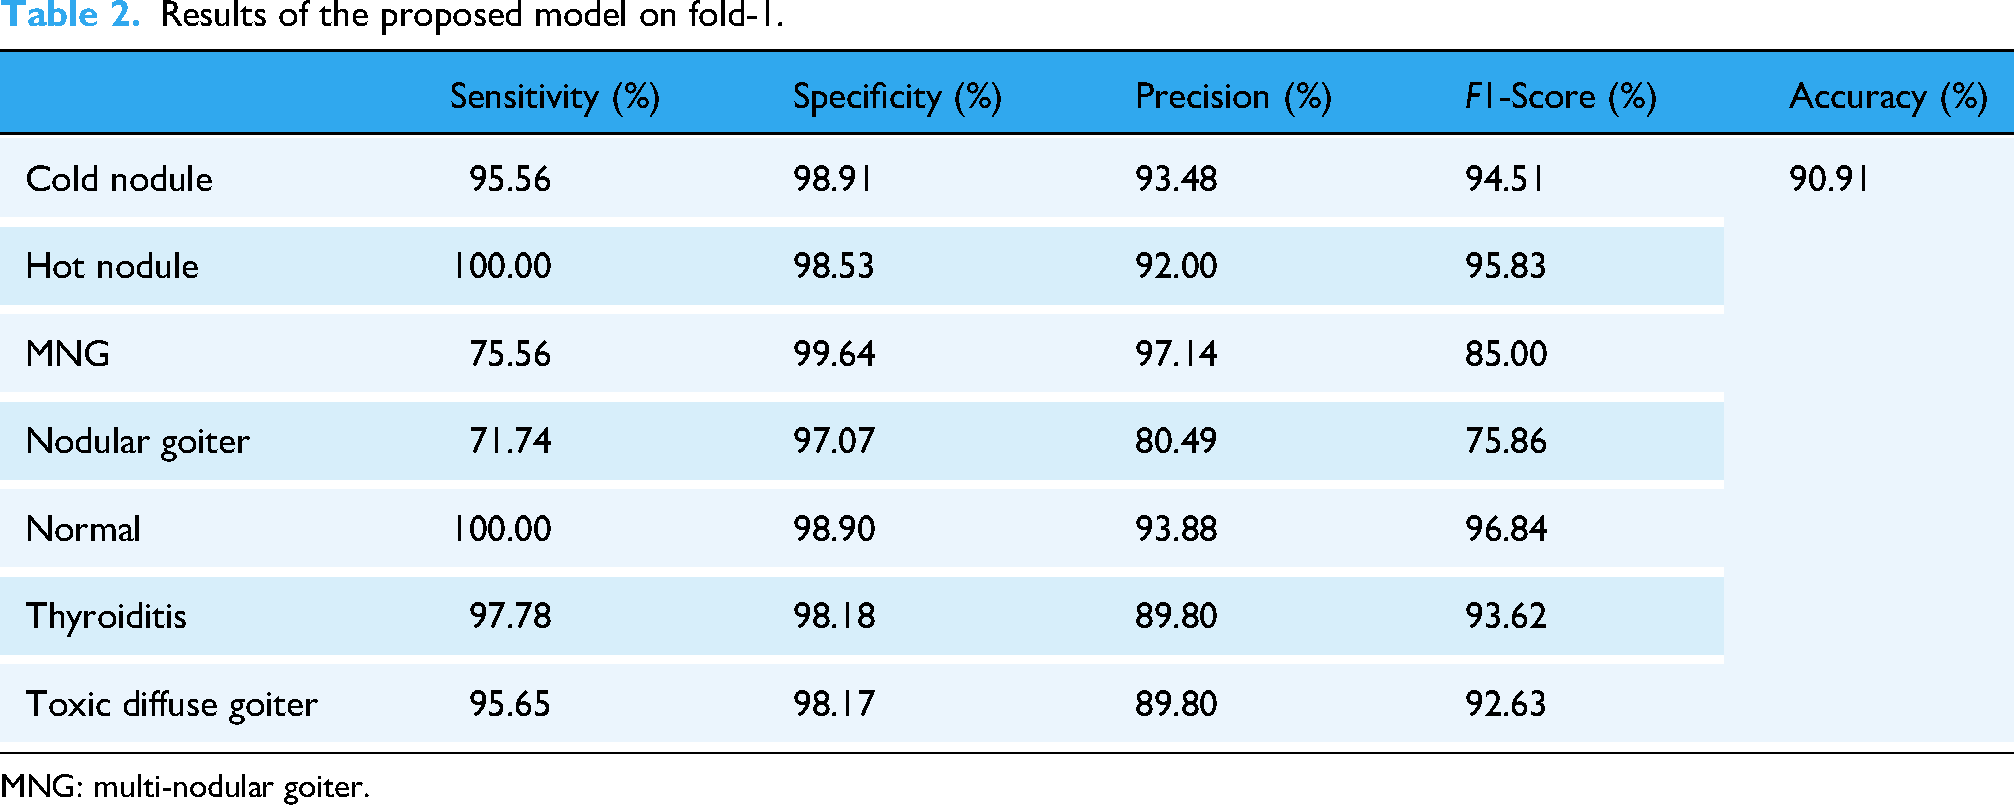
MNG: multi-nodular goiter.
Results of the proposed model on fold-2.

MNG: multi-nodular goiter.
Results of fold-3.

MNG: multi-nodular goiter.
Fold-4 results of the proposed model.

MNG: multi-nodular goiter.
Fold-5 results.

MNG: multi-nodular goiter.
The model achieved 92.19% accuracy. Low values of sensitivity were obtained for multi-nodular goiter and nodular goiter.
ROC curve, which plots TP rate against FP rate, provides useful information about the performance of the model in accurately identifying each class. The ROC curves for each of the five folds are given in Figure 4. In Figure 4(a), the curves corresponding to nodular goiter and multi-nodular goiter show low TP rate for high FP rate. The model is not performing well in identifying these two classes compared to the other classes. The other classes have relatively high TP rate for low FP rate. In a similar way, the other ROC curves can be interpreted. In Figure 4(c), the curves for fold-4 show that all the seven classes are correctly identified as most of them are tilted to top-left corner. In Figure 4(e), most of the ROC curves are away from top-left corner and demonstrate poor performance of the model in fold-5.

ROC curves for different folds: (a) fold-1, (b) fold-2, (c) fold-3, (d) fold-4, and (e) fold-5. ROC: receiver operating characteristic.
Overall performance evaluation
Overall performance of the proposed model was evaluated by computing average values of specificity, sensitivity, precision, and F1-score across all classes and across all folds. Average values of the metrics are plotted in Figure 5. The relatively high sensitivity values for normal, thyroiditis, hot nodule, and cold nodule demonstrate that the proposed model is good at classifying these particular conditions of thyroid glands. The smaller sensitivity values for multi-nodular goiter and nodular goiter indicate that FN decisions are relatively high. Moderate results are obtained for toxic diffuse goiter.
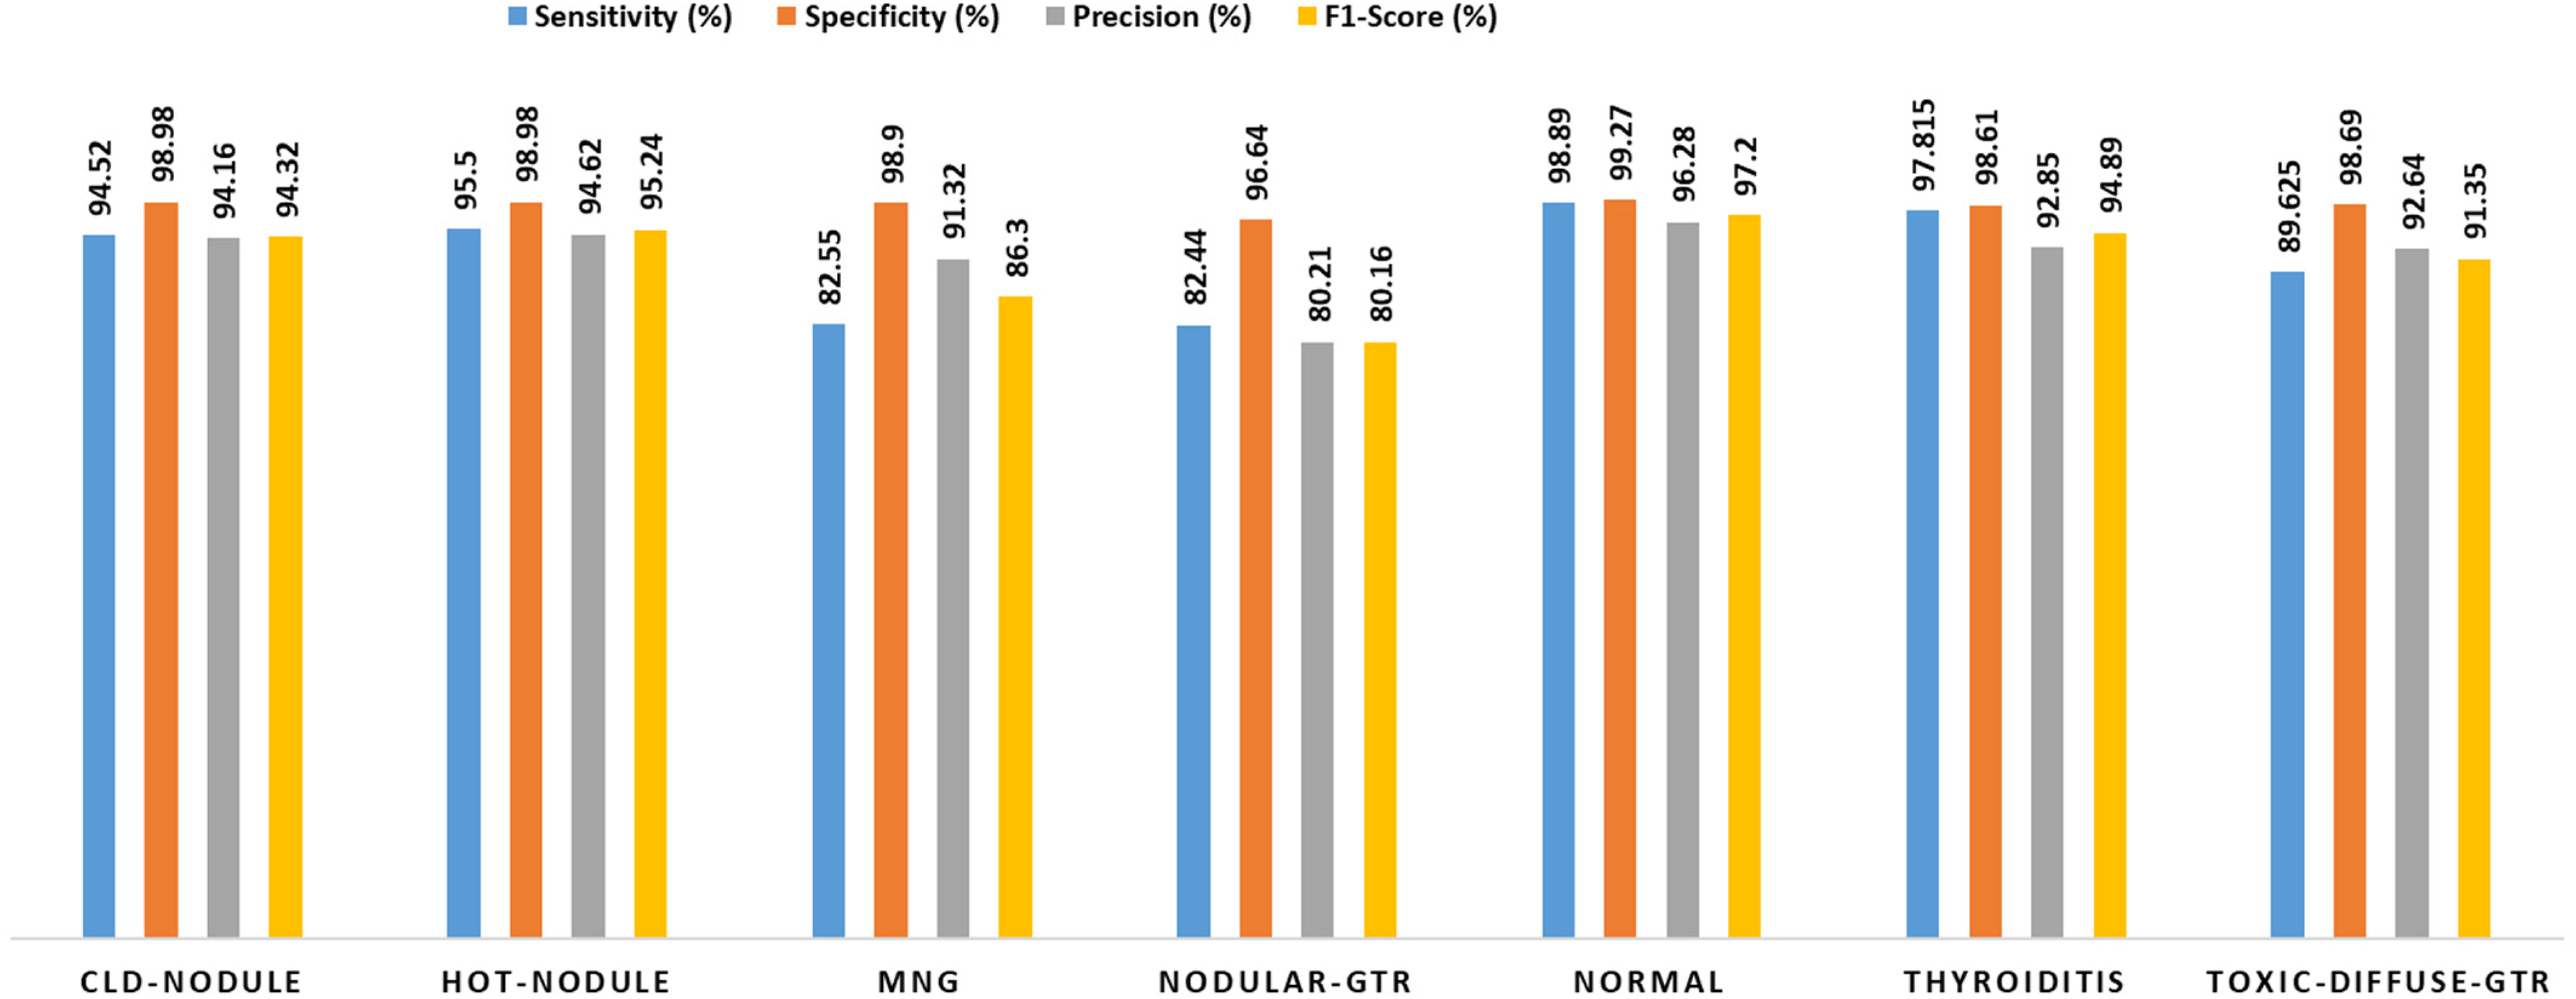
Average value of sensitivity, specificity, precision, and F1-score for all classes. CLD: cold; GTR: goiter; MNG: multi-nodular goiter.
The overall sensitivity, specificity, precision, and F1-score irrespective of the class were calculated by taking average across the classes for each fold. The obtained results are presented in Table 7.
Average values of the metrics for each fold across all classes.

The sensitivity values vary between 95.89% and 89.03% where the highest and lowest values were obtained for 4th and 5th folds, respectively. The average values of sensitivity, specificity, precision, F1-score, and accuracy are 91.48%, 98.58%, 91.57, 91.38%, and 91.48%.
Comparative analysis
A comparative analysis was performed and several deep neural models such as MobileNetv2, Inception-v3, ResNet50, AlexNet, and GoogLeNet were also implemented and results were generated on the same dataset by keeping all hyper-meters the same as used in the proposed model. All the results are five-fold cross-validated, and finally macro average values of the metrics were computed and compared with the proposed model. The comparative analysis is provided in Table 8. The proposed model achieved a relatively high sensitivity of 91.48%, specificity of 98.58%, precision of 91.57%, F1-score of 91.38, and accuracy of 91.48% on the dataset. Inception-v3 also showed better performance with sensitivity values of 90.48 and 90.98 respectively. Relatively poor performance was demonstrated on the dataset by GoogLeNet with a sensitivity value of 88.41%, specificity of 98.07, precision of 89.02, F1-score of 88.23, and accuracy of 88.41%. Moderate results were obtained by AlexNet, MobileNetv2, and ResNet50 with sensitivity values of 89.72%, 88.58%, and 89.42%, respectively.
Comparative analysis of the proposed model.

AUC: area under the curve.
For further analysis and comparison, average F1-scores across all folds for all seven classes were computed and the obtained values are shown in Figure 6. For cold nodule, a relatively high F1-score value of 94.32% is achieved by the proposed and modified DenseNet-201 models. Similarly, it showed better performance in identifying multi-nodular goiter as well. Performance of the proposed model is slightly less than the AlexNet model and better than other models. Similarly, in identifying nodular goiter it showed poor results than Inception-v3 and better than the other models. In identifying normal class, performance of the proposed models is next to Inception and GoogLeNet and better than the rest. For toxic diffuse goiter, it showed performance next to Inception-v3 and better than the other models as demonstrated by bar graph in Figure 6.

Comparison of F1-score obtained by different models while identifying a particular thyroid gland condition.
The high values of sensitivity metric show that most of the positive conditions are correctly identified with a few FNs. On the other hand, its low value indicates that type II errors are high. Average sensitivity values were calculated for different models as shown in Figure 7. The proposed model obtained a sensitivity of 94.726% relatively higher than other models. Relatively poor performance with a sensitivity of 84.177% was shown by MobileNetv2 in identifying the TP conditions of cold nodule. The results of GoogLeNet are comparable with the proposed model.

Sensitivity comparison of different models.
Precision conveys useful information about the performance of a model. High values are preferable and indicate low type I error (FP). The average values of precision for models are shown as bar graph in Figure 8. The proposed models achieved high precision values for cold nodule and multi-nodular goiter.

Precision comparison of different model in identifying a particular thyroid gland condition.
Degree of consensus measurement between proposed model and experts
The degree of consensus between the medical experts and the proposed model was assessed by computing the kappa coefficient value. The labels of the medical conditions in scintigraphy images provided by the nuclear medicine experts were taken as benchmark for evaluating the effectiveness of the proposed model. The calculated kappa coefficient values for each of the five folds and their average are presented in Figure 9. The highest value obtained for fold-4 shows that most of labels predicted by the proposed model are similar to the labels provided by the medical experts. The average value of kappa coefficient of 0.91468 shows near perfect agreement.

Kappa coefficient values for different folds.
Model explainability of the proposed model based on heatmap gradient-weighted class activation mapping
In Figure 10, the original grayscale image of a thyroid disorder is given on the left, while its gradient-weighted class activation mapping (Grad-CAM) heatmap overlaid version is given on the right side. The most relevant features are in red and yellow, features of moderate importance are in green, while the least relevant features are in blue. It shows the model is selecting clinically important spatial and intensity features in predicting the label of a disorder by generating a unique heatmap. The cold nodule Grad-CAM heatmap shows a concentrated region of attention on a low-intensity (cold) area, something that would be expected clinically. Cold nodules usually demonstrate a diminished uptake of radiotracers, as shown by dark areas on a scintigraphy picture. The accurate localization of the pathological feature is shown by the model, as it gives focus on this area. The hot nodule heat map illustrates the bright, central spot of enhanced tracer uptake, typical of hot nodules. These lesions show hyper-function and are hyperactive areas seen in scans. The high interest that the model has in this area indicates the proper selection of features and the appropriate inclination in relation to physiological uptakes.

Grad-CAM feature importance visualization for each disorder type. MNG: multi-nodular goiter; Gtr: goiter.
Similarly, the visualization of MNG Grad-CAM demonstrates a diffuse set of attention patterns with a number of regions having moderate activity, especially in and around the central thyroid region. This trend can be closely related to the clinical manifestation of MNG, when numerous nodules of different functional status are located all over the gland. The behavior of the model seems to indicate that it accurately detects the existence of more than one focus point. For nodular goiter, the proposed model shows a centered, emphasized focus on the lower part of the thyroid, which is the site where nodular lesions are normally found. This robust focus reflects successful spatial localization in favor of proper distinction of thyroid disorders with arterial uptake that is more dispersed. The heatmap of thyroiditis provides a widespread zone of activity, suggesting a scattered distribution of tracer uptake. This correlates to inflammatory changes, for example, thyroiditis, where the entire gland as opposed to focal lesions, may be afflicted. It seems that the model is able to reflect this pattern of non-focused distribution adequately. The heatmap of toxic diffuse goiter displays an equal and wide dispersion of attention on the gland, depicting acknowledgment of homogeneous elevated uptake. This is typical of toxic diffuse goiter, which generally involves diffuse involvement of the gland symmetrically. The interpretation given by the model is consistent with the pathophysiological manifestation of the disorder.
Discussion
This research aims to develop a DNN-based automated system for the classification of thyroid gland conditions. The transfer learning capabilities of the pre-trained DenseNet-201 model was exploited by altering the fully convolutional and classification layers to classify thyroid gland disorders into seven categories, such as cold nodule, hot nodule, multi-nodular goiter, nodular goiter, thyroiditis, toxic diffuse goiter, and normal. To ensure generalizability and confidence, five-fold cross-validated results were generated and analyzed. The results of different folds in Tables 2 to 6 illustrate that the values of sensitivity, precision, F1-score, and accuracy vary from fold to fold. However, relatively low performance is shown in identifying multi-nodular goiter and nodular goiter. High metric values are achieved for normal, cold nodule, hot nodule, and toxic diffuse goiter.
The overall performance of the proposed model was assessed by computing fold-wise and class-wise averages of the metrics. The model achieved sensitivity of 94.52%, specificity of 98.98%, precision of 94.16%, and F1-score of 94.32% in identifying cold nodule. Hot nodule was identified with a sensitivity of 95.5%, specificity of 98.98%, 94.62%, and F1-score of 95.24%. Figure 5 illustrates that a relatively low sensitivity of 82.44%, specificity of 96.64%, precision of 80.21%, and F1-score of 80.16% are obtained for nodular goiter. The other classes like toxic diffuse goiter and multi-nodular goiter were identified with moderate values of the metrics.
The fold-wise averages of the metrics given in Table 7 describe that high values were obtained in fold-4 while relatively low values were obtained in fold-5. The overall performance of the proposed model was evaluated by calculated average values of sensitivity (91.48 ± 2.77), specificity (98.58 ± 0.47), precision (91.57 ± 2.77), F1-score (91.38 ± 2.82), and accuracy (91.48 ± 2.79).
Comparative analysis was also performed to gauge performance of the proposed model against other well-known DNN models such as ResNet50, Inception-v3, MobileNetv2, AlexNet, and GoogLeNet. Results of all the models are five-fold cross-validated and generated using the same hyper-parameters such as number of epochs (50), iterations per epoch (70), learning rate (0.0001), batch size (08), validation frequency, (30) and optimizer. The results of these models along with the proposed model are provided in Table 8. The lowest sensitivity of 88.4% was obtained by GoogLeNet and highest sensitivity of 91.48% was obtained by our proposed model. High sensitivity represents few FN decisions in identifying the accurate class of the thyroid gland while low sensitivity means FN rate is high. Inception-v3, with a sensitivity of 90.98%, has achieved relatively better performance than ResNet50 (with a sensitivity of 89.42%), MobileNetv2 (with a sensitivity of 88.58%), AlexNet (with a sensitivity of 89.72%), and GoogLeNet (with a sensitivity of 88.41%). The precision and F1-score values for the proposed models are 91.57% and 91.38%, respectively, which are higher than those achieved for other models. High values of F1-score are preferable and indicate low FNs and FPs. Sometimes, for a model, sensitivity may be high, but precision may be low or vice versa which means either FN is high or FP. On the other hand, F1-score incorporates the concept of both FP and FN. Inception-v2 achieved a precision of 90.97% and F1-score of 90.79% comparatively higher than ResNet50 (with a precision of 89.59% and F1-score of 89.20%), MobileNetv2 (with a precision of 88.99% and F1-score of 88.45%), AlexNet (with a precision of 89.77% and F1-score of 89.40%), and GoogLeNet (with a precision of 89.02% and F1-score of 88.23). The average values of accuracy and AUC along the other metrics presented in Table 8 demonstrate that the proposed model performed better than other models using the same dataset and hyper-parameters. The results of different models for identifying the medical conditions of thyroid gland are different. The size of dataset has an impact on the accuracy of results especially when DNN models are implemented. Second, the uneven number of samples in classes presents a challenge for models. The results also depend on the architecture of model.
Consensus among the proposed model and nuclear medicine experts was assessed by computing kappa coefficient. The values obtained for different folds are shown in Figure 9. A high kappa coefficient value of 0.9592 was obtained for fold-4 in which relatively better results were achieved. The average value of 0.9147 shows a near perfect agreement. It shows that performance of the proposed model in identifying thyroid conditions is near to human experts and the model can be used as second opinion and as first where human experts are not available.
The comparison results of the proposed model with other contemporary state-of-the-art methods are presented in Table 9. Ma et al. 40 deployed DenseNet-121 for the classification of three thyroid disorder types: Graves’ disease, Hashimoto's disease, sub-acute thyroiditis, and a normal class using a dataset of 2888 scintigraphy images. It is claimed that their model obtained 100% accuracy for normal, 98.75% for sub-acute disease, 98.17% for Hashimoto's disease, and 98.33% for Graves’ disease. The results are good, but the research has focused on only three types of disorders. They have not provided Grad-CAM heatmaps for the interpretability of the model.
Comparison of the experimental results of the proposed model with existing models.

AUC: area under the curve; CNN: convolutional neural network.
Medhus et al. 29 used a pre-trained model VGG19 for the classification of two major types, detectable hypo-functioning lesions and non-detectable hypo-functioning lesions. They achieved an accuracy of 90% with a dataset of 1724 images. Qiao et al. 39 performed experimentation on 1430 scintigraphy images using three DNN models, such as AlexNet, VGGNet, and ResNet. The study emphasized three classes: two disorder types and one normal. The results were evaluated by computing six metrics. The ResNet showed comparatively better results with an accuracy of 91.78% for the normal class, 92.78% for Graves’ disease, and 89.00% for sub-acute thyroiditis. Hajianfar et al. 18 introduced a novel technique for data augmentation useful for enhancing the performance of DNNs. The scarcity of data poses challenges in the deployment of DNN models in the medical domain. Data augmentation is a common technique for increasing the size of a dataset. They practically demonstrated the effectiveness of their technique by using the ResNet101V2 model and classified three types of thyroid disorders (diffuse goiter, multi-nodular goiter, and thyroiditis) and a normal class. The model showed good performance in identifying thyroiditis. The model found it hard to accurately classify normal.
Yang et al. 38 proposed the TPRNet model based on manually extracted texture features from the region of interest and deep features extracted through. 42 The model classifies the scintigraphy images into six categories based on the uptake patterns. Five out of these six uptake patterns represent thyroid disorder types, and the sixth is the normal class. The results are analyzed by computing accuracy, sensitivity, precision, and F1-score for each class, including five disorder types and the normal. Results are also compared with several versions of ResNet, such as ResNet18, ResNet34, ResNet50, ResNet101, and ResNet152. TPRNet model achieved relatively better performance with 91.18% of accuracy, 86.38% of sensitivity, 90.52% of precision, and 88.11% of F1-score. The TPRNet is trained on an unbalanced training dataset encompassing a minimum of 77 samples of a focally increased uptake pattern and a maximum of 1040 samples of a diffusely increased uptake pattern. Sometimes, it can make the model biased toward the class with the maximum number of samples. Class-wise sensitivity values were computed for several models along with their proposed TPRNet model. The model obtained 100% of sensitivity for the diffusely increased class and 72.37% for the focally decreased class. For the test dataset, the highest sensitivity value of 100% was obtained for the diffusely increased class, and the lowest sensitivity value of 61.11% for the focally increased class. The performance of their model was also compared with the four physicians.
Finally, the focus of our research work is on the classification of thyroid disorders only by leveraging the transfer learning capability of the pre-trained DenseNet-201 model. The original dataset was imbalanced, and there were different numbers of samples in different classes. An oversampling technique was used for resolving the challenges of imbalanced classes. The process of data augmentation was applied to increase the size and variability of the training dataset. Grad-CAM heatmaps are generated for each class of disorder for interpretability and explainability of the proposed model. The unique heatmap for each class demonstrates the distinguishing capability of the proposed model. The overall performance of the proposed model was also evaluated in order to compare with other contemporary state-of-the-art methods. The proposed model achieved better performance in terms of macro average accuracy of 95.87, precision of 95.83 ± 2.85, specificity of 99.14 ± 0.56, recall of 95.86 ± 4.6, F1-score of 95.84 ± 3.63, and AUC of 0.997 ± 0.01. The performance of the proposed model is better than the contemporary state-of-the-art techniques because the design of the proposed model is vastly superior in terms of information flow, promotes reuse of features, and mitigates the vanishing gradient issue during learning.
In addition, due to parameter efficiency and feature reuse with dense connections, DenseNet-201 performs very well, especially when used with transfer learning with relatively small data size. In order to compare the performance of the proposed model with physicians, the obtained value of the kappa coefficient (0.9148) indicates that the labels predicted by the model is quite similar to those annotated by physicians. The main objective of the present research was to design an automated system based on CNNs for the classification of thyroid disorders only, while normal subjects were excluded to avoid unnecessary exposure to health-hazard radiation. For more versatility, a normal class should be included. This can be a limitation of this study. The transfer learning of pre-trained CNN models minimizes the demand for large datasets. However, a large dataset is preferred generality of the model.
Conclusion
This study underscores the remarkable potential of an automated DL system, utilizing a DenseNet-201 network, that helps to enhance the diagnosis and classification of thyroid gland disorders. By reducing reliance on a physician's subjective evaluation and addressing the shortage of nuclear medicine specialists, the system promises a reliable model in CAD. Moreover, it is capable of accurately distinguishing six different thyroid physiologies based on thyroid scintigraphs. Our model's effectiveness is demonstrated through accuracy rates of 91.48%, with inter-observer agreement classified as fair, as reflected by Cohen's kappa coefficient. Notably, the high Cohen's kappa coefficient of 0.9148 indicates that the system has the potential to be used as a CAD system. These findings advocate for the integration of an AI-driven tool into clinical practice, where it could enhance diagnostic accuracy, minimize variability, and play a pivotal role in the management and treatment of thyroid cancer and related disorders. Additionally, this research serves as a foundation for the continued advancement of AI-based diagnostic systems in medicine, fostering scientific and clinical developments in endocrinology and other complex diseases. Future research should prioritize large-scale clinical trials across various healthcare settings to ensure the model's reliability and adaptability. This includes training the system on diverse patient populations, different stages of thyroid disease, and a variety of imaging technologies to confirm its diagnostic precision and real-world applicability.
Furthermore, the implementation of CNN models could be explored in combination with other imaging modalities, such as ultrasound or CT scans, to enhance diagnostic capabilities. Expanding the dataset obtained from scintigraphy could improve diagnostic accuracy and enable a more comprehensive evaluation of thyroid dysfunction, potentially identifying abnormalities that may not be detectable through scintigraphy alone.
Footnotes
Ethical approval
The ethical approval number is BINOR-E4 (40)/12.
Author contributions
Each author in this article contributed their distinct expertise and responsibilities in a collaborative way. HMUG, JK, and NUK were primarily responsible for formulating the study's concepts and determining the research direction. HMUG, JK, and NUK assumed responsibility for the software implementation, which is critical for data analysis and interpretation. ZUK, SUK, NA, SA, and SAW collaborated to validate the findings, ensuring the strength and reliability of the conclusions reached. JK and NUK supervised formal analytic techniques, while ZUK, SUK, NA, SA, and SAW carried out essential studies for data collection and interpretation. NUK supervised the use of resources while JK thoroughly examined the collected data. ZUK, JK, SUK, NA, SA, and SAW handled further modifications and editing after HMUG initially wrote the manuscript. JK, NUK, ZUK, SUK, NA, SA, and SAW used data visualization to improve the presentation of significant findings. NUK provided supervision throughout the study process, ensuring complete conformity to scholarly guidelines. JK, ZUK, SUK, NA, SA, and SAW collaborated on project administration tasks, with NUK leading the funding acquisition task. All authors provided input during the manuscript drafting stage.
Funding
The authors disclosed receipt of the following financial support for the research, authorship, and/or publication of this article: This work is supported by Princess Nourah bint Abdulrahman University, Riyadh, Saudi Arabia through the Researchers Supporting Project PNURSP2026R333.
Declaration of conflicting interests
The authors declared no potential conflicts of interest with respect to the research, authorship, and/or publication of this article.
Availability of data and materials
The data will be available on proper request to the corresponding author.
Data guarantor
We are responsible for the dataset and the data used in this research is our own institutional dataset and is not took from any other organization or other sources. All the authors are solely responsible for this information.