
Abstract
Objective
To quantify bradykinesia in Parkinson's disease (PD) with a Kinect depth camera-based motion analysis system and to compare PD and healthy control (HC) subjects.
Methods
Fifty PD patients and twenty-five HCs were recruited. The Movement Disorder Society-Sponsored Revision of the Unified Parkinson's Disease Rating Scale part III (MDS-UPDRS III) was used to evaluate the motor symptoms of PD. Kinematic features of five bradykinesia-related motor tasks were collected using Kinect depth camera. Then, kinematic features were correlated with the clinical scales and compared between groups.
Results
Significant correlations were found between kinematic features and clinical scales (P < 0.05). Compared with HCs, PD patients exhibited a significant decrease in the frequency of finger tapping (P < 0.001), hand movement (P < 0.001), hand pronation-supination movements (P = 0.005), and leg agility (P = 0.003). Meanwhile, PD patients had a significant decrease in the speed of hand movements (P = 0.003) and toe tapping (P < 0.001) compared with HCs. Several kinematic features exhibited potential diagnostic value in distinguishing PD from HCs with area under the curve (AUC) ranging from 0.684–0.894 (P < 0.05). Furthermore, the combination of motor tasks exhibited the best diagnostic value with the highest AUC of 0.955 (95% CI = 0.913–0.997, P < 0.001).
Conclusion
The Kinect-based motion analysis system can be applied to evaluate bradykinesia in PD. Kinematic features can be used to differentiate PD patients from HCs and combining kinematic features from different motor tasks can significantly improve the diagnostic value.
Keywords
Introduction
Bradykinesia, one of the cardinal motor symptom of Parkinson's disease (PD), is defined as the slowness or hesitations in initiating and executing movements. 1 In a broader perspective, it also refers to reduced amplitude (hypokinesia), progressive decrement in amplitude and speed when performing repeated movements (sequence effect).2,3 Previous researches have demonstrated that higher bradykinesia scores are correlated with many significant outcomes such as more severe symptoms of depression, sleep disturbances, suicidal thoughts, 4 lower quality of life, and bad performance in daily activities. 5 Accordingly, detailed assessment of bradykinesia is important in PD management to aid in evaluating health-related status in PD.
The Movement Disorder Society-Sponsored Revision of the Unified Parkinson's Disease Rating Scale part III (MDS-UPDRS III) 6 and Modified Bradykinesia Rating Scale (MBRS) 7 are the most commonly used scales for evaluating bradykinesia. Although these results aid in rating general motor impairment in PD, scales can only provide semi-quantitative data because their results are non-linear. Furthermore, scales are significantly biased by both inter- and intra-rater variability. In particular, bradykinesia-related subitems in the MDS-UPDRS III suffer from the lowest reliability among all items. The Kappa coefficient for finger tapping between different raters is only about 0.50. 8 Even for the same rater, the intra-rater reliability of the bradykinesia subitems only ranges from 0.60 to 0.78. 9 Of the top 10 UPDRS III subitems that trouble neurologists during assessment, five subitems belong to bradykinesia. 10 These studies indicate that clinical scales may be insufficient in evaluating bradykinesia. Therefore, objective measurement of bradykinesia is necessary.
To improve the accuracy and reliability of bradykinesia rating, several technology-based analysis systems have been developed. Simonet et al. 3 developed a slow-motion analysis system using smartphone which could detect early motor dysfunction in PD. Khodakarami et al. 11 succeeded in measuring time spent in bradykinesia and dyskinesia in PD patients using Parkinson's Kinetigraph (PKG, Global Kinetics Corporation™, Australia). Using a domain-specific model fine-tuned using the DeepLabCut framework, standard smartphone video of finger tapping can be used to quantify measures related to Parkinson's bradykinesia. 12 There are also bradykinesia measurement using body-worn sensors, 3D-motion capture camera system, quantitative digitography, surface electromyography, etc.13,14 Although these technology-based analysis systems can offer objective bradykinesia assessment, few studies divide bradykinesia into subcomponents or relate the objective measurements to standardized rating scales. Therefore, the effectiveness of these systems in clinical practice has not been clearly established. In addition, nearly all the previous studies were limited by specific tasks which do not provide a full set of objective assessments of bradykinesia. For PD patients, detailed evaluation of the whole clinical picture is important and reliance should not be placed on single motor task.3,15 Lastly, a growing number of research suggests that the motor performance of PD patients may vary significantly from one task to another and different tasks or different kinematic features relate to different aspects of the disease.16–22 However, there is a lack of unanimity about which motor task or which derived metrics are best to characterize PD. 23
Accordingly, our research aimed to develop a motion analysis system based on Kinect to evaluate five bradykinesia-related motor tasks from subcomponents that incorporate amplitude, speed, and frequency. We also aimed to evaluate the diagnostic value of different motor tasks and different elements of bradykinesia for patients with PD. This research will aid in assessing bradykinesia objectively which is helpful in diagnosing and managing PD.
Methods
Participants
This was an observational study with a cross-sectional case-control design. Fifty PD patients and twenty-five age-matched healthy controls (HC) participated in this research. All participants were recruited from Tongji Hospital of Tongji University between March 2021 and March 2022. Inclusion criteria for PD were: (1) diagnosed idiopathic PD according to 24 ; (2) Hoehn–Yahr stage (H–Y stage) 1–2.5; (3) can understand and follow doctor's instructions. Exclusion criteria for PD were (1) have medical history of cerebrovascular disease, dementia, musculoskeletal disease, spinal column diseases, or psychiatric abnormalities. Inclusion criteria for HC were (1) free of PD, dementia, cerebrovascular disease, musculoskeletal disease, spinal column diseases, or psychiatric abnormalities; (2) can understand and follow doctor's instructions. This research was approved by the Medical Ethics Committee of Tongji Hospital (IRB No. 2019-061). All participants had provided written informed consent before the research started.
Clinical evaluation
The following demographic and clinical data were collected for all participants: gender, age, height, weight, body mass index (BMI), and education level. For PD group, disease duration, the most affected side, H–Y stage were also collected. For PD group, they were tested in the morning and had stopped antiparkinsonian drugs for 24 h before the assessment. The MDS-UPDRS III were conducted separately by two experienced physicians and the final value were averaged. At the same time, objective features of bradykinesia were collected using a Kinect depth camera.
Bradykinesia subitems consisted of the following six items: 3.4 Finger tapping; 3.5 Hand movements; 3.6 Pronation-supination movements of hand; 3.7 Toe tapping; 3.8 Leg agility and 3.14 Global spontaneity of movement (body bradykinesia) according to MDS-UPDRS III 6 and previous studies.25,26 For HC subjects, the average value of both sides was used for analysis. 27 Since PD exhibited an asymmetric pattern, the most affected side in PD group was selected. According to MDS-UPDRS III sub-items 3.3, 3.4, 3.5, 3.6, 3.7, 3.8, 3.15, 3.16, and 3.17, left side was defined as the most affected side if the ratio of left side total scores to the right side total scores > 1, or the most affected side was deemed as the right side if the ratio < 1.
Device
The whole set of motion analysis system consisted of an Azure Kinect depth camera (RGB 3840 × 2160 pixels @30fps; depth camera 1024 × 1024 pixels @30fps, 7-microphone linear phased array, Microsoft), a lateral RGB camera (MCD-400 W plane, Ming Chuangda), a guide screen and an independent computer (Figure 1). The iFLYTEK Suzhou Research Institute developed and provided a detection program based on the Kinect to automatically obtain the kinematic features by extracting the kinematic information of 32 key points of the human skeleton and muscle model (Supplementary Figure S1).

Kinect-centered system for motion analysis. The whole set of motion analysis system consisted of an Azure Kinect depth camera, a lateral RGB camera, a guide screen, and an independent computer.
Kinematic features of bradykinesia
According to MDS-UPDRS III, all participants were asked to perform the following tasks (Figure 2). After each task, all patients were given 1 min to rest. The detailed definition of the collected kinematic features was reported in Supplementary Table S1.

Illustration of the motion tasks. A, Finger tapping; B, Hand movements; C, Pronation-supination movements of hand; D, Toe tapping; E, Leg agility.
Finger tapping
All participants sat 1.2 m from the camera. They were asked to tap the index finger on the thumb in front of the Kinect camera as quickly and as big as possible for 10 times (Figure 2(a)). Each hand was tested separately. The following features were collected amplitude, speed, and frequency.
Hand movements
All participants sat 1.2 m from the camera. They were asked to make a tight fist and then open the hand in front of the Kinect camera as quickly and as fully as possible for 10 times (Figure 2(b)). Each hand was tested separately. The following features were collected: amplitude, speed, and frequency.
Pronation–supination movements of hand
All participants sat 1.2 m from the camera. They were instructed to extend the arms out in front of their body and then turn the palms up and down for 10 times as quickly and as fully as possible (Figure 2(c)). Each side was tested separately. The following features were collected: amplitude and frequency.
Toe tapping
All participants sat 2.2 m from the camera. They were asked to place the heel on the ground in a comfortable position and then tap the toes 10 times as big and as fast as possible (Figure 2(d)). Each side was tested separately. The following features were collected: amplitude, lifting speed, falling speed, and frequency.
Leg agility
All participants sat 2.2 m from the camera. They were told to place the foot on the ground in a comfortable position and then raise and stomp the foot on the ground 10 times as high and as fast as possible (Figure 2(e)). Each side was tested separately. The following features were collected: amplitude, lifting speed, falling speed, and frequency.
Data analysis
Shapiro-Wilk test was conducted to determine the normality of each quantitative variables. Then, quantitative variables were presented as mean ± standard deviation or median (interquartile range) as appropriate. Categorical variables were presented as counts (percentages) and were analyzed using chi-square tests or Fisher's exact tests as appropriate. Independent t-test or Mann-Whitney U test was performed for comparing HC to PD. Spearman correlation analysis was conducted to explore the relationships between kinematic features and clinical scale data. Receiver operator characteristic (ROC) curves and area under the curve (AUC) were drawn to explore the predictive performance of kinematic features. The kinematic features that were able to significantly discriminate PD from HC at the univariate level (P < 0.05) were then included in the logistic regression model. To evaluate the importance of each task in the discrimination of PD, we build seven different regression models (six with “enter” and one with “forward conditional stepwise”), leaving one task at a time. Predictive probability was then used for ROC analysis. The optimal cut-off values were calculated according to Youden Index. A value of P < 0.05 was established for statistical significance. GraphPad Prism version 7 (Graph Pad Software Inc, San Diego, CA) and Origin Pro 2021 (OriginLab Corporation, USA) were used in figure configuration. IBM SPSS software version 25 (IBM Corp, Armonk, New York) was used in data analysis.
Results
Clinical characteristics of participants
Demographics of all participants are listed in Table 1. No statistical difference was found for all baseline data which made both groups more comparable. For PD group, the MDS-UPDRS III score and the bradykinesia subitems score were 34.94 ± 12.81 and 17.78 ± 7.04, respectively. Twenty-seven PD patients had severe symptoms on the left side and twenty-three on the right side (Table 1). In addition, the distributions of the ratings for each bradykinesia item were reported in supplementary material (Supplementary Figure S2).
Comparison of clinical characteristics of the two groups.

HC, healthy controls; PD, Parkinson's disease; BMI, body mass index; H-Y stage, Hoehn-Yahr stage; MDS-UPDRS III, Movement Disorder Society sponsored revision of the Unified Parkinson's Disease Rating Scale part III.
Correlations between clinical ratings and kinematic features
In order to verify the effectiveness of this set of features, we conducted a Spearman correlation analysis between clinical scale rating and kinematic features in PD group. The significant negative correlations between kinematic features and bradykinesia subitems score are shown in Table 2. Furthermore, in PD patients, the clear trend for kinematic features to decrease with increasing H–Y stage, MDS-UPDRS III score, and bradykinesia score were shown graphically (Figure 3).

Kinematic measures of bradykinesia subitems correlate with H-Y stage, MDS-UPDRS III score, and bradykinesia score. Spearman correlation coefficients shown; *P < 0.05; **P ≤ 0.001.
Correlation between kinematic features and bradykinesia subitem score.

Bold font means significant results; Spearman correlation coefficients are shown.
Comparison of kinematic features of upper limbs movements between groups
Compared to HC, PD patients exhibited a significant decrease in the frequency of finger tapping (P < 0.001), the speed (P = 0.003), and the frequency (P < 0.001) of hand movements. There was similar amplitude of both finger tapping and hand movements between the HC and PD (Figure 4). Moreover, PD patients had significant decrease in amplitude (P = 0.003) and frequency (P = 0.005) of hands pronation–supination movements (Figure 4).

Comparison of kinematic features of upper limbs movements between PD and HC. NS, no significance; HC, healthy control; PD, Parkinson's disease.
Comparison of kinematic features of lower limbs movements between groups
As reported in Figure 5, significant differences were revealed between PD group and HC group for amplitude (P < 0.001), lifting speed (P < 0.001), and falling speed (P < 0.001) of toe tapping and leg agility frequency (P = 0.003). We found no difference in other kinematic features of lower limbs movements between the two groups (Figure 5).

Comparison of kinematic features of lower limbs movements between PD and HC. NS, no significance; HC, healthy control; PD, Parkinson's disease.
Diagnostic accuracy
We found several kinematic features exhibited potential diagnostic value (Table 3). Speed and frequency are more helpful in the diagnosis of PD in the same motor task. Notably, falling speed of toe tapping was the best discriminator, with 80.00% sensitivity, 88.00% specificity and an AUC of 0.894 (95% CI = 0.820–0.967, P < 0.001). The lifting speed of toe tapping and frequency of hand movements also showed reasonable discrimination with AUCs of 0.874 (95% CI = 0.793–0.954, P < 0.001) and 0.769 (95% CI = 0.657–0.881, P < 0.001), respectively (Table 3).
The diagnostic accuracy of kinematic features to distinguish with PD patients from healthy control subjects.

Bold font means significant results; ∗P < 0.05; **P ≤ 0.001; AUC, area under the curve; CI, confidence interval; OCV, optimal cut-off value. Youden Index was used to select the OCV.
Regression analyses
As reported in Table 3, the nine kinematic features that were significantly discriminate PD from HC at the univariate level were then included in the logistic regression analyses. The diagnostic value is highest when all the motor tasks are included in the model, with an AUC of 0.966 (Figure 6). Leaving out features from one task at time, the AUC dropped to 0.964 without considering leg agility, to 0.958 without considering hand movements, to 0.949 without considering finger tapping, to 0.946 without considering pronation-supination movements of hand, and to 0.893 without considering toe tapping, respectively (Figure 6).

Area under the curve (AUC) for different classifiers between PD and HC including all motor tasks and excluding one task at a time. FT, finger tapping; HM, hand movements; PSMH, pronation-supination movements of hand; TT, toe tapping; LA, leg agility; AUC, area under the curve.
Notably, when we made a regression model with “forward conditional stepwise” method, finger tapping frequency, hand pronation–supination movements amplitude, and toe tapping lifting speed were enrolled into the logistical analysis model. We observed the diagnostic value of the model constructed with these three parameters was similar to the diagnostic value of the model constructed with all the kinematic parameters (AUC = 0.955 versus AUC = 0.966). The regression model was reported in Table 4 and the resulting model was presented as Equation 1. The combined model exhibited an AUC of 0.955 (95% CI = 0.913–0.997, P < 0.001). At a cut-off value of 0.583, the sensitivity and specificity were 90.00% and 92.00%, respectively (Figure 7).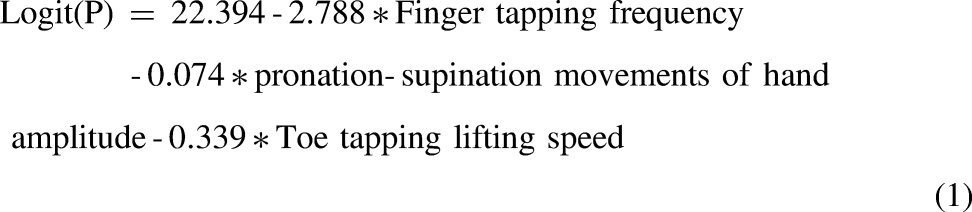
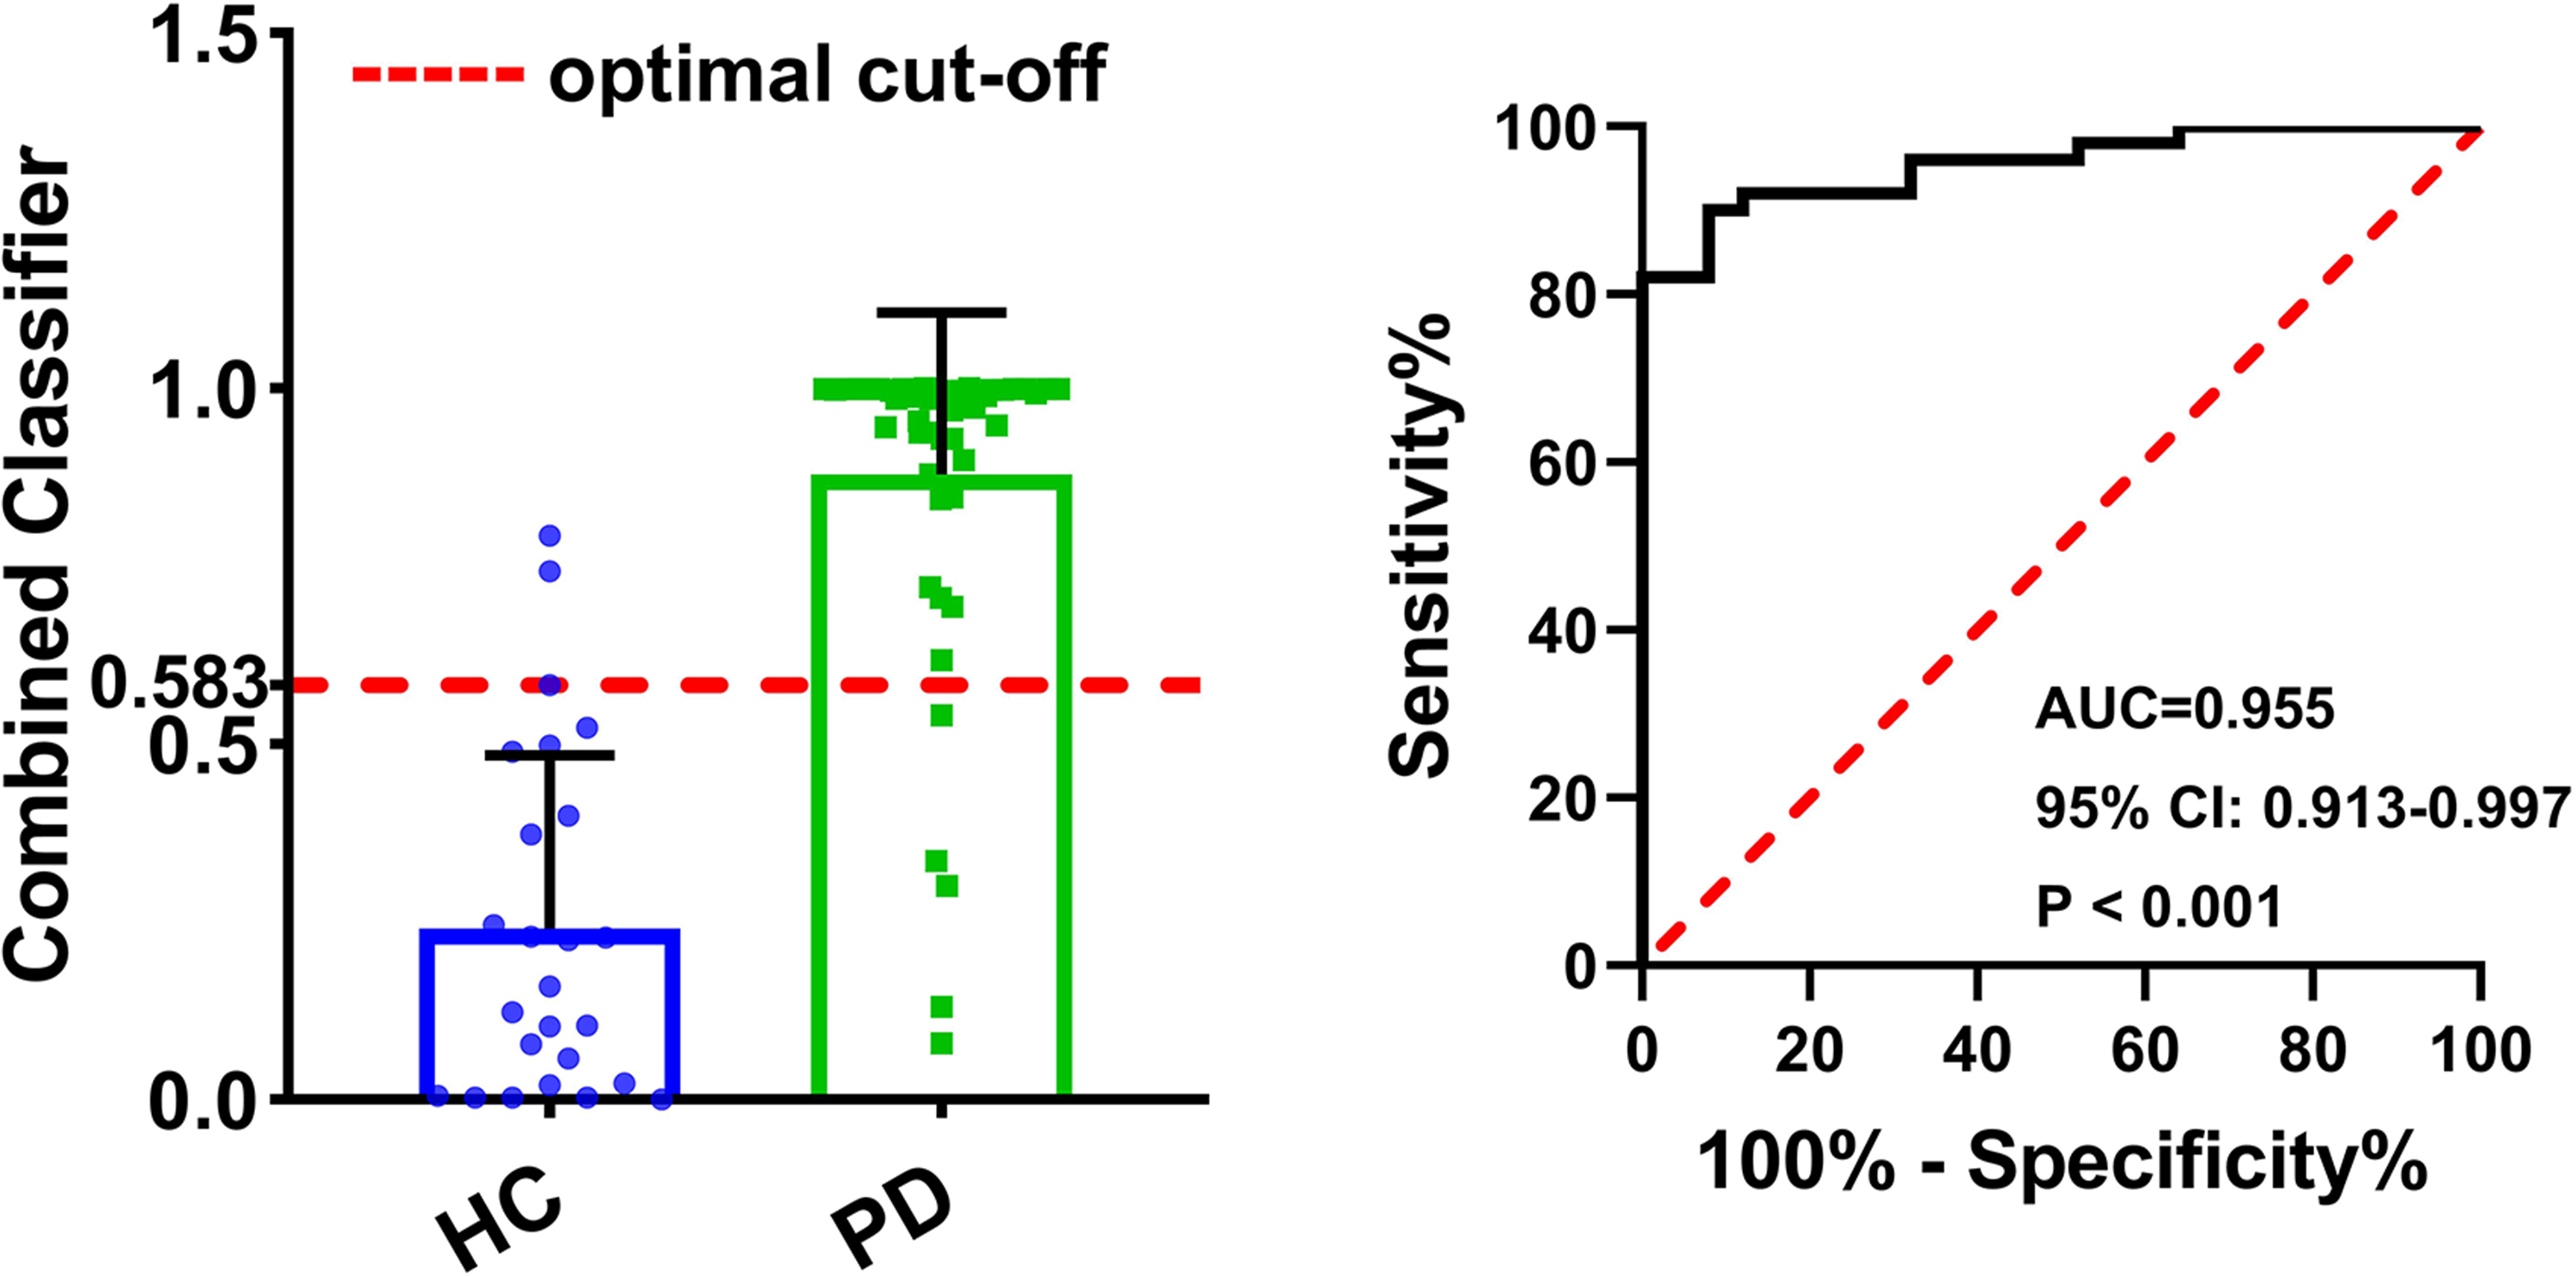
Receiver operating characteristics (ROC) analysis for the combination of finger tapping frequency, amplitude of hand pronation-supination movements, and toe tapping lifting speed. AUC, area under the curve; CI, confidence interval.
The result of logistic regression analysis.

Bold font means significant results; CI, confidence interval; P–S movements of hand, pronation-supination movements of hand.
The probability was calculated with Equation 2.
Discussion
In this study, we provided a comprehensive and detailed quantification of bradykinesia in patients with PD using Kinect depth camera. We demonstrated that the Kinect-based analysis system could be applied to evaluate bradykinesia in PD patients. PD patients exhibited worse performance in bradykinesia-related motor tasks. Several kinematic features could be used to differentiate patients with PD from HCs and combining kinematic features from motor tasks can significantly improve the diagnostic value. Our research is clinically significant because it will aid in providing fine-grained objective measurements and help in patient-tailored diagnosis and treatment.
In our research, we evaluated bradykinesia of PD from the perspectives of amplitude, speed and frequency and related the objective measurements to the standardized rating scales. We observed significant negative correlations between objective kinematic measures and clinical scales which showed that Kinect-based analysis system can track bradykinesia cogently. Similar results have also been reported in previous studies.3,27–30 For example, Simonet et al. 3 revealed mild correlations between clinical score and kinematic features of finger tapping. In another research, Akram et al. 27 demonstrated moderate correlation between kinesia score of distal finger fapping and MDS-UPDRS finger-tapping sub-score. These studies indicate that kinematic parameters are useful surrogate indicators for assessing the disease severity. However, it is important to point out that although correlations in the kinematic features and clinical scales were found in our and previous studies, these were only moderate correlations with a lack of strong correlations. A major reason for this problem may be attributed to the assessment methods. In the MDS-UPDRS III, 6 bradykinesia is rated by examiners based on amplitude, speed and rhythm when participants are performing several repeated motor tasks. No weights are specified for the corresponding components and different raters may place differential priority on individual components. 31 In addition, the severity of PD may also influence the correlation between the clinical scales and objective measures. MDS-UPDRS III may be more appropriate for assessing patients with advanced rather than early-stage PD.32,33 A study that included patients with early-stage PD identified mild to moderate correlations between kinematic features of finger-tapping and finger-tapping score which was similar with our research. 3 Other research that included PD patients with advanced disease revealed moderate to high correlations.30,34
Compared to healthy controls, the amplitude, speed, and frequency of limb movements in PD patients were reduced, thus reflecting the characteristics of bradykinesia. Overall, our study suggested relatively milder amplitude impairment (etymological definition of hypokinesia) compared to the speed impairment (etymological definition of bradykinesia) of PD patients. Previous studies have also reported a significant reduction in finger tapping speed but not in finger tapping amplitude in PD patients which is consistent with our research.3,35 One possible explanation for this phenomenon may be attributed to the “non-linear” and “augmentation” movement patterns. In PD patients, there is a repetitive cycle of becoming smaller in amplitude followed by a later increase, and it is this later augmentation that may compensate for the former decrement and the average value of amplitude. 3 From this point of view, it is reasonable to divide the patient's assessment process into different stages when evaluating the amplitude of PD patients in the future. The different stages of amplitude rather than the average value during the whole evaluation may be more useful in assessing the disease severity of PD patients.
The diagnosis of PD remains a clinical challenge and the search for reliable and affordable biomarkers is of clinical significance. Unlike traditional biomarkers (such as blood, CSF samples, structural and functional neuroimaging-based biomarkers), there is an increasing interest in technology-based evaluation of motor function.36,37 In our study, we demonstrated that several kinematic parameters of different motor tasks were able to distinguish PD patients from healthy controls which was consistent with previous studies. Simonet et al. 3 revealed that finger tapping velocity and frequency could help in distinguishing PD patients from controls. Similar results were also reported in another research which indicated that finger tapping velocity was the most powerful discriminators between PD patients and controls. 17 Lazzaro et al. 18 reported that toe tapping amplitude decrement, leg agility variability, and average velocity of time up and go test are good parameters to predict motor progression in PD. These studies indicate that motor performance of PD patients can be used to distinguish PD from HCs. However, different motor tasks may vary significantly from one task to another and different tasks or different kinematic features relate to different aspects of the disease.16–22 Nearly all the previous studies were limited by specific tasks which did not provide a full set of objective assessments of bradykinesia. There is a lack of unanimity about which motor task or which derived metrics are best to characterize PD. Our research extended previous studies and demonstrated that different motor tasks and different kinematic features exhibited different diagnostic value. A novel finding was that for different motor tasks, toe tapping exhibited the highest diagnostic value. Notably, when we performed the discrimination analysis excluding one task at time, we found the AUC decreased to 0.893 after toe tapping was excluded. However, the diagnostic performance was similar in other models which further supported our finding. Such a result was in accordance with a previous work which showed that among the bradykinesia-related motor tasks, heel-toe tapping contributed to a 12% increase in the accuracy of discriminating PD from HCs, but both pronation-supination movements of hand and leg agility contributed only for a 3% increase in accuracy. For different kinematic features, parameters reflecting motor dexterity such as speed and frequency are more helpful in the diagnosis of PD. Another novel finding of our research was that the combination of different motor tasks can significantly improve the discriminative power.
This study has several strengths. Firstly, in contrast to wearable sensors, the Kinect-based motion capture system would not affect the participant when collecting data. Secondly, the whole set device requires only one computer and one depth camera, making it low cost and easy to roll out in clinical practice. Thirdly, evaluating bradykinesia from subcomponents can objectively reflect multiple movement measures of one motor task. We also acknowledge some limitations of our research. Firstly, we did not include parameters that reflect sequence effect and irregularity in analysis. The relevant algorithms are being developed. Secondly, the sample size was relatively small which may influence the generalizability of our findings. Thirdly, PD patients that were enrolled in our research had taken anti-PD drugs. This might influence their motor performance.
Conclusion
The Kinect-based motion analysis system can be applied to evaluate bradykinesia in PD patients objectively and reliably. PD patients exhibited worse performance in motor tasks with different motor tasks and different kinematic features exhibiting diverse diagnostic values. Combining kinematic features from different motor tasks can significantly improve the diagnostic value.
Supplemental Material
sj-docx-1-dhj-10.1177_20552076231176653 - Supplemental material for Kinect-based objective evaluation of bradykinesia in patients with Parkinson's disease
Supplemental material, sj-docx-1-dhj-10.1177_20552076231176653 for Kinect-based objective evaluation of bradykinesia in patients with Parkinson's disease by Zhuang Wu, Hongkai Gu, Ronghua Hong, Ziwen Xing, Zhuoyu Zhang, Kangwen Peng, Yijing He, Ludi Xie, Jingxing Zhang, Yichen Gao, Yue Jin, Xiaoyun Su, Hongping Zhi, Qiang Guan, Lizhen Pan and Lingjing Jin in DIGITAL HEALTH
Footnotes
Acknowledgements
We would like to thank all the participants for their understanding and participation.
Contributorship
ZW, HKG, and RHH were involved in data curation, formal analysis, investigation, software development, visualization, and writing-original draft. ZWX, ZYZ, KWP, YJH, LDX, and JXZ participated in data curation and investigation. YCG, YJ, XYS, and HPZ were involved in data curation and software development. QG was involved in data curation and investigation. LZP and LJJ conceived the study, acquired funding, and reviewed and edited the manuscript. All authors have read and approved the final version of the manuscript.
Declaration of conflicting interests
The author(s) declared no potential conflicts of interest with respect to the research, authorship, and/or publication of this article.
Ethical approval
This research was approved by the Medical Ethics Committee of Tongji Hospital (IRB No. 2019-061).
Funding
This work was supported by the (1) the National Key Research and Development Program [grant number 2018YFC1314700]; (2) the Science and Technology Innovation Action Plan of Shanghai Municipal Science and Technology Commission [grant number 19441908000]; (3) the Clinical Technology Innovation Project of Shanghai Shenkang Hospital Development Center [grant number SHDC12020119]; (4) the Sub-project of the Yangtze River Delta Regional Innovation Community Project of Shanghai Municipal Science and Technology Commission [grant number 20642430100-1500230181/001]; and (5) Shanghai Blue Cross Brain Hospital Co., Ltd and Shanghai Tongji University Education Development Foundation
Guarantor
LJJ
Supplemental material
Supplemental material for this article is available online.
References
Supplementary Material
Please find the following supplemental material available below.
For Open Access articles published under a Creative Commons License, all supplemental material carries the same license as the article it is associated with.
For non-Open Access articles published, all supplemental material carries a non-exclusive license, and permission requests for re-use of supplemental material or any part of supplemental material shall be sent directly to the copyright owner as specified in the copyright notice associated with the article.