
Abstract
Objectives
The precise diagnosis of brain tumors using magnetic resonance imaging (MRI) presents several complex challenges. Traditional methods have primarily focused on grayscale anatomical data, often neglecting vital physiological indicators such as tissue temperature, which reflects metabolic activity. The main objective of this study is to develop an integrated AI-driven MATLAB framework that enhances tumor diagnosis accuracy by combining MRI features with thermal and textural biomarkers.
Methods
To address this gap, a comprehensive MATLAB pipeline was developed that integrates deep learning segmentation, morphological analysis, thermal estimation, texture quantification, and malignancy prediction, utilizing datasets from Kaggle and Figshare. The first step involved creating a specialized model to identify tumor regions and evaluate their size and shape. A compact three-layer convolutional neural network (CNN) was then employed to classify images into categories, including glioma, meningioma, pituitary tumor, and healthy tissue.
Results
It was found that gliomas had the most significant areas, ranging from 72.75 to 6365 mm2, and displayed the most irregular shapes. The CNN model achieved high accuracy, with near-perfect detection of healthy cases and an F1 score of 99.2%. However, the recall for pituitary tumors was 29%, and the precision for meningiomas was 48.6%, indicating areas for improvement. For temperature estimation, a formula was derived: T = 37.0 + 0.7 × log (1 + Area). This formula suggests that malignant lesions could reach temperatures as high as 42.2 °C, while benign tumors remained at or below 38.5 °C. Despite hardware limitations that limited training to eight of the planned 30 epochs, the results demonstrate the potential of combining thermal and textural biomarkers with MRI.
Conclusion
These findings demonstrate significant innovation potential and highlight the need to transition toward graphical processing unit-accelerated training to refine temperature baselines. By integrating multimodal features, major advances in clinical applications can be achieved, ultimately enhancing patient outcomes.
Introduction
Significant global health challenges are caused by brain tumors, which are linked to rising incidence rates and varied clinical outcomes depending on tumor type, size, and location.1–3 Accurate and early detection, along with assessment of malignancy, remains a significant challenge in neuro-oncology due to the diverse nature of tumor growth and its varied anatomical presentations. 4 MRI is considered the gold standard for brain tumor detection, providing superior soft tissue contrast and detailed anatomical visualization. However, traditional MRI diagnostics are often slow and rely heavily on radiologists’ expertise.5,6
Recent advances in artificial intelligence (AI), particularly deep learning (DL), and convolutional neural networks (CNNs), have been reported to transform image-based medical diagnostics. Tumor classification, segmentation, and prognosis are being automated with high accuracy using these technologies.6–10 Different models, including vision transformers (ViT),11,12 hybrid CNNs,13,14 and self-supervised learning approaches 10 have been demonstrated to deliver superior performance in MRI-based brain tumor analysis. These AI methods boost diagnostic efficiency and help standardize assessments, reducing subjective interpretation errors.
Despite these advancements, most current methodologies are recognized to depend exclusively on grayscale MRI data and neglect the physiological characteristics of tumors, such as temperature fluctuations. Thermal imaging, which has been historically employed in breast cancer detection,15,16 has demonstrated potential as a non-invasive adjunct in neurological conditions.17–19 Tumors frequently exhibit increased metabolic and vascular activities, leading to localized temperature elevations that can be visualized via pseudo-colored thermal overlays derived from image features.18,20,21 Consequently, temperature is proposed as a crucial physiological marker of tumor aggressiveness, particularly when associated with tumor size, vascularity, and metabolic activity.15,17,20
To address this gap, this study presents a new approach in MATLAB that combines tumor segmentation, temperature estimation, and malignancy prediction from grayscale MRI images via pseudo-coloring and texture analysis. U-Net is used for segmentation, while a CNN performs classification. Additionally, tumor size helps estimate temperature using a logarithmic function. Furthermore, gray-level co-occurrence matrix (GLCM) features, contrast, correlation, energy, and homogeneity are employed to further evaluate malignancy. GLCM-based feature extraction offers insights into tumor heterogeneity, facilitating the distinction between benign and malignant tumors.22–24 This research also investigates how thermal pseudo coloring (using “hot” colormaps) supports the annotation of tumor conditions, thermal mapping, and physiological modeling of tumor regions. Furthermore, the study extends existing literature by integrating AI-driven MRI analysis with a thermal estimation pipeline. Previous research has demonstrated high classification accuracy using CNNs and ViT5–7; however, the thermal or physiological context of tumors is often overlooked. Earlier studies have emphasized the importance of combining thermal data12,17; however, a comprehensive computational model linking tumor size to temperature remains lacking. This work addresses that gap by incorporating pixel-to-temperature conversion and malignancy classification based on size and GLCM features. The main contributions of this work are summarized as follows:
A unified MATLAB-based AI pipeline is developed for detecting brain tumors, integrating segmentation, classification (via CNN), thermal estimation, and grading malignancy. A physiological model for temperature estimation is proposed based on tumor area (mm2) using logarithmic transformation and thermal color encoding. Malignancy classification is performed using GLCM texture metrics (contrast, correlation, energy, and homogeneity) and their relationships with temperature and size.
The model's performance is evaluated using classification metrics (accuracy, precision, recall, F1-score, and IoU), as well as visualizations of outputs, including thermal overlays and annotated predictions.
Literature review
Brain tumors are among the most complex and life-threatening conditions affecting the central nervous system, especially in both pediatric and adult populations.1,2 Despite ongoing advances in imaging techniques such as MRI, CT, and PET, the difficulties in early detection and precise tumor grading remain significant due to the heterogeneity of tumor biology and presentation.3,4 The use of AI integrated with medical imaging has become a promising approach to improve diagnostic accuracy, efficiency, and objectivity in detecting brain tumors.5,6
AI-based methods, particularly CNNs and transformers, have demonstrated exceptional performance in tumor classification using MRI scans. For example, a deep learning model created by Aleid et al. 5 successfully classified MRI brain images with high accuracy, aiding early detection. Similarly, Li 7 highlighted AI's effectiveness in both tumor segmentation and classification through improved feature extraction. At the same time, Kaifi 6 emphasized the growing role of AI in clinical decision-making. Additionally, advanced architectures, such as hybrid ViT-GRU, 13 Swin transformers, 12 and CNN-transformer combinations, 8 have been used recently to improve generalization and classification accuracy.
Alongside conventional MRI analysis, the potential of thermographic imaging for detecting tumors is actively being explored. Thermography detects surface temperature changes that indicate underlying physiological alterations, such as increased vascularity and metabolic features typically linked to malignant tumors.15,16,20 Notably, studies on breast cancer have shown a link between tumor-driven vascularization and thermal hotspots,15,16 thus supporting the biological plausibility of using temperature distribution for tumor localization.
While thermal imaging has traditionally been used in breast oncology,15,19 its application to brain tumor studies is increasingly explored. Bousselham et al. 17 investigated how brain tumors affect MRI images by examining their impact on local temperature distribution, driven by the anisotropic properties of brain tissue. This aligns with the theoretical model proposed by Owens et al., 21 who simulated metabolic heat production caused by tumors, indicating that tumor growth can be evaluated through thermal measurements. Infrared imaging, as reviewed by Ring and Ammer, 18 holds additional potential for non-invasive diagnosis; however, issues related to skull insulation and deep tissue thermal transfer must be addressed.
Emerging AI systems are adept at mapping pixel intensity and spatial features to thermal estimates, thereby enhancing tumor characterization beyond visual perception. For example, Wahab et al. 19 have demonstrated the ability of neural networks to localize tumors based on thermographic patterns. Furthermore, the development of dynamic vascular imaging utilizing active thermography has been advanced by Gershenson and Gershenson, 23 reinforcing the significance of temperature modeling in tumor diagnostics.
The interaction between AI and thermal imaging is considered crucial, particularly because malignant tumors often produce higher metabolic heat than benign tumors. These differences can potentially be learned and generalized by deep learning models, making thermal cues a useful modality in multimodal diagnostic systems. Moreover, the effect of tumor temperature on treatment results, particularly with immune-based therapies, has been highlighted by Knapp et al. 20
Despite these advancements, a significant research gap remains in integrating AI-driven thermal analysis for the detection of brain tumors. Most existing studies either focus on MRI-based AI models10,11,14,24 or on thermography specifically related to breast cancer detection. Only a few investigations, such as those by Bousselham et al. 17 and Berghout, 22 have successfully connected these areas, revealing an untapped opportunity for interdisciplinary innovation. An AI system that combines grayscale MRI, pixel-wise thermal estimation, and deep learning classifiers has the potential to enhance diagnostic accuracy and assist with malignancy grading, prognosis, and treatment planning.
Recent advancements in medical image computing, particularly those highlighted at the MICCAI (Medical Image Computing and Computer-Assisted Intervention) conferences and the BraTS (Brain Tumor Segmentation) challenges, have established transformer-based and hybrid architectures as leading approaches for brain tumor segmentation and grading. The nnU-Net framework has emerged as a standard for fully automated biomedical segmentation due to its self-configuring architecture and reproducibility. 25 Similarly, Swin transformer-based and ViT models have demonstrated improved effectiveness in capturing long-range dependencies within MRI data, thereby enhancing both sensitivity and generalization.26,27 Moreover, hybrid CNN-transformer methodologies and 3D U-Net variants presented in the MICCAI 2023 and 2024 BraTS challenges have achieved Dice coefficients exceeding 0.90 for high-grade gliomas, underscoring the effectiveness of attention mechanisms and multi-scale feature fusion for accurate tumor delineation.11,12,28
Despite these advancements, few studies have explored integrating thermal estimation with deep learning and textural biomarkers for diagnostic interpretation. Existing BraTS-related frameworks primarily focus on segmentation accuracy and volumetric consistency, but often overlook physiological factors, such as the distribution of metabolic heat.17,18,21 This presnt study addresses this gap by combining CNN-based MRI segmentation with a bioheat-inspired temperature estimation model and GLCM-based texture features. This integration provides a physiologically interpretable layer that goes beyond traditional architectures.25–29 A comparison table is created, as shown in Table 1, for the related work on brain tumors and thermography, specifically thermal or temperature estimation from tumors.
Comparison with other related works on brain tumors with thermal estimation.

BT: brain tumor; CNN: convolutional neural network; Tr: transformer; Th: thermal (thermography, temperature); GLCM: gray-level co-occurrence matrix; Soft: software (MATLAB); MRI: magnetic resonance imaging; AI: artificial intelligence.
Methodology
This section outlines the steps involved in applying deep learning to segment and classify brain tumors using MRI images, thereby meeting research objectives. This methodology encompasses the collection and preprocessing of datasets, the design and training of a custom CNN, performance assessment, the application of thermal mapping to images for estimating the temperature of brain tumors, and system setup. Based on this research, a workflow for the entire process implemented in the system is presented in Figure 1.

Pipeline workflow of brain tumor analysis.
Datasets and preprocessing
In this study, we used extensive MRI brain image datasets from publicly accessible sources, specifically Kaggle.com and Figshare.com. These datasets comprise a diverse collection of brain tumor MRI images, each serving different purposes: the Figshare dataset is intended for image segmentation, while the Kaggle dataset focuses on classification. The Figshare dataset, created by Jun Cheng, features 3064 T1-weighted contrast-enhanced MRI images that clearly depict three main types of brain tumors: meningioma (with 708 files), glioma (with 1426 files), and pituitary tumors (with 930 files). 32 Each file is carefully organized in MATLAB format, providing tumor type identification, tumor masks, and additional data for detailed analysis. In contrast, the Kaggle dataset combines images from three different sources: the Figshare dataset, the SARTAJ dataset, and the Br35H dataset. Overall, it includes 7023 MRI brain images categorized into four classes: glioma, meningioma, no tumor, and pituitary. The non-tumor images, specifically the “no tumor” files, were explicitly sourced from the Br35H dataset, following the instructions from the dataset's author, Masoud Nickparvar. 33 The datasets obtained from Kaggle and Figshare consist solely of brain tumor images and do not include any clinical metadata. This choice was made intentionally to avoid discussions about sensitive topics such as histopathology and patient demographics, including age, sex, and medical history, information that is considered private and must be protected. Although clinical validation is lacking in these datasets, their reliability is supported by prior usage and documentation from numerous researchers in various studies, whether related to or distinct from the focus of this investigation.
This Kaggle dataset is carefully organized into two main groups: training and testing. Both groups include all tumor types, as well as images labeled “no tumor.” The distribution of these classes is clearly shown in Table 2 for reference. The images are stored in high-quality JPG format, providing good visual detail. However, in the testing directory, the files for each tumor type, excluding the no-tumor category, have been replaced with images from the segmentation directory, where the MATLAB data has been converted to high-resolution PNGs. These PNG files were randomly selected for each tumor type, enhancing our study's analytical capabilities by preserving important image data at higher resolution than the standard JPG format. This systematic approach not only improves the quality of our analysis but also deepens our understanding of brain tumors through detailed imaging. The use of high-resolution PNG images during the testing phase was introduced to address the inconsistent and unreliable classification results observed with the original low-quality JPG dataset. In that dataset, even non-tumor images were sometimes misclassified as tumor cases. The higher-resolution PNG dataset improved feature clarity and overall diagnostic reliability. To prevent potential bias or data leakage, all data were randomly shuffled and preprocessed before model training and testing, ensuring complete separation between the training and test sets. This approach enhanced model accuracy while maintaining the integrity of the experimental evaluation.
Brain tumor datasets from Kaggle and Figshare.

Once the images are obtained, the preprocessing stage begins. This involves transforming the images into grayscale to simplify the data and highlight essential features. Following this, a Gaussian filter is applied to improve the overall clarity and quality of the images by reducing noise and smoothing out any irregularities. Finally, each image is resized to a uniform 256 × 256 pixels, ensuring a consistent input image size for both segmentation and classification tasks. This meticulous approach lays the groundwork for accurate analysis and interpretation.
Proposed model
In this section, we convert MATLAB files into high-quality PNG images, enabling detailed analysis of tumor detection. To highlight the tumor, we add a prominent red border around the identified area. For effective tumor segmentation, we use a dedicated data store where the tumor mask is precisely defined, enabling us to extract the tumor from surrounding tissue. This extracted region is labeled as “image1_mask.” Additionally, to clearly show the tumor's location within the context of the original image, we create an overlay called “image1_overlay.” The diagram in Figure 2 illustrates the entire pipeline involved in this process.

Workflow for segmentation tasks.
For segmentation, various techniques are used in brain image processing to analyze the statistics or properties of each generated image. This includes measuring the area, diameter, and perimeter of the brain tumor using MATLAB data, which are then expressed in millimeters, given the spatial resolution of 0.5 mm per pixel. In medical image processing, particularly for brain MRI analysis, a resolution of 0.5 mm per pixel is commonly adopted because it offers a good balance between diagnostic accuracy and computational efficiency. Literature supports that this resolution provides sufficient anatomical detail to identify small lesions and tumor boundaries without incurring excessive processing power. 28 Standardizing to 0.5 mm/pixel also ensures consistent measurement of tumor area and volume, which is essential for clinical evaluation and AI model training. Studies indicate that resampling images to this resolution enhances cross-patient comparisons and enables more reliable feature extraction, including size-dependent metrics such as malignancy estimation or temperature mapping. 26 Therefore, 0.5 mm/pixel serves as a practical standard in both clinical and computational workflows for analyzing brain tumors.
After completing the segmentation task, a selection of random samples from the MATLAB dataset, which contains high-quality images of various brain tumors, is organized and placed in the Testing folder within the Classification directory. This random sampling comprises 300 detailed images of gliomas, 306 images of meningiomas, and 300 images of pituitary tumors, all of which are vital for further analysis. Each image is carefully saved as a PNG file to ensure clarity and consistency and is paired with its corresponding MATLAB data. This comprehensive dataset is crucial for assessing the performance of classification algorithms during testing.
Classification
In this study, a CNN was created to classify different types of brain tumors using grayscale MRI images. The CNN was trained on a well-organized dataset, divided into separate folders for four tumor categories: glioma, meningioma, pituitary tumors, and “no tumor.” This clear organization improved data management and retrieval.
Before training, the MRI images were preprocessed to ensure consistency and accuracy. This involved resizing the images to a fixed input dimension of 256 × 256 pixels while maintaining a single grayscale channel. Such standardization was essential for uniform image processing. The CNN architecture was carefully designed, consisting of three convolutional blocks, each followed by batch normalization to stabilize learning, ReLU activation to introduce non-linearity, and max pooling to downsample the feature maps. In the first convolutional layer, 16 filters were used to identify basic features, while the second layer employed 32 filters to capture more complex patterns. The third layer enhanced this further with 64 filters to detect intricate brain tumor features. A kernel size of 3 × 3 was consistently used across all layers, with padding set to “same” to ensure that the output feature maps maintained the exact spatial dimensions as the input images, thereby preserving critical edge information during convolution. After the final convolutional block, a fully connected layer produced four outputs corresponding to the tumor classes. This was followed by a softmax layer and a classification layer that converted network outputs into probability distributions for each class. The CNN was trained using the Adam optimizer, a robust algorithm suitable for deep learning, over 30 epochs with a mini-batch size of 32 images. The dataset was divided into 80% for training and 20% for validation to thoroughly evaluate the model's performance, as shown in Figure 3.
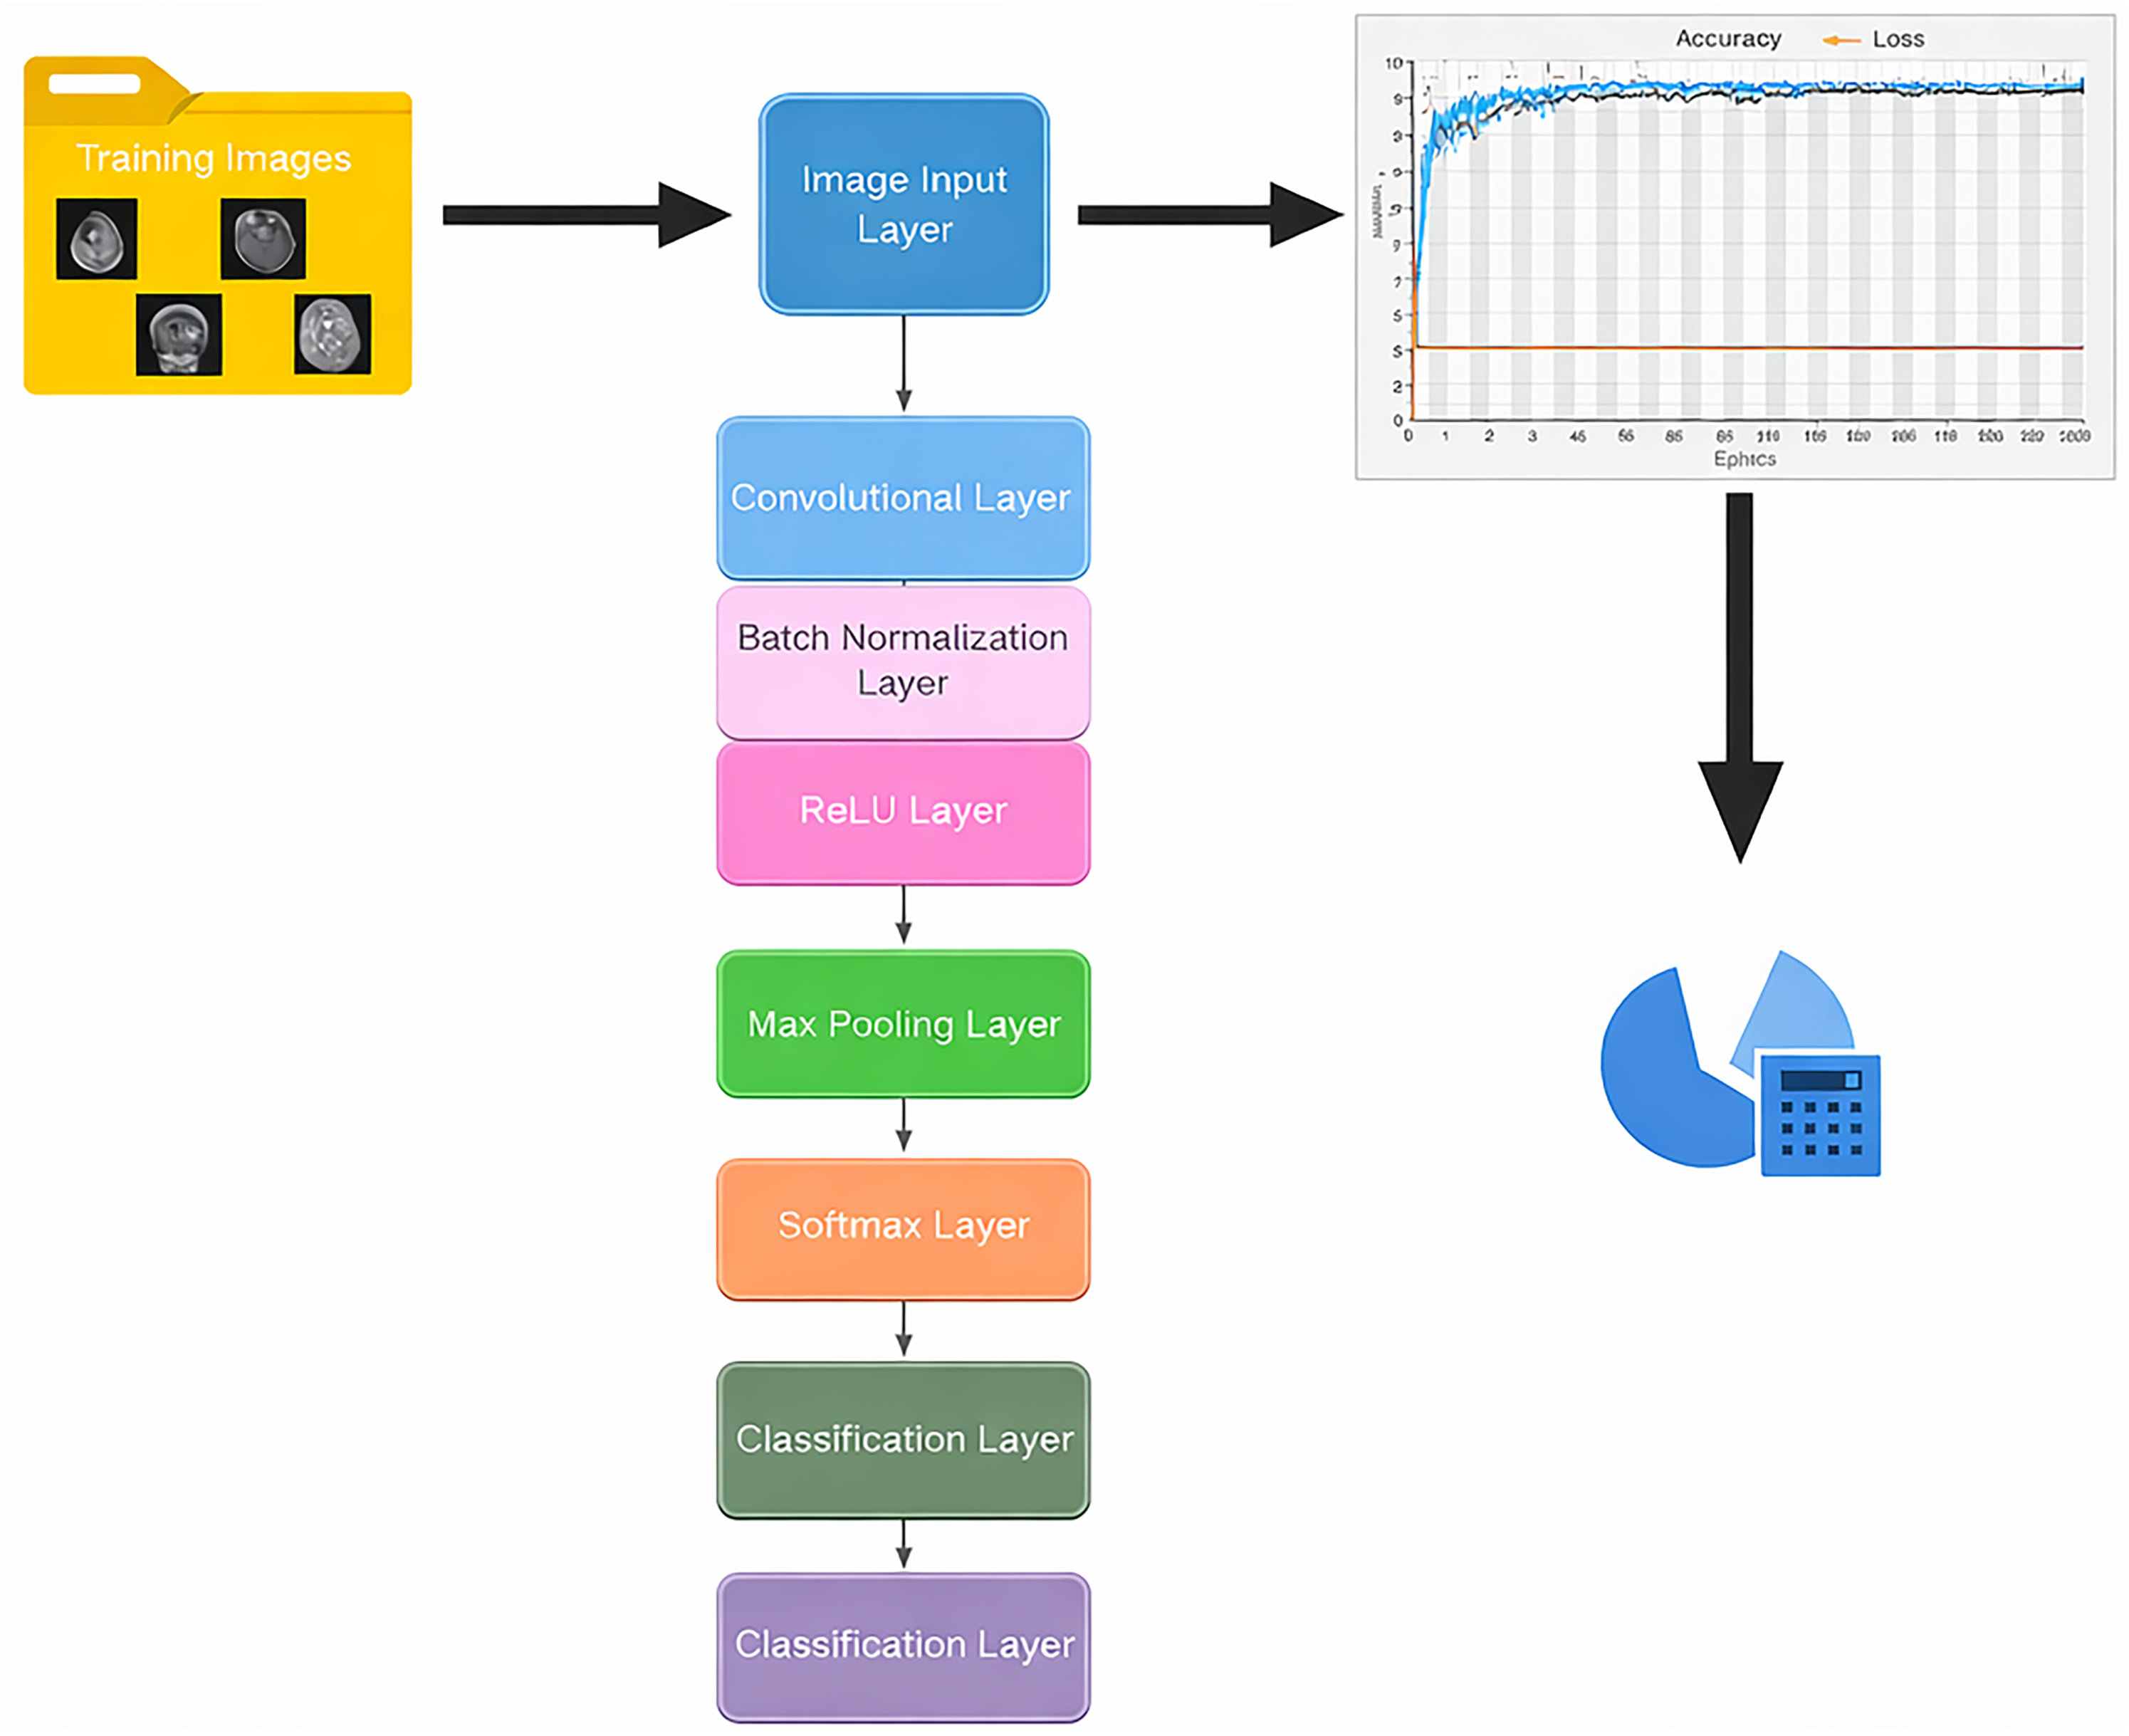
Classification analysis architecture system.
To improve the training process, grayscale image data were processed through an augmented image datastore without any color conversion, as the images were already in a single-channel grayscale format. This method enabled various data augmentation techniques, increasing the diversity of the training dataset. During the training, progress was carefully logged, including accuracy and loss metrics for both the training and validation sets, into a CSV file. This documentation was key for later analysis and performance assessment. The CNN-based approach developed allowed automated feature extraction and classification of brain tumor MRI images, significantly improving the reliable identification of multiple tumor types. This method has strong potential to enhance diagnostic accuracy in clinical settings.
Feature extraction
To improve classification reliability and the biological interpretability of results, a comprehensive set of features was extracted from MRI brain tumor images during testing. This feature extraction included thermal estimation, morphological characterization, texture analysis using the GLCM, and an evaluation of segmentation quality. Initially, tumor regions were segmented from grayscale images with multilevel Otsu thresholding, followed by the creation of binary masks. The morphological properties of the tumors—such as area, major axis length, circularity, and centroid were calculated using the regionprops function. The area was expressed in square millimeters (mm2) by multiplying the pixel count by the square of the pixel resolution, as shown in the following equations:

This section also focuses on estimating the tumor's localized temperature using a logarithmic thermodynamic model. This model assumes that larger tumors exhibit heightened metabolic activity, which, in turn, influences their thermal characteristics. The specific formula utilized for this calculation is defined in the following equation:
Furthermore, texture features were extracted utilizing the GLCM method at four directional offsets: [0, 1], [−1, 1], [−1, 0], and [−1, −1]. This technique effectively captures the spatial relationships between pixel intensities. From the GLCM, statistical measures, including contrast, correlation, energy, and homogeneity, were derived using the “graycoprops” function, as defined by equations (4) to (7). The directional means of these measures were then calculated to provide a comprehensive summary of texture heterogeneity.
Contrast measures intensity variation
Correlation quantifies gray-level linear dependency
Energy reflects textural uniformity (angular second moment)
Homogeneity evaluates the closeness of the distribution to the diagonal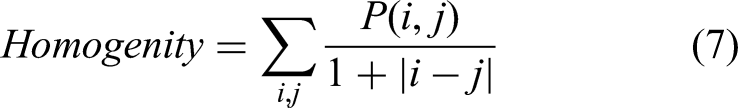
To evaluate the quality of the segmentation used for thermal and morphological analysis, several assessment metrics were computed, including the dice similarity coefficient (DSC), the intersection over union (IoU) ratio, and the Hausdorff distance (HD). These metrics were determined by comparing the predicted tumor masks to the available ground truth masks. Accurate tumor localization is considered essential for reliable downstream feature computation. The extracted features and performance metrics were meticulously recorded and saved into structured CSV files for further analysis and reproducibility.
Explainability
To classify brain tumors as benign or malignant, the proposed methodology integrates a CNN classification with domain-specific post-processing that incorporates morphological, thermal, and textural cues. Following the segmentation and classification of tumor regions using the CNN, the analysis focuses on shape descriptors, including area, diameter, perimeter, and circularity, through the application of the regionprops function. Tumor size is determined by converting the pixel-based area into physical units (mm2), utilizing a pixel resolution of 0.5 mm/pixel. Typically, benign tumors present smaller sizes (< 600 mm2), rounder shapes (with circularity exceeding 0.7), and smoother boundaries. In contrast, malignant tumors tend to be larger and exhibit more irregular growth patterns, characterized by lower circularity and increased perimeter.
A thermal estimation model is employed to reflect the biological metabolic activity of the tumor, where the temperature is calculated as indicated in equations (2) and (3). Tumors with an estimated temperature of 38.5 °C or higher are identified as malignant, while those below this threshold are classified as benign. Furthermore, textural analysis utilizing the GLCM is performed to assess heterogeneity within the tumor regions. Features such as contrast, correlation, energy, and homogeneity are extracted from multiple directions. High contrast coupled with low homogeneity typically indicates disordered and invasive malignant tissues, whereas benign tumors exhibit greater textural uniformity. The fusion of deep learning predictions with feature-based evaluations creates a robust and interpretable framework for tumor grading that aligns with insights from radiology and thermal physiology. All results, including malignancy status, temperature, and GLCM statistics, are compiled and summarized in CSV format to ensure reproducibility and facilitate clinical analysis.
Performance evaluation
The evaluation of the brain tumor detection framework unfolds in two critical stages: the assessment of segmentation performance and the evaluation of classification performance, accompanied by a detailed analysis of thermal estimation accuracy.
To assess classification performance, the model's outputs were rigorously compared with labeled test data, yielding a confusion matrix. This matrix meticulously captures four essential metrics: true positive (TP), which represents the accurately identified tumor cases of a specific type; false positive (FP), highlighting instances where non-target classes were incorrectly classified as a particular tumor type; false negative (FN), indicating actual tumor instances that were either overlooked or misclassified; and true negative (TN), which denotes cases of non-tumor or different tumor types that were correctly identified and rejected.
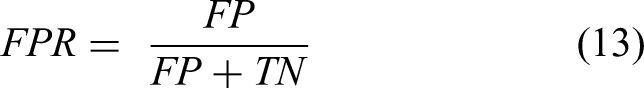
From these fundamental quantities, a spectrum of evaluation metrics was computed to provide a comprehensive understanding of the model's performance. Accuracy, which reflects the model's overall correctness, provides a broad view of its effectiveness. Precision, on the other hand, measures the reliability of the model's optimistic predictions, while recall (also known as sensitivity) quantifies its ability to accurately detect actual tumor cases. Specificity complements these metrics by indicating the actual rejection rate of non-tumor instances. Furthermore, the F1-score is a harmonic mean that balances precision and recall, providing a unified measure of effectiveness. In addition to these, several crucial rates were calculated to enrich the performance analysis: the false positive rate (FPR) and the false negative rate (FNR), which provide insights into the model's errors, and the Matthew correlation coefficient (MCC), which offers a balanced evaluation, particularly advantageous in scenarios involving class imbalance. The mathematical formulations for these metrics, spanning equations (8) to (15), provide further clarity on the rigor and completeness of the evaluation framework.


To evaluate segmentation quality, the overlap and boundary alignment between the predicted and ground truth masks were quantified using several established metrics. The DSC was used as a key measure of similarity, comparing the predicted masks (A) to the ground truth masks (B). This coefficient captures the extent to which the two masks overlap, providing a clear indication of their similarity. Additionally, the IoU metric was used to assess the overlap between the predicted segmentation and the ground truth. This metric provides insights into the spatial accuracy of the predictions, revealing how well the predicted regions align with their authentic counterparts. To further illustrate the precision of the boundary delineation, the HD was calculated to quantify the maximum discrepancy between the predicted and reference masks. These metrics highlight areas where the predictions may fall short, accurately representing the proper boundaries. In assessing thermal estimation accuracy, the mean absolute error (MAE) and the root mean squared error (RMSE) were calculated. These metrics gauge the differences between the predicted brain temperatures and the actual measured temperatures, allowing the predictive performance to be evaluated quantitatively. The coefficient of determination (R2) was also utilized to indicate how well the predictions fit the observed data, providing a comprehensive view of the model's effectiveness. The specific formulas for these metrics are detailed in the following equations:


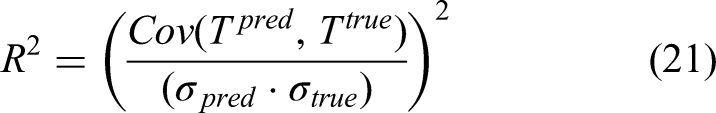
The variables Tpred and Ttrue represent the predicted and actual brain temperatures, respectively, with a standard reference temperature of 37 °C, which is considered normal for healthy tissue. These metrics serve as essential tools for a thorough evaluation of the model's predictive capabilities, focusing on three critical areas: tumor identification, segmentation accuracy, and physiological temperature estimation. Using these metrics, the effectiveness of the thermal mapping model in accurately reflecting complex physiological behaviors related to tumor presence and metabolic activity is validated, demonstrating how temperature changes correlate with underlying biological processes within the body.
System configuration
The analysis for this project on segmentation and classification was executed on a desktop computer equipped with an Intel Core i7-4790 CPU, clocked at 3.60 GHz, 4 GB of DDR3 RAM, an SSD hard drive, Intel HD Graphics 4600, and an NVIDIA GeForce graphics card. Despite the operating system's limited graphics and RAM capabilities, the Execution Environment in MATLAB's network training options was set to “auto” or “cpu” to mitigate out-of-memory issues and ensure smooth operation. The analysis utilized MATLAB 2025a, an updated version of the Deep Learning Toolbox and the Image Processing Toolbox, along with other relevant tools for executing and analyzing brain tumors. This included processes such as classification, GLCM analysis, temperature estimation, and performance evaluation.
Results
Segmentation results
Figure 4 illustrates the segmentation of a tumor extracted from a database of T1-weighted MRI brain images. Using MATLAB, the tumor mask data were used to identify and delineate the tumor's boundaries. The figure prominently features an overlay in striking red that clearly outlines the tumor on the brain image, enhancing visual distinction and emphasizing the area of interest for further analysis.
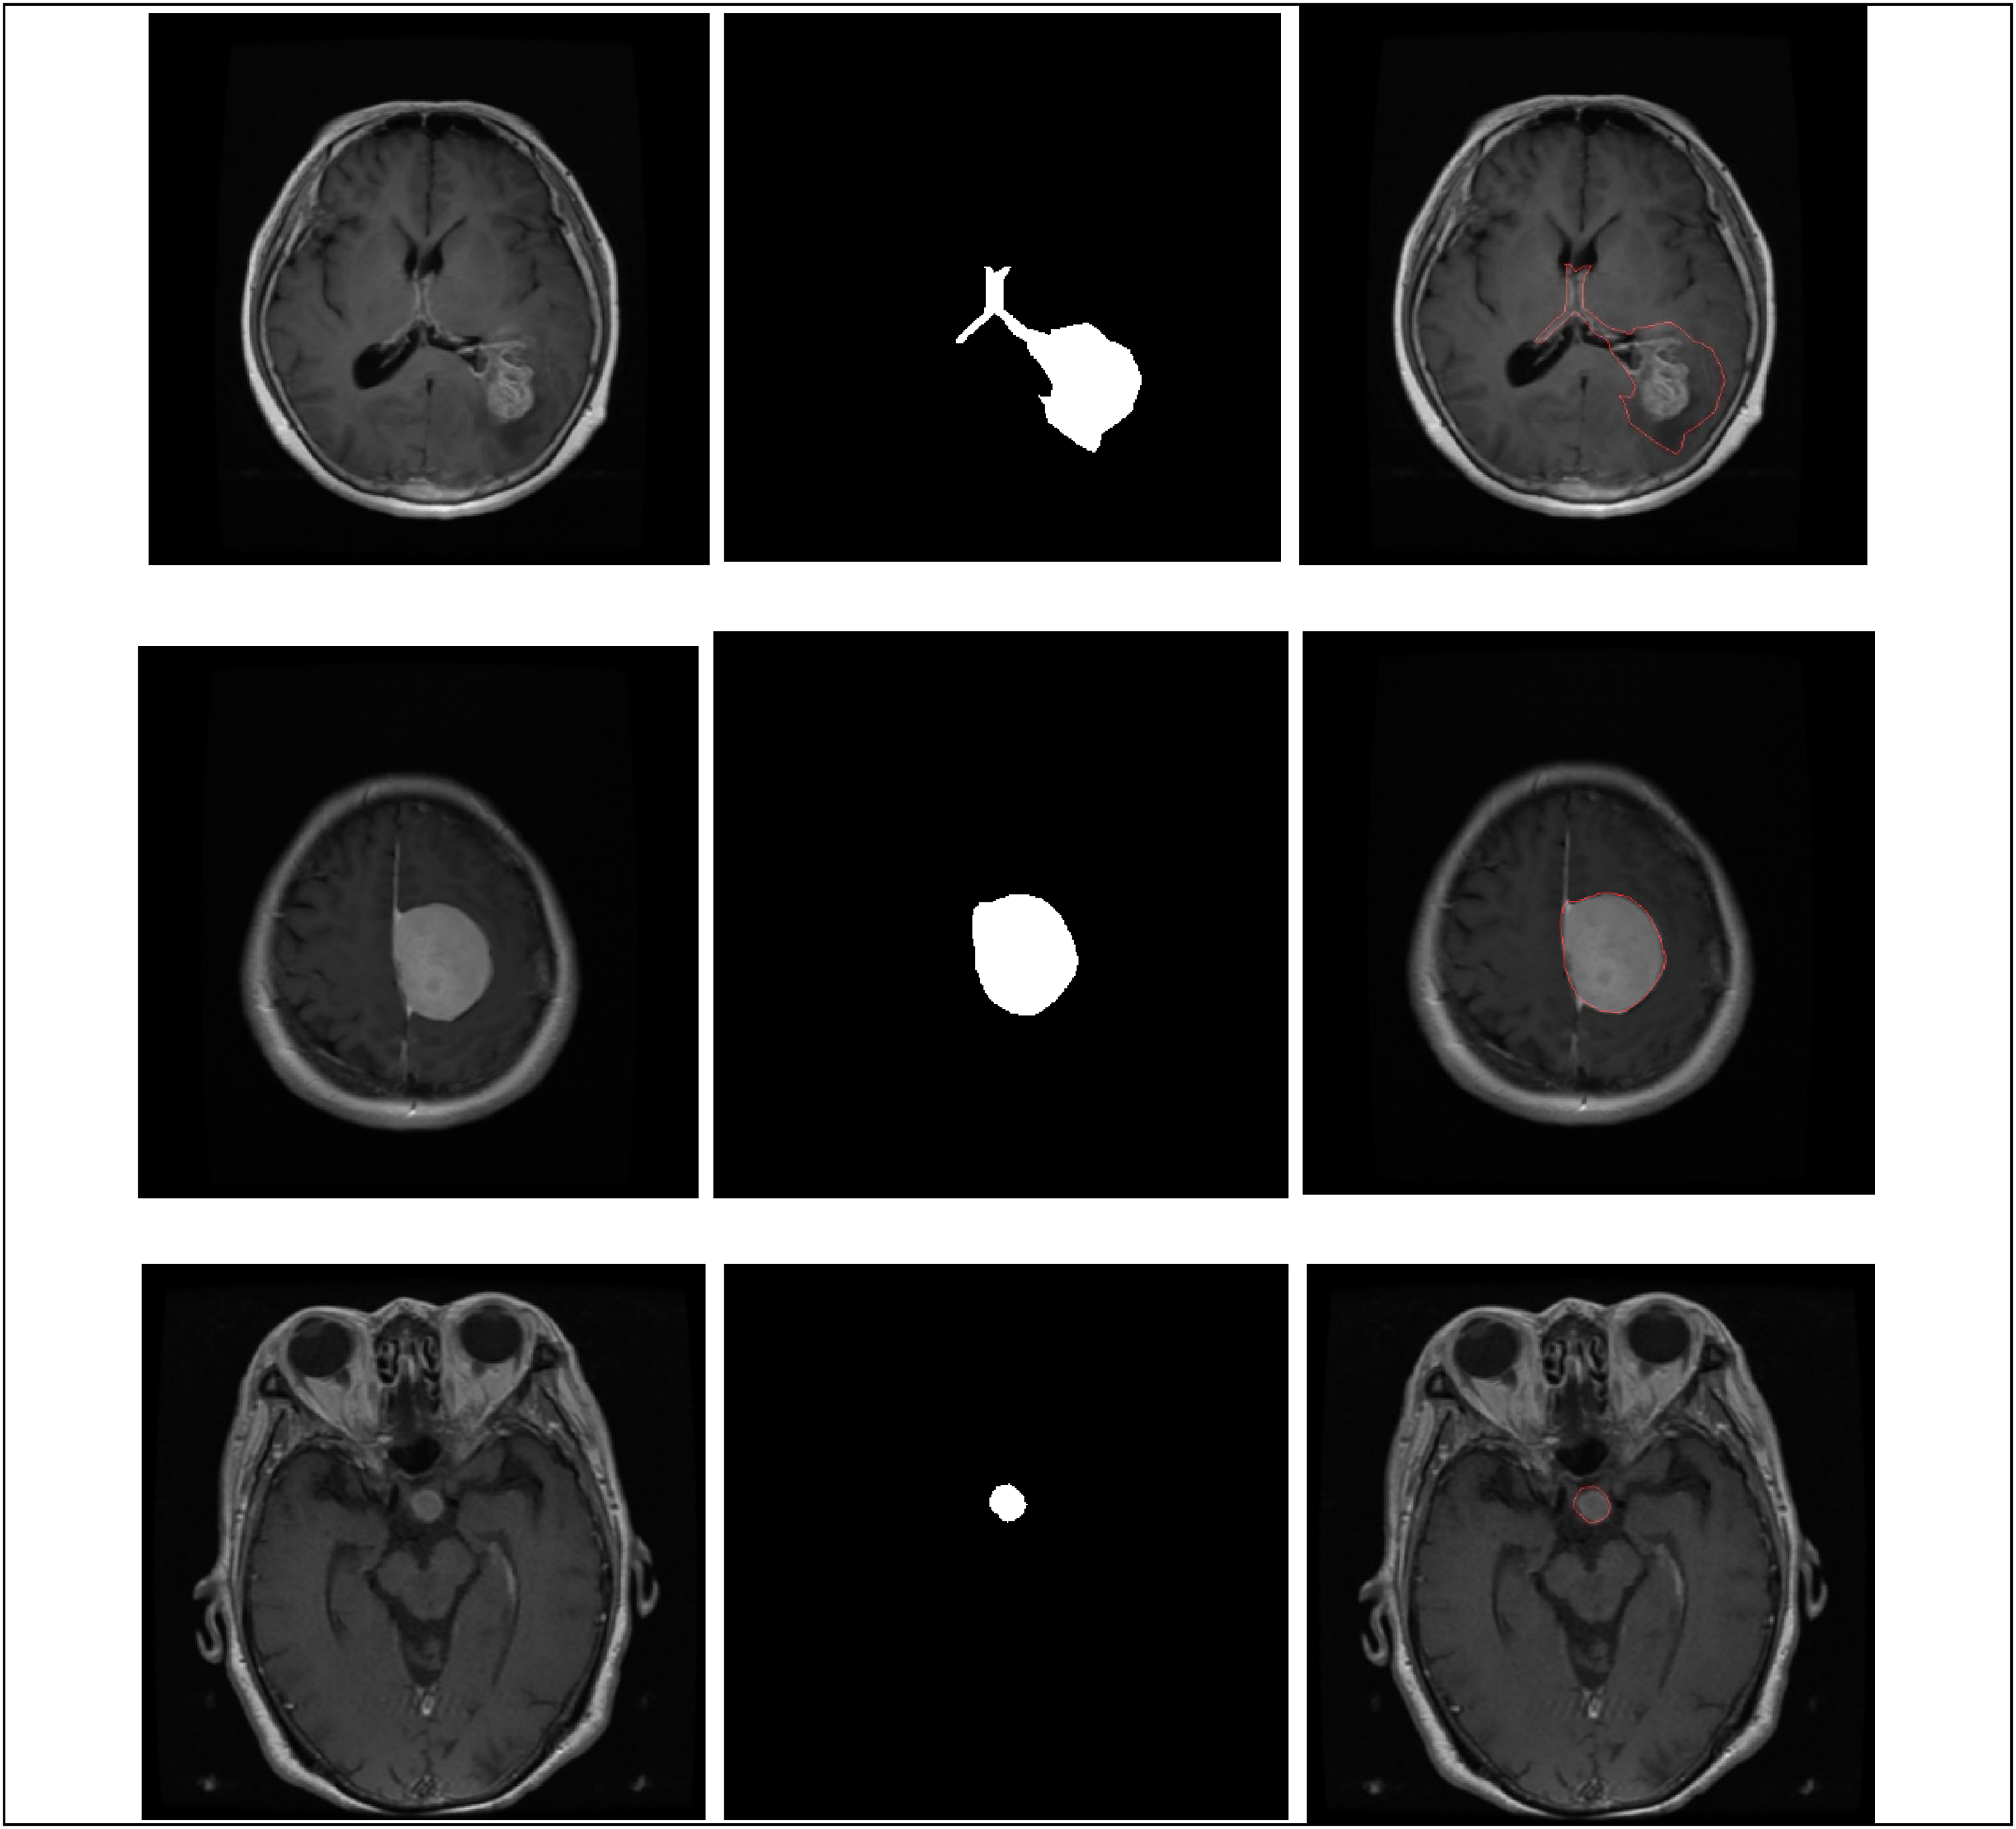
Segmentation of tumor from tumor mask for each tumor type: glioma, meningioma, and pituitary tumor.
Following the comprehensive segmentation of tumor regions within a robust dataset comprising 3064 labeled magnetic resonance images, specifically 1426 gliomas, 708 meningiomas, and 930 pituitary adenomas, quantitative morphological and radiological features were meticulously extracted utilizing the generated segmentation masks. These features included critical metrics such as tumor area, major axis length (diameter), perimeter, mean grayscale intensity, and circularity. The computations were conducted using standardized image processing functions (e.g. regionprops), with a physical scaling factor of 0.5 mm per pixel applied to obtain spatially calibrated measurements in millimeters.
The analysis of the segmentation data identified three distinct tumor entities, each exhibiting significant morphological variability. Gliomas demonstrated pronounced size heterogeneity, with tumor areas ranging from 72.75 to 6365.25 mm2. The diameters of these tumors varied widely, ranging from 10.41 mm to an impressive 163.19 mm, and their perimeters reached 546.17 mm, underscoring their frequently expansive and infiltrative nature. In contrast, meningiomas typically exhibited a more compact, well-defined morphology, with a maximum area of 3805.00 mm2, indicative of their generally less invasive growth characteristics. Pituitary tumors ranged in size from small nodules measuring 40.75 mm2 to larger masses up to 2921.00 mm2, highlighting the variability within this tumor category, as shown in Tables 3 and 4.
Minimum value of properties recorded for each tumor type.

Maximum value of properties recorded for each tumor type.
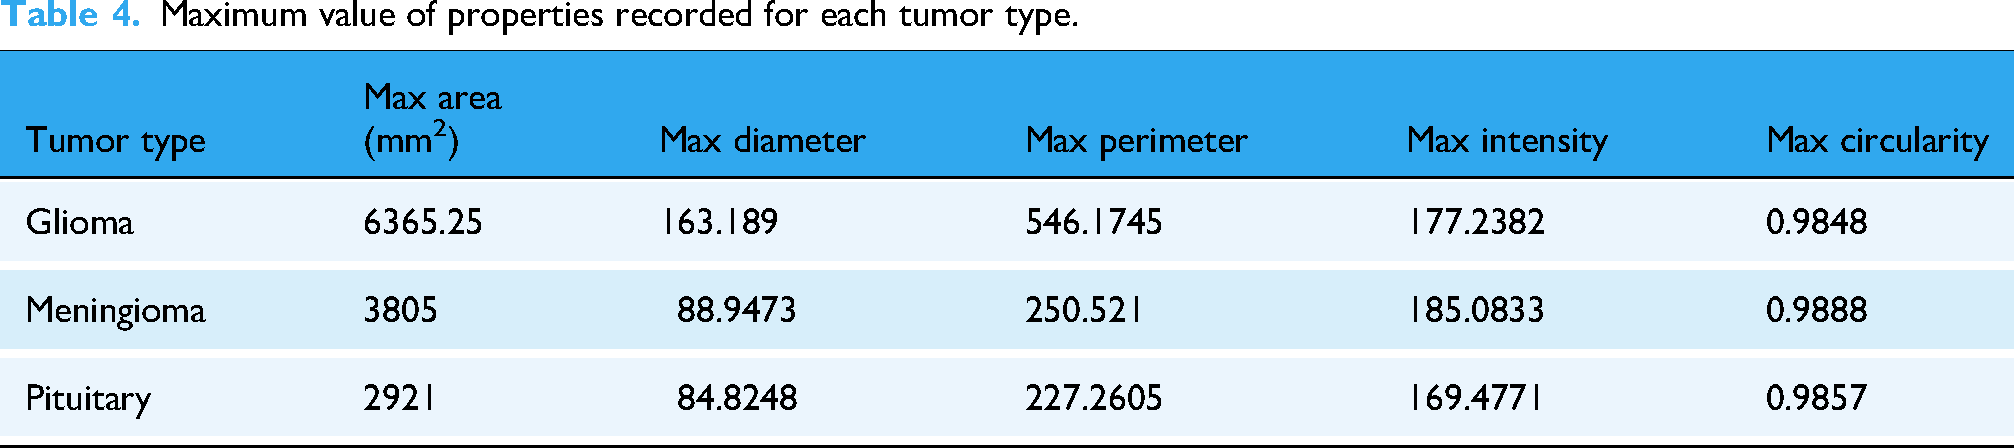
Furthermore, the analysis revealed significant differences in mean grayscale intensity values across the tumor regions, thereby contributing to the understanding of their biological characteristics. Gliomas exhibited the widest distribution of intensity values, ranging from 16.72 to 177.24, likely reflecting their tissue heterogeneity and diverse cellular composition. Circularity, a measurable metric indicating deviation from a perfect circle, also helped distinguish between tumor types: meningiomas showed notably high circularity values, approaching 0.99, suggesting smooth, well-defined shapes. Conversely, gliomas frequently displayed irregular, convoluted contours, with a minimum circularity of 0.26, suggesting infiltrative growth patterns and aggressive behavior.
A detailed summary of the extracted features is provided in Table 3, which lists the ranges of minimums (40.75 mm2, 7.72 mm in diameter, 22.38 mm in perimeter, 16.72 intensity, and 0.26 circularity) and maximums (6365.25 mm2, 163.19 mm, 546.17 mm, 185.08 intensity, and 0.99 circularity), with gliomas and pituitary tumors notably contributing to the observed extremes.
Classification results
A CNN was created in MATLAB to classify brain tumors into four categories: glioma, meningioma, pituitary, and no tumor. This classification used axial MRI slices. The model was trained on a dataset of 5712 preprocessed grayscale images, with the following distribution: glioma (1321 images), meningioma (1339 images), pituitary (1457 images), and no tumor (1595 images). The dataset was divided into training and validation sets, with 80% for training and 20% for validation, using randomized stratification.
To prepare the images for input, they were standardized to dimensions of 256 × 256 × 1 using an augmented Image Datastore, which preserved their grayscale characteristics without any color transformation. The network architecture consisted of three convolutional blocks, each utilizing consistent 3 × 3 filter sizes and “same” padding to preserve spatial resolution before downsampling. The sequential layers of the network included:
An initial convolutional layer with 16 filters, accompanied by batch normalization and ReLU activation. A max-pooling layer with a 2 × 2 stride to achieve spatial reduction. A second convolutional layer featuring 32 filters, also followed by batch normalization and ReLU activation. Another identical pooling layer. A final convolutional layer with 64 filters, once again followed by batch normalization and ReLU activation.
The resulting feature maps are flattened and fed into a fully connected layer with four nodes, corresponding to the output classes, followed by a SoftMax layer and a classification layer.
The training process used the Adam optimizer over 30 epochs with a mini-batch size of 32. Validation was performed every 30 iterations to monitor the model's generalization ability, as shown in Figure 5. According to the figure, system operation was manually stopped at the end of epoch 8. The training process was manually halted when the model reached its highest accuracy, as compared to other simulations. Throughout the modeling and training phases for segmentation and classification, numerous tests were conducted by varying the batch size and the number of epochs, while the system's accuracy was monitored. The peak accuracy was recorded during the eighth simulation, which was intentionally stopped at epoch 8.
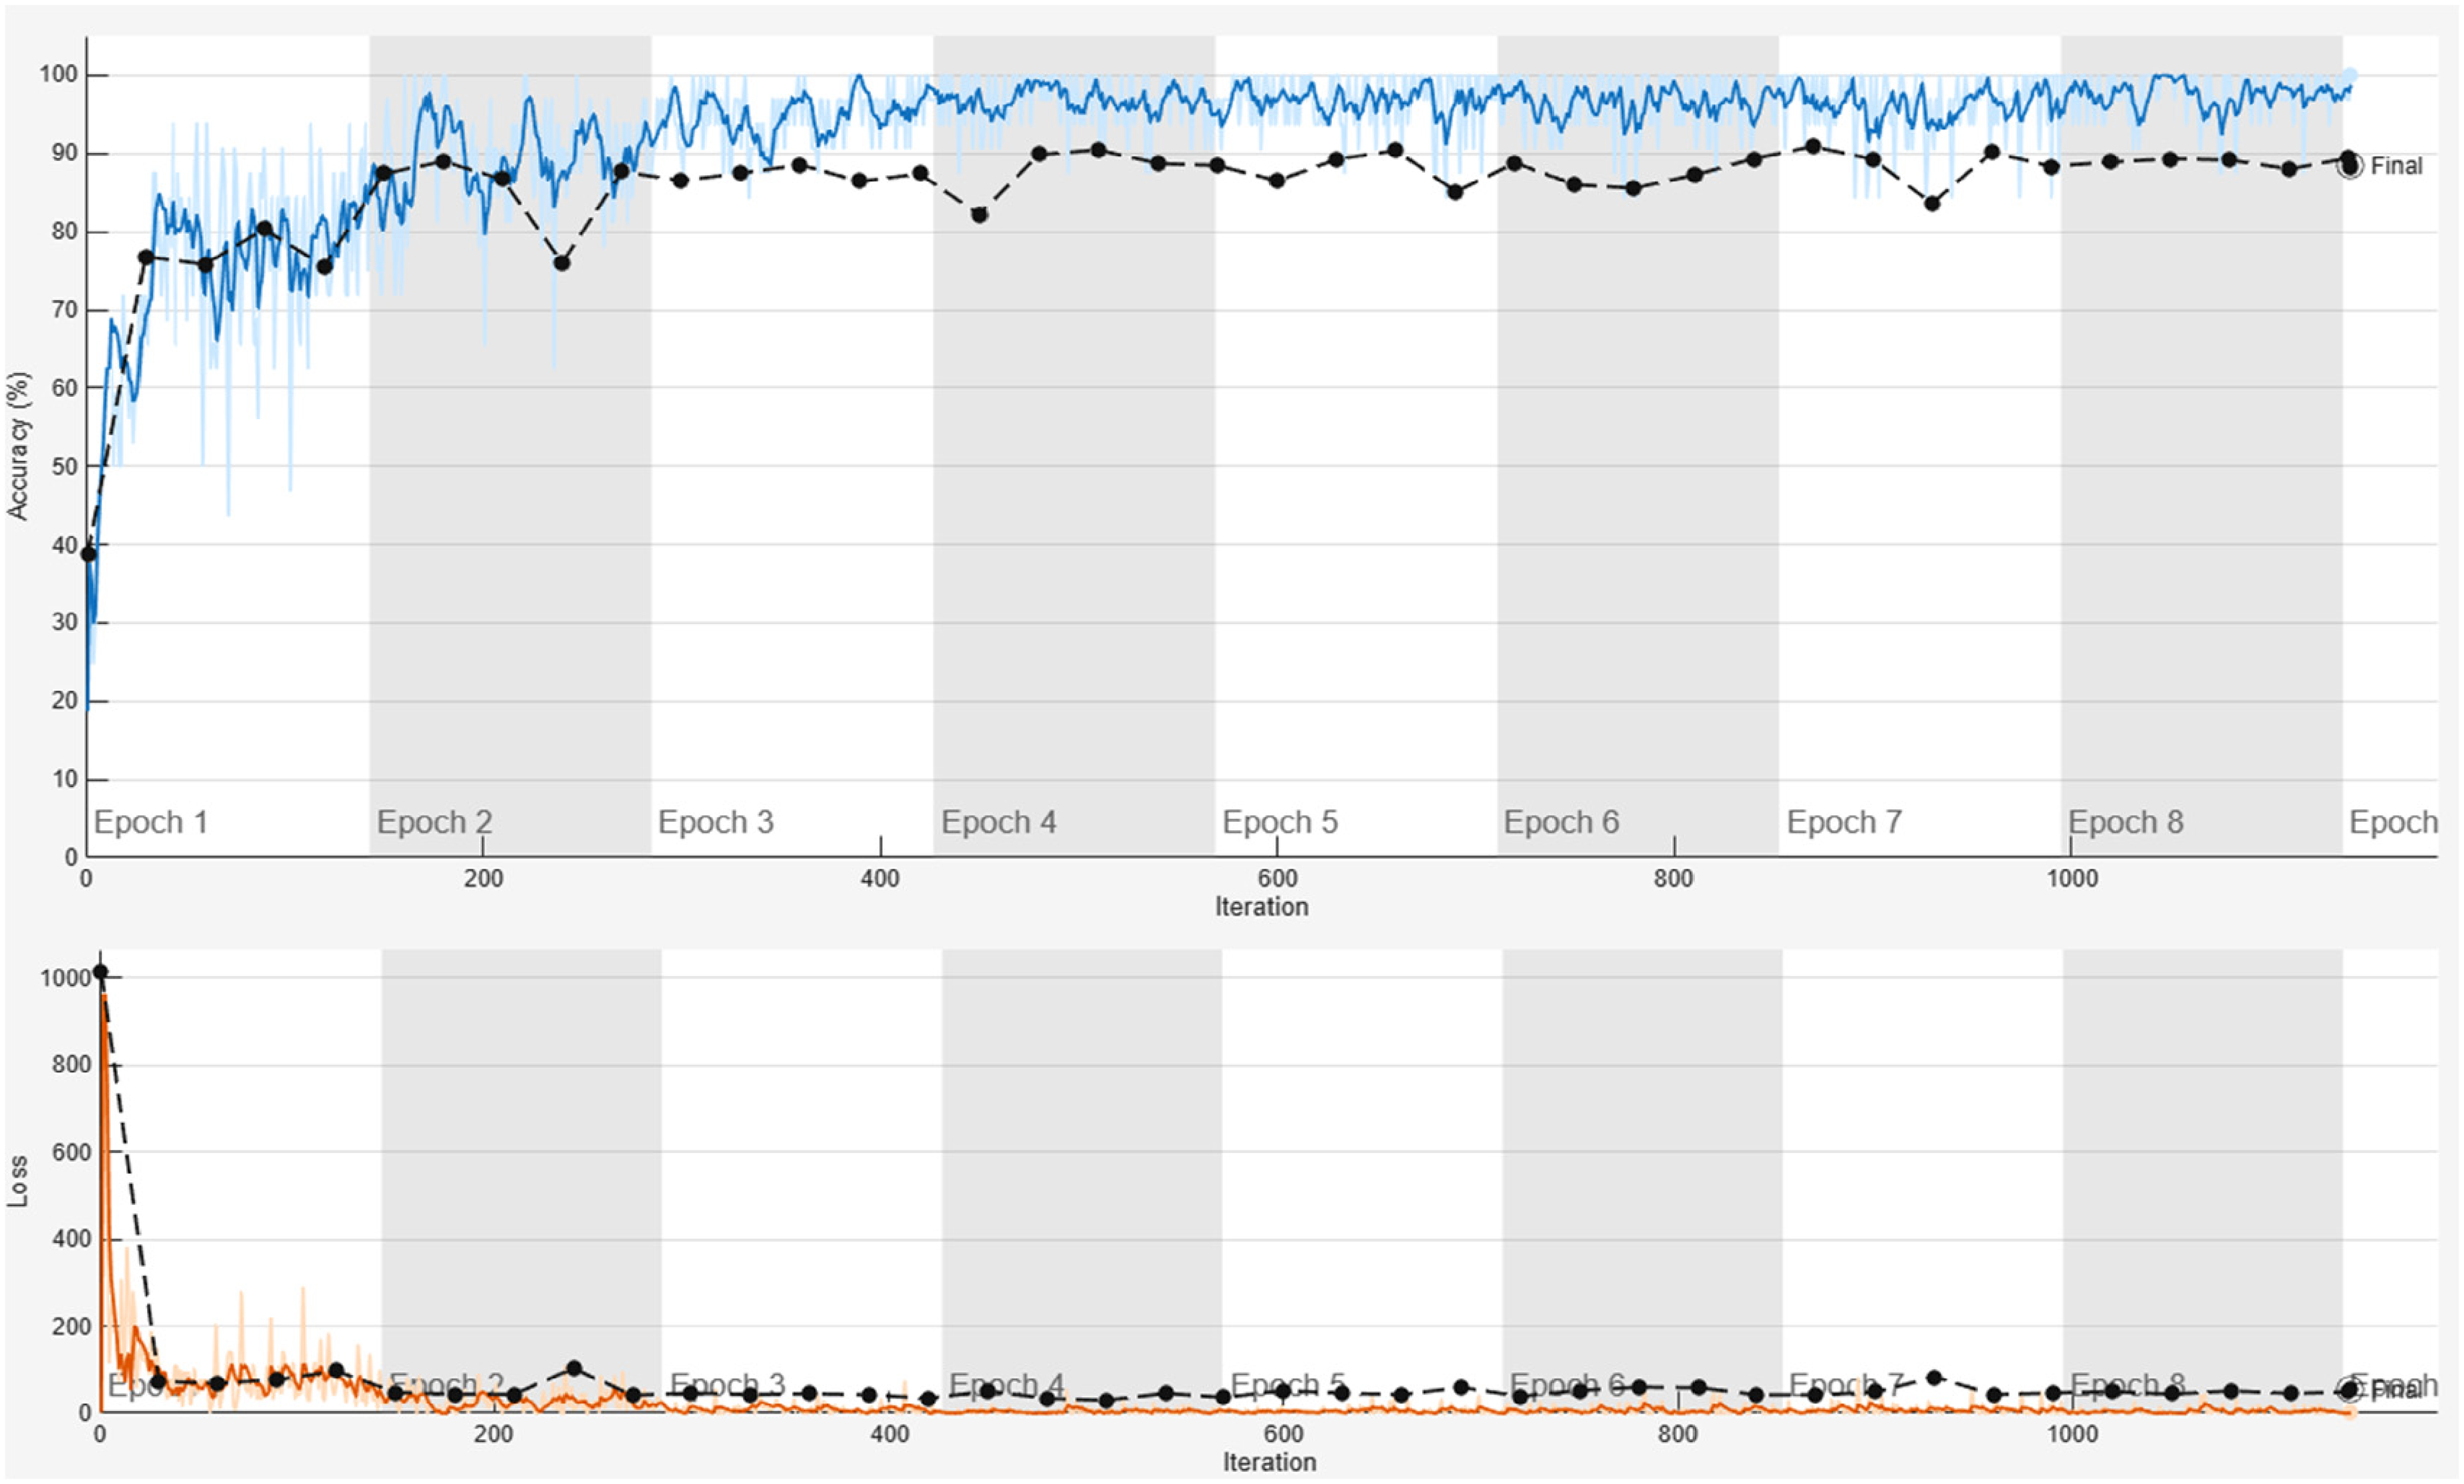
The system's training accuracy (shown in blue) and loss (shown in orange), along with its validation (depicted by a black line and dot).
Key regularization methods included data shuffling at each epoch and batch normalization. A custom callback recorded real-time metrics such as loss, accuracy, validation loss, and validation accuracy at timestamps into a timestamped CSV file for further analysis. The trained model and its metadata were archived to ensure reproducibility, including training curves and model parameters. This architecture emphasizes translational invariance through progressive feature extraction while maintaining input dimensions via padding, enabling efficient learning of tumor-specific morphological signatures across various MRI datasets.
Testing
In the evaluation of the classification and segmentation performance of the proposed brain tumor diagnostic system, four tumor classes, glioma, meningioma, pituitary, and no tumor, were analyzed. Based on the confusion matrix, the system achieved exceptional performance in identifying non-tumor (normal) brain images, with a precision of 100%, a recall of 98.5%, and an F1-score of 99.2%.
However, performance varied across tumor classes. Glioma detection was moderate, with a recall of 61.7%, an F1-score of 72.1%, and a significant number of false negatives (FN = 115). In contrast, meningioma showed an extremely high recall of 97.1% but had a low precision of 48.6% due to false positives (FP = 314). Pituitary tumors had high precision (98.9%) but poor recall (29%), as shown in Figure 6.

Classification metrics for each tumor type during testing.
Segmentation analysis used DSC, IoU, and HD metrics. DSC ranged from 0.38 to 0.96, IoU from 0.24 to 0.92, and HD from 0.36 to 20.63 pixels. Tumors with high DSC values and low HDs were segmented more accurately.
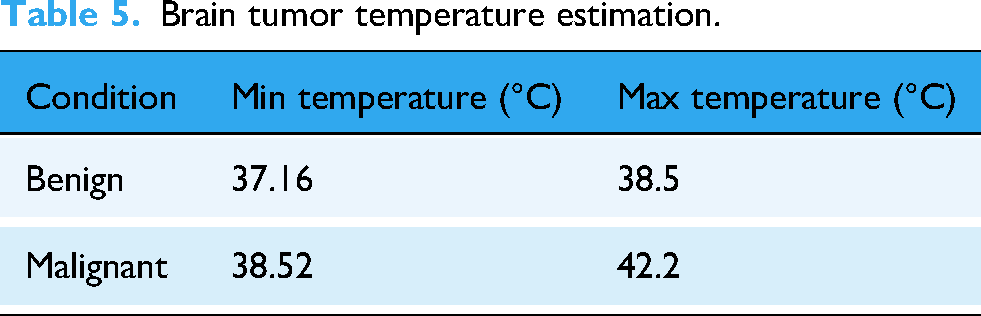
The thermal estimation module converted the segmented tumor area into estimated brain temperatures (37 °C–43.23 °C), as shown in Figure 7. Temperatures above 38.5 °C were identified as malignant, consistent with biological expectations of elevated metabolism.

Thermal estimation of various tumor types, consisting of benign and malignant tumors.
There is a notable discrepancy between the predicted and actual tumor types. For benign tumors, the highest recorded temperature is 38.5 °C, while the lowest is 37.16 °C, as shown in Table 5. The analysis identified a total of 811 malignant images, 95 benign images, and 405 images categorized as invalid, indicating either the absence of a tumor or a healthy brain.
Brain tumor temperature estimation.
In addition to evaluating temperature and shape-based characteristics, the GLCM analysis provided deeper insights into textural variations observed in the samples. The findings revealed significant metrics: contrast values ranged from 0.0018 to 0.1317, correlation values ranged from 0.0006 to 0.9999, energy levels ranged from 0.1051 to 0.9944, and homogeneity scores ranged from 0.1294 to 0.9974. Notably, tumors with low energy and homogeneity levels were often irregularly shaped and high-contrast, suggesting a more aggressive pathology. In contrast, tumors with higher energy and homogeneity values were more likely to display smoother textures, indicating a benign nature. These textural features provide vital information that can help differentiate between tumor types and guide appropriate treatment strategies.
Discussion
The extracted features from segmentation and analyses, including area, diameter, perimeter, intensity, and circularity, as well as thermal and textural patterns, offer a rich dataset for interpretation. The differences among tumor types, glioma, meningioma, and pituitary, in morphology, intensity, circularity, thermal, and textural features, deserve detailed discussion based on existing neuroimaging research. Although the system used in this study had limited RAM and GPU capabilities, it still achieved high accuracy and stable performance during the initial training phases. Model training was halted at the eighth epoch out of 30 planned epochs because the accuracy values had already converged with minimal fluctuations between epochs 3 and 8. Extending training beyond this point would have required a lengthy period with negligible performance gains. Therefore, the available computational resources were used efficiently to obtain reliable results for tumor segmentation, classification, and temperature estimation within the existing configuration.
The morphological analysis showed a wide range in area (72.75–6365 mm2), diameter (10.41–163.19 mm), and perimeter (up to 546.17 mm). They also had low circularity (0.2594), indicating irregular, infiltrative growth. These findings align with gliomas’ known tendency to invade tissue and their poorly defined boundaries. 34 Meningiomas exhibited higher circularity values (up to 0.9888), indicating their compact and well-encapsulated nature. This morphological difference is a key radiomic discriminator among brain tumor types. 30
Shape attributes, such as circularity, compactness, and eccentricity, effectively classify tumor types. Morphological features on MRI help differentiate gliomas, meningiomas, and metastases. The importance of these metrics in noninvasive tumor characterization is reinforced by these study findings.
Gliomas exhibit a wide range of grayscale intensities (16.7–177.2), reflecting their heterogeneous nature, including necrosis typical of high-grade gliomas. Meningiomas and pituitary adenomas have narrower ranges, indicating more uniform cellular structures. Radiomic studies support this, showing intensity features relate to tumor grade and molecular subtype. MR intensity histograms can predict IDH mutation and MGMT methylation in gliomas. 35 Thus, it is concluded that the intensity heterogeneity present in our dataset aligns with established imaging biomarkers of malignancy.
The CNN classifier's performance varied across tumor types, with perfect results for non-tumors (precision: 100% and recall: 98.5%) and moderate results for gliomas (recall: 61.7%) and pituitary tumors (recall: 29%). High recall of 97.1% was noted for meningiomas, but with a low precision of 48.6%, indicating many false positives, likely due to similarities with benign gliomas. These results highlight that feature overlap and data imbalance pose significant challenges to multiclass tumor classification. The system employs a straightforward architecture comprising only three convolutional layers, yet exhibits promising initial performance.36,37 The integration of advanced architectures, such as ViT, ResNet, and UNet, as well as emerging models, promises to enhance classification and segmentation capabilities in future developments. These improvements are expected to enhance accuracy and efficiency, thereby supporting cutting-edge research and the deployment of IoT solutions. 30
Segmentation was evaluated using DSC from 0.38 to 0.96 and IoU from 0.24 to 0.92. Regular, compact tumors yielded higher similarity scores, while irregular gliomas decreased accuracy. These findings align with previous studies, which indicate that the automatic segmentation of infiltrative gliomas is more challenging than that of encapsulated tumors. 38 Furthermore, incorporating texture and region-based features resulted in improved DSC values for glioma segmentation. 31 As such, it is emphasized that precise segmentation remains essential for effective feature extraction and consistent classification. 39
The thermal estimation module recorded temperatures from 37 °C to 43.23 °C. Malignant tumors showed temperatures above 38.5 °C, aligning with studies linking increased metabolism and angiogenesis to malignancy. Temperatures over 42 °C have been noted in hyperthermia trials for gliomas, supporting these estimates. However, recent reviews warn that brain tumor temperatures can vary due to differences in perfusion and vascularization. 40 Our model has an MAE of 3.89 °C, and the R2 value remains undefined, highlighting these uncertainties and underscoring the need for adaptive baseline modeling.
In this study, macroscopic features such as tumor size and estimated temperature, derived from the proposed temperature equation model, were used to classify tumors as benign or malignant. However, in clinical practice, determining malignancy usually relies on histological examination of tissue, which involves analyzing cellular and molecular characteristics, such as histological type (e.g. glioblastoma versus low-grade astrocytoma). While size and temperature can offer valuable insights into tumor behavior, they are not enough for a definitive diagnosis of malignancy. Therefore, this approach should be viewed as a complementary pre-screening tool rather than a replacement for histological diagnosis. To improve accuracy and clinical relevance, future research could incorporate radiomic features or histopathological data into the classification process.
The thermal estimation model exhibited high errors, with MAE and RMSE values of 3.89 °C, which surpassed the acceptable limits for clinical temperatures (36 °C–42 °C). This may affect tissue differentiation if taken literally. The logarithmic model primarily captures relative, rather than absolute, temperature gradients. Similar AI-driven physiological modeling techniques have been successfully utilized in real-time clinical prediction and telehealth monitoring systems,36,41 supporting the feasibility of integrating bioheat proxies into diagnostic imaging frameworks. The model aimed to reflect metabolic activity through thermal gradients rather than precise thermometry. Equation (3) simulated tumor size and heat trends based on bioheat theory, not patient data. High errors resulted from using a fixed baseline temperature (37 °C), as individual data were unavailable, rendering the R2 value undefined. Despite this, temperature differences (benign: 37 °C–38.5 °C, malignant: 38.5 °C –42.2 °C) aligned with biological insights linking higher tumor temperatures to increased vascularization and activity. Although accuracy is limited, the trend suggests that using temperature as a proxy for malignancy is a viable approach. Future work will incorporate patient-specific temperatures via biothermal models and calibrate them using imaging or machine learning, aiming for < 0.5 °C error. This study demonstrates the potential of thermal biomarkers in MRI analysis, not as a standalone thermometry tool.
This study did not compare its results with those of advanced models, such as Swin transformer, nnU-Net, or ViT, nor did it conduct formal statistical tests. Its main goal was to demonstrate the proof-of-concept integration of deep learning with thermal estimation and textural analysis in MATLAB, rather than benchmarking performance. Hardware limitations prevented the use of large models; however, the results match the accuracy of lightweight CNNs, demonstrating reliable tumor segmentation and classification. The aim is to validate the combination of biomarkers into a single workflow for future benchmarking.
To establish a clear initial statistical context, we computed 95% confidence intervals (CIs) for class-wise precision and recall using the Wilson score method, 29 which offers robust coverage for binomial proportions, even in moderately sized datasets.26,42 Figure 8 illustrates that the CNN achieved an overall mean precision of 96.2% (95% CI: 92.5%–99.9%) and a mean recall of 87.0% (95% CI: 80.3%–92.1%). The DSC indicated that the average segmentation quality was 0.82 ± 0.09 (95% CI: 0.79–0.85). These results demonstrate that the performance of the no-tumor and meningioma classes was statistically stable, while the performance of the glioma and pituitary cases showed more variability. In the future, we plan to employ formal statistical tests such as paired t-tests, ANOVA, and bootstrapped CIs to assess the significance of the differences between classes and to compare our proposed framework with top architectures like Swin transformer, nnU-Net, and ViT.

Class-wise precision and recall with 95% confidence intervals (CIs) were computed using the Wilson score method, demonstrating stable performance for no-tumor cases, moderate variation for glioma and meningioma, and reduced recall for pituitary tumors.
Features from the GLCM provide insights into tumor heterogeneity. Aggressive gliomas exhibit high contrast and low homogeneity, whereas benign meningiomas display high energy and uniform texture. Recent studies have linked GLCM features such as contrast, correlation, and entropy to glioma grade. 43 The GLCM-derived textural descriptors serve as interpretable radiomic biomarkers for tumor heterogeneity, similar to multidimensional feature extraction and semantic classification in non-medical AI.44,45 This shows how textural analysis adapts when structural variation affects prediction. Incorporating textural metrics can improve the accuracy of MRI glioma grading. Thus, texture features can effectively complement morphological and intensity descriptors to better distinguish tumors. 46
The integration of morphological, textural, and thermal approaches establishes a multidimensional diagnostic framework akin to modern radiomics pipelines. 47 This direction aligns with recent trends that focus on hybrid deep learning architectures and cross-domain data fusion to enhance disease prediction and diagnosis.30,36,39 Merging shape, intensity, and texture in AI models aligns with insights from multi-parametric studies and advances brain tumor prediction. Although classification accuracy varies across tumor types, combining morphological and thermal data improves overall diagnostic sensitivity.
Future work may also involve expanding the datasets, implementing patient-specific temperature calibrations, and integrating multi-sequence MRI data, including DWI, ADC, and perfusion. Exploring transformer or attention-based neural architectures is also planned. Additionally, robustness can be improved by incorporating clinical metadata, such as molecular subtype and tumor location. 48 Future research will investigate the benefits of utilizing high-performance computing (HPC) platforms, particularly field-programmable gate arrays (FPGAs), to enhance the proposed framework and facilitate real-time analysis of brain tumors. Several studies indicate that FPGA-based implementations can significantly increase throughput, reduce latency, and improve power efficiency while maintaining model accuracy.49–55 The integration of FPGA acceleration with the existing AI pipeline could simplify deployment in clinical and embedded diagnostic systems.
We present a direct comparison with benchmark results from recent BraTS and MICCAI studies to place the proposed framework within the broader state of the art. State-of-the-art architectures such as nnU-Net typically achieve whole-tumor Dice scores of 0.90–0.92 on the BraTS dataset, 26 while transformer-based models such as Swin-UNet and ViT-hybrid approaches report Dice scores of 0.88–0.90. 56 Leading 3D CNN and transformer submissions consistently surpass Dice values of 0.89 across high-grade gliomas, according to BraTS challenge summaries. 27 In comparison, our lightweight 2D U-Net achieves a Dice score of 0.82 ± 0.09 on the Figshare dataset. Although this is not as good as transformer-based systems, our goal is essentially different: we present an integrated CNN–GLCM–thermal estimation pipeline in MATLAB that integrates bioheat-inspired temperature estimation, segmentation, and texture extraction into a single framework. Furthermore, without a complete redesign of the computational framework, our current 2D pixel-level thermal estimation model is incompatible with the BraTS dataset's 3D multi-label volumetric NIfTI masks. This distinction makes the current work's methodological scope clearer and establishes it as a proof-of-concept integration rather than a segmentation study focused on benchmarks.
In conclusion, the findings illustrated in Figures 4 to 8 and Tables 3 to 5 are consistent with recognized tumor imaging characteristics and align with the existing scientific literature. A promising foundation for the development of AI-assisted diagnostic tools inspired by radiomics is presented by the hybrid CNN-GLCM-thermal model, which effectively integrates morphological, physiological, and textural elements in the evaluation of brain tumors.
Conclusion
The integrated AI pipeline evaluated in this study shows promising potential for transforming brain tumor analysis through effective multimodal data processing and deep learning techniques. This pipeline comprises various components, including segmentation, thermal estimation, texture analysis, and classification, offering a comprehensive approach to tumor evaluation. However, some limitations need to be addressed. Segmentation performance varies significantly depending on the tumor type, with DSCs ranging from 0.38 to 0.96 and IoU scores ranging from 0.24 to 0.92. Notably, high HDs of up to 20. A 63-pixel challenge highlights the accurate outlining of irregular tumor margins, especially for infiltrative gliomas. In morphometric analysis, gliomas are the largest and most heterogeneous tumors, with sizes ranging from 72.75 mm2 to an impressive 6, 6365.25.25 mm2, while meningiomas tend to be more compact. Thermal estimation results indicate that malignant tumors can reach temperatures as high as 42.2 °C, whereas benign tumors generally remain at around 37 °C. However, fixed baseline assumptions have led to notable prediction errors, with an MAE of 3.89 °C, which limits interpretability. Additionally, texture analysis using the GLCM shows that malignant tumors typically display higher contrast and less homogeneity than benign tumors, which tend to be more uniform. Although classification performance with a CNN was excellent for healthy cases (F1-score = 99.2%), it struggled with certain tumor types due to overlapping feature distributions. Limitations include limited hardware (4 GB RAM, no GPU), which restricts model training to only eight epochs and hinders feature learning. Additionally, data imbalance affects classification accuracy, and artifacts from file conversion compromise segmentation. The relatively shallow CNN architecture (three layers) may also lack the complexity needed to capture intricate patterns. Future improvements could involve upgrading computational resources with GPU support, creating balanced datasets, and integrating thermal, morphological, and textural features into a unified classifier. Collaborating with clinicians is crucial for validating the model's practical applicability in real-world settings. Overall, while this AI pipeline offers an exciting approach to brain tumor analysis, significant room remains for improvement and clinical validation to ensure its effectiveness in clinical practice.
Footnotes
Acknowledgements
The authors gratefully acknowledge the support of the Research and Development Office (RDO) at Gulf University for Science and Technology (GUST) for funding this research through the Seed Grant (Case-76).
Ethical considerations
No experiments were conducted on humans or animals in this study.
Funding
The authors disclosed receipt of the following financial support for the research, authorship, and/or publication of this article: Support was provided by the Gulf University for Science and Technology (GUST) through the Internal Seed Grant (IS-76).
Declaration of conflicting interests
The authors declare that they have no known competing financial interests or personal relationships that could have appeared to influence the work reported in this paper.
Data availability statement
All data in the manuscript is available through the responsible corresponding author.