
Abstract
Objective
Early and accurate detection of ear diseases is essential for preventing hearing impairment and improving population health. This study aimed to develop a lightweight, high-performance, and real-time deep learning model for otoscopic image classification and to deploy it in a cross-platform diagnostic system for clinical and community use.
Methods
We constructed a large-scale, multi-center otoscopy dataset covering eight common ear diseases and healthy cases. Based on this dataset, we developed Best-EarNet, an ultrafast lightweight architecture integrating a local-global spatial feature fusion module and a multi-scale supervision strategy to enhance feature representation. Transfer learning was applied to optimize performance. The model was evaluated on internal (22,581 images) and external (1,652 images) test sets, with subgroup analyses by age and gender. Grad-CAM visualizations were used to improve interpretability. A cross-platform intelligent diagnostic system, Ear-Keeper, was further developed for deployment on smartphones, tablets, and personal computers.
Results
Best-EarNet achieved accuracies of 95.23% on the internal test set and 92.14% on the external test set, with a model size of 2.94 MB. It processed images at 80 frames per second on a standard CPU. Subgroup analyses demonstrated consistently high performance across age and gender groups. Grad-CAM visualizations highlighted lesion-related regions, and Ear-Keeper enabled real-time video-based ear screening across multiple platforms.
Conclusion
Best-EarNet offers an accurate, efficient, and interpretable solution for ear disease classification. Its real-time performance and cross-platform deployment through Ear-Keeper support both clinical practice and community-level screening, with strong potential for early detection and intervention.
Introduction
The ear, being one of the most vital organs in the human body, not only governs auditory perception but also plays an essential role in maintaining bodily equilibrium. 1 Meanwhile, the ear is also an organ that is frequently affected by diseases, with over 500 million people worldwide being affected by ear infections each year. 2 If not detected and treated promptly, ear diseases can lead to hearing loss and lifelong complications. 3 They can also give rise to severe complications such as acute mastoiditis, labyrinthitis, and meningitis, which can have a significant impact on one's quality of life throughout their lifetime.4,5 As the most common ear disease, otitis media affects individuals of all age groups and is a leading cause of healthcare visits worldwide. It is responsible for approximately 20,000 deaths each year due to related complications, with the highest mortality rate occurring among children under the age of 5. 6 Furthermore, over 80% of patients experience at least one episode of acute otitis media before the age of 3, and 40% of patients have six or more recurrent episodes by the age of 7. 7 This often results in many children suffering from hearing loss, which can have long-term negative effects on their learning abilities and future personal development. 8
As with other diseases, timely detection and appropriate treatment of ear diseases can help prevent deterioration and avoid unnecessary side effects of certain medications, such as broad-spectrum antibiotics.9–11 In contrast to other disorders, ear examination is a simple, noninvasive process. In clinical practice, otoscopy is a widely used method for ear examination. However, due to variations in expertise and experience levels, misdiagnosis by healthcare professionals often occurs, especially in nonspecialty clinics (such as pediatrics, general practice, emergency departments, primary care physicians, and telemedicine) and in areas with limited medical resources. 12 Even in specialized otolaryngology departments, diagnostic errors may still occur, with the diagnosis accuracy for subtypes of middle ear illnesses, for instance, being approximately 75%. 13 At the same time, patient demand continues to increase, while the number of otolaryngologists remains insufficient to meet clinical needs. For those with ear issues, this lack of otolaryngologists may hinder timely diagnosis and adequate treatment.2,14 Especially for children in developing countries, substantial investments are needed to establish facilities for ear disease detection and treatment to prevent long-term hearing impairments and other sequelae. 15 Accessible and affordable ear healthcare services are crucial to ensure early diagnosis, appropriate treatment, and prevention of complications related to ear diseases in children.
To address these challenges, there is an urgent need to develop a new generation of diagnostic devices for ear diseases that can provide timely, convenient, and accurate diagnoses. Fortunately, an otoscope, commonly used in ear examinations, is a readily replaceable device that can be easily operated without specialized training. This creates a feasible pathway for integrating self-recognition capabilities into the device using emerging deep learning techniques. While some research has already utilized deep learning models for intelligent recognition of various types of otoscopic images, achieving promising recognition results, these efforts often lack extensive data validation and only focus on model development and accuracy, without considering the applicability of the models in real-world scenarios. In practical application, an intelligent identification model for ear illnesses should balance the trade-offs among diagnosis accuracy, model parameter size, and model response speed in addition to focusing on diagnosis performance. Repeated observations of the afflicted ear canal areas are frequently necessary for clinical diagnosis. As a result, if a model can achieve extremely quick inference speed, it can let both individual users and otolaryngologists perform thorough and in-depth scans of ear lesions in real-time video format. This is more rigorous and scientific than depending only on intelligent recognition based on a single static image, and it is in line with the actual clinical diagnosis process. Moreover, such a model can be deployed on edge devices with limited computational capabilities, such as low-end computers, smartphones, and tablets. Small model parameter sizes imply minimal memory and storage requirements, enabling easy deployment on resource-constrained devices like smartphones and embedded systems. Specifically, the key to using artificial intelligence (AI) for diagnosing ear diseases lies in developing applications that possess the aforementioned features and are compatible with different devices. Such applications do not require expensive computing devices or network services and can be reliably applied to various local devices and scenarios, aiding in the early detection and treatment of ear diseases for a wide range of patients. This, in turn, helps reduce the overall burden and adverse outcomes associated with ear diseases.
This work aims to design a model that can be easily used in various real-world scenarios and develop a corresponding intelligent diagnosis system for ear lesions. To achieve this, we first establish the largest dataset of ear lesion images ever created. We then employ the well-known lightweight network ShuffleNetV2_X0_5 16 as our base model and propose a novel image feature fusion module called local–global spatial feature fusion (LGSFF). By combining ShuffleNetV2_X0_5 with LGSFF and multiscale supervision strategy, we proposed a network named Best-EarNet that achieves a good trade-off between diagnosis performance, inference speed, and model parameter size. Best-EarNet demonstrates super-fast inference speed and extremely small model parameter size, making it easily deployable in different scenarios. Importantly, Best-EarNet achieves excellent diagnosis performance for eight types of ear diseases as well as normal ears, validated through diverse populations of different genders, age groups, and clinical settings. In the final stage of our work, we developed an application system called Ear-Keeper. Ear-Keeper consists of four versions: a mobile version based on edge computing (smartphones), a mobile version based on cloud servers, a tablet version based on edge computing (tablet computers), and a personal computer (PC) version based on edge computing. The mobile versions primarily assist general users in self-diagnosis and regular check-ups. With the aid of a compact electronic otoscope, users can promptly diagnose their ears when experiencing discomfort. Simultaneously, the tablet and PC versions can assist healthcare professionals in diagnosing patients in various settings, including community screenings, community clinics, resource-limited areas, and specialized otolaryngology practices. This helps reduce misdiagnosis, improve diagnosis efficiency, enhance the patient experience, and reduce the substantial manpower and material costs associated with traditional diagnosis. Additionally, we employ gradient-weighted class activation mapping (Grad-CAM) method to visualize the decision-making process of the Best-EarNet model. This allows users and medical practitioners to better understand the decision-making process of the deep learning model and helps developers validate, debug, and improve the model's behavior more effectively.
Related work
In the research of intelligent recognition of ear diseases, intelligent recognition has been performed based on ear endoscope images, focusing on features such as the eardrum and ear canal. Here, we summarize some prominent related studies. In terms of methods, the main approaches include machine learning and deep learning methods. In machine learning, neural network (NN), decision tree (DT), support vector machine (SVM), and K-nearest neighbor (K-NN) have been employed.
In 2017, Senaras et al. conducted a binary classification study on 247 ear endoscope images using an NN model, achieving an accuracy of 84.6%. In 2018, Myburgh et al. employed a DT + NN method to classify 389 ear endoscope images into five categories, achieving an accuracy of 81.6% and suggesting the potential application on smartphone devices. In 2019, Livingstone et al. used an AutoML model to classify 1366 ear endoscope images into eight categories, achieving an accuracy of 88.7%. In 2020, Viscaino et al. employed an SVM + K-NN + DT model to classify 1060 ear endoscope images into four categories, achieving an accuracy of 93.9% and suggesting the potential application on PC devices.
In the domain of deep learning methods, Cha et al. utilized an Inception-V3 + ResNet101 model ensemble to conduct a six-class classification study on 10,544 ear endoscope images, achieving an accuracy of 93.7%. Khan et al. employed a ResNet50 model to classify 2484 ear endoscope images into three categories, achieving an accuracy of 95%. Zafer utilized a VGG16 model to classify 857 ear endoscope images into four categories, achieving an accuracy of 99.5%. Wu et al. employed a Xception + MobileNetV2 model ensemble approach to conduct a binary classification study on 12,230 ear endoscope images, achieving an accuracy of 90.7% and suggesting the potential application on smartphone devices. Zeng et al. utilized a DenseNet161 + 169 model ensemble approach to classify 20,542 ear endoscope images into eight categories, achieving an accuracy of 95.6% and suggesting the potential application on PC devices. Chen et al. used a MobileNetV2 model to conduct a 10-class classification study on 2171 ear endoscope images, achieving an accuracy of 97.6% and suggesting the potential application on smartphone devices. Manju et al. employed a VGG19 model to classify 1880 ear endoscope images into three categories, achieving an accuracy of 97%. Habib et al. used a vision transformer model to conduct a binary classification study on 1842 ear endoscope images, achieving an accuracy of 92%.
We have summarized the progress and limitations of previous work in Table 1. Overall, deep learning models have achieved higher accuracy compared to traditional machine learning methods. However, direct comparison based solely on accuracy is not entirely appropriate due to variations in the number of classes and images across studies. Therefore, from the perspective of practical applications, we have identified the following four limitations based on the summary of previous work. (1) The limited quantity and variety of datasets have resulted in inadequate generalization of the models, rendering them unsuitable for real-world scenarios. (2) The consideration of model parameters and inference speed has been lacking, leading to the use of models that are not easily deployable on resource-constrained devices such as smartphones and tablets. For instance, models like VGG19 and vision transformer pose challenges for deployment on such devices. (3) Ear diseases are clearly influenced by factors such as age and gender, yet most studies have not validated their models on diverse populations or conducted external validations. (4) While some studies have considered deploying the models on specific application devices such as smartphones and PCs, there is a lack of corresponding demonstrations and research on application performance.
Previous studies on ear diseases.

NN: neural network; DT: decision tree; SVM: support vector machine; K-NN: K-nearest neighbor.
Materials and methods
Data source and ethical approval
This is a retrospective study, and the clinical data used in the analysis consist of two parts. The first part, called the SZH dataset, comprises otoscope images from 65,475 patients with ear diseases who visited the Otolaryngology Department of the Second Affiliated Hospital of Shenzhen University (Shenzhen, Guangdong Province, China) from July 1, 2016 to December 31, 2022 (Tables 2 and 3). The second part, named the FSH dataset, includes otoscope images from 1652 patients with ear diseases who visited the Otolaryngology Department of the Foshan Sanshui District People's Hospital (Foshan, Guangdong Province, China) from June 1, 2022 to January 31, 2023 (Table 2). The research protocol of this study was approved by the Review Committee of the Second Affiliated Hospital of Shenzhen University (Approval No. BY-EC-SOP-006-01.0-A01) and the Review Committee of Foshan Sanshui District People's Hospital (Approval No. SRY-KY-2023045). The Helsinki Declaration's tenets were scrupulously followed throughout the study to respect the rights, privacy, and anonymity of the subjects. As approved by the institutional ethics committee, written informed consent was waived because the study involved no identifiable personal information and posed minimal risk to participants.
Distribution of ear lesion images.
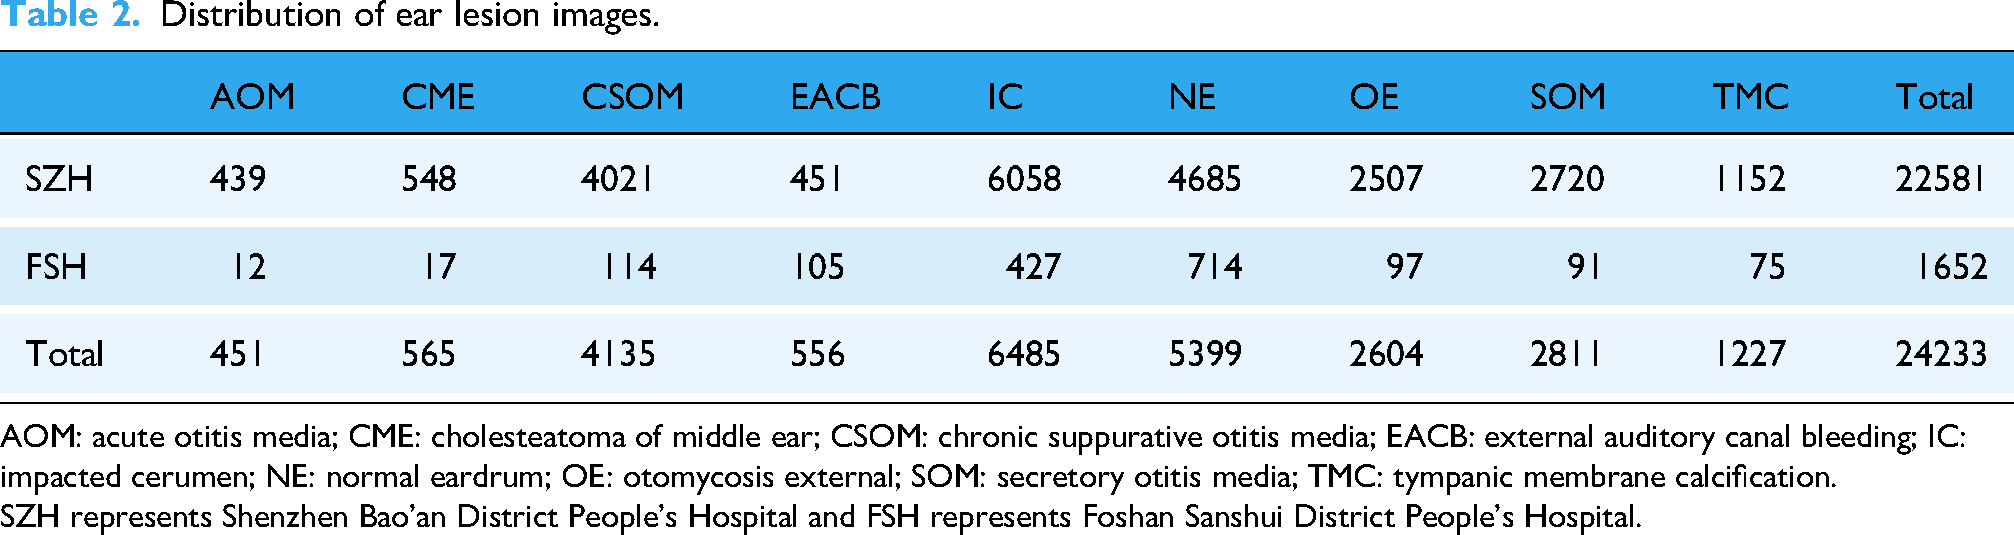
AOM: acute otitis media; CME: cholesteatoma of middle ear; CSOM: chronic suppurative otitis media; EACB: external auditory canal bleeding; IC: impacted cerumen; NE: normal eardrum; OE: otomycosis external; SOM: secretory otitis media; TMC: tympanic membrane calcification.
SZH represents Shenzhen Bao'an District People's Hospital and FSH represents Foshan Sanshui District People's Hospital.
The distribution of SZH dataset by gender (M: male, F: female) and age.

CME: cholesteatoma of middle ear; CSOM: chronic suppurative otitis media; EACB: external auditory canal bleeding; IC: impacted cerumen; OE: otomycosis external; SOM: secretory otitis media; TMC: tympanic membrane calcification; AOM: acute otitis media; NE: normal eardrum.
All images in this study were classified into nine categories by four otolaryngologists with more than 15 years of clinical experience (Figure 1): Acute otitis media (AOM), Cholesteatoma of middle ear (CME), Chronic suppurative otitis media (CSOM), External auditory canal bleeding (EACB), Impacted cerumen (IC), Normal eardrum (NE), Otomycosis external (OE), Secretory otitis media (SOM), and Tympanic membrane calcification (TMC). To ensure diverse data sources, no more than two otoscope images were retained for each patient. This retrospective study utilized clinical cases meeting the following criteria: patients who underwent routine otoscopic examination at the participating hospitals; cases with complete diagnostic records; and images in which the tympanic membrane or external auditory canal structures were clearly visible. Cases were excluded if the otoscopic images exhibited poor visibility (blur, overexposure), if corresponding diagnostic information was incomplete, or if the images were considered redundant, ambiguous, or controversial—for example, images in which experts were unable to clearly determine whether the condition represented an acute or chronic otitis media. Each expert independently annotated all images, and interrater reliability was assessed using Cohen's κ coefficient, yielding excellent agreement across all categories: AOM (0.94), CME (0.97), CSOM (0.99), EACB (1.00), IC (0.99), NE (1.00), OE (0.99), SOM (0.96), and TMC (0.98). Ambiguous or inconsistent cases were removed following consensus review to ensure annotation quality. The SZH dataset was used for five-fold cross-validation, ensuring a robust evaluation of model performance. The FSH dataset, collected independently using different devices and clinical workflows, was reserved exclusively for external testing to assess generalizability and real-world applicability, allowing for a more comprehensive evaluation of the model under heterogeneous imaging conditions.

The classic samples of eight types of ear diseases and normal eardrum. (a) The samples from the Second Affiliated Hospital of Shenzhen University (imaging equipment: Matrix E2, XION GmbH). (b) The samples from the Foshan Sanshui District People's Hospital (imaging equipment: Shenda EJ-1).
Best-EarNet design
In clinical practice, the inference speed of a deep learning model is crucial, as sufficiently fast processing enables real-time analysis of otoscopic video streams. Unlike static-image inference, real-time video inference better reflects actual diagnostic workflows, where clinicians continuously examine the entire external auditory canal to ensure a comprehensive assessment. Thus, real-time inference is more consistent with practical clinical requirements. In this study, we evaluated the average frames per second (FPS) and parameter size of 16 representative deep learning models. ShuffleNetV2_X0_5—a widely used lightweight architecture—was selected as the baseline. We enhanced it by incorporating the LGSFF module and multiple auxiliary loss accumulation strategies to achieve a balance among diagnostic accuracy, computational efficiency, and model size. The resulting architecture, Best-EarNet, was designed to support real-time deployment on diverse hardware platforms. The following sections describe its design rationale and structural components.
The overall framework of Best-EarNet
Figure 2 illustrates the overall architecture of Best-EarNet. The internal structures of the stage 2 to stage 4 components follow the design of ShuffleNetV2_X0_5, which enables the network to easily load ImageNet pretrained weights during training, accelerating convergence and improving model performance. In Best-EarNet, each input image is first resized to 3 × 224 × 224, after which the three channels are normalized using a mean of [0.485, 0.456, 0.406] and a standard deviation of [0.229, 0.224, 0.225].

The overall architecture of Best-EarNet and the internal structures of each component. (a) The overall architecture of Best-EarNet. (b) The internal structure of class head. (c) The internal structure of efficient channel attention. (d) The internal structure of the local–global spatial feature fusion module.
Next, the input undergoes a 4× downsampling operation in the stem layer, reducing the feature map size from 3 × 224 × 224 to 24 × 56 × 56. Subsequently, stages 2 through 4 perform sequential downsampling and feature extraction. After stage 2, a branch pathway extracts additional features from the feature map with richer low-level semantic information, producing an output referred to as “Flow.” The dimensionality of Flow is transformed from 48 × 28 × 28 to 384 × 7 × 7, which is later used in the feature fusion module. At the end of the backbone, the output of stage 4 undergoes high-level semantic feature extraction using a 3 × 3 convolutional layer, followed by batch normalization and a ReLU activation function. This output is denoted as “Fhigh.” Finally, the LGSFF module fuses the features from Flow and Fhigh, and the fused representation is passed to Class Head 3 for final prediction. It is important to note that two auxiliary prediction heads, Class Head 1 and Class Head 2, are attached to the outputs of stages 2 and 3, respectively. These heads compute Loss 1 and Loss 2 from low-level semantic features. Both losses are accumulated into Loss 3 to further optimize the model, facilitating more efficient and stable training of Best-EarNet.
Local–global spatial feature fusion module
For otoscopic images, the distinctions among categories are often reflected in subtle features such as spatial microstructures, texture patterns, and local color distributions. These fine-grained differences may not be immediately apparent at the raw pixel level. Furthermore, the inherent similarity in the basic anatomical structure and morphology of the tympanic membrane introduces a considerable degree of visual homogeneity across images. As a result, different ear disease images may exhibit substantial overlap in the feature space, thereby increasing the complexity of the classification task. Additionally, limited model capacity can reduce the network's ability to extract sufficiently discriminative features. To address these challenges, we introduce a novel module, LGSFF, which fuses low-level and high-level feature information from ear lesion images. LGSFF takes two inputs: Fhigh, the deep semantic output of the network, and Flow, the shallow semantic output. In our architecture, the output of stage 2 is used as Flow, and the final output of the network is used as Fhigh. In this work, both Flow and Fhigh have dimensions of 384 × 7 × 7.
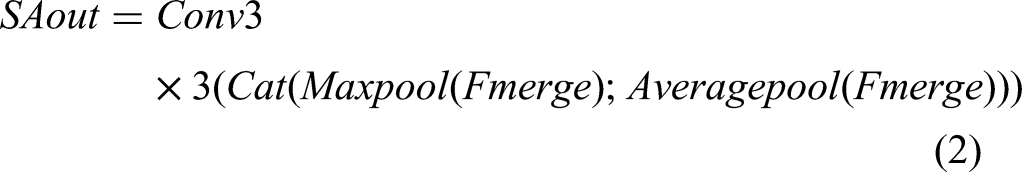
LGSFF starts by performing an element-wise addition, GPWconv, BatchNormal, and ReLu of Flow and Fhigh, resulting in Fmerge. To enhance the model's perception of spatial information in the input image and improve model performance, we use a spatial attention module
29
to process Fmerge and obtain SAout. And then the Sigmod activation function is computed, resulting in activation weights (weight and 1 − weight). We then multiply weight with Flow and 1 − weight with Fhigh. Before multiplying Fhigh with 1 − weight, we apply DropBlock,
30
a regularization technique, to Fhigh. DropBlock randomly drops some blocks, that is, groups of adjacent feature map units, instead of randomly dropping individual neurons like Dropout. By forcing the model to use other nondropped regions to learn image features, DropBlock provides stronger regularization, improving the model's robustness and generalization capability. Finally, we add Fhigh and Flow to obtain the output, denoted as Out. The output dimensions of EFLL, that is, Out, are the same as Flow and Fhigh, which is 384 × 7 × 7. The overall process of LGSFF can be summarized as follows:

While multiscale feature fusion and attention mechanisms have been extensively explored in computer vision, including approaches such as EfficientNet's compound scaling, convolutional block attention module (CBAM), and HRNet's high-resolution feature maintenance, our LGSFF is designed to address challenges specific to medical otoscopic image analysis. Unlike EfficientNet's uniform scaling strategy, LGSFF focuses on the multiscale nature of ear pathology, where local lesions (such as small perforations) and global patterns (such as overall inflammation distribution) require different forms of representation. Compared with CBAM's channel and spatial attention mechanisms, LGSFF is intended to better reflect characteristic patterns in otoscopic imagery, including the distinct anatomical boundaries of the ear canal and tympanic membrane and the subtle, fine-grained lesion features relevant to clinical assessment. While HRNet maintains high-resolution representations throughout the network, LGSFF is specifically optimized for the computational efficiency required in mobile deployment scenarios while still preserving essential lesion cues. The key contributions of LGSFF are as follows: (1) adaptation of multiscale fusion strategies tailored to the anatomical structures and lesion characteristics of otoscopic images; (2) integration of lightweight depth-wise separable convolutions to maintain efficiency; (3) incorporation of otoscopy-specific structural priors into the spatial attention design; and (4) optimization for real-time inference on resource-constrained devices. These design considerations differentiate LGSFF from general-purpose architectures and provide potential advantages for otoscopic image analysis.
Processing of branch path and multiscale supervision
For Flow, it is not directly passed into LGSFF but processed through a separate branch path. First, an average pooling layer and a point-wise convolution layer are applied to resize the feature map of Flow from 48 × 28 × 48 to 384 × 7 × 7. Then, DropBlock is used to perform regularization on the feature map. After that, efficient channel attention (ECA) 31 is applied to enable the network to focus more on the low-level feature information in Flow. Batch normalization and ReLU activation functions are applied to the Flow features. The internal structure of ECA is shown in the diagram, where K = 5.
Multiscale supervision is particularly important for processing complex medical images, as these images may contain structures and details on multiple scales. Therefore, to encourage the network to learn discriminative features at multiple levels, we use multiple auxiliary classification heads to supervise feature representations at different levels, which helps improve the learning efficiency and final performance of the entire network. Concretely, we add auxiliary classification heads to stage-2's output and stage-3's output of Best-EarNet. Compared to a single classification head, using multiple auxiliary classification heads introduces additional losses from the shallow layers of the network, which increases the gradient signals propagated during backpropagation. This provides extra regularization, improves model robustness, and helps the network converge better and optimize its parameters. The internal structure of these auxiliary heads is shown in Figure 2(d).
Metrics adopted in this work
In this study, we will assess the model's ability to perform effectively in practical applications by using the following seven metrics.
Accuracy (A): Accuracy is a fundamental evaluation metric that measures the proportion of correctly classified samples by the model, expressed as the ratio of the number of correctly classified samples to the total number of samples. Precision (P): Precision quantifies the proportion of samples predicted as positive by the model that are truly positive. It focuses on the accuracy of positive predictions and is calculated by dividing the number of true-positive samples by the total number of samples predicted as positive. Recall (R): Recall (or sensitivity) is defined as the proportion of true-positive samples correctly predicted as positive by the model, relative to the total number of true-positive samples. It emphasizes the model's ability to identify as many true positives as possible and is computed by dividing the number of true-positive samples by the total number of true-positive samples. Specificity (S): Specificity refers to the proportion of truly negative samples that are accurately predicted as negative by the model. It assesses the prediction accuracy of negative samples and is calculated by dividing the number of true negative samples by the total number of true negative samples. F1-score (F1): F1-score combines precision and recall into a single metric that balances both aspects. It is the harmonic mean of precision and recall and serves as a comprehensive performance measure. The five metrics can be represented by


The remaining two evaluation metrics are the average FPS and the model parameter size. The average FPS is critically important for deep learning models in practical applications. A high FPS indicates that the model can process input data rapidly, enabling fast real-time prediction or inference. This is essential for applications requiring rapid responsiveness, such as real-time video analysis and autonomous driving. In our work, a higher FPS allows users to assess ear lesions via real-time video. The model parameter size is directly related to storage requirements. Models with a larger number of parameters require more storage space, which must be considered in resource-constrained environments. In scenarios such as mobile devices and edge computing, model size and memory usage can become limiting factors.
During model evaluation, it is necessary to consider both accuracy-related metrics and performance-related metrics such as average FPS. Additionally, task-specific metrics for different disease categories are crucial, particularly in multiclass models. Therefore, to facilitate a more comprehensive model comparison, this study proposes a novel evaluation method called the overall ranking score (ORS), designed to measure the practical performance of multiclass models. The ORS is computed according to

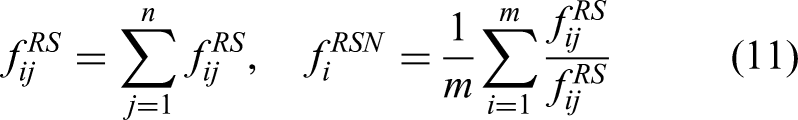

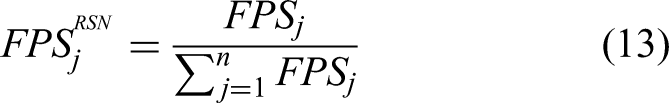
Here, i represents the category (1–9), and j represents the model (1–17).
Results
The workflow of this study
The workflow of this study is shown in Figure 3; the entire workflow is divided into three parts. (1) We established a large and diverse dataset of ear lesion images, which consists of nine categories and a total of 24,233 ear images. The dataset was collected and verified by experts. (2) We aimed to develop a model that can be deployed on any device. Based on previous related work and deployment requirements, we selected 16 networks. Subsequently, considering the model's inference speed and parameter size, we chose ShuffleNetV2_X0_5 as the baseline model and made improvements to it. The improved model was named Best-EarNet. Through five-fold cross-validation, we found that Best-EarNet is the state-of-the-art model when considering both practicality and diagnosis capability. (3) We evaluated the Best-EarNet model across different genders and age groups based on the clinical information of the images. This ensured the clinical applicability of Best-EarNet, providing reliable support for users in different backgrounds during practical usage and making the model's real-world application more convincing.
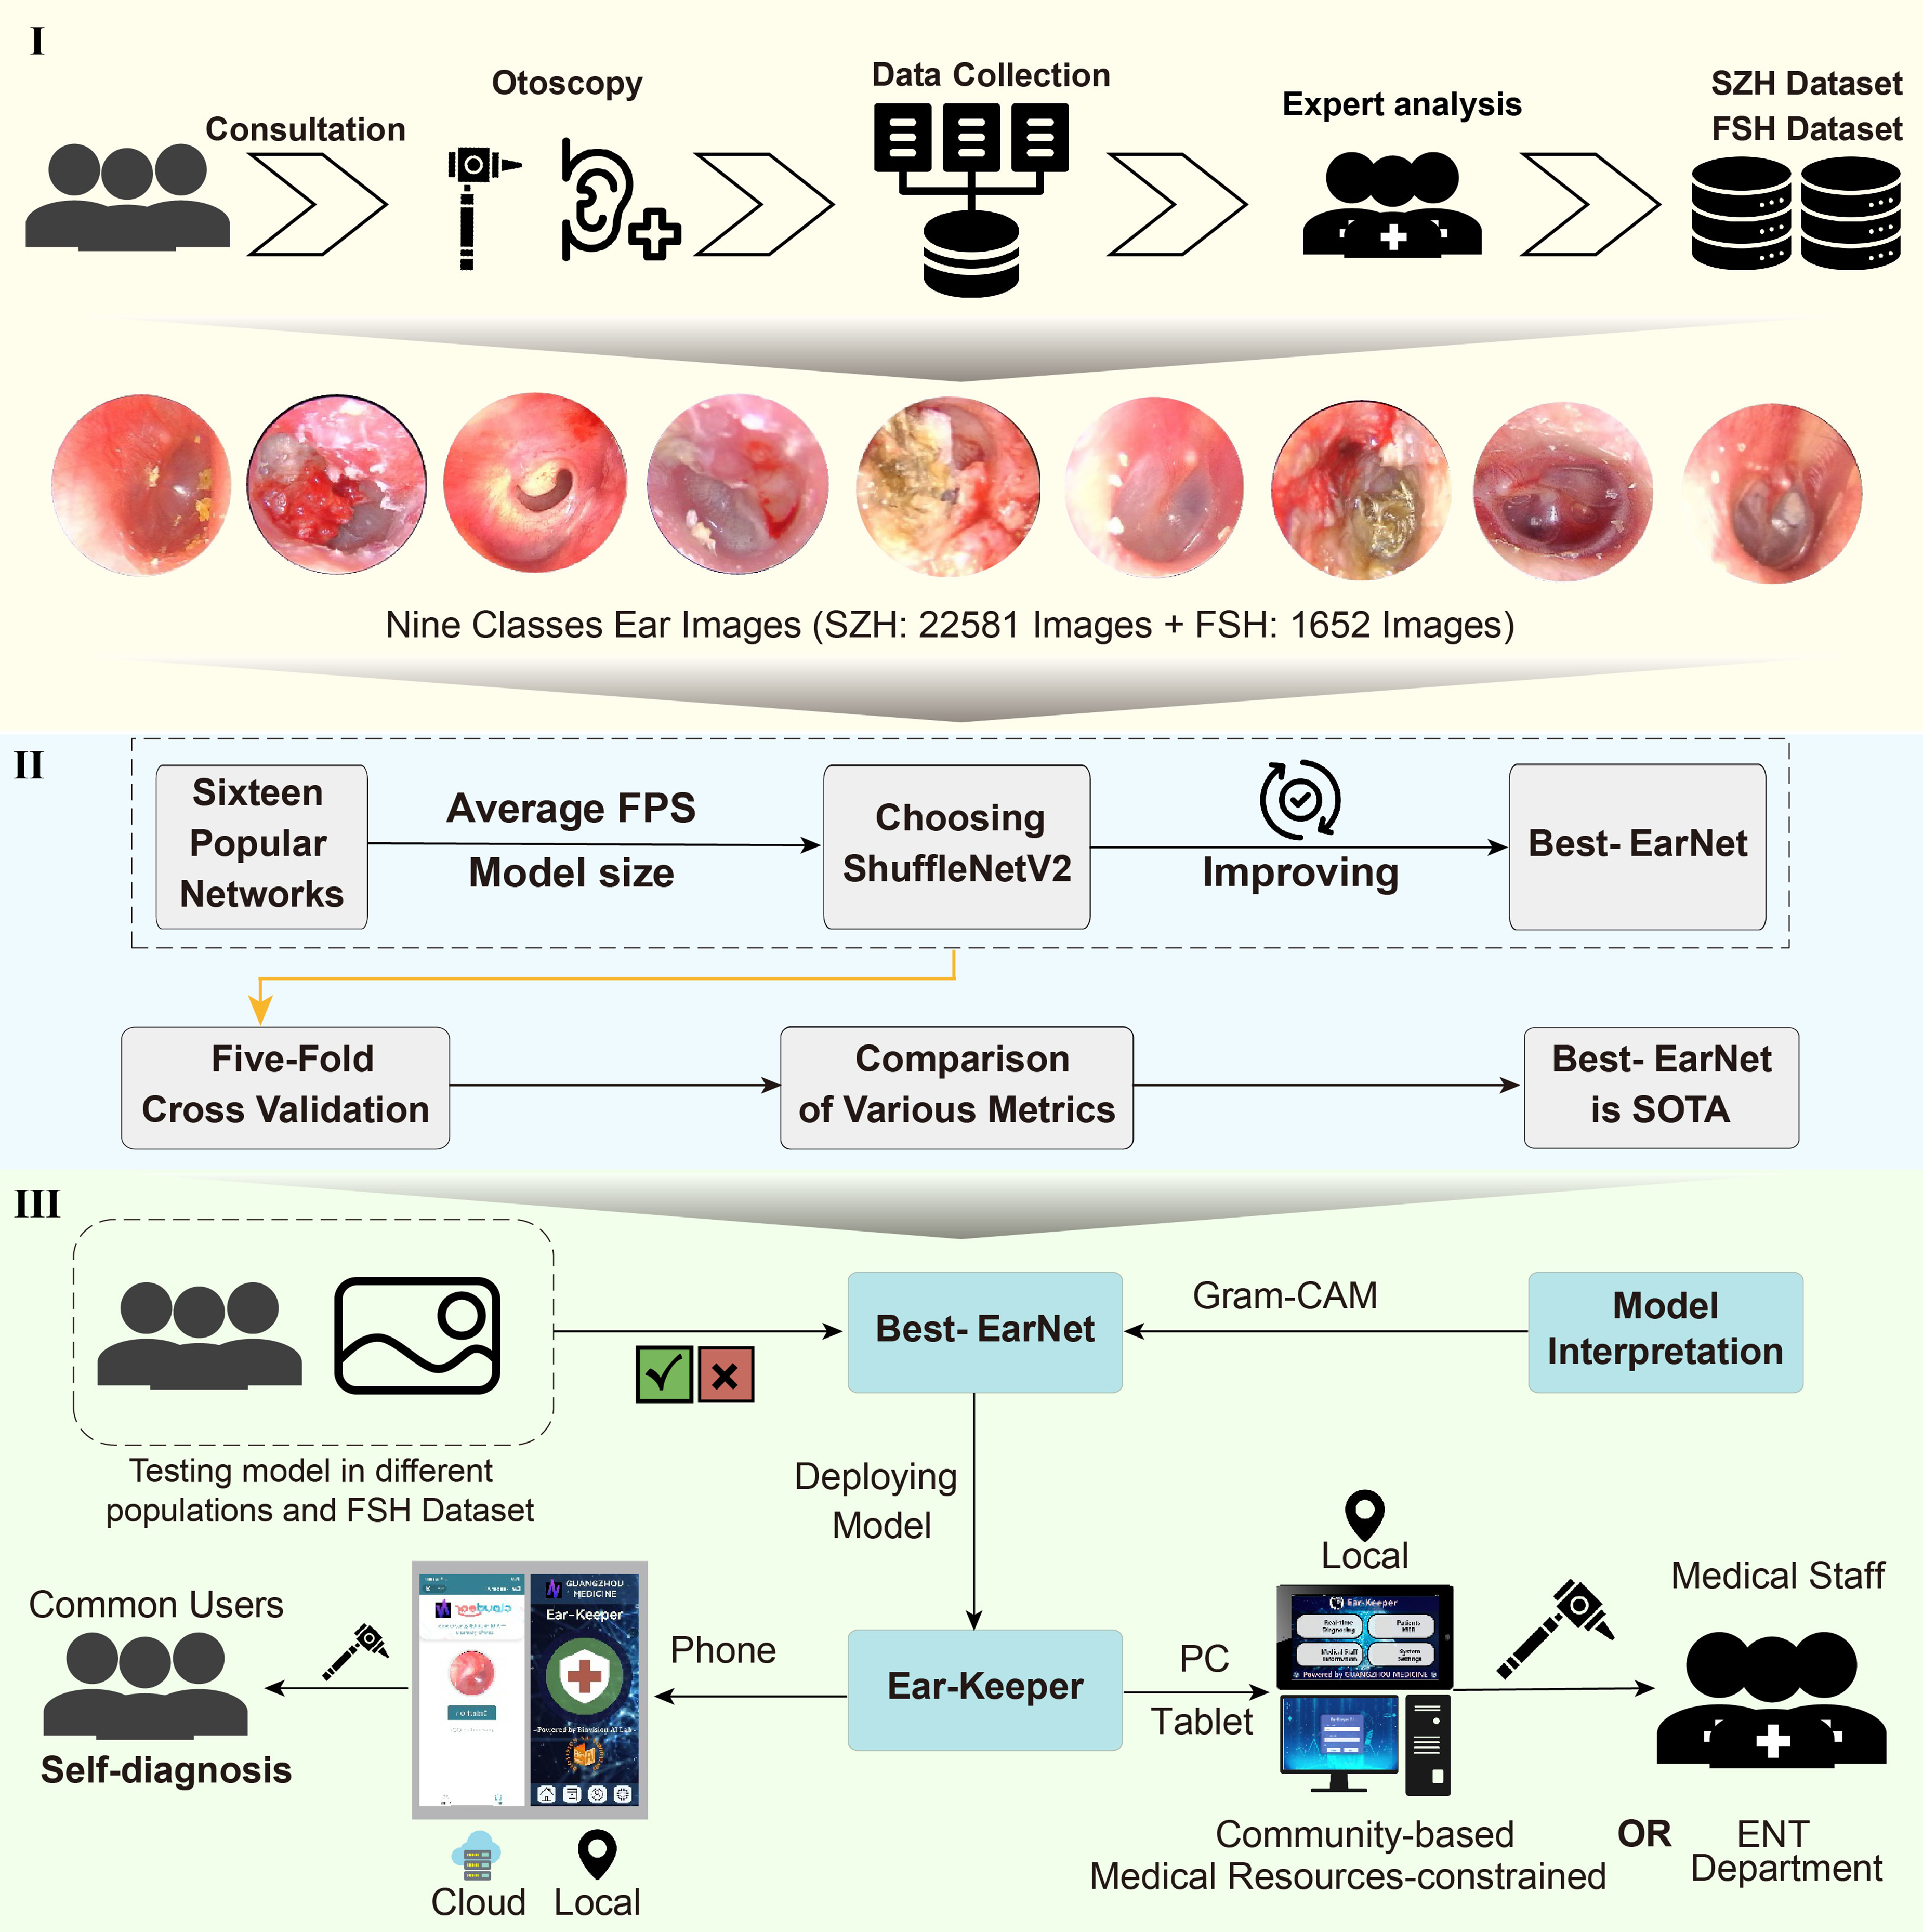
The workflow of this work. (1) Data collection and labeling. (2) Model design. (3) Application development.
Additionally, we further tested the generalization ability of Best-EarNet using an additional test set (FSH dataset) and applied Grad-CAM 32 to visualize the model's decision-making process. Finally, our team developed four versions of the Ear-Keeper application for different devices: Mobile Ear-Keeper (Cloud), Mobile Ear-Keeper (Local), Tablet Ear-Keeper (Local), and PC Ear-Keeper (Local). Due to the outstanding performance of Best-EarNet, the four versions of Ear-Keeper are suitable for different users in various scenarios. Mobile Ear-Keeper (Cloud) and Mobile Ear-Keeper (Local) target general users, allowing individuals to perform self-examinations of their ear canals anytime and anywhere when experiencing ear discomfort. Tablet Ear-Keeper and PC Ear-Keeper target doctors and aim to alleviate the current issues in ear disease diagnosis, such as misdiagnosis and an insufficient number of doctors, thus greatly improving diagnosis efficiency and reducing various costs associated with the traditional diagnosis.
Experimental setup and model frame selection
In this study, hyperparameters—including learning rate, loss function, optimizer, number of epochs, and batch size—were fixed for all experiments, as summarized in Table 4. To ensure strict comparability between architectures, all models were trained using the same fixed hyperparameter configuration without additional tuning. Model performance evaluation was conducted using five-fold cross-validation, where each fold used a fixed training–validation split within the training portion of the data. The test fold in each round was used exclusively for performance assessment. The deep learning framework used in this work was PyTorch (version 2.1.0), and the experiments were conducted on an Ubuntu 22.04 platform with an NVIDIA A40 GPU. The average FPS measurement was performed on a laptop equipped with an Intel® Core™ i7-10870H CPU @ 2.20 GHz.
Hyperparameters adopted in this work.

To obtain suitable model architectures for our design, we selected networks from the following 16 options. These networks encompass state-of-the-art lightweight models as well as those used in relevant works. These networks are DenseNet161, 33 DenseNet169, 33 FasterNet-T0, 34 InceptionV3, 35 MobileFormer, 36 MobileNetV2, 37 MobileNetV3-small, 38 MobileOne-S0, 39 MobileVit-XXS, 40 ResNet50, 41 ResNet101, 41 ShuffleNetV2_X0_5, 16 VGG16, 42 VGG19, 42 ViT-Base, 43 and Xception. 44
Here, ShuffleNetV2_X0_5 was chosen as the baseline with an average FPS of 76 and a parameter count of 1.4 million. To enhance the practicality of the models and ensure fair comparisons, we initialized each network using pretrained weights from the ImageNet dataset. This initialization strategy effectively reduces the training time of the models and alleviates the issue of class imbalance, leading to improved performance and generalization ability.
Comparison of models
We first calculated the average FPS and model parameters size of Best-EarNet, which were 0.77 M and 80, respectively. Then, under the same experimental conditions (the data preprocessing, data augmentation, and training protocols), we conducted five-fold cross-validation on all models. The confusion matrices of ShuffleNetV2_X0_5 and Best-EarNet achieving the best accuracy with and without using ImageNet pretraining in the five-fold cross-validation are shown in Figure 4(a) to (d). The results from the confusion matrices indicate that when using pretraining weights, Best-EarNet achieved slightly lower diagnosis accuracy for IC compared to ShuffleNetV2_X0_5, but showed significant improvements in diagnosing other classes, particularly AOM and CME, with 8% and 9% improvements, respectively.

Comparison of various metrics between ShuffleNetV2_X0_5 and Best-EarNet. (a, b) Confusion matrix with pretrained weights. (c, d) Confusion matrix without pretrained weights. (e) The box plots of Recall, Precision, Specificity, and F1-score. (f) The box plots for Accuracy.
Without using pretraining weights, Best-EarNet had lower diagnosis accuracy for NE compared to ShuffleNetV2_X0_5, but showed significant improvements in diagnosing other classes, with CME improving by 29%. Similar results were observed for the other models from the rest of the folds (Figure S1 in the Supplemental materials). Additionally, Figure 4(e) displays the average accuracy box plot for these four models. The results show that Best-EarNet, with or without pretraining weights, achieved higher average accuracy (95.23% and 93.67%, respectively) compared to the corresponding ShuffleNetV2_X0_5 (93.34% and 90.03%), demonstrating better performance and stability.
To gain a more detailed understanding of the results for each class, we analyzed the Recall, Precision, Specificity, and F1-score for each class, as shown in the box plot in Figure 4(f). The results indicate that under the five-fold cross-validation, regardless of whether pretraining weights were used or not, Best-EarNet outperformed ShuffleNetV2_X0_5 for all nine classes and exhibited lower variability across the five folds. These metric results demonstrate that Best-EarNet exhibits superior diagnosis capability and stability, suggesting the effectiveness of our improvements. It is noteworthy that Best-EarNet achieved nearly a 50% reduction in parameter size while also experiencing a slight improvement in average FPS.
Continuing from there, we performed five-fold cross-validation on the remaining 15 networks. Table 5 summarizes the performance of Best-EarNet, ShuffleNetV2_X0_5, and the other 15 networks across various metrics. Here, each metric represents the average value after five-fold cross-validation. From the analysis of Accuracy, Precision, Recall, Specificity, and F1-score, Best-EarNet achieved commendable results, although it may not have achieved the highest average performance in all metrics. Notably, Best-EarNet surpassed the renowned ResNet50 in terms of Accuracy and outperformed it significantly in terms of average FPS and model parameters size. Furthermore, Best-EarNet exhibited the smallest mean standard deviation (MSD) and 95% CI in Precision, Recall, F1-score, and Specificity. To further evaluate the performance differences among the models, we analyzed the 95% CI of Recall (Figure 5), F1-score (Figure S2 in the Supplemental materials), Precision (Figure S3 in the Supplemental materials), Accuracy (Table S1 in the Supplemental materials), and Specificity (Table S2 in the Supplemental materials) for all models. The results demonstrated that, similar to MSD, Best-EarNet consistently displayed superior performance in the 95% CI of each class, indicating its robustness.

(a) The 95% CI Recall for all models in each category. (b) The RSN of Recall, F1-score, Precision, Accuracy, and Average FPS for all models. (c) The ORS of all models. CI: confidence interval; RSN: ranking score normalization; FPS: frames per second; ORS: overall ranking score.
Performance of various models on various metrics.
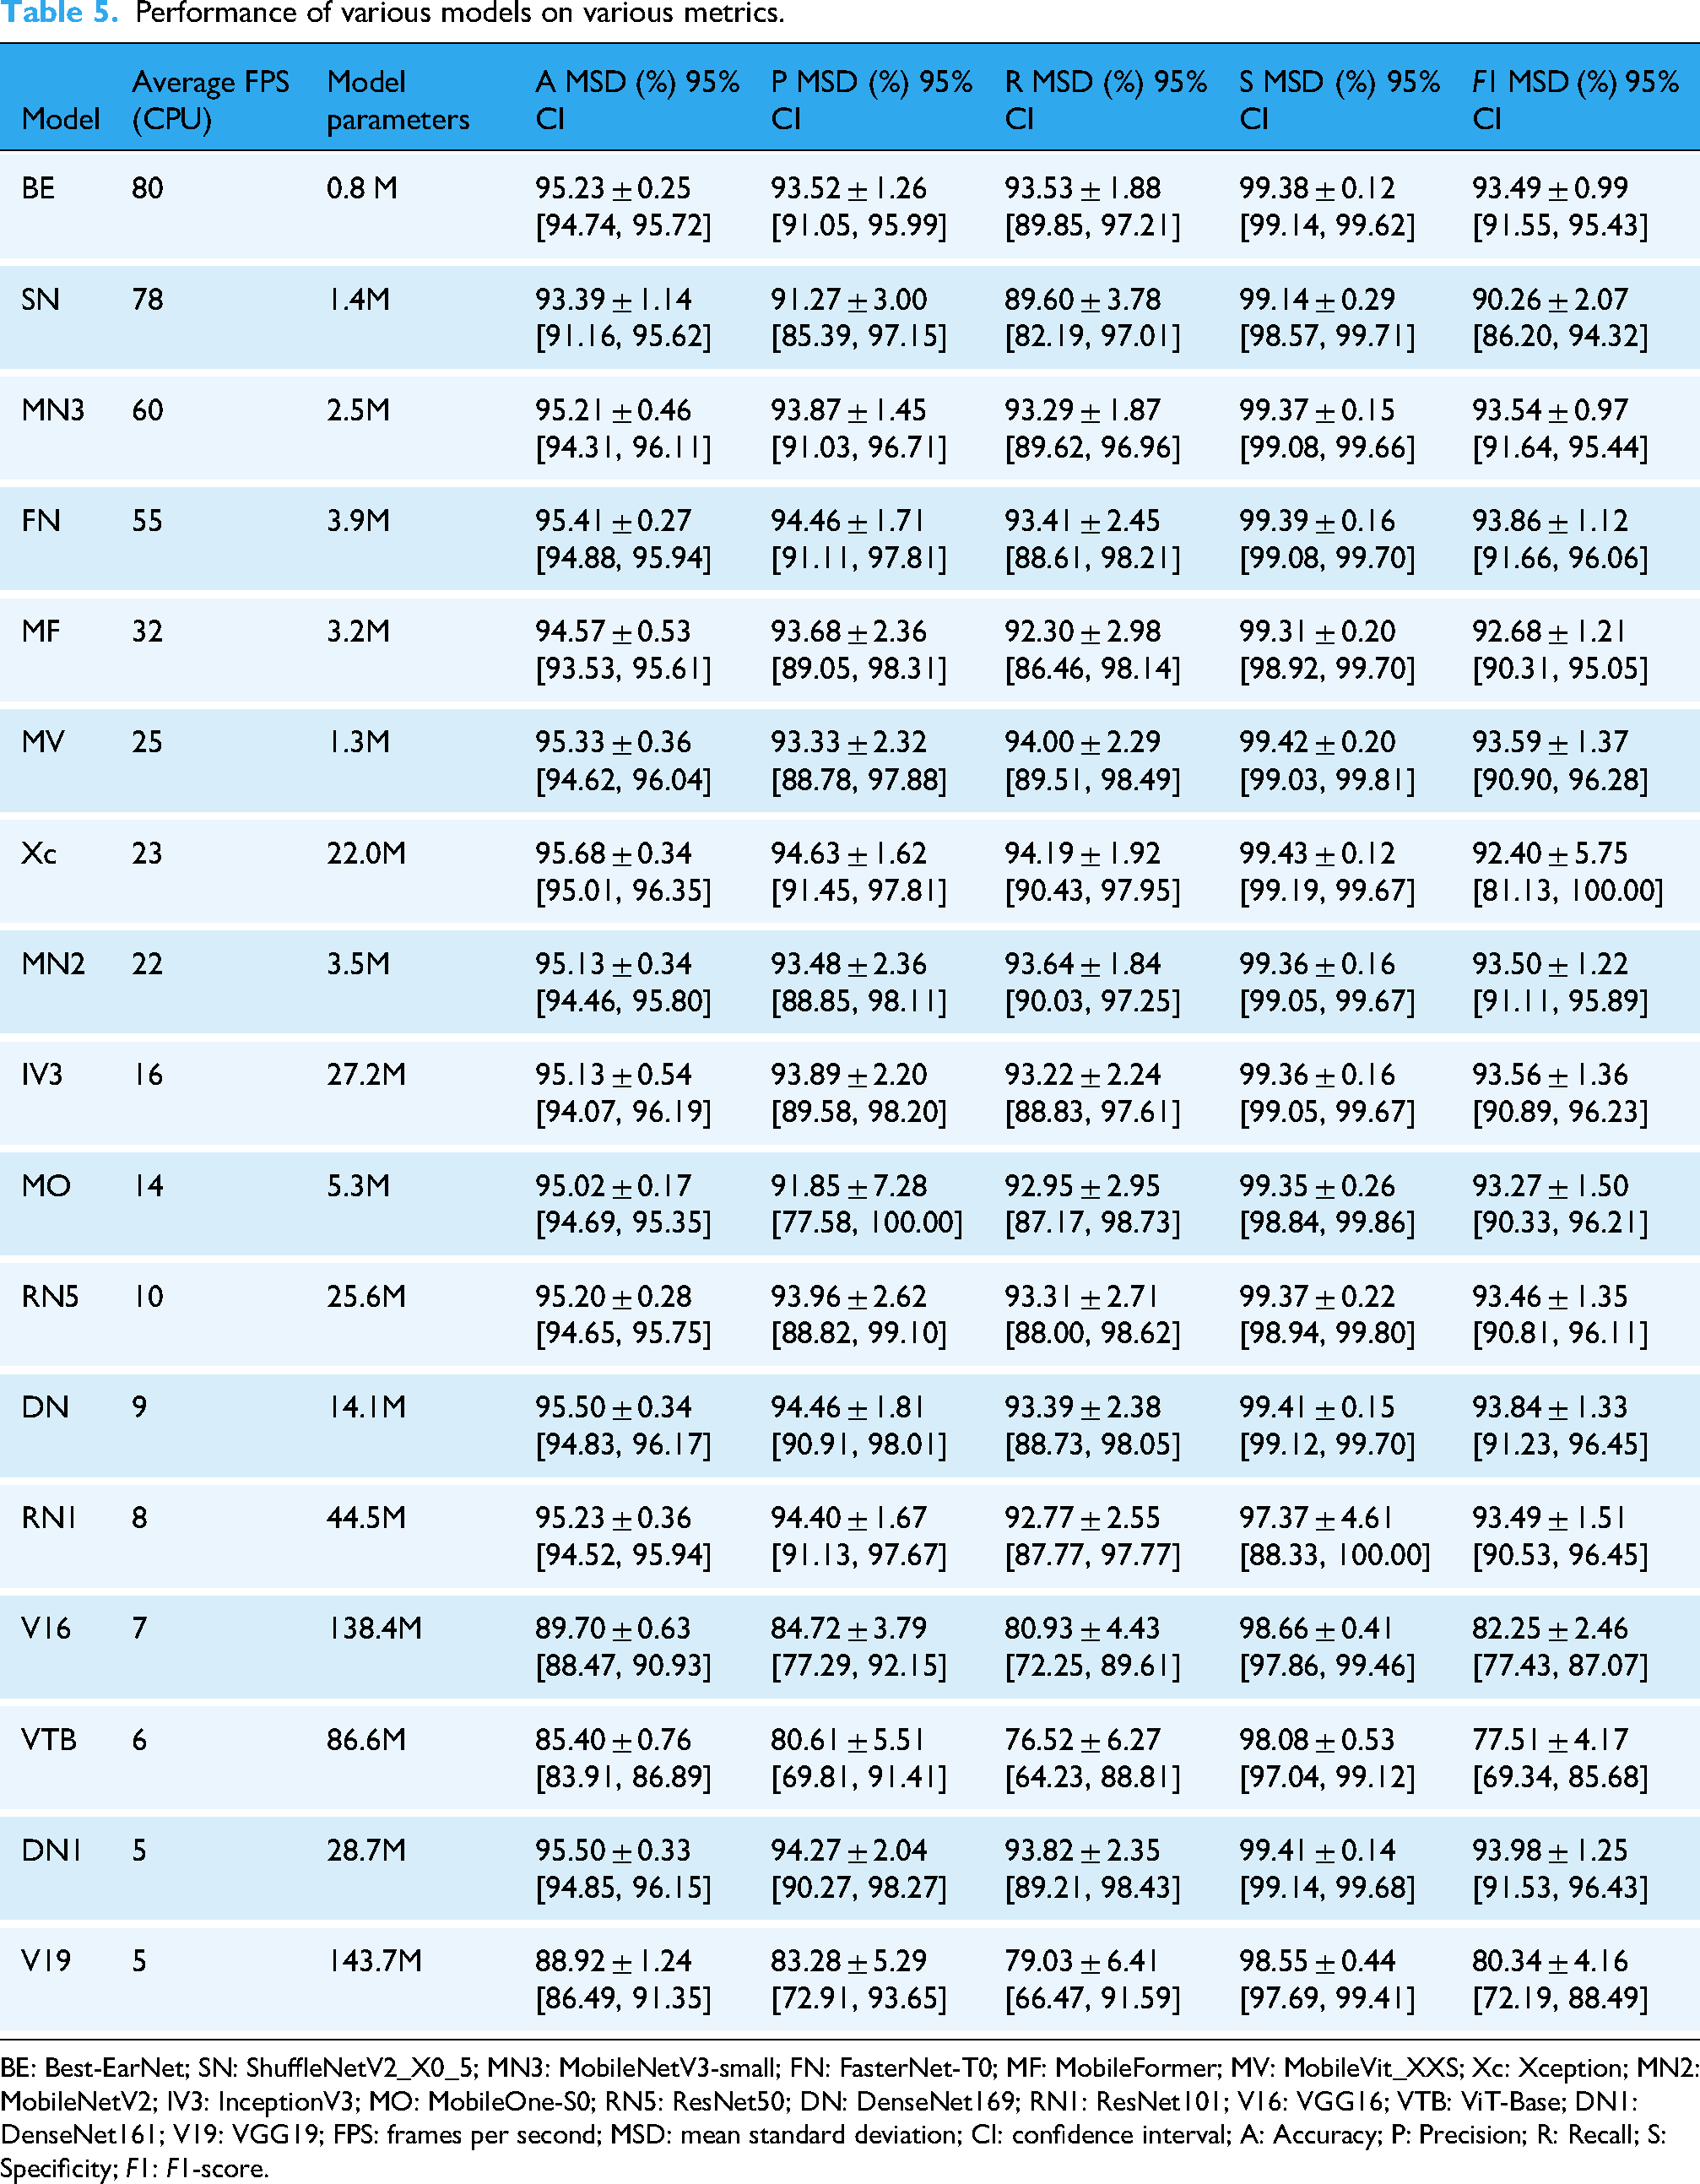
BE: Best-EarNet; SN: ShuffleNetV2_X0_5; MN3: MobileNetV3-small; FN: FasterNet-T0; MF: MobileFormer; MV: MobileVit_XXS; Xc: Xception; MN2: MobileNetV2; IV3: InceptionV3; MO: MobileOne-S0; RN5: ResNet50; DN: DenseNet169; RN1: ResNet101; V16: VGG16; VTB: ViT-Base; DN1: DenseNet161; V19: VGG19; FPS: frames per second; MSD: mean standard deviation; CI: confidence interval; A: Accuracy; P: Precision; R: Recall; S: Specificity; F1: F1-score.
However, in the MSD and 95% CI results for Accuracy, Precision, Recall, Specificity, and F1-score, some models exhibited similar results, making it challenging to rank and evaluate the models effectively. To provide a comprehensive ranking of the models, we analyzed them based on the proposed ORS and RSN. The findings revealed that Best-EarNet consistently ranked among the top models across all metrics (Figure 5(b)), particularly exceling in the ORS metric (Figure 5(c)), where it achieved state-of-the-art performance.
Comparative analysis using one-sample t-tests demonstrated that Best-EarNet exhibited significant superiority in computational efficiency, achieving an average inference speed of 80 FPS, substantially higher than the mean of 31.65 ± 25.3 FPS observed across 16 comparator models (t = 3.062, p < 0.01, Cohen's d = 1.92), while maintaining a model size of only 0.8 million parameters, significantly lower than the control group mean of 34.5 ± 42.8 million parameters (p < 0.05). With respect to classification performance, Best-EarNet demonstrated accuracy (95.23%), precision (93.52%), recall (93.53%), and F1-score (93.49%) metrics that consistently ranked within the top quartile of evaluated models (all above the 75th percentile), showing no significant difference from the highest-performing model Xception (95.68% accuracy, p > 0.05). Notably, Best-EarNet achieved a specificity of 99.38%, significantly exceeding the comparator mean of 98.86 ± 0.38% (p < 0.05), suggesting superior false-positive control with potential clinical advantages. When integrating efficiency and performance metrics, Best-EarNet demonstrated exceptional parameter efficiency (accuracy-to-parameter ratio of 119.04, the highest among all models), indicating substantial practical utility for deployment in resource-constrained clinical settings, particularly for edge computing devices and real-time diagnostic systems.
The comprehensive analysis of the metrics demonstrates that Best-EarNet performs well in the task of diagnosing ear lesions. Additionally, its unique network architecture design enables it to achieve ultra-fast average FPS and a remarkably small model parameter size. As anticipated, Best-EarNet effectively balances diagnosis capability, inference speed, and model parameter size.
Ablation experiment
In order to fully demonstrate the effectiveness of our improvement, we conducted detailed ablation experiments. We evaluated the performance of models with different components using the five-fold cross-validation strategy in the same experimental environment. Table 6 provides a detailed report on the metric results of different models. The experimental results show that the proposed LGSFF effectively improves the performance of ShuffleNetV2. At the same time, the proposed branch path and the use of auxiliary classification heads have also improved the various metric results of ShuffleNetV2 to varying degrees.
Performance comparison of models with different components.

LGSFF: local–global spatial feature fusion.
Testing on different populations and FSH dataset
The incidence and severity of ear diseases are often influenced by age and gender. So, to further understand the diagnosis capabilities of the model, detailed testing was conducted using Best-EarNet on various populations categorized by gender and age (Figure 6(a) and (b)). The experimental results demonstrate that Best-EarNet exhibits excellent diagnosis capabilities across all genders and age groups. It is worth noting that due to the relatively small number of images for AOM, Best-EarNet's diagnosis performance for AOM may be slightly lower compared to other conditions.

The test results of the model Best-EarNet. (a, b) The distribution of testing accuracy of the Best-EarNet in different genders and age groups. (c) Best-EarNet testing in the FSH dataset. (d) Classes extension testing of Best-EarNet. (e) The confusion matrix of FSH dataset calculated by Best-EarNet with 92.98% Accuracy. (f) The receiver operating characteristic of FSH dataset calculated by Best-EarNet with 92.98% Accuracy.
Furthermore, Best-EarNet was subjected to cross-site testing using the FSH dataset (Figure 6(c)). The five-fold cross-validation yielded accuracy rates of 92.98%, 91.34%, 92.43%, 92.07%, and 91.89%, demonstrating high and stable accuracy. As our model's corresponding categories do not cover all types of ear diseases, we conducted category expansion experiments to test the model's applicability for future category expansion. For example, in the N-class testing, we randomly selected N classes from the nine available classes for model training and testing (each N-class testing needs to be repeated six times). The results are shown in Figure 6(d). The Accuracy for two and three categories exceeded 99%, and as the number of categories increased, the accuracy slightly decreased. However, when the number of categories reaches six or more, the Accuracy became stabilized, remaining above 95%. This indicates that Best-EarNet has good category expansion capabilities. We selected the model with an accuracy of 92.98% as the final deployment model. To provide comprehensive data support for our practical deployment, we generated the corresponding confusion matrix (Figure 6(e)) and ROC (Figure 6(f)).
Visual understanding of Best-EarNet decisions
In the field of medical image processing, model interpretability is crucial for assisted diagnosis, compliance requirements, patient safety, trust building, and model optimization. By explaining the model's prediction results and inference process, the credibility and reliability of medical image processing models can be improved, providing better decision support for healthcare professionals and patients. 45
In this study, we employed the Grad-CAM method to visualize and interpret the decision results of Best-EarNet. Grad-CAM is an interpretability technique used to visualize the attention regions within deep neural networks to understand the image regions that the model focuses on during the prediction process. It maps the network's activations to the input image space, generating a heat map. In this process, it calculates the gradients of each output class by backpropagation and multiplies the gradients with the activation feature maps.
Figure 7 presents the results of Grad-CAM. It can be observed that Best-EarNet effectively focuses on the important regions of each class image, consistent with the areas of interest for clinical doctors. These results not only explain the decision process of Best-EarNet but also serve as a reminder for users to pay attention to specific regions in subsequent real-world applications.

Grad-CAM results of various samples. The first row shows the original image, the second row is the annotation by professional doctors, and the third row is the Grad-CAM. Grad-CAM: gradient-weighted class activation mapping.
Comparison of various versions of Ear-Keeper
After comprehensive model evaluation, we developed four versions of the application using the Python/Java programming language. The tablet and PC versions run on Ubuntu 20.04 and Windows 10 operating systems, respectively. The Mobile (Cloud) and Mobile (Local) versions are designed for the Android platform. The physical products of each version and the operation page are shown in Figure 8 and Figure S4 in the Supplemental materials, respectively.

The application pages of various versions. (a) The main pages of Tablet Ear-Keeper (Local). (b) The main pages of PC Ear-Keeper (Local). (c) The main pages of Mobile Ear-Keeper (Cloud). (d) The main pages of Mobile Ear-Keeper (Local). PC: personal computer.
The Tablet Ear-Keeper (Local) (Figure 8(a)) is an integrated device equipped with a 12th Gen Intel® Core™ i5-1240P CPU. During practical usage, the diagnosis speed ranges from 45 to 56 FPS. This device operates independently without requiring an internet connection, making it suitable for medical settings with limited resources. Medical professionals can simply insert an electronic otoscope into the tablet to perform real-time monitoring and diagnosis of the ear. The PC Ear-Keeper (Local) (Figure 8(b)) is an offline application that can be deployed on computers in specialized otolaryngology departments. It contributes to improved efficiency in traditional outpatient examinations and enhances the patient experience. The application was tested on a laptop equipped with an AMD Ryzen 5 4500U CPU with Radeon Graphics. Due to the activation of the heat map display feature, the actual FPS during usage ranges approximately from 25 to 30 (without the heat map feature, the FPS is around 50 to 55). For users who prefer a simpler mobile application, we offer the Mobile Ear-Keeper (Cloud) version (Figure 8(c)). This version requires an internet connection and involves capturing ear images in advance using an otoscope, which are then uploaded to our server to obtain the corresponding diagnosis results. The Mobile Ear-Keeper (Local) (Figure 8(d)) is a powerful mobile application similar to the tablet version but more convenient, catering to nonprofessionals. Users only need to insert an electronic otoscope into their mobile devices to perform real-time ear monitoring. The application retains a record of each diagnosis. We tested this application on a Huawei DVC-AN20 device, which utilizes the MediaTek MT6873 5G CPU. The real-time FPS during usage ranges from 35 to 45. Additionally, when saving images of ear lesions, we employed OpenCV to evaluate image clarity in the PC, Tablet, and Mobile (Local) versions. Only images judged as clear were recorded.
Discussion
The Best-EarNet model developed in this study achieved an average inference speed of 80 FPS with a parameter size of only 0.77 M. Using five-fold cross-validation on 24,432 otoscopic images, the model reached an accuracy of 95.23% on the internal test set and 92.14% on the external test set. It also demonstrated consistently strong performance across different age groups and geographic regions. In addition, the model showed good adaptability across diverse ear disease application scenarios and device types, and maintained stable performance in category-expansion experiments, indicating strong potential for sustainable scalability. Building upon this model, we developed the Ear-Keeper application system for multiple deployment environments—including cloud-based, PC-based, mobile-based, and tablet-based platforms—all of which demonstrated excellent responsiveness during testing.
Otolaryngology is a special department in hospitals that deals with a diverse patient population distributed across various departments. However, there exists a significant gap between this department and others in diagnosis. Especially, in the case of ear diseases, other departments may struggle to differentiate between various subtypes of otitis media, leading to misdiagnosis and delayed treatment, such as in pediatrics and emergency medicine. On the other hand, the increasing number of healthcare visits related to ear diseases has resulted in reduced access to diagnosis and treatment opportunities in certain regions, especially in the postpandemic era. For common ear diseases with high incidence rates, intelligent and convenient diagnosis devices can alleviate these issues and provide more effective diagnoses. They can also enable people in underserved areas to access convenient and reliable examinations.
Although several studies have investigated AI-based recognition of ear diseases, most prior work has primarily emphasized model development and accuracy validation under controlled experimental settings. These studies often used relatively small or single-center datasets and paid limited attention to practical deployment factors such as inference speed, model size, device adaptability, or performance across real-world imaging conditions. As a result, existing models have rarely been evaluated in scenarios that reflect actual clinical or community use. In contrast, our study takes a deployment-oriented perspective by addressing the full pipeline from model design to practical implementation. We constructed a large-scale, multicenter dataset capturing diverse imaging variations, systematically benchmarked 16 representative lightweight and standard architectures, and developed Best-EarNet—a model optimized for diagnostic accuracy, computational efficiency, and real-time performance. Notably, Best-EarNet achieves real-time inference (80 FPS) on standard CPUs with a model size of only 2.94 MB, making it suitable for resource-constrained environments. Furthermore, the Ear-Keeper system extends the model to multiple platforms—including cloud, PC, tablet, and mobile devices—thereby enabling broad accessibility in both clinical and community settings. The integration of Grad-CAM also enhances interpretability by highlighting lesion-associated regions, improving user trust and clinical relevance. These features collectively distinguish our work from previous studies and highlight its potential for large-scale, real-world application.
Ear-Keeper is designed as a diagnostic support tool intended for multiple use cases: (1) professional use by healthcare providers for enhanced diagnostic accuracy and efficiency in clinical settings, (2) screening and triage applications in resource-limited environments and primary care settings, and (3) preliminary screening by trained individuals in community health programs. While the system includes mobile applications that could theoretically enable public self-use, we emphasize that Ear-Keeper is not intended as a replacement for professional medical evaluation. It is also necessary to be aware of the relevant precautions, such as “The results of this identification can only be used as a reference. The final diagnosis result should be based on the professional diagnosis of a doctor.”
In practical deployment, Ear-Keeper provides multiple application versions that can support remote consultations, primary-care screening, and community health programs. For real-time assessments in telemedicine or outpatient scenarios, both the Tablet Ear-Keeper (Local) and Mobile Ear-Keeper (Local) versions can perform all inference operations directly on the device without requiring internet connectivity. These local-processing versions allow healthcare providers—or trained community health workers—to insert an electronic otoscope into the device and obtain immediate diagnostic feedback with heat maps, making them well-suited for environments with limited resources or unreliable internet access. For settings where image capture and centralized remote review are preferred, the PC Ear-Keeper (Local) application can be used to extract frames from otoscopic videos and automatically filter for clarity using an OpenCV-based method. These selected high-quality frames can then be reviewed by specialists in asynchronous remote workflows. Additionally, the Mobile Ear-Keeper (Cloud) version enables users to capture still ear images and upload them securely to the server to obtain diagnostic results, facilitating remote expert consultation when real-time on-device inference is not necessary. With respect to data security, deployment mode plays a key role. Local (edge) deployment—as implemented in the Tablet, PC, and Mobile (Local) versions—keeps all processing on the user's device, minimizing data transmission and reducing privacy risk. Cloud-based deployment offers the convenience of remote expert involvement and centralized model management but requires encrypted data transmission and compliance with institutional or regional data-protection standards. The choice between cloud and edge deployment should therefore be tailored to the clinical environment, internet conditions, and security requirements.
Our findings also provide preliminary insight into the model's generalizability across different otoscope brands, acquisition protocols, and patient populations. The two centers contributing internal and external datasets used different otoscope brands and imaging workflows, which naturally introduced noticeable variability in image quality (resolution, saturation, and lighting). The internal dataset was collected using higher-quality imaging equipment with standardized acquisition processes, which contributed to the higher accuracy of 95.23%. In contrast, the external dataset exhibited noticeable variability in image quality due to differences in devices, operators, and clinical workflows; nevertheless, the model still achieved 92.14% accuracy. These results suggest that the model has the potential to maintain stable performance under diverse imaging conditions and across different populations.
Although the model achieved encouraging results across internal and external datasets, several limitations should be acknowledged. First, all data were collected from two hospitals in China, and the lack of multicountry cohorts may limit generalizability to broader global populations. Second, the study design was retrospective, and prospective, real-world evaluations are still needed to further establish clinical effectiveness and safety. Third, certain diagnostic categories were underrepresented in the dataset, and this class imbalance may influence the model's performance on rare ear conditions. In addition, no formal sample size calculation was performed prior to analysis, which may affect the statistical rigor of the study and should be considered when interpreting the findings. Fourth, although the external validation involved two centers using different otoscope brands and acquisition workflows, the number of centers remains limited, and we were therefore unable to perform systematic robustness testing across a wider range of devices, imaging protocols, and lighting conditions. Finally, no domain adaptation or device-specific robustness testing was performed in this study.
Our future work will focus on several directions to further enhance the clinical readiness and generalizability of the Ear-Keeper system. First, we plan to expand data collection to include hospitals from additional regions and countries, enabling large-scale, multi-ethnic validation. Second, prospective studies will be conducted to evaluate real-world performance, user experience, and clinical workflow integration. Finally, we aim to extend the system to additional ear disease categories and develop more advanced multimodal diagnostic functions by integrating clinical metadata and patient-reported symptoms. These efforts will pave the way toward a more comprehensive, scalable, and clinically deployable AI solution for ear disease diagnosis.
Conclusions
In summary, the proposed Best-EarNet model achieves an effective balance among inference speed, model size, and diagnostic performance, advancing the application of AI in automated recognition of ear diseases. Furthermore, Ear-Keeper system developed based on Best-EarNet supports deployment across multiple platforms and use cases, providing a practical and accessible intelligent assistant for a broad range of users. In particular, for developing countries and regions with limited medical resources, Ear-Keeper has the potential to facilitate earlier detection and timely intervention of ear diseases, thereby helping reduce the substantial health and economic burdens associated with these conditions.
Supplemental Material
sj-docx-1-dhj-10.1177_20552076251412635 - Supplemental material for Ear-Keeper: A cross-platform artificial intelligence system for rapid and accurate ear disease diagnosis
Supplemental material, sj-docx-1-dhj-10.1177_20552076251412635 for Ear-Keeper: A cross-platform artificial intelligence system for rapid and accurate ear disease diagnosis by Feiyan Lu, Yubiao Yue, Zhenzhang Li, Meiping Zhang, Wen Luo, Fan Zhang, Tong Liu, Jingyong Shi, Guang Wang and Xinyu Zeng in DIGITAL HEALTH
Supplemental Material
sj-pdf-2-dhj-10.1177_20552076251412635 - Supplemental material for Ear-Keeper: A cross-platform artificial intelligence system for rapid and accurate ear disease diagnosis
Supplemental material, sj-pdf-2-dhj-10.1177_20552076251412635 for Ear-Keeper: A cross-platform artificial intelligence system for rapid and accurate ear disease diagnosis by Feiyan Lu, Yubiao Yue, Zhenzhang Li, Meiping Zhang, Wen Luo, Fan Zhang, Tong Liu, Jingyong Shi, Guang Wang and Xinyu Zeng in DIGITAL HEALTH
Supplemental Material
sj-pdf-3-dhj-10.1177_20552076251412635 - Supplemental material for Ear-Keeper: A cross-platform artificial intelligence system for rapid and accurate ear disease diagnosis
Supplemental material, sj-pdf-3-dhj-10.1177_20552076251412635 for Ear-Keeper: A cross-platform artificial intelligence system for rapid and accurate ear disease diagnosis by Feiyan Lu, Yubiao Yue, Zhenzhang Li, Meiping Zhang, Wen Luo, Fan Zhang, Tong Liu, Jingyong Shi, Guang Wang and Xinyu Zeng in DIGITAL HEALTH
Footnotes
Acknowledgments
The authors would like to thank Wenrui Wu and Zefeng Xie for their assistance in the preparation and recording of the demonstration video, which greatly facilitated the presentation of this work.
Ethical considerations
The research protocol of this study was approved by the Review Committee of the Second Affiliated Hospital of Shenzhen University (Approval No. BY-EC-SOP-006-01.0-A01) and the Review Committee of Foshan Sanshui District People's Hospital (Approval No. SRY-KY-2023045).
Author contributions
Funding
The authors disclosed receipt of the following financial support for the research, authorship, and/or publication of this article: This work was financially supported by the Guangzhou Science and Technology Plan Project (No. 202201011696) and The scientific research capacity improvement project of the doctoral program construction unit of Guangdong Polytechnic Normal University in 2022 (No. 22 GPNUZDJS31).
Declaration of conflicting interests
The authors declared no potential conflicts of interest with respect to the research, authorship, and/or publication of this article.
Data availability
The raw clinical images cannot be publicly released due to patient privacy, but they are available from the corresponding author upon reasonable request. The following links provide demonstration videos of various versions of Ear-Keeper: https://alist.kirino.io/video_1755834647766.mp4 (Mobile Ear-Keeper (Local)); https://alist.kirino.io/video_1755834699084.mp4 (Tablet Ear-Keeper (Local)); https://alist.kirino.io/video_1755834134222.mp4 (PC Ear-Keeper (Local)); and ![]() (Mobile Ear-Keeper (Cloud)).
(Mobile Ear-Keeper (Cloud)).
Supplemental material
Supplemental material for this article is available online.
References
Supplementary Material
Please find the following supplemental material available below.
For Open Access articles published under a Creative Commons License, all supplemental material carries the same license as the article it is associated with.
For non-Open Access articles published, all supplemental material carries a non-exclusive license, and permission requests for re-use of supplemental material or any part of supplemental material shall be sent directly to the copyright owner as specified in the copyright notice associated with the article.