
Abstract
Objective
To fill the benchmarking gap in clinician–patient sentiment analysis, we compare deep learning, transformer, and ensemble models for three-class (low/medium/high) sentiment classification in doctor–patient consultations.
Methods
We used a publicly available dataset of 3325 anonymized doctor–patient consultations from the Hugging Face repository (mahfoos/Patient-Doctor-Conversation) labeled as low, medium, or high severity. Preprocessing included text cleaning, tokenization, and padding; class balancing was applied only within the training split of each fold. Models evaluated were long short-term memory (LSTM), bidirectional LSTM (BiLSTM), convolutional neural networks (CNN), CNN–LSTM, and bidirectional encoder representations from transformers (BERT); an ensemble (hard voting over Logistic Regression, Random Forest, and Support Vector Classifier (SVC)) was also tested. Evaluation used stratified five-fold cross-validation, with metrics reported as mean ± SD across outer test folds (accuracy; macro-averaged precision/recall/F1). Interpretability was examined via BERT attention and feature attributions.
Results
The ensemble achieved the highest accuracy (75.5 ± 0.5), outperforming BERT (66.98 ± 0.6), CNN–LSTM (65.68 ± 0.9), CNN (64.17 ± 0.8), BiLSTM (64.82 ± 0.7), and LSTM (58.66 ± 0.19). Class-wise analysis showed robust detection of high-severity interactions (e.g. ensemble F1 = 90.8 ± 1.3), while low-severity remained most challenging; the ensemble improved class 0 recall (58.7 ± 1.0), and BERT provided the highest class 0 precision (65.5 ± 1.0).
Conclusion
Under stratified five-fold cross-validation, ensemble learning delivered the strongest and most balanced performance for three-class sentiment classification of clinician–patient dialogue, while transformers offered complementary precision on difficult cases. Attention- and feature-attribution analyses improved transparency, supporting clinical interpretability. Future work should scale to larger, multimodal (text/audio/vision) and multilingual datasets, and develop privacy-preserving, lightweight models for real-time deployment in clinical settings.
Introduction
The advent of artificial intelligence (AI) has transformed many fields, including healthcare, with the potential to improve the effectiveness and quality of interactions between doctor and patient. 1 Efficient communication between physicians and patients is critical, as it directly influences patient satisfaction, adherence to medical recommendations, and overall health outcomes. 2 For instance, studies have shown that empathetic communication can improve patient trust and compliance by up to 20%. However, the nuanced nature of human sentiments and communication makes it challenging to understand and assess these interactions fully. This has galvanized interest in using AI-driven sentiment analysis (SA) to address the gap between human empathy and data-driven insights in healthcare settings. 3 While prior work, such as Huang et al., 4 achieved promising results in emotion recognition using video-based doctor–patient interactions. However, its reliance on multimodal inputs limits its applicability to text-based settings common in telemedicine.
In the rapidly developing field of SA, traditional machine learning (ML) and advanced deep learning (DL) methods have become the main focus. 5 Sentiment analysis is a powerful tool for extracting insight from unstructured data, supporting decision making in e-commerce, education, social networks, and healthcare. For example, Mujahid et al. 6 achieved 95% accuracy in analyzing sentiments in e-learning tweets, but their focus on simpler, nonmedical datasets highlights the challenge of applying SA to complex healthcare dialogs. Similarly, Khan et al. 7 reported 96% accuracy in sentiment classification of COVID-19-related tweets using lexicon-based and ML techniques, yet their binary classification approach does not address the multiclass emotional intensity required in doctor–patient interactions.
The continued development of digital platforms, especially social media, has generated a wealth of data reflecting public sentiment. 8 Platforms such as Twitter and professional services (e.g. online consulting, academic networks, and portals) provide rich, if noisy, data sources. Applying robust methods to evaluate this data can significantly improve engagement strategies. By using AI methods to evaluate conversations, clinicians, and managers can gain insight into patient emotions, 4 identify potential problems, 9 and improve care. 10 Although lexicon-based techniques provide initial understanding by utilizing predefined emotion dictionaries, their limitations, such as oversimplification of linguistic complexity, require additional sophisticated methods. For instance, Aljedaani et al. 11 achieved 97% accuracy in Twitter sentiment analysis using hybrid long short-term memory (LSTM), gated recurrent unit (GRU) models, but their approach was not tailored to healthcare's nuanced, domain-specific language. Hybrid models that combine these techniques with deep learning architectures such as LSTM networks, bidirectional LSTM (BiLSTM), and convolutional neural networks (CNNs) offer an encouraging way forward. These approaches exploit the temporal and local properties of sequence data. In particular, recurrent models such as LSTM and BiLSTM are well-suited for capturing sequential dependencies in dialogue, while CNNs excel at identifying local textual patterns. Hybrid CNN-LSTM architectures better combine these strengths to represent temporal and local language features. Recently, transformer-based models like BERT have advanced sentiment analysis by providing deep contextual representations, making them especially effective in addressing the complexity and variability of healthcare communication.
Despite progress in SA, significant challenges persist. Current techniques often suffer from application-specific linguistic complexity, 12 human expression variability, 13 potential biases in automated analysis. 14 For example, studies like reference [15] achieved 96.49% accuracy using BERT for ChatGPT-related tweet analysis, but their reliance on single-platform data limits generalizability to diverse healthcare datasets. To address these limitations, this work emphasizes application-specific datasets and incorporates robust preprocessing methods to reduce inconsistencies and noise within the data. Furthermore, integrating explanation mechanisms can provide a more interpretable and transparent model to ensure that results are actionable and accessible to healthcare professionals.
By advancing SA methods in the context of doctor–patient interactions, this study contributes to developing a body of knowledge about the application of AI in healthcare. The results of this research could reshape how physicians approach patient engagement, providing them with tools to understand and address patients’ sentiments, expectations, and concerns. This aligns with the broader vision of creating a compassionate, patient-focused healthcare system that utilizes artificial intelligence to deliver efficient and empathetic care.
In this regard, the objectives of this study are: (i) to compare the effectiveness of different deep learning and machine learning approaches for multiclass sentiment classification in doctor–patient interactions, (ii) to address domain-specific challenges such as noisy language and class imbalance, and (iii) to investigate ways of improving interpretability to support clinical trust. This research not only aims to advance the theoretical understanding of SA frameworks, 16 but also provides a practical roadmap for applying these models in real-world healthcare scenarios.
The main contributions of this study are as follows:
A comparative framework that systematically evaluates multiple deep learning architectures (LSTM, BiLSTM, CNN, CNN-LSTM, and BERT) alongside a hard-voting ensemble of traditional machine learning classifiers (Logistic Regression, Random Forest, and Support Vector Classifier (SVC)), providing one of the first direct comparisons of these approaches for sentiment analysis in doctor–patient interactions. Domain-specific preprocessing and training-only class-balancing strategies integrated into the pipeline to effectively handle noisy language and sentiment imbalance, ensuring robust predictions across low, medium, and high-severity emotional classes. Enhanced model interpretability by fine-tuning BERT and visualizing attention maps, providing transparency into the linguistic cues that drive predictions and supporting clinical trust in AI-driven sentiment analysis (Figure 1).

Medical consultation emphasizes doctor–patient communication.
Related work
SA has been extensively explored across various domains, including healthcare, education, and social media, with techniques ranging from lexicon-based methods to advanced DL models. Table 1 summarizes key studies relevant to this work, highlighting their aims, techniques, datasets, results, and limitations.
Summary of previous studies and their key findings.

AI: artificial intelligence; BERT: bidirectional encoder representations from transformers; DL: deep learning; GRU: gated recurrent unit; LSTM: long short-term memory; ML: traditional machine learning.
The following subsections elaborate on hybrid, lexicon-based, and machine-learning models, building on the insights from Table 1.
Hybrid models
The proposed hybrid model integrates lexicon-based techniques like TextBlob with DL models such as LSTM–GRU, achieving high accuracy (97%) and an F1-score of 0.96. 11 ML algorithms such as SVC and the Extra Trees Classifier (ETC) also performed well with Term Frequency–Inverse Document Frequency (TF-IDF) and Bag-of-Words (BoW) features, reaching accuracies up to 0.92. While TextBlob-based annotations can assist with weak supervision and label refinement, they do not replace human annotators. Study 17 similarly aims to improve emotion classification by reducing label inconsistencies through hybrid pipelines that combine VADER/TextBlob with CNN, GRU, CNN–LSTM, and LSTM. Results show strong performance (accuracy ≈0.97, F1 ≈0.96 for LSTM–GRU), but limitations include reliance on automated interpretation without human adjudication and potential bias. In, 2 the transformative role of AI in addressing healthcare challenges (limited access, rising costs, and personalized care) is discussed, emphasizing cross-disciplinary collaboration and patient-oriented, data-driven solutions. Overall, hybrid approaches, combining lexicon cues with ML/DL architectures, leverage complementary strengths for improved performance.
Lexicon-based models
In the education domain, a Twitter dataset of 17,155 tweets was analyzed using lexicon-based techniques (TextBlob, SentiWordNet, and VADER) to address sentiment subjectivity and polarity. ML classifiers (e.g. Random Forest and SVM) achieved up to 0.95 accuracy with BoW features, and DL models (CNN–LSTM, CNN, BiLSTM, and LSTM) were also evaluated. 6 T Topic modeling highlighted challenges such as uncertainty around campus reopening, children's difficulty understanding online learning, and network limitations. Similarly, 7 examined sentiment analysis of 11,858 U.S. COVID-19 tweets (January–May 2020) using lexicon-based labeling (TextBlob) with TF-IDF/BoW features. Classifiers including RF, gradient boosting, SVM, LR, and ETC categorized emotions (neutral/positive/negative), with gradient boosting + TF-IDF achieving the best accuracy (96%). Future directions include scaling to larger datasets and enabling near-real-time analytics.
Machine learning models
Using LDA topic modeling, 15 identified frequently discussed themes, while sentiment classification employed a BERT model with three dense layers on hashtag-tagged tweets about ChatGPT, achieving 96.49% accuracy. A key limitation is the single-platform dataset, motivating cross-platform analyses to improve generalizability. In reference [18], a two-stage BERT-based pipeline extracted service attributes from text reviews to help patients choose appropriate doctors for online consultations. It combined public and personal preferences via a 2-increment fuzzy metric to generate comprehensive physician ratings; a case study (dxy.com) demonstrated improved rationality over traditional MADM. As a transformer language model, BERT continues to enhance NLP performance across tasks. Table 2 summarizes the main research gaps and future directions identified in prior work.
Identification of research gaps and proposed future directions.

AI: artificial intelligence; DL: deep learning; ML: traditional machine learning; SA: sentiment analysis.
Beyond domain-general sentiment analysis, several works target clinician–patient conversations directly. For instance, Chatzimina et al. 19 applied topic modeling and sentiment analysis to Greek clinician–patient conversations in hematologic malignancies, finding more negative patient sentiments around pain, uncertainty, and loss, while clinicians remained more neutral. Sen et al. 20 developed an affective text analysis method to model doctor–patient communication in late-stage cancer consultations, linking linguistic/speech features to improved patient-reported outcomes. Le-Duc et al. 21 proposed a multimodal framework for sentiment reasoning in real-world doctor–patient conversations across various medical topics, incorporating annotations for sentiments and rationales to enhance AI transparency and trust. Rui et al. 22 analyzed online patient-provider communication transcripts to predict patient satisfaction, integrating sentiment metrics with provider strategies. Wang et al. 23 introduced CommSense, a wearable sensing framework for evaluating patient–clinician interactions, including sentiment-related assessments to promote health equity. Greaves et al. 24 utilized sentiment analysis to capture patient experiences from free-text online comments, categorizing them as positive or negative to inform healthcare improvements. Gohil et al. 25 applied sentiment analysis techniques to patient feedback narratives, identifying key emotional drivers in clinical interactions. Alemi et al. 26 explored sentiment in patient–doctor dialogs through natural language processing, focusing on emotional variance in mental health contexts. Khanbhai et al. 27 performed a comparative sentiment analysis on clinical conversation records, highlighting domain-specific challenges like class imbalance in emotional data. At the corpus scale, new resources such as PDCH (a multimodal depression consultation dataset with emotion annotations and clinician ratings) 28 and EHDChat (a knowledge-grounded, empathy-enhanced medical dialogue dataset) 29 further enable emotion and empathy-aware modeling in medical conversations. Additionally, the Distress Analysis Interview Corpus—Wizard-of-Oz (DAIC-WOZ) and its extended version E-DAIC are clinical interview corpora in which participants are interviewed by a virtual agent; ongoing work on these resources advances affect and depression detection, underscoring the broader applicability of sentiment/emotion signals in clinician–patient dialogue.30,31 Collectively, these studies underscore the value of tailored sentiment analysis in healthcare dialogs; most emphasize binary or emotion-specific labels, leaving room for multiclass severity modeling as pursued here.
Methodology
This study is a retrospective computational analysis conducted from June 2024 to April 2025 at Anhui Medical University (Hefei, China) and Shenzhen Technology University (Shenzhen, China). It was based entirely on secondary, anonymized data from doctor–patient consultations without any direct patient recruitment or clinical intervention. All analyses used a publicly available dataset and were performed per relevant research ethics and data-governance standards. Building on this foundation, the study applies an AI-driven SA framework to model and interpret doctor–patient interactions using natural language processing (NLP).
We employed ML and DL methods to classify interaction severity into three classes (low, medium, and high). LSTM networks address the vanishing-gradient problem that can hinder vanilla RNNs from learning long-term dependencies. 32 BiLSTM processes sequences in both forward and backward directions and often outperforms unidirectional LSTM. 33 CNNs specialize in recognizing local patterns of sequential data, like n-grams in the text. 34 Hybrid CNN–LSTM outperforms traditional ML and DL models regarding accuracy, precision, recall, and f-measure. 35 Ensemble learning combines multiple models and can improve predictive accuracy, generalizability, and robustness. 36 Figure 2 illustrates the overall framework of the proposed study.

Structure of the proposed AI-driven framework for sentiment analysis in doctor–patient interactions.
Data collection
The dataset used in this study was obtained from a publicly available Hugging Face repository (https://huggingface.co/datasets/mahfoos/Patient-Doctor-Conversation/viewer/default/train?p=4). It consists of 3325 anonymized doctor–patient consultation records. Each record includes key fields description, doctor, patient, and status (low/medium/high severity), which we concatenated into a single input text for modeling. Figure 3 illustrates the dataset structure and field organization.
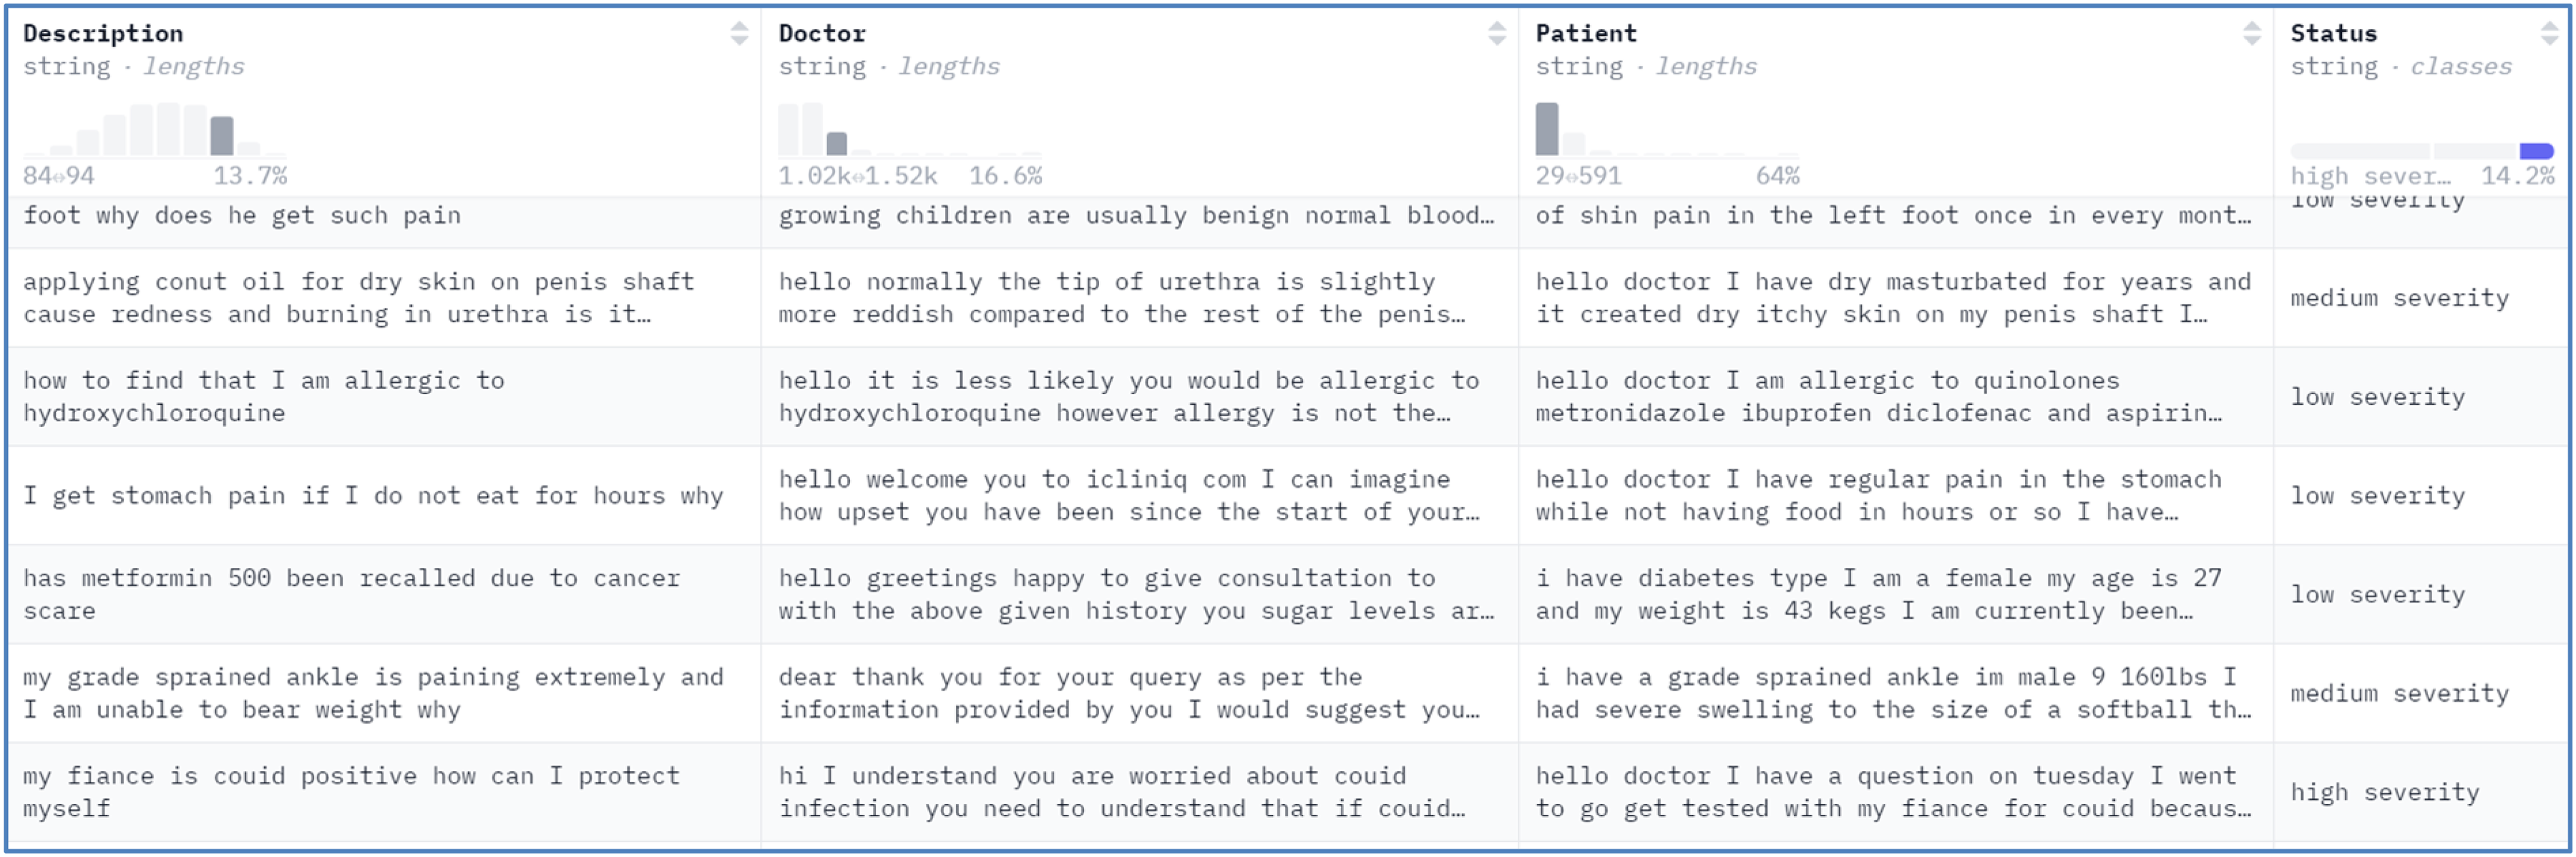
Details of the dataset used in the study.
The dataset supports multiclass sentiment classification with three severity levels: low (class 0), medium (class 1), and high (class 2). Before balancing, the classes were imbalanced (class 0 = 1780; class 1 = 1072; class 2 = 473), motivating the class-balancing procedures described in the Dataset balancing section. Under the cross-validation protocol, oversampling was applied only within the training split of each fold to prevent information leakage; the validation and test splits retained their natural label distributions.
For model development and evaluation, we used stratified five-fold cross-validation to preserve label proportions; the whole protocol is provided in the Train-validation-test split, and stratified cross-validation section.
Dataset preprocessing
The dataset was carefully preprocessed to ensure it was suitable for training the models. First, we merged relevant columns (description, doctor, and patient) into a single input field to capture the context of doctor–patient interaction. This concatenation provides a comprehensive representation of an interaction,
Text cleaning
All text was lowercased and punctuation removed. Extraneous symbols and extra whitespace were eliminated; numerals were retained to preserve clinical context. Stop words were retained, as they can contribute to semantic meaning in conversational healthcare data.
Label encoding
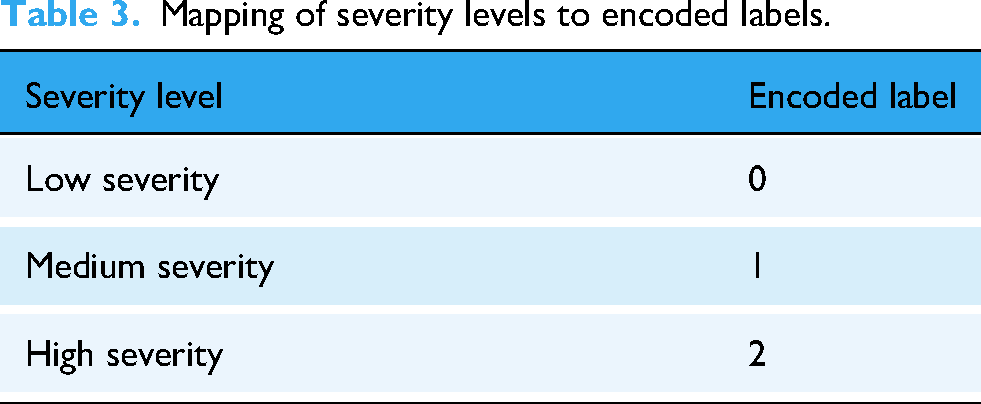
Labels in the status column representing interaction severity levels were normalized (lowercased; punctuation removed) and then integer-encoded,
Mapping of severity levels to encoded labels.
Handling missing values
We addressed missing data by replacing any missing or null entries with blank strings, ensuring completeness and avoiding tokenization errors.
38
Text tokenization
Tokenization was applied to transform the merged text into integer sequences, converting each word to its corresponding index in the vocabulary. To prevent information leakage, we fitted the Keras Tokenizer on the training portion within each cross-validation fold only, with a vocabulary size of 5000 and an out-of-vocabulary token (<OOV>>).
39
Formally,
Padding sequences
To ensure that all sequences input to the model has the same length,
40
we padded or truncated sequences to a maximum of 100 tokens. Mathematically,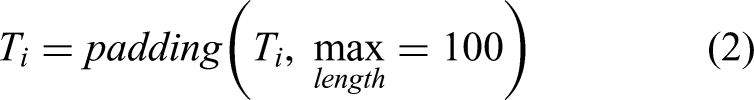
Train-validation-test split, and stratified cross-validation
We evaluated models using stratified five-fold cross-validation (scikit-learn's
Through these steps, the dataset was prepared for sentiment classification. The combination of cleaning, missing-value handling, tokenization, padding, and stratified cross-validation ensured effective and unbiased model training.
Dataset balancing
Considering class imbalance within the training portion of each cross-validation fold, we applied random oversampling to the minority classes (classes 1 and 2) to reduce bias.
41
Imbalanced class distributions can lead to systematic performance shifts toward the majority class.
42
Accordingly, oversampling was performed only within the training split of each fold; the corresponding validation and test splits remained unchanged. For per-fold balancing, minority-class counts were increased to match the per-fold majority count: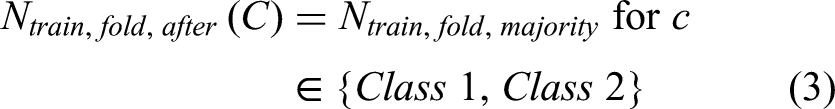
We used scikit-learn's 
Per-fold training class distribution before and after balancing (stratified 5-fold CV).

Overall, the dataset counts are N = 3,325, with class 0 = 1,780, class 1 = 1,072, and class 2 = 473 (Data collection section). Minor fold-to-fold deviations may occur due to stratification on finite counts.
Methods
This research compares multiple model architectures, combining traditional ML and DL techniques, to classify doctor–patient interactions by severity. LSTM, BiLSTM, CNN, a hybrid CNN–LSTM, an ensemble classifier, and BERT were applied. Each model's architecture was designed to handle sequence-based input.
LSTM
LSTM is a DL-based technique designed for modeling languages, speech analysis, text data prediction, and sentiment analysis.
45
This model was built using the
Embedding layer: Input sequences have been converted to a fixed-dimensional dense vector representation (see equation (5))
where, X shows the tokenized of input sequence and,
Stacked LSTM layers: The stacked LSTM model is an extension of LSTM with many hidden LSTM layers; every layer consists of numerous memory cells.
46
Two LSTM layers were stacked to capture long-term dependencies (equation (6)):
Dropout regularization: After every layer of LSTM, dropout is used to decrease overfitting
47
(see equation (7))
Dense output layer: A dense layer maps hidden states to class probabilities via softmax
48
(equation (8)):
where 
where 
BiLSTM (bidirectional LSTM)
The BiLSTM layer improves the model's ability to understand sequential dependencies through processing the sequence input forward and backward, leveraging prior and subsequent context.
49
In the embedding layer, each word is mapped 
where
CNN
CNNs specialize in recognizing local patterns of sequential data (n-grams) in text, making them suitable for this task.
34
Integer-encoded tokens were embedded into dense vectors 
where,
Hybrid CNN-LSTM
For multiclass classification, we combine CNN and LSTM models. CNN layers perform local feature extraction, 50 while LSTM layers model long-term temporal dependencies within the data. 51 In the embedding layer, integer-encoded tokens are mapped to dense vectors in a shared vector space. A 1D convolutional layer extracts local n-gram features, and a MaxPooling1D layer downsamples the convolutional outputs by retaining the maximum within each pool. The LSTM layer then captures long-term sequential structure. Dropout reduces overfitting by randomly dropping units during training. Finally, a dense Softmax layer outputs three-class probabilities (low/medium/high).
Ensemble model
ML ensembles are an effective way to enhance predictive performance.
36
By aggregating diverse base classifiers, they reduce individual-model weaknesses and yield more stable predictions. We used a hard-voting classifier that combines Logistic Regression (LR), Random Forest (RF), and SVC. In hard voting, each base learner outputs a class label 
The LR classifier uses a logistic function to express the relationship among the X input features and the y target variable.
BERT
Bidirectional Encoder Representation from Transformers (BERT) is an ML transformer-based model developed for a variety of NLP tasks, containing sequence classification.
52
The model is pretrained for the goal of masked language modeling and fine-tuned for particular downstream tasks. We also implemented BERT to classify text data. Text data is converted into numeric form through tokenization suited input for BERT model. Let the input sequence of text is
Models’ architecture
Table 5 shows the architecture of each model, detailing the components and hyperparameters used for LSTM, BiLSTM, CNN, CNN-LSTM hybrid, Ensemble, and BERT models. Table 5 highlights the specific configurations and settings applied to each model to achieve optimal performance in sentiment analysis tasks. The hyperparameters reported in Table 5 were determined through empirical tuning rather than systematic grid or random search. Initial ranges for parameters such as learning rate, batch size, and dropout probability were selected based on values commonly reported in related literature, and multiple pilot experiments were conducted to refine them. The final choices were made by monitoring validation accuracy and F1-scores while balancing computational efficiency. For the ensemble classifier, standard scikit-learn implementations of LR, RF, and SVC were used with default settings, as the primary focus was on evaluating the combined voting strategy rather than fine-tuning each base learner.
Architecture, components, and hyperparameters of each model used in the study.

LSTM: long short-term memory; RF: Random Forest; SVC: Support Vector Classifier.
Evaluation metrics
To comprehensively evaluate the performance of sentiment classification models in doctor–patient interactions, multiple metrics were employed. Overall accuracy was used to measure the proportion of correctly classified consultations across all severity levels:


Results
All metrics are reported on the outer test folds of the stratified five-fold cross-validation; values are reported as mean ± standard deviation across folds. For the LSTM model, the cross-validated accuracy was 58.66 ± 0.19 (indicating that, on average, the model correctly classified ∼58.7% of test samples across folds). Table 6 shows the class-wise precision, recall, and F1.
Classification report for the LSTM model (%, mean ± SD across 5 folds), including precision, recall, and F1-score for each severity class.

LSTM: long short-term memory.
For the LSTM model, precision for each category measures the accuracy of positive predictions. Class 0 has the lowest precision at 49.0 ± 1.1, which indicates a higher false-positive rate. In contrast, class 1 has the highest precision at 66.0 ± 0.8, reflecting a good positive prediction for this class. Recall quantifies the model's ability to identify true positives. Class 2 achieved the highest recall at 87.0 ± 2.1, demonstrating that the model successfully identifies most samples from this class. However, class 0 has the lowest recall at 40.0 ± 1.3, indicating a high false-negative rate. The F1-score balances precision and recall. Class 2 achieved the highest F1-score of 70.0 ± 1.8, indicating strong overall performance, while class 0 has the lowest F1-score at 44.0 ± 1.2, signaling the need for improvement in this class.
For the BiLSTM model, the cross-validated accuracy was 64.82 ± 0.70. Compared with LSTM (Table 6), BiLSTM shows higher mean accuracy and stronger detection of high-severity cases (class 2), while class 0 remains comparatively more challenging. The class-wise report (%, mean ± SD across 5 folds) is shown in Table 7.
Classification report for the BiLSTM model (%, mean ± SD across 5 folds), including precision, recall, and F1-score for each severity class.
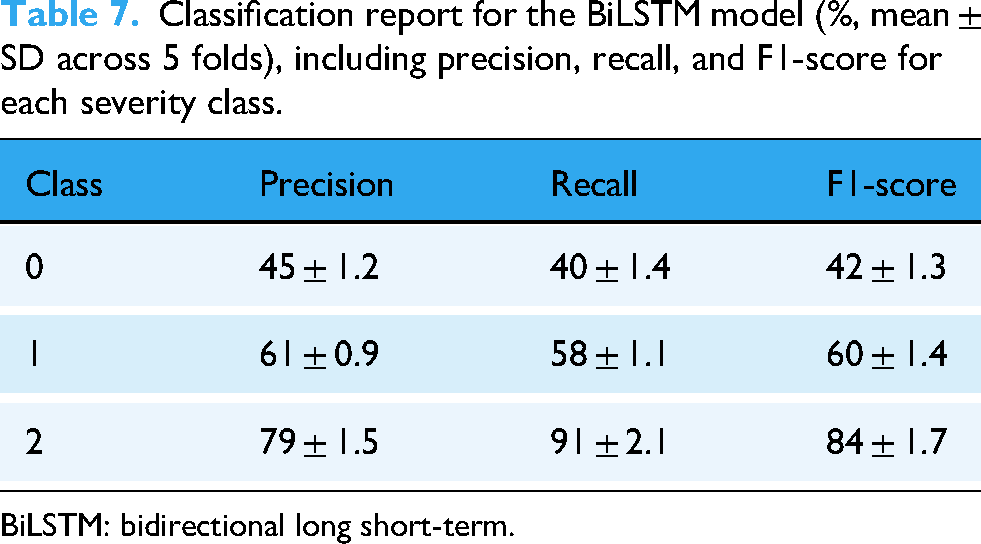
BiLSTM: bidirectional long short-term.
Class 0 has the lowest precision (45 ± 1.2) and recall (40 ± 1.4), indicating higher false-positive and false-negative rates, respectively. In contrast, class 2 attains the highest precision (79 ± 1.5) and recall (91 ± 2.1), yielding the strongest F1-score (84 ± 1.7). Class 1 shows balanced precision and recall (≈61%/58%), resulting in a mid-range F1-score (60 ± 1.4).
For the CNN model, the cross-validated accuracy was 64.17 ± 0.8. Relative to BiLSTM (Table 7), CNN attains comparable mean accuracy but exhibits lower sensitivity to class 0 and similarly strong performance on class 2. The class-wise report (%, mean ± SD across 5 folds) is shown in Table 8.
Classification report for the CNN model (%, mean ± SD across 5 folds), including precision, recall, and F1-score for each severity class.

CNN: convolutional neural networks.
Class 0 has the lowest precision (49.2 ± 1.5) and the lowest recall (33.7 ± 1.2), reflecting higher false-positive and false-negative rates, respectively. In contrast, class 2 shows the highest precision (73.2 ± 1.4) and recall (90.4 ± 1.8), yielding the strongest F1-score (81.2 ± 1.5). Class 1 exhibits balanced precision/recall (≈61.4%/61.8%), producing an F1-score of 61.1 ± 0.9.
For the CNN–LSTM (hybrid) model, the cross-validated accuracy was 65.68 ± 0.90. Relative to CNN (Table 8), CNN–LSTM yields a modest gain in mean accuracy and macro-F1, with similarly strong detection of class 2 and persistent difficulty on class 0. The class-wise report (%, mean ± SD across 5 folds) is shown in Table 9.
Classification report for the CNN–LSTM model (%, mean ± SD across 5 folds), including precision, recall, and F1-score for each severity class.

CNN: convolutional neural networks; LSTM: long short-term memory.
For the hybrid CNN–LSTM model, class 0 shows the lowest mean precision (47.6 ± 1.1) and recall (37.2 ± 1.3), indicating higher false-positive and false-negative rates, respectively. Class 2 maintains the highest precision (77.7 ± 1.4) and recall (90.4 ± 1.8), yielding the strongest F1-score (83.2 ± 1.5). Class 1 exhibits balanced precision and recall (≈63.2%/62.6%), resulting in a mid-range F1 (63.8 ± 0.9).
For the ensemble model, the cross-validated accuracy was 75.5 ± 0.5 across the outer test folds. Relative to CNN–LSTM (Table 9), the ensemble achieves the highest mean accuracy and macro-F1 across folds, with consistently strong detection of class 2 and improved performance on class 0. The class-wise report (%, mean ± SD across 5 folds) is shown in Table 10.
Classification report for the ensemble model (%, mean ± SD across 5 folds), including precision, recall, and F1-score for each severity class.

For the ensemble model, class 0 shows the lowest mean precision (62.4 ± 0.8) and recall (58.7 ± 1.0), indicating higher false-positive and false-negative rates than the other classes. Class 2 attains the highest precision (89.7 ± 1.2) and recall (92.6 ± 1.5), yielding the strongest F1-score (90.8 ± 1.3). Class 1 remains balanced (∼71–72%), producing a stable F1 (72.6 ± 0.7).
For the BERT model, the cross-validated accuracy was 66.98 ± 0.6. Relative to the ensemble (Table 10), BERT yields lower mean accuracy but competitive performance on class 2; compared with recurrent baselines (Tables 6 and 7), it shows markedly higher precision on class 0. The class-wise report (%, mean ± SD across 5 folds) is shown in Table 11.
Classification report for the BERT model (%, mean ± SD across 5 folds), including precision, recall, and F1-score for each severity class.

BERT: bidirectional encoder representations from transformers.
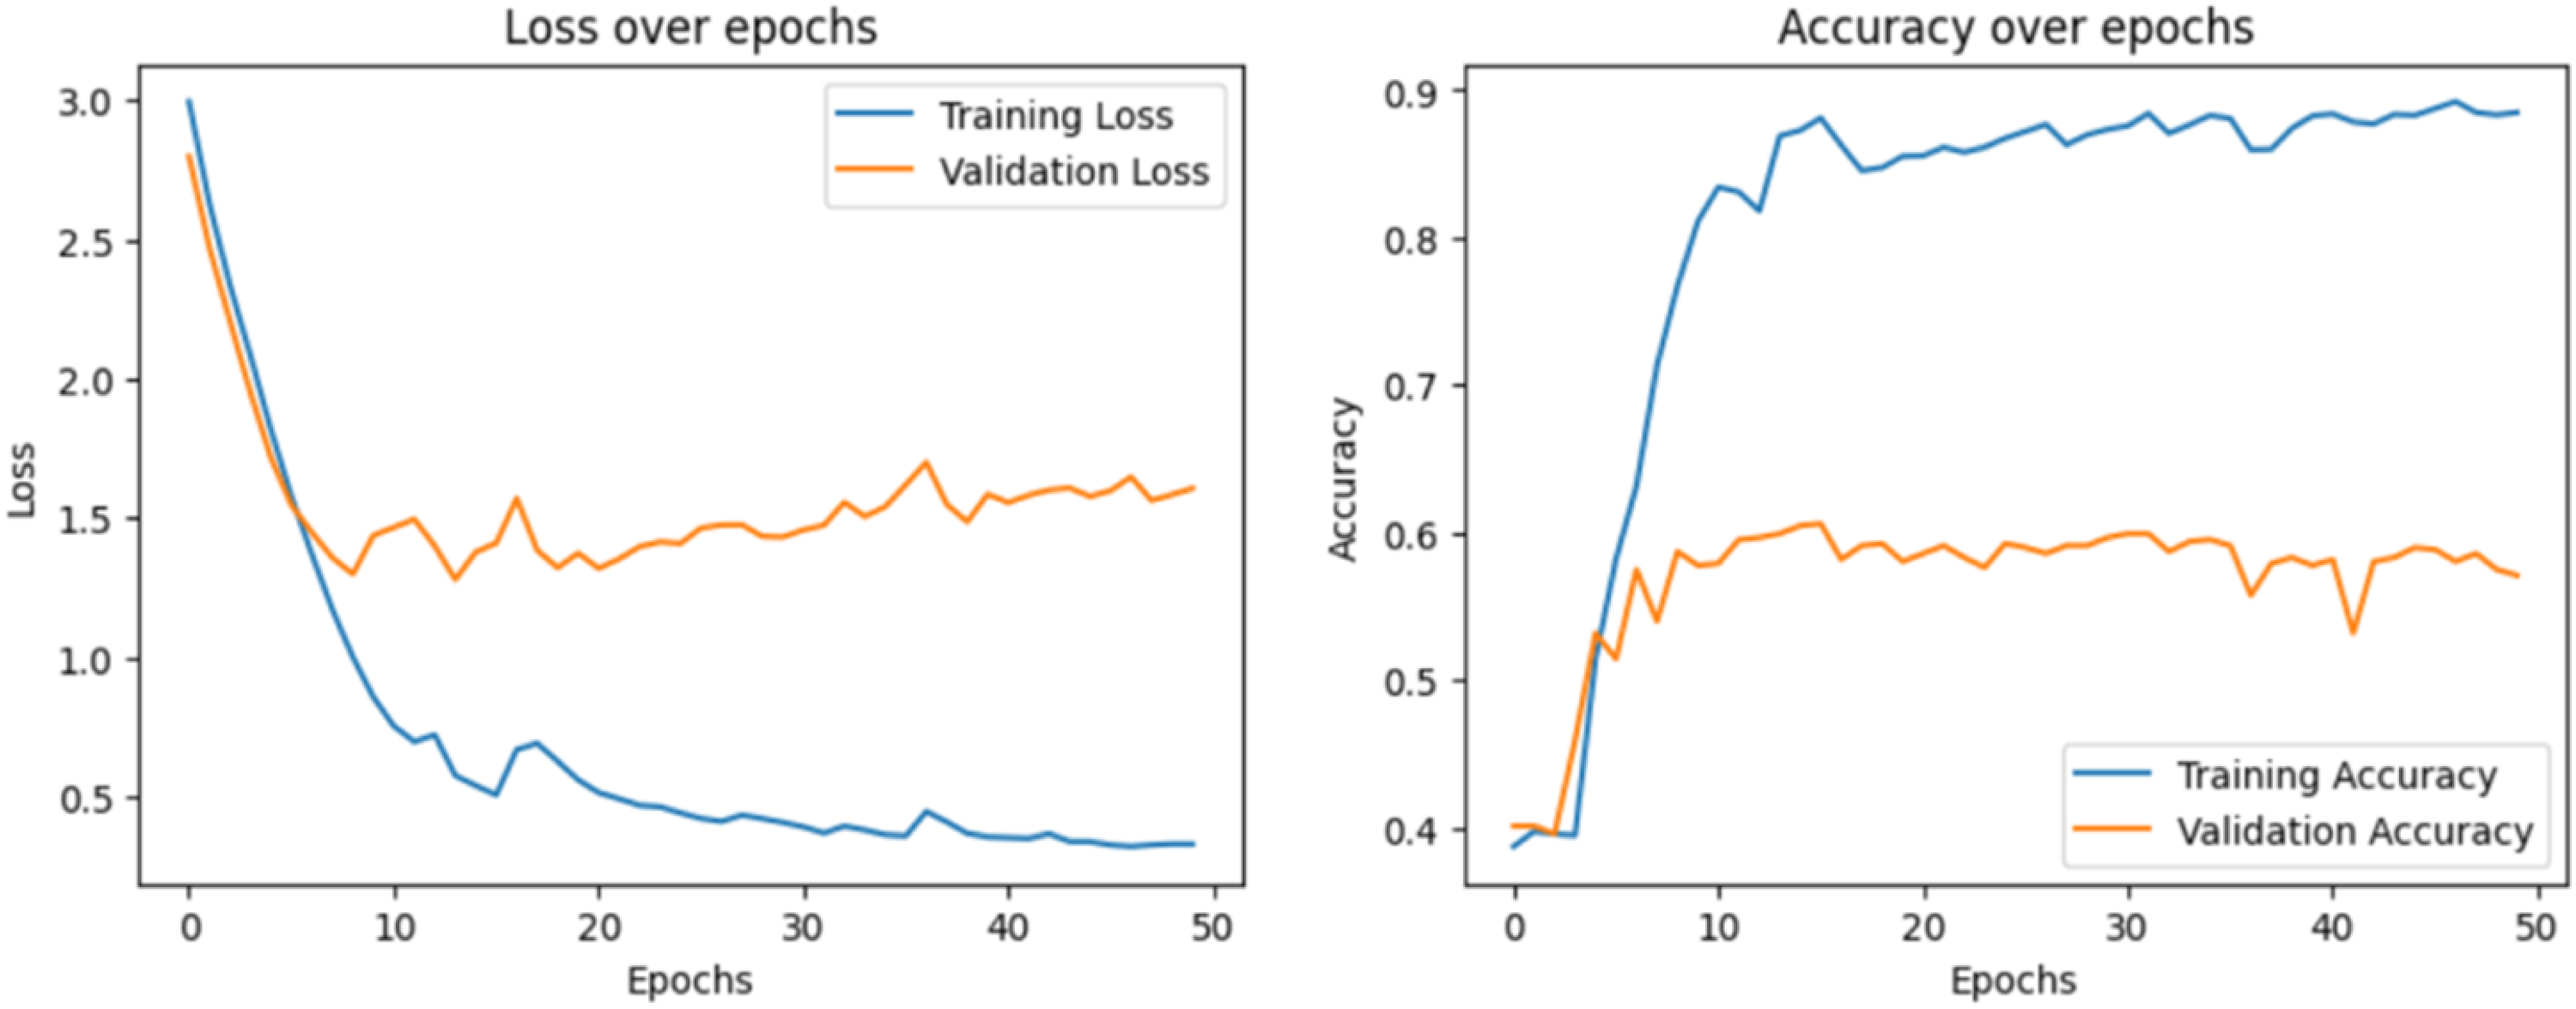
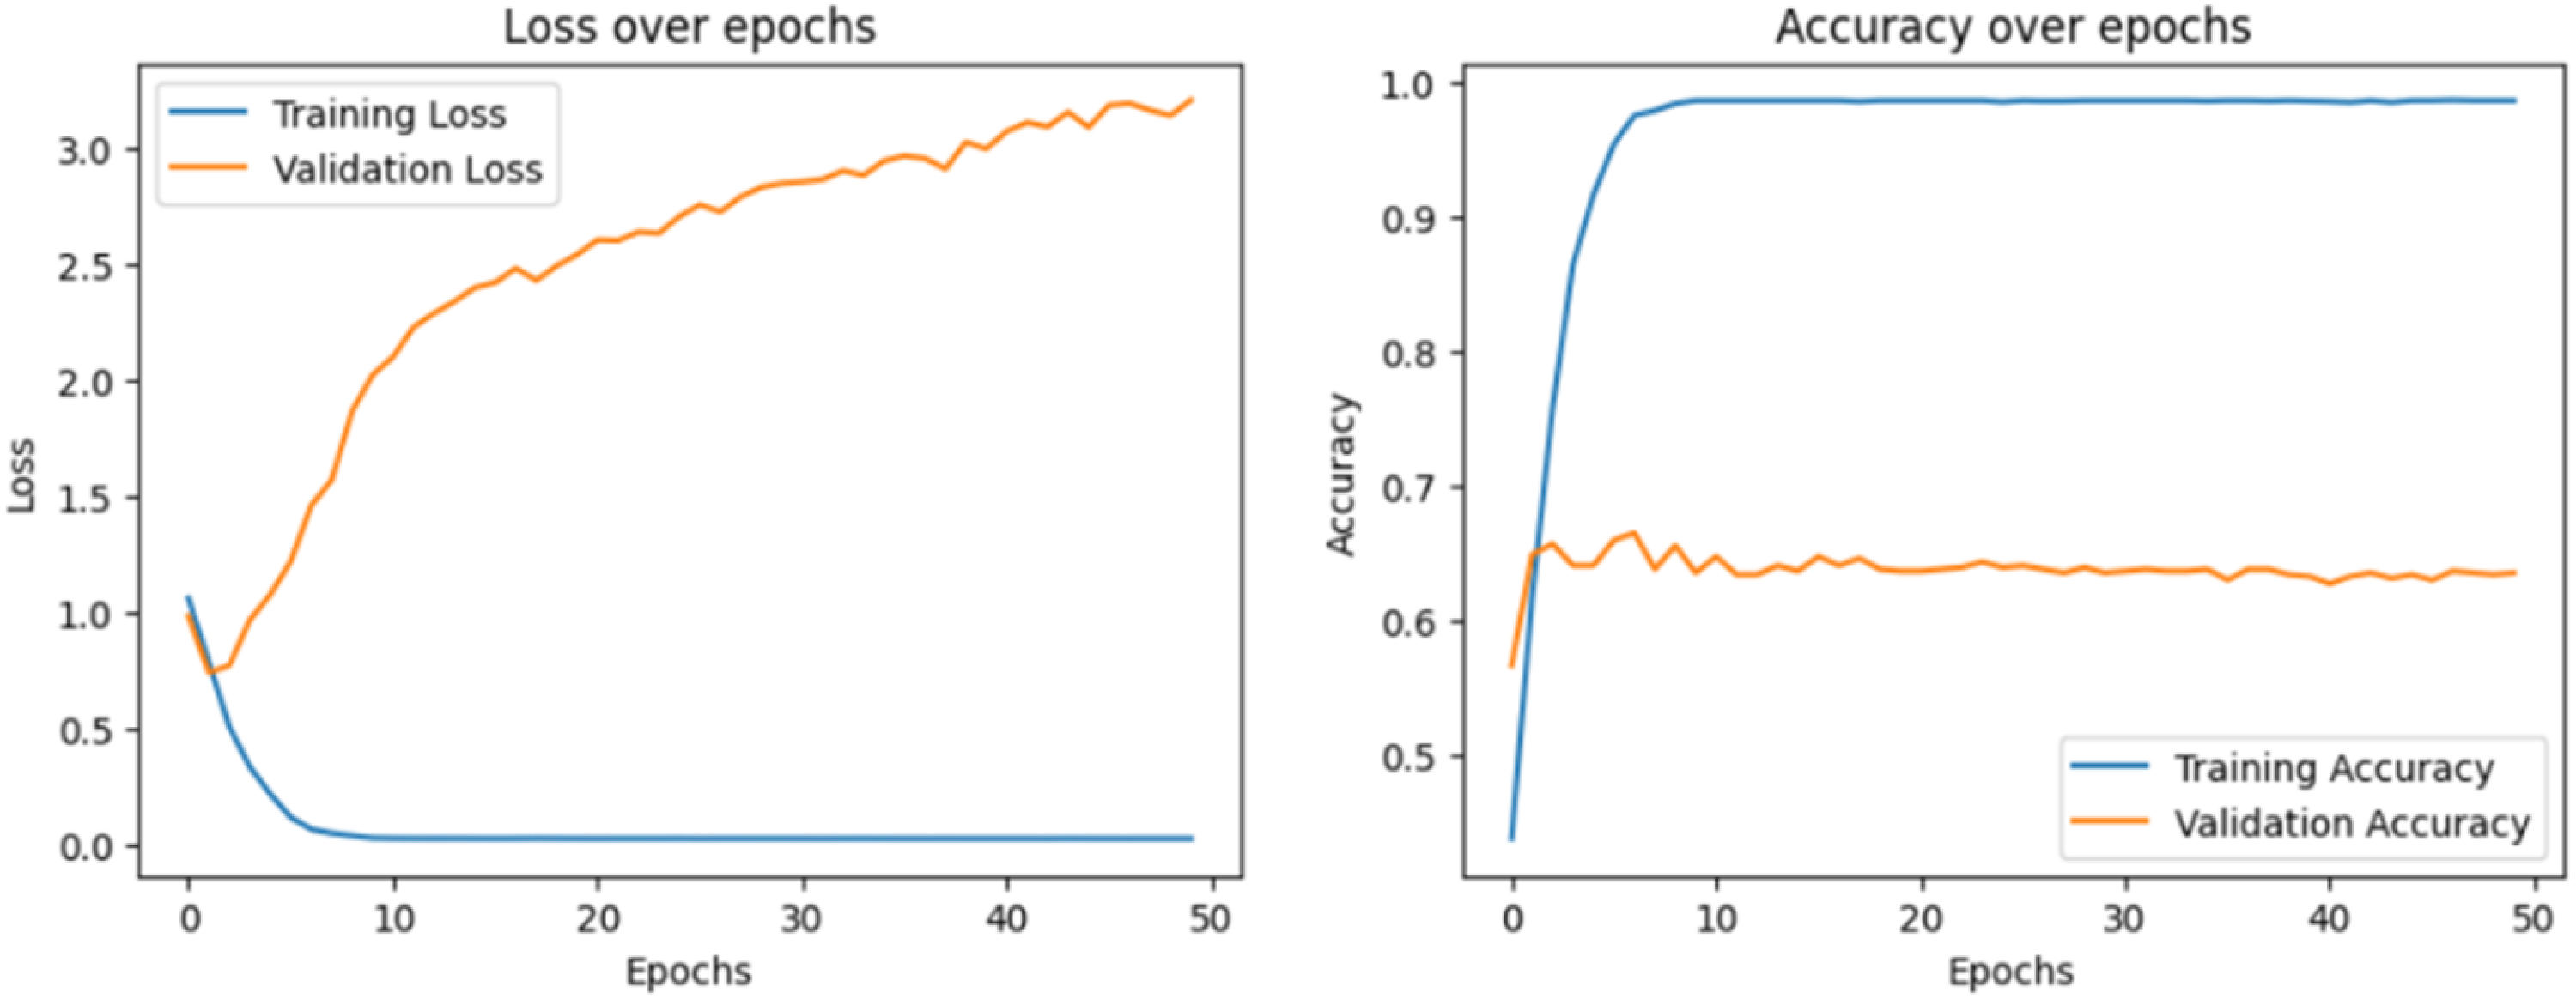
Class 0 shows the lowest mean recall (44.7 ± 1.2), indicating more false negatives, despite relatively strong precision (65.5 ± 1.0). Class 2 again attains the highest recall (90.1 ± 1.6) and F1 (80.3 ± 1.4). Class 1 remains balanced around 61% to 62% across metrics. Loss over epochs and accuracy over epochs have been visualized to display the learning process of each model, which is shown in Figure 4 to 8, respectively.
Loss over epochs and accuracy over epochs of the long short-term memory (LSTM) model.

Loss over epochs and accuracy over epochs of the bidirectional long short-term memory (BiLSTM) model.

Loss over epochs and accuracy over epochs of the convolutional neural networks (CNN) model.
Loss over epochs and accuracy over epochs of the hybrid convolutional neural networks long short-term memory (CNN–LSTM) model.
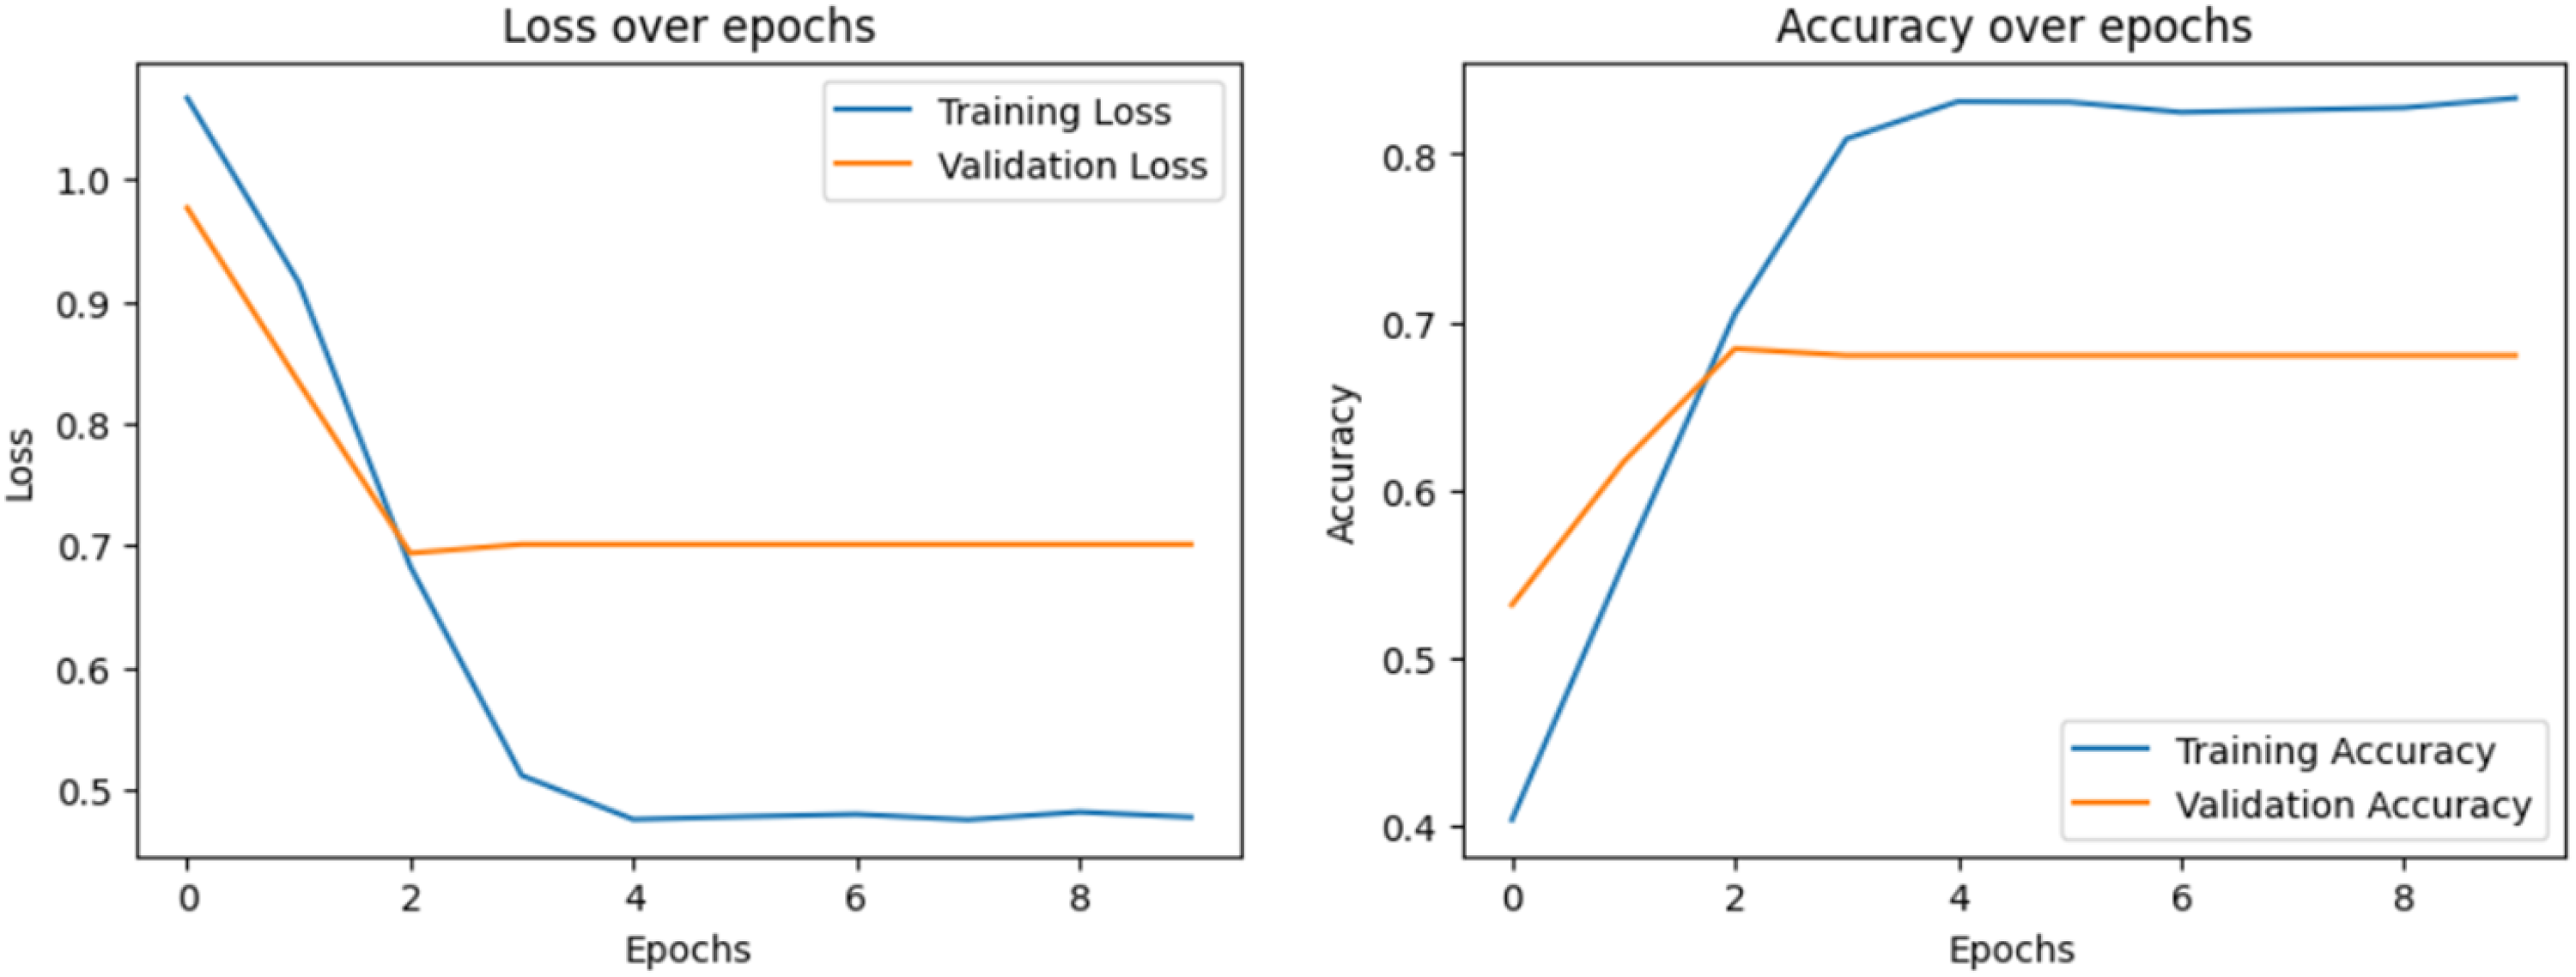
Loss over epochs and accuracy over epochs of the bidirectional encoder representations from transformers (BERT) model.
The loss plot describes how the model's prediction error decreases during training and validation. The accuracy plot explains how well our model predicts results during training and validation. A confusion matrix is also visualized to analyze the model's ability to classify samples correctly. Figures 9 and 10 show the confusion matrix of each model.

Confusion matrix reports of the evaluated models: (a) LSTM model, (b) BiLSTM model, (c) CNN model, and (d) hybrid CNN-LSTM model. BiLSTM: bidirectional long short-term; CNN: convolutional neural networks.

Confusion matrix reports of the advanced models: (a) ensemble model and (b) bidirectional encoder representations from transformers (BERT) model.
This heat map highlights the counts of TP (true positives), FP (false positives), FN (false negatives), and TN (true negatives) of each class.
ROC curve
An ROC curve shows how well a model performs across different threshold values.
Above, Figures 11(a)–(f) plots ROC curve for each category to display the exchange between sensitivity actual positive rate (TPR) and specificity false positive rate (FPR). The AUC value represents the ability of the models to differentiate between classes.

ROC curves of all models evaluated in this study: (a) LSTM model, (b) BiLSTM model, (c) CNN model, (d) hybrid CNN–LSTM model, (e) ensemble model, and (f) BERT model. BERT: bidirectional encoder representations from transformers; BiLSTM: bidirectional long short-term; CNN: convolutional neural networks; ROC: receiver operating characteristic.
Comparative analysis
This section presents a comparative analysis of the implemented models, explaining their selection and relative performance. LSTM and BiLSTM capture sequential dependencies in conversational text, CNN extracts local features, CNN–LSTM combines spatial and temporal cues, and BERT provides deep contextual representations. The ensemble integrates LR, RF, and SVC via hard voting to leverage complementary decision boundaries. All comparative results are reported under stratified five-fold cross-validation as mean ± SD across the outer test folds. A detailed per-class comparison appears in Table 12; model-specific tables (Tables 6–11) provide the same metrics per model.
Comparative evaluation across models (%, mean ± SD across 5 folds).

BERT: bidirectional encoder representations from transformers; BiLSTM: bidirectional long short-term; CNN: convolutional neural networks.
The ensemble achieves the strongest overall accuracy (75.5 ± 0.5), followed by BERT (66.98 ± 0.6), CNN–LSTM (65.68 ± 0.9), BiLSTM (64.82 ± 0.7), CNN (64.17 ± 0.8), and LSTM (58.66 ± 0.19). These margins exceed fold-to-fold variability (SDs ≲1%), indicating robust differences across folds. Class-wise patterns mirror this ranking: class 2 is generally easiest (high recall across models), whereas class 0 remains most challenging. BERT offers higher precision on class 0 (65.5 ± 1.0) than the ensemble (62.4 ± 0.8), but the ensemble substantially better class 0 recall (58.7 ± 1.0 vs. 44.7 ± 1.2) yields stronger class 0 F1 overall. Comparison results of different models in this study are shown in Figure 12.

Comparison of performance across different models, highlighting accuracy, precision, recall, and F1 scores.
Sentiment trends are explored by Mujahid et al. 6 in e-learning, and the traditional ML techniques, such as SVM and RF, performed with 95% accuracy. The strength of the transformer model was demonstrated by Wu et al. 18 and Mujahid et al. 15 ; the BERT-based framework outperformed traditional models and achieved 96.49% accuracy for sentiment classification. At the same time, Khan et al. 7 exploited lexicon-based and an ML technique for sentiment classification in the COVID-19 tweets, using TF-IDF and gradient boosting by achieving 96% accuracy. In comparison, our work raises an important point by showing that DL techniques achieved considerable accuracy scores, such as 58.7 ± 0.2 and 65.7 ± 0.9. Although our ensemble model positively improves performance with an accuracy of up to 75.5 ± 0.5%, it still lags behind advanced transformer models. Noticeably, in our research, the BERT approach obtained 67.0 ± 0.6 accuracy, demonstrating that larger datasets and more fine-tuning could improve its performance. Unlike existing studies that mainly focused on the binary classification and the simple dataset, our multiclassification approach, such as low, medium, and high, and a complex dataset introduces further complexity, thus troubling performance. Generally, our findings emphasize the need to leverage ensemble learning and transformer-based approaches to fill the execution gap and enhance classification in the complex datasets.
Interpretability analysis
Interpretability is crucial for clinical sentiment analysis systems, as healthcare practitioners must trust both the predictions and their underlying rationale. To enhance transparency, we investigated BERT's attention mechanisms to uncover contextual patterns and applied SHapley Additive exPlanations (SHAP) values to a TF-IDF + LR model to identify key textual features driving classification decisions.
Figure 13 presents the attention maps of 10 heads from the third layer of BERT for a representative doctor–patient dialogue. Each subplot corresponds to a different attention head, with tokens on both axes and brighter cells indicating stronger weights. The maps reveal diverse interpretive strategies: some heads focus narrowly along the diagonal, reflecting word-level consistency, while others attend to medically salient expressions such as “worried” and “pain.” Certain heads also differentiate between conversational roles (doctor vs. patient), indicating that the model captures dialogue structure and word meaning. These patterns confirm that BERT distributes attention across multiple complementary mechanisms rather than relying on a single pathway, which helps explain its robust performance in sentiment classification.

Multihead attention maps from the third layer of BERT for a doctor–patient dialogue. Each heatmap shows one head's attention distribution across tokens, with brighter values indicating stronger focus. BERT: bidirectional encoder representations from transformers.
To complement this deep-model perspective, Figure 14 shows SHAP values for a TF-IDF + LR classifier, highlighting the n-grams most influential in predicting high emotional severity (class 2). Terms such as “blood,” “cancer,” “brain,” “chest,” and “scan” exert substantial positive contributions, while phrases like “feel fine” reduce the probability of a high-severity classification. Although our emphasis is on class 2, for completeness, it is worth noting that SHAP can also clarify the drivers of lower-severity categories: reassuring expressions typically contribute toward class 0 (low severity), while ambiguous or mildly negative terms influence class 1 (medium severity). This reinforces that different lexical cues consistently align with each severity level, providing a transparent link between model predictions and the underlying language. Together, these interpretability techniques provide complementary insights. Attention maps show how deep contextual dependencies are captured in BERT, whereas SHAP visualizations expose which explicit n-grams are most responsible for classification outcomes in a transparent linear model. By grounding predictions in medically meaningful tokens and dialogue structure, both methods support clinician trust and strengthen the case for using sentiment analysis in sensitive healthcare contexts.
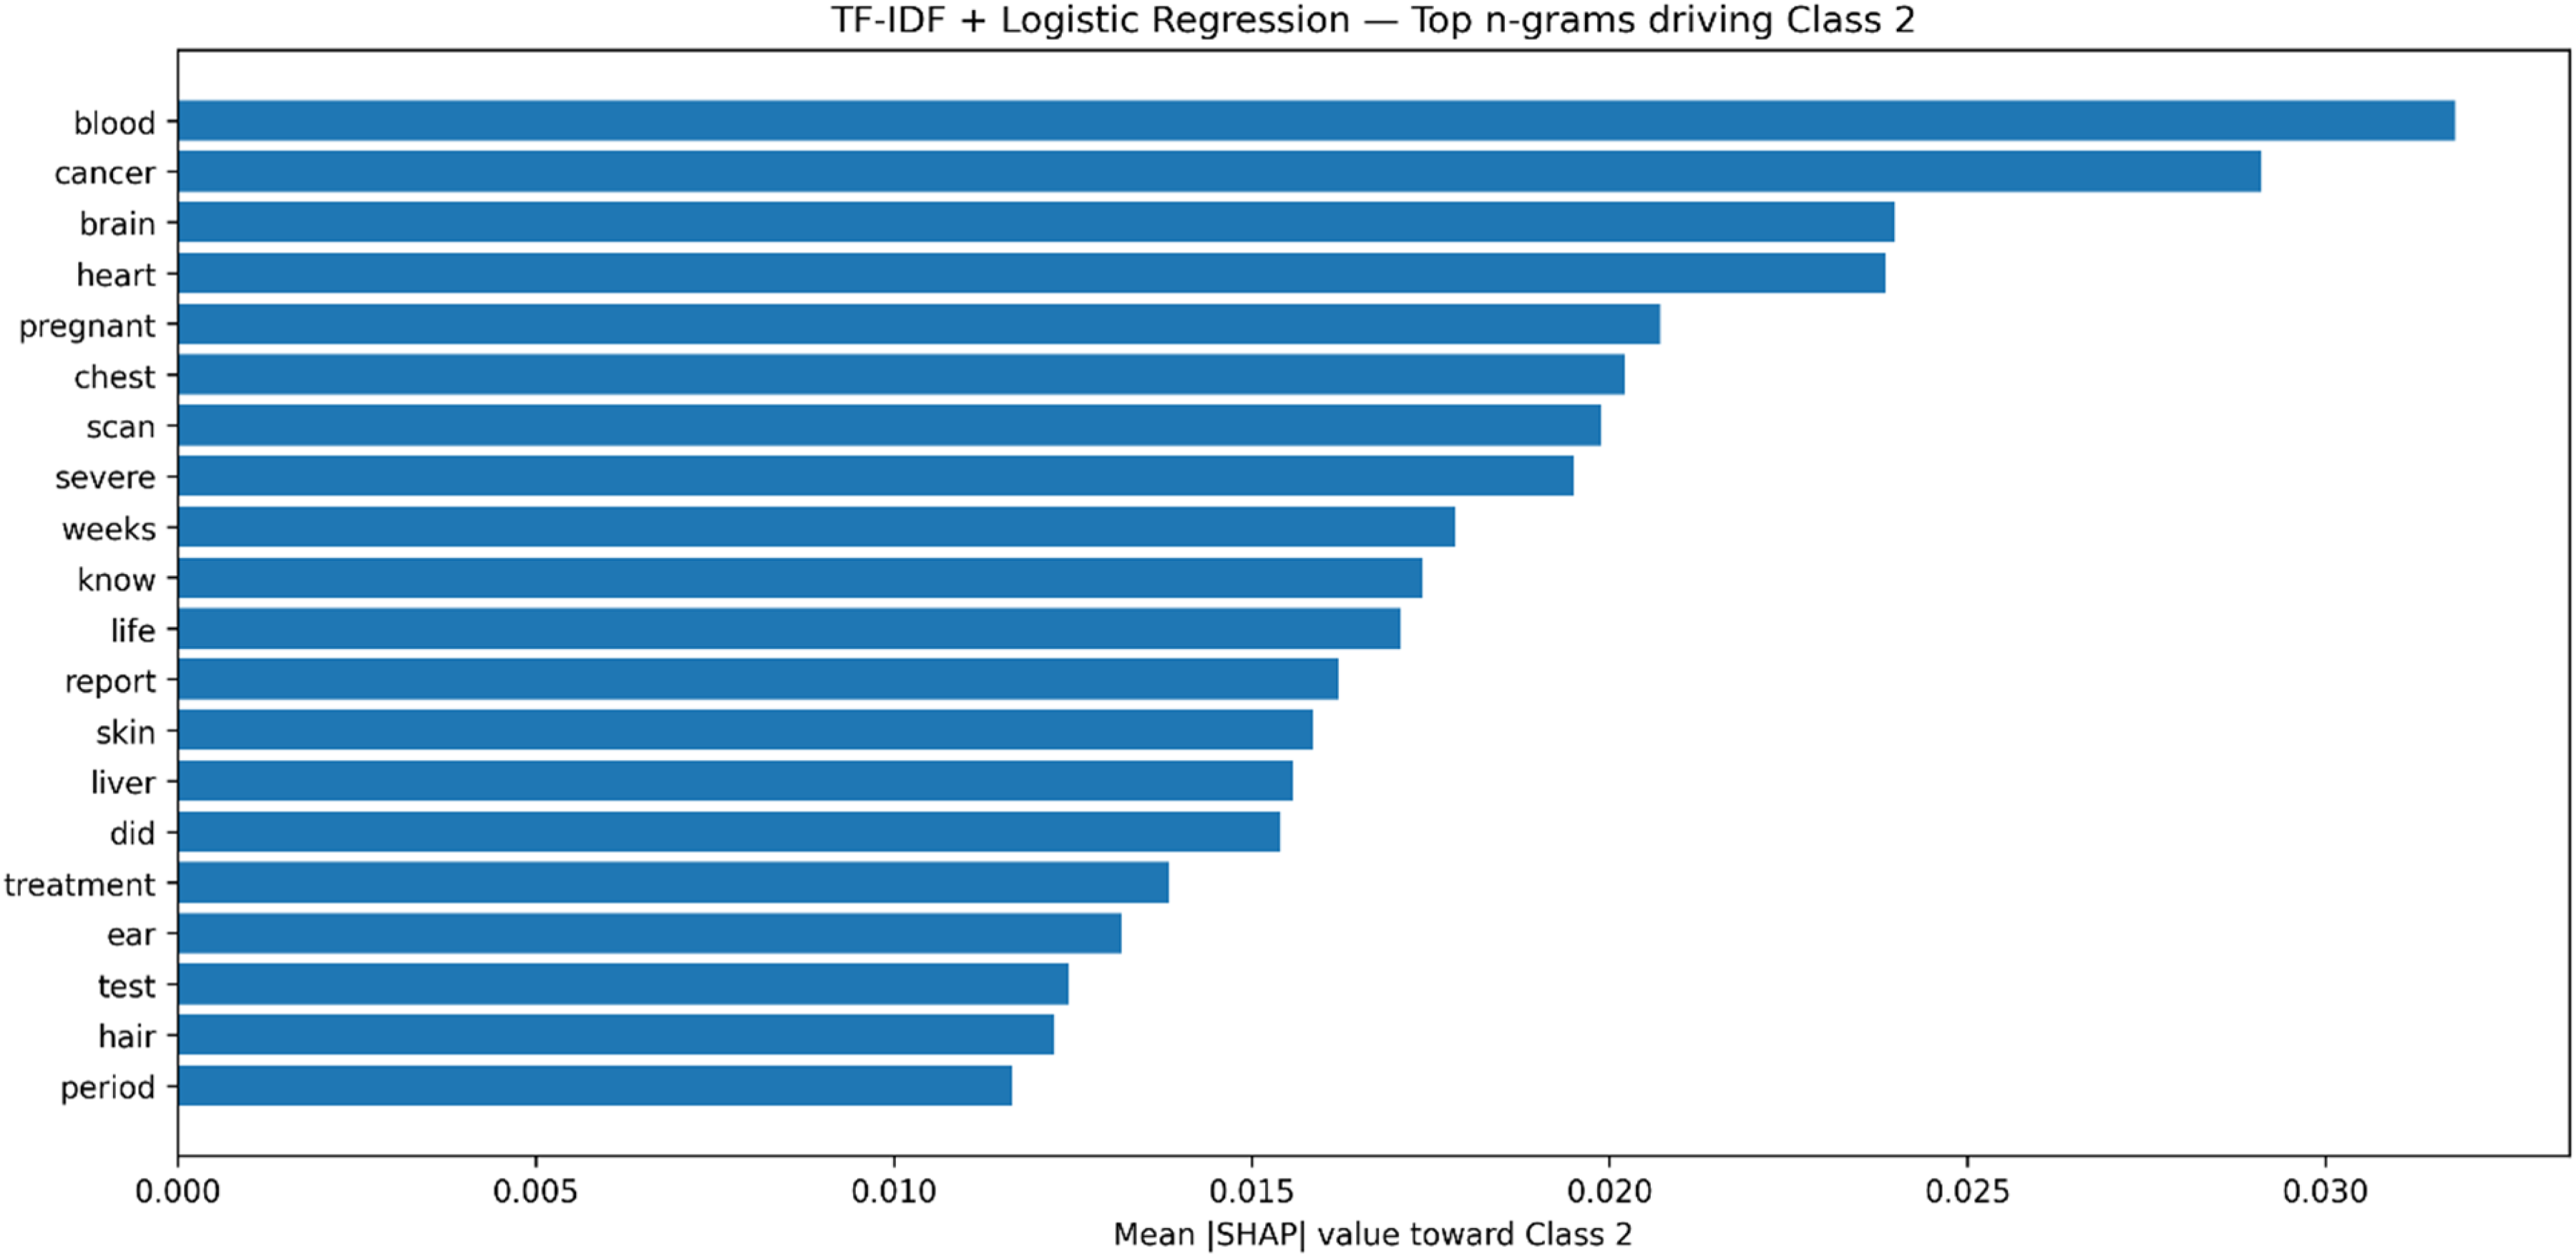
SHAP values for the TF-IDF + LR model, showing the top n-grams driving the classification of high severity (class 2). Higher values indicate stronger contributions toward predicting high severity.
Discussion
This study demonstrates the potential of AI-driven SA to improve understanding of doctor–patient interactions, highlighting the complementary strengths of different modeling strategies. Unless otherwise stated, performance figures below are reported as mean ± SD across the outer test folds of the stratified five-fold cross-validation. Among the tested models, the ensemble classifier achieved the highest overall accuracy (75.5 ± 0.5) and delivered particularly strong results for the medium sentiment class, with an F1-score of 72.6 ± 0.7. This superior performance can be attributed to the ensemble's ability to combine diverse decision boundaries: LR captured linear separations, RF modeled nonlinear patterns, and SVC handled complex margins, which collectively balanced precision and recall across sentiment categories. In contrast, individual deep learning models showed uneven performance: BiLSTM and CNN–LSTM captured long-range dependencies and local textual features effectively, excelling in high-severity interactions (mean F1 ≈ 84.0 ± 1.7 and 83.2 ± 1.5, respectively), while BERT achieved strong contextual understanding but was comparatively weaker on class 0 recall. Notably, BERT attained the highest precision on class 0 (65.5 ± 1.0), whereas the ensemble achieved markedly higher class 0 recall (58.7 ± 1.0), yielding a better overall balance for this difficult class. Fold-to-fold variability was modest (typically ≤ ∼1% SD across metrics), indicating stable estimates. These patterns underscore that model performance depends not only on architecture but also on the balance of class distributions and the subtlety of sentiment expression in clinical dialogue.
The findings align with and extend prior work in AI-driven SA. Studies on domain-general datasets have reported very high accuracies using BERT-based models, on online doctor reviews, often exceeding 95%. 6 These results, however, were largely based on binary classification tasks and large nonclinical corpora. In contrast, our study addresses a more demanding three-class sentiment classification problem in healthcare dialogs, where emotional intensity spans from mild reassurance to high-severity distress. This naturally results in lower absolute accuracies but highlights the novelty and difficulty of our setting. Our findings are consistent with those of Hsu et al., 53 who similarly emphasized the promise of transformer-based models for emotion recognition, pointing to their potential to enhance therapeutic communication and support early detection of mental health concerns. Our study demonstrates that contextual models like BERT capture nuanced emotional cues in doctor–patient interactions. Significantly, unlike the conceptual focus of many domain-general studies, our work contributes empirical evidence grounded in real clinical dialogue. It advances interpretability through attention maps and SHAP analyses, providing transparency into the linguistic cues driving predictions.
The clinical implications of these findings are significant. By reliably detecting both high-severity distress and moderate levels of patient concern, the proposed models could assist clinicians in tailoring communication strategies, improving empathy, and identifying when additional psychological support may be warranted. Ensemble methods, in particular, show promise for integration into real-time systems because of their robustness across sentiment classes. Moreover, attention maps revealed that BERT focuses on medically salient words (e.g. “pain” and “worried”) and speaker roles, while SHAP analysis identified domain-relevant n-grams (e.g. “cancer,” “blood,” and “scan”) as critical signals. These insights strengthen trust by demonstrating that models attend to clinically meaningful patterns rather than spurious correlations.
At the same time, several limitations must be acknowledged. This study analyzed only text transcripts, whereas real consultations involve multimodal cues such as prosody, facial expressions, and gestures that can convey sentiment more richly. The dataset, while valuable, is relatively small and imbalanced, particularly for high-severity classes, and it may not fully reflect the diversity of real clinical conversations, which limits generalizability across healthcare contexts. Furthermore, linguistic diversity poses challenges: the dataset is English-only, and results may not extend to other languages or cultural communication styles. Additionally, doctor–patient interactions may include indirect or nuanced expressions, such as sarcasm or understatement, which current models do not capture. Computationally, resource-intensive models like BERT remain difficult to deploy in resource-constrained healthcare environments without optimization. Methodologically, we mitigated some risks by using stratified five-fold cross-validation and applying oversampling only within each training partition, leaving validation/test portions unchanged; nonetheless, residual class imbalance and limited data remain important constraints. These constraints highlight the need for caution in directly translating findings into practice and pointing toward specific improvement directions.
Beyond technical issues, ethical considerations are central to applying sentiment analysis in healthcare. Although the dataset was anonymized, real-world deployment must ensure strict privacy protection and compliance with data governance standards. Automated sentiment predictions must not replace human clinical judgment, as misclassifications could seriously affect patient trust and care quality. Addressing these issues requires technical refinements, clear ethical guidelines, and stakeholder engagement.
Future work should expand datasets to include larger, more balanced, and multilingual samples, while also applying multimodal fusion techniques (e.g. speech and visual cues) and advanced data augmentation methods (e.g. back-translation and paraphrasing) to mitigate class imbalance. Exploring oversampling strategies, adaptive loss functions, and regularization techniques will further address uneven performance and reduce overfitting in complex models. Lightweight model compression methods such as pruning, quantization, or knowledge distillation will be critical to enable deployment in clinical environments. Given our results, an ensemble–transformer hybrid that preserves BERT's contextual precision on difficult classes while improving recall (as seen in the ensemble) is a promising direction. Additionally, comparative studies across diverse healthcare settings would clarify generalizability. Finally, embedding interpretability at the core of model design will remain essential for fostering clinician trust and ensuring safe adoption. Overall, this study provides one of the first systematic comparisons of deep learning, transformer, and ensemble models for sentiment analysis in doctor–patient interactions. By highlighting both the potential and the limitations of these approaches, it contributes to advancing AI methods that are not only accurate but also interpretable, ethically grounded, and clinically relevant.
Conclusion
This study provides one of the first systematic evaluations of DL, transformer, and ensemble models for SA in doctor–patient interactions. Under stratified five-fold cross-validation, the ensemble achieved the strongest overall accuracy (75.5 ± 0.5), outperforming the transformer (BERT, 66.9 ± 0.6), hybrid CNN–LSTM (65.68 ± 0.9), CNN (64.17 ± 0.8), BiLSTM (64.82 ± 0.7), and LSTM (58.66 ± 0.19). Fold-to-fold variability was modest (SDs ≲1%), supporting the robustness of these findings. The ensemble approach also delivered balanced performance across classes, with improved recall on the difficult low-severity class, while BERT offered higher precision on that class, reflecting complementary strengths. At the same time, BiLSTM and CNN-LSTM proved effective for high-severity cases, and BERT demonstrated strong contextual understanding despite data limitations. By combining rigorous model comparison with interpretability analyses through attention maps and SHAP values, the work advances both methodological transparency and practical relevance. Beyond improving sentiment classification accuracy, the findings show how AI can help clinicians recognize patient distress and tailor communication strategies more effectively. Future research should scale to larger, multilingual, and multimodal datasets; explore ensemble–transformer hybrids to couple BERT's precision with improved recall; and develop lightweight, interpretable models for reliable real-time deployment in clinical practice.
Footnotes
Informed consent
This study is a computational analysis of an anonymized, publicly available dataset of doctor–patient conversations from Hugging Face. It does not involve human participants, animal subjects, or experimental protocols requiring institutional approval or informed consent. All methods comply with relevant guidelines for secondary data analysis.
Contributorship
YG was involved in conceptualization, methodology, writing—review & editing, funding acquisition, and data curation; LD in writing—review & editing, formal analysis, and data curation; BH in writing—review & editing, resources, and supervision; and RK in writing—review & editing, supervision, and project administration.
Funding
The author disclosed receipt of the following financial support for the research, authorship, and/or publication of this article: This research was funded by the Philosophy and Social Sciences in Colleges and Universities of Anhui, China (project number 2023AH050544), the philosophy and Social Science of Anhui, China (project number AHSKQ2022D185), the philosophy and Social Science of Anhui, China, the Philosophy and Social Sciences in Colleges and Universities of Anhui, China (grant number AHSKQ2022D185, 2023AH050544).
Declaration of competing interest
The authors state that they have no known competing financial interests or personal relationships that could have influenced the work reported in this paper. Furthermore, no AI tools were used to develop or edit this manuscript.
Data availability
Permissions for figures
All figures (Figures 1–![]() ) were created by the authors from data analyzed in this study; no third-party materials were used, and no permissions are required.
) were created by the authors from data analyzed in this study; no third-party materials were used, and no permissions are required.
Guarantor
The guarantors for this manuscript are Rashid Khan, (rashidkhan@sztu.edu.cn), and Yufan Ge, (geyufan@ahmu.edu.cn).