
Abstract
Objectives
Anaplastic large cell lymphoma-anaplastic lymphoma kinase (ALCL-ALK) positive is a rare subtype of peripheral T-cell lymphoma with generally favorable prognosis but marked clinical heterogeneity. Due to limited research and complex prognostic factors, accurately predicting survival outcomes remains a clinical challenge.
Methods
This retrospective cohort study extracted data on 473 patients diagnosed with ALCL-ALK positive between 2016 and 2021 from the Surveillance, Epidemiology, and End Results (SEER) database. A multi-algorithm ensemble machine-learning framework was constructed. The performance of each model combination was systematically evaluated using the area under the curve (AUC) and concordance index, and the least absolute shrinkage and selection operator (LASSO) + Cox proportional hazards model via componentwise likelihood-based boosting (CoxBoost) combination was selected as the optimal model. Feature selection and survival prediction were performed, and model performance was validated using receiver operating characteristic curves and calibration plots.
Results
Six key prognostic variables were identified: age, marital status, Ann Arbor stage, radiotherapy, lung metastasis, and primary site. The LASSO + CoxBoost model demonstrated good discriminative ability, calibration, and effective risk stratification in both training and validation set. The AUC at 1, 3, and 5 years were 0.894, 0.829, and 0.862 in the training set, and 0.733, 0.773, and 0.881 in the validation set. Kaplan–Meier survival curves revealed significantly longer overall survival in the low-risk group compared to the high-risk group (P < 0.05).
Conclusion
This study is the first to construct a survival prediction model for ALCL-ALK positive using a multi-algorithm ensemble strategy. The model offers a practical tool for individualized risk assessment and may aid in optimizing clinical decision-making.
Keywords
Introduction
Anaplastic large cell lymphoma-anaplastic lymphoma kinase positive (ALCL-ALK positive) is a rare subtype of mature T-cell non-Hodgkin lymphoma, accounting for only 8–9% of peripheral T-cell lymphomas (PTCL) worldwide. However, its overall prognosis is generally better than that of the ALK-negative type. 1 Despite the relatively favorable outcomes associated with ALCL-ALK positive, the disease exhibits significant clinical heterogeneity, with a subset of patients experiencing early relapse and poor survival outcomes. Due to its low incidence and the limited number of related studies, individualized prognostic assessment for ALCL-ALK positive remains challenging in clinical practice. Existing prognostic research on ALCL-ALK positive cases is scarce and narrowly focused on clinical and pathological factors. Broader inclusion of demographic and treatment-related variables has been shown to markedly enhance survival prediction accuracy. The Surveillance, Epidemiology, and End Results (SEER) database, a large and nationally representative cancer registry in the United States, provides important data support for the study of rare malignancies. In recent years, machine learning has attracted increasing attention in oncology prognosis prediction owing to its ability to model nonlinear relationships and high-dimensional interactions among variables. 2 Particularly, ensemble learning methods, which integrate multiple algorithms, have demonstrated superior predictive performance and stability across various survival analysis tasks. 3 In this study, we utilized data from the SEER database covering ALCL-ALK positive cases diagnosed between 2016 and 2021 to construct and validate a multi-algorithm integrated ensemble model for survival prediction. This model aims to offer a clinically applicable tool for risk stratification and treatment decision-making in patients with ALCL-ALK positive.
Methods
This study followed the reporting guidelines of the TRIPOD (transparent reporting of a multivariable prediction model for individual prognosis or diagnosis) guidelines. 4 The overall workflow chart is illustrated in Figure 1.

Schematic of the study workflow.
Data source and patient selection
All data used in this study were obtained from the 17 registries included in the SEER database (November 2022 submission, covering 2000–2021), which represents approximately 30% of the US population. The study was conducted in accordance with the ethical standards of the Declaration of Helsinki. Patient information was extracted using SEER*Stat software (version 8.4.3). Inclusion criteria: patients diagnosed with ALCL-ALK positive (ICD-O-3 code: M9714/3) between 2016 and 2021. Exclusion criteria: (1) nonpathologically confirmed diagnoses; (2) non only one primary tumor; (3) survival time is 0 months or unknown; (4) marital status and race are unknown; (5) staging information (Ann Arbor stage, summary stage) is unknown; (6) B symptoms is N/A or blank; (7) distant metastasis (bone, brain, liver, lung) is blank; (8) missing or unavailable information on treatment modalities (surgery, radiotherapy, chemotherapy); (9) residential information (rural–urban continuum code) is unknown; (10) primary site is unknown; and (11) time from diagnosis to treatment is unknown. The flowchart of patient screening is shown in Figure 2.
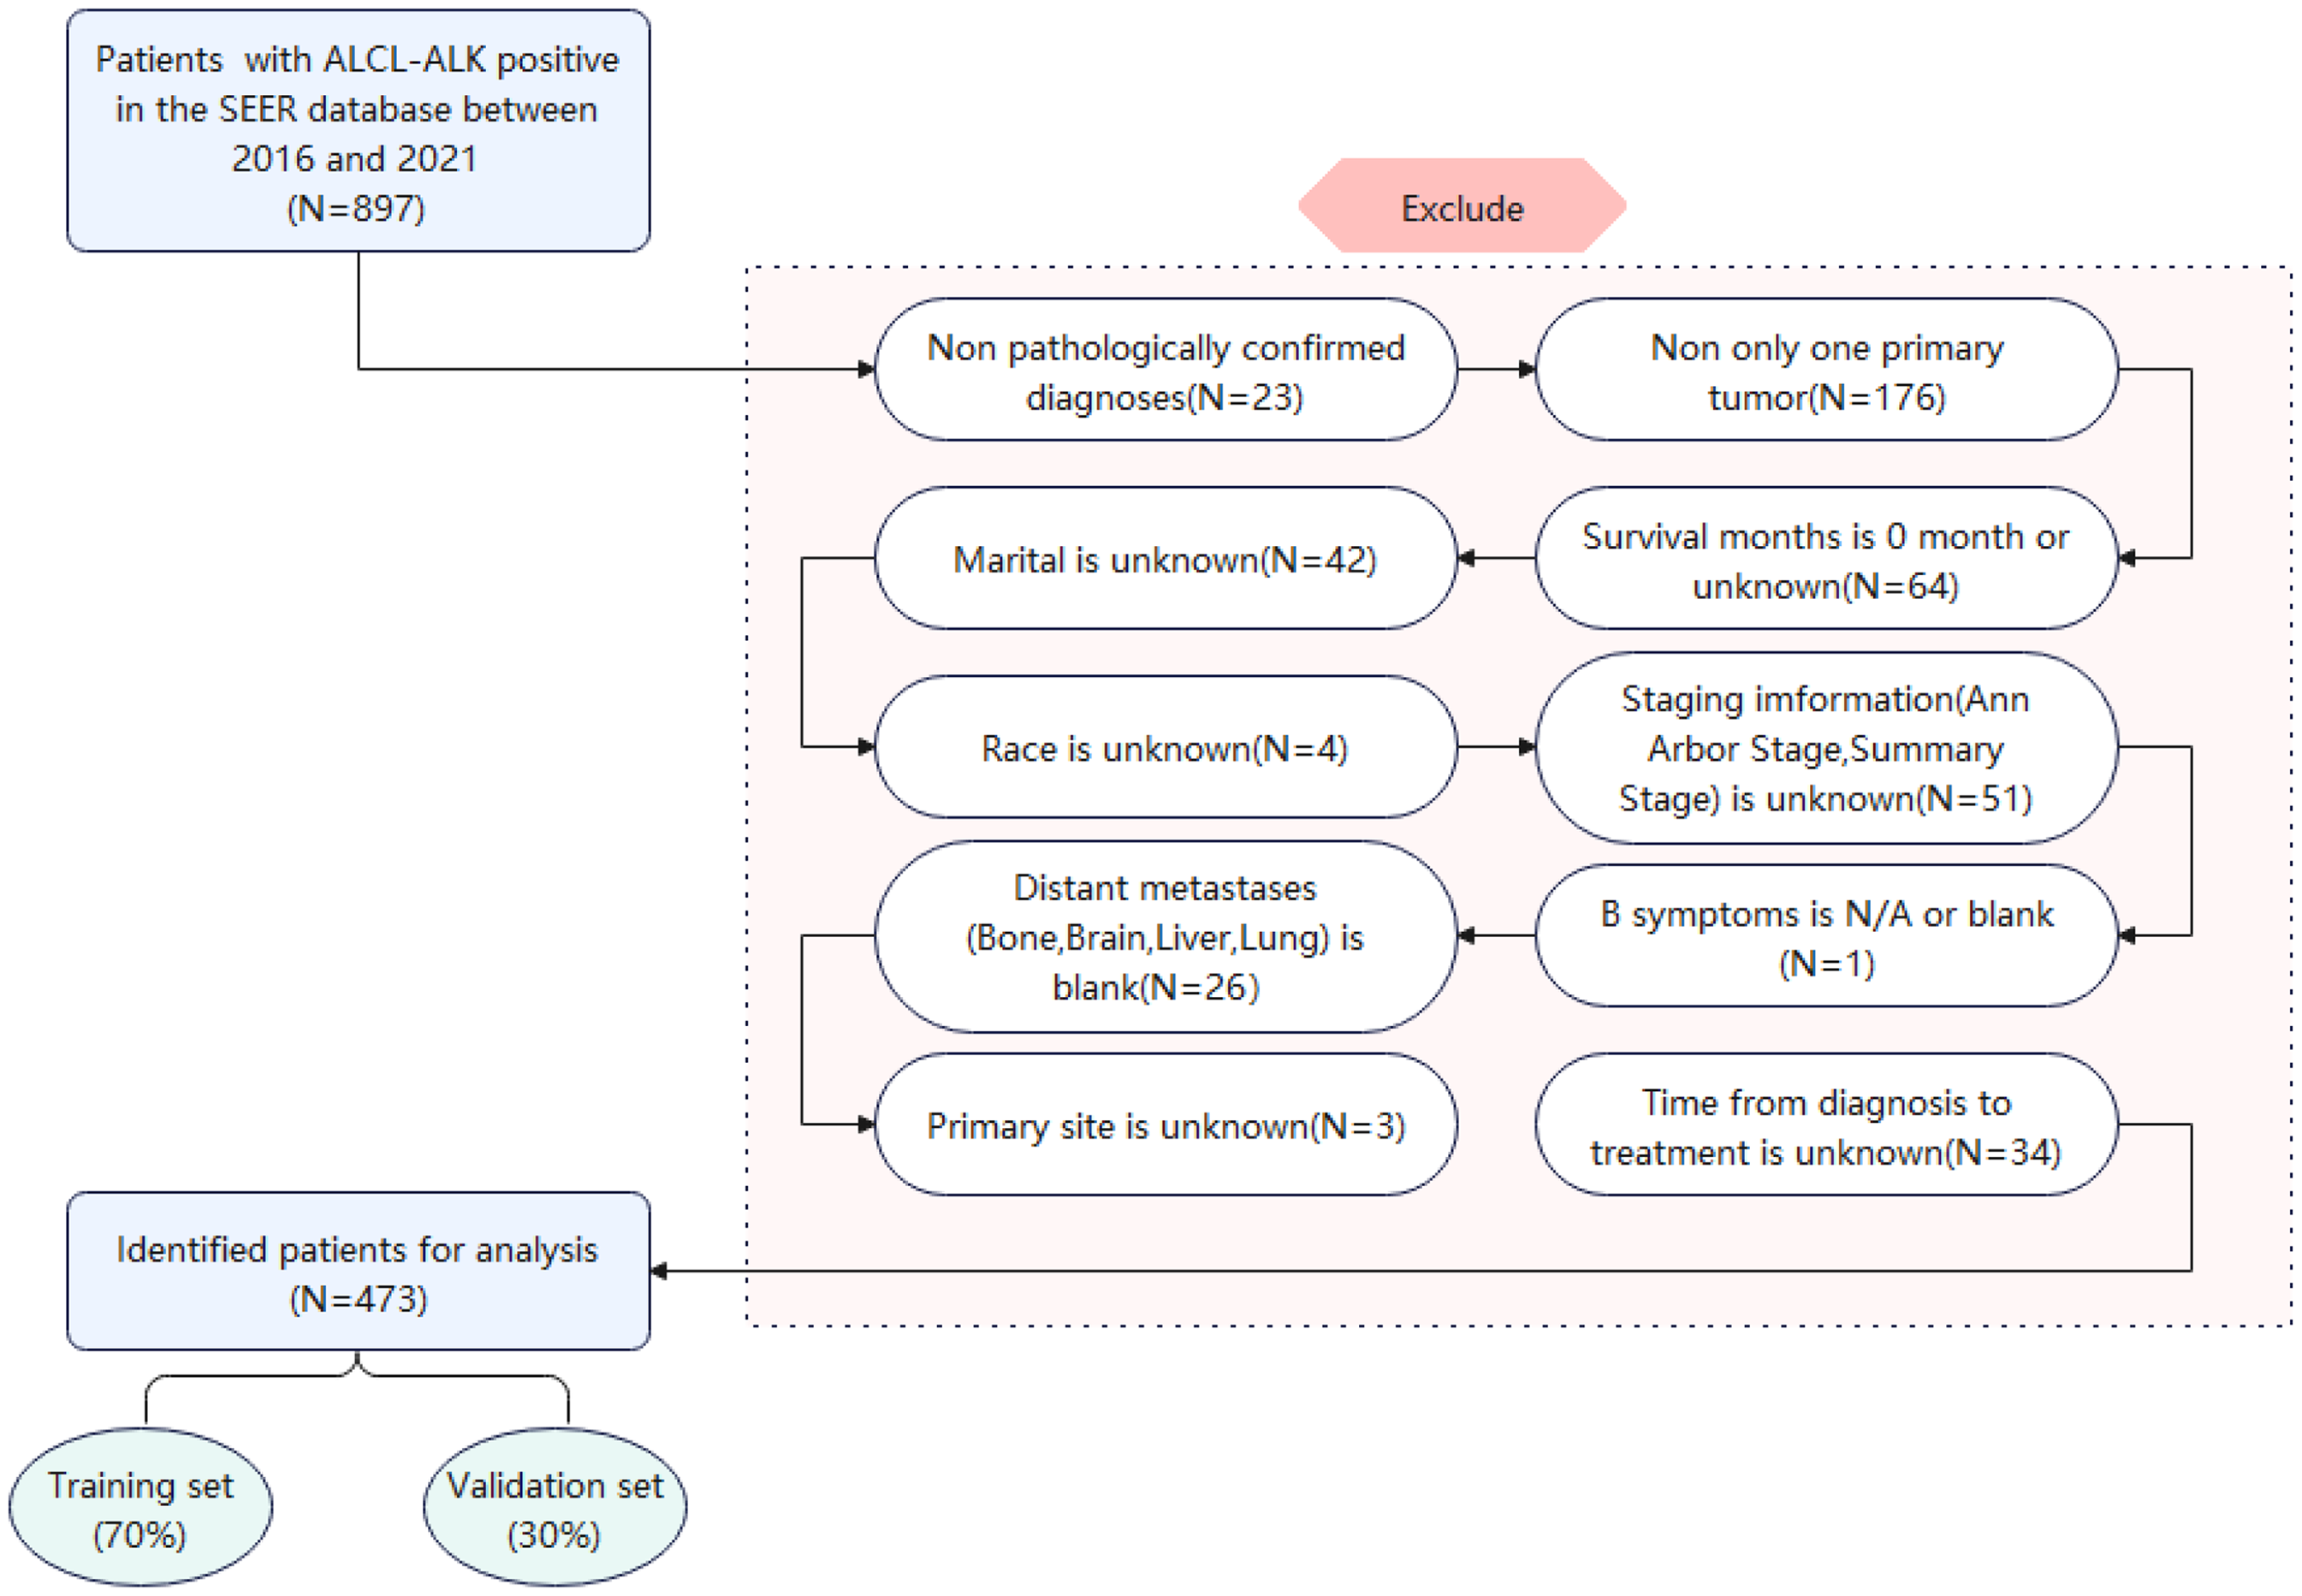
Flowchart illustrating patient selection for this study.
Data extraction
After excluding patients with incomplete information, a total of 473 patients with ALCL-ALK positive were included in the study. Patients were randomly assigned to the training and validation cohorts in a 7:3 ratio. The variables included in the analysis were age, sex, marital status, race, summary stage, Ann Arbor stage, surgery, radiotherapy, chemotherapy, B symptoms, bone metastasis, brain metastasis, liver metastasis, lung metastasis, median household income, residential information, primary site, time from diagnosis to treatment, survival status, and survival time. The primary endpoint of the study was overall survival (OS), which was defined as the time from the initial diagnosis to death from any cause.
Construction of the multi-algorithm ensemble learning framework
To enhance the accuracy and robustness of prognostic prediction, we constructed a multi-algorithm ensemble machine-learning framework that integrates the following base models and their combinations: random survival forest (RSF): an ensemble learning method based on decision trees. RSF builds multiple survival trees using bootstrap sampling and random feature selection, enabling it to capture nonlinear relationships and high-order interactions among variables. Gradient boosting machine (GBM): a boosting-based ensemble algorithm that iteratively trains weak learners (typically regression trees) to optimize a specified loss function, such as the Cox partial likelihood. GBM has strong fitting capability and is effective in modeling nonlinear structures. Cox proportional hazards model via componentwise likelihood-based boosting (CoxBoost): a boosting algorithm specifically designed for survival analysis. It iteratively updates variable coefficients and is particularly suitable for modeling high-dimensional survival data with relatively small sample sizes. Least absolute shrinkage and selection operator (LASSO): a regularization method that introduces an L1 penalty in the loss function, which forces some regression coefficients to shrink to zero, thus achieving variable selection and dimensionality reduction. Partial least squares regression for Cox: a dimensionality reduction technique that extracts latent variables from original predictors based on their correlation with outcomes, helping to mitigate the instability caused by multi-collinearity. Supervised principal component: an extension of principal component analysis that incorporates outcome-related supervision to identify principal components most associated with survival, balancing dimensionality reduction and predictive performance. Survival support vector machine: an extension of the support vector machine algorithm for survival analysis. It optimizes a ranking or regression-based objective function and is particularly advantageous for nonlinear risk modeling, especially when decision boundaries are complex. Stepwise Cox regression: a traditional variable selection method based on statistical significance testing. It includes forward selection, backward elimination, or bidirectional search, aiming to retain significant predictors while simplifying the model structure. 3
This study developed an integrated machine-learning framework based on a “dimension-reduction-first, modeling-second” strategy, in which multiple feature-reduction methods were combined with multiple modeling algorithms. Each “reduction + modeling” combination was applied independently to the training and validation sets, with feature reduction and model construction performed separately within each set. The performance of all combinations in survival risk prediction was systematically evaluated, and the best-performing combination was selected as the optimal model. The ensemble strategy integrated different types of algorithms either sequentially or in parallel, balancing interpretability and predictive performance. This approach leveraged the strengths of individual algorithms in feature selection, nonlinear modeling, and high-dimensional data processing, thereby substantially enhancing the generalizability and robustness of the model across different datasets. 5 Model performance was evaluated using the area under the curve (AUC) and the concordance index (C-index). The AUC quantifies the model's ability to distinguish between different outcomes (e.g. survival vs. death), ranging from 0.5 to 1.0, with higher values indicating better discriminative performance. An AUC > 0.7 is generally considered an indicative of good discrimination. The C-index measures the consistency between the predicted risk ranking and the actual survival times. It is well-suited for censored survival data, and a C-index > 0.7 is typically considered acceptable for predictive concordance. Together, AUC and C-index were used to comprehensively assess the discriminative ability and stability of each model, and to identify the optimal model. The predictive performance of each ensemble combination was assessed in both the training and validation cohorts, and the model with the best overall performance was selected for clinical risk prediction and stratification analysis.
Optimal models feature selection and model validation
The optimal model was identified from the multi-algorithm ensemble framework based on its superior predictive performance. Feature selection was then performed using this optimal model, followed by evaluation of its predictive capabilities. Model discrimination was assessed using receiver operating characteristic (ROC) curves and the corresponding AUC. Calibration performance was evaluated using calibration plots based on 1000 bootstrap resamples to assess the agreement between the predicted and observed outcomes. 5 Decision curve analysis (DCA) compares the net benefit of different prediction models across various threshold probabilities. 6 Based on individual risk scores generated by the optimal model, patients were stratified into high-risk and low-risk groups. Kaplan–Meier (K–M) survival curves were generated to visualize differences in survival between the two groups. The log-rank test was used to compare survival distributions, thereby evaluating the effectiveness of the model in clinical risk stratification and survival prediction.
Sensitivity analysis
We compared complete case analysis (CCA) with multiple imputation (MI) to evaluate the influence of missing data. MI was performed using chained equations to create 20 imputed datasets, with results combined using Rubin's rules. Model discrimination (C-index) and regression coefficients were examined under both approaches to assess the robustness of findings.
Statistical analysis
Ordinal data were analyzed using the rank-sum test, and categorical variables were compared using the chi-square χ2) test. Continuous variables that did not follow a normal distribution were expressed as medians or interquartile ranges. Survival curves were generated using the K–M method, and differences between the groups were compared using the log-rank test. All statistical analyses were performed using R software (version 4.1.3), and additional statistical analyses were conducted using SPSS software (version 26.0; IBM Corp., Armonk, NY, USA). A two-sided p-value <0.05 was considered statistically significant.
Result
Baseline characteristics of patients
The optimal age cutoff values were determined using X-tile software (version 3.6.1), and patients were categorized into three age groups: ≤47 years, 48–64 years, and ≥65 years (Figure 3(a) to (c)). In the overall cohort, the majority of patients were male, and most were White (77.59%). More than half of the patients were aged ≤47 years (54.97%). Marital status was distributed as follows: married (44.82%), unmarried (42.28%), and separated/divorced/widowed (12.90%). According to the summary stage, the distant stage was the most common (57.72%). According to the Ann Arbor staging system, early-stage (stages I and II) and advanced-stage (stages III and IV) accounted for 41.86% and 58.14%, respectively. B symptoms were present at diagnosis in 41.23% of patients. Among the sites of distant metastasis, bone (9.51%) and lung (6.98%) metastasis were the most common. A minority of patients received surgery (19.45%) or radiotherapy (13.32%), whereas the majority received chemotherapy (93.02%). Most patients belonged to the middle- to high-income group ($40,000–119,999), comprising 91.12% of the cohort, and the majority resided in urban areas (90.49%). The primary sites of ALCL-ALK positive lymphoma were predominantly lymph nodes and the spleen (83.93%). The clinical and demographic characteristics of patients with ALCL-ALK positive are summarized in Table 1. The comparison between the included and excluded cases is presented in Supplemental Table S1.

Optimal cut-off values for age were determined by X-tile software.
Demographic and treatment characteristics of patients with ALCL-ALK positive.
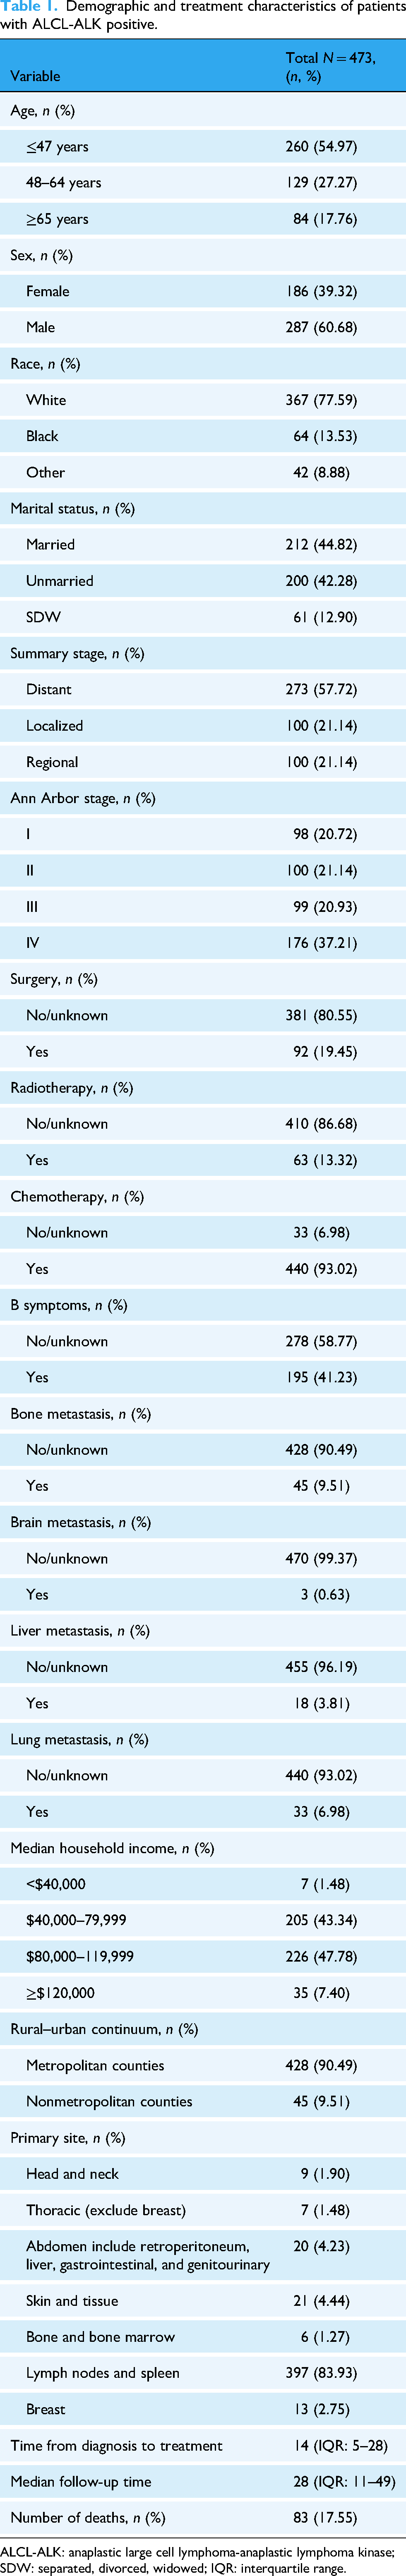
ALCL-ALK: anaplastic large cell lymphoma-anaplastic lymphoma kinase; SDW: separated, divorced, widowed; IQR: interquartile range.
Construction of the multi-algorithm ensemble learning
We compared the predictive performance of various ensemble models in both the training and validation cohorts, with primary evaluation metrics including the C-index and AUC. The results of the ensemble models were ranked in the descending order according to their C-index values (Figure 4). The RSF achieved an AUC of 0.937 and a C-index of 0.837 in the training set, but its AUC dropped to 0.736 in the validation set, suggesting a potential risk of overfitting. Similarly, combinations such as RSF with stepwise Cox (backward), stepwise Cox (both), CoxBoost, and LASSO demonstrated excellent performance in the training set, with C-index values all ≥0.792. However, these models also exhibited substantial decreases in AUC values in the validation set (<0.7), indicating possible overfitting. In contrast, the combination of LASSO and CoxBoost showed a more balanced performance between the training and validation sets, with a C-index of 0.784, reflecting good predictive concordance. This combination also demonstrated favorable discriminative ability and generalizability. Therefore, the LASSO + CoxBoost model was selected as the final model for subsequent analyses.
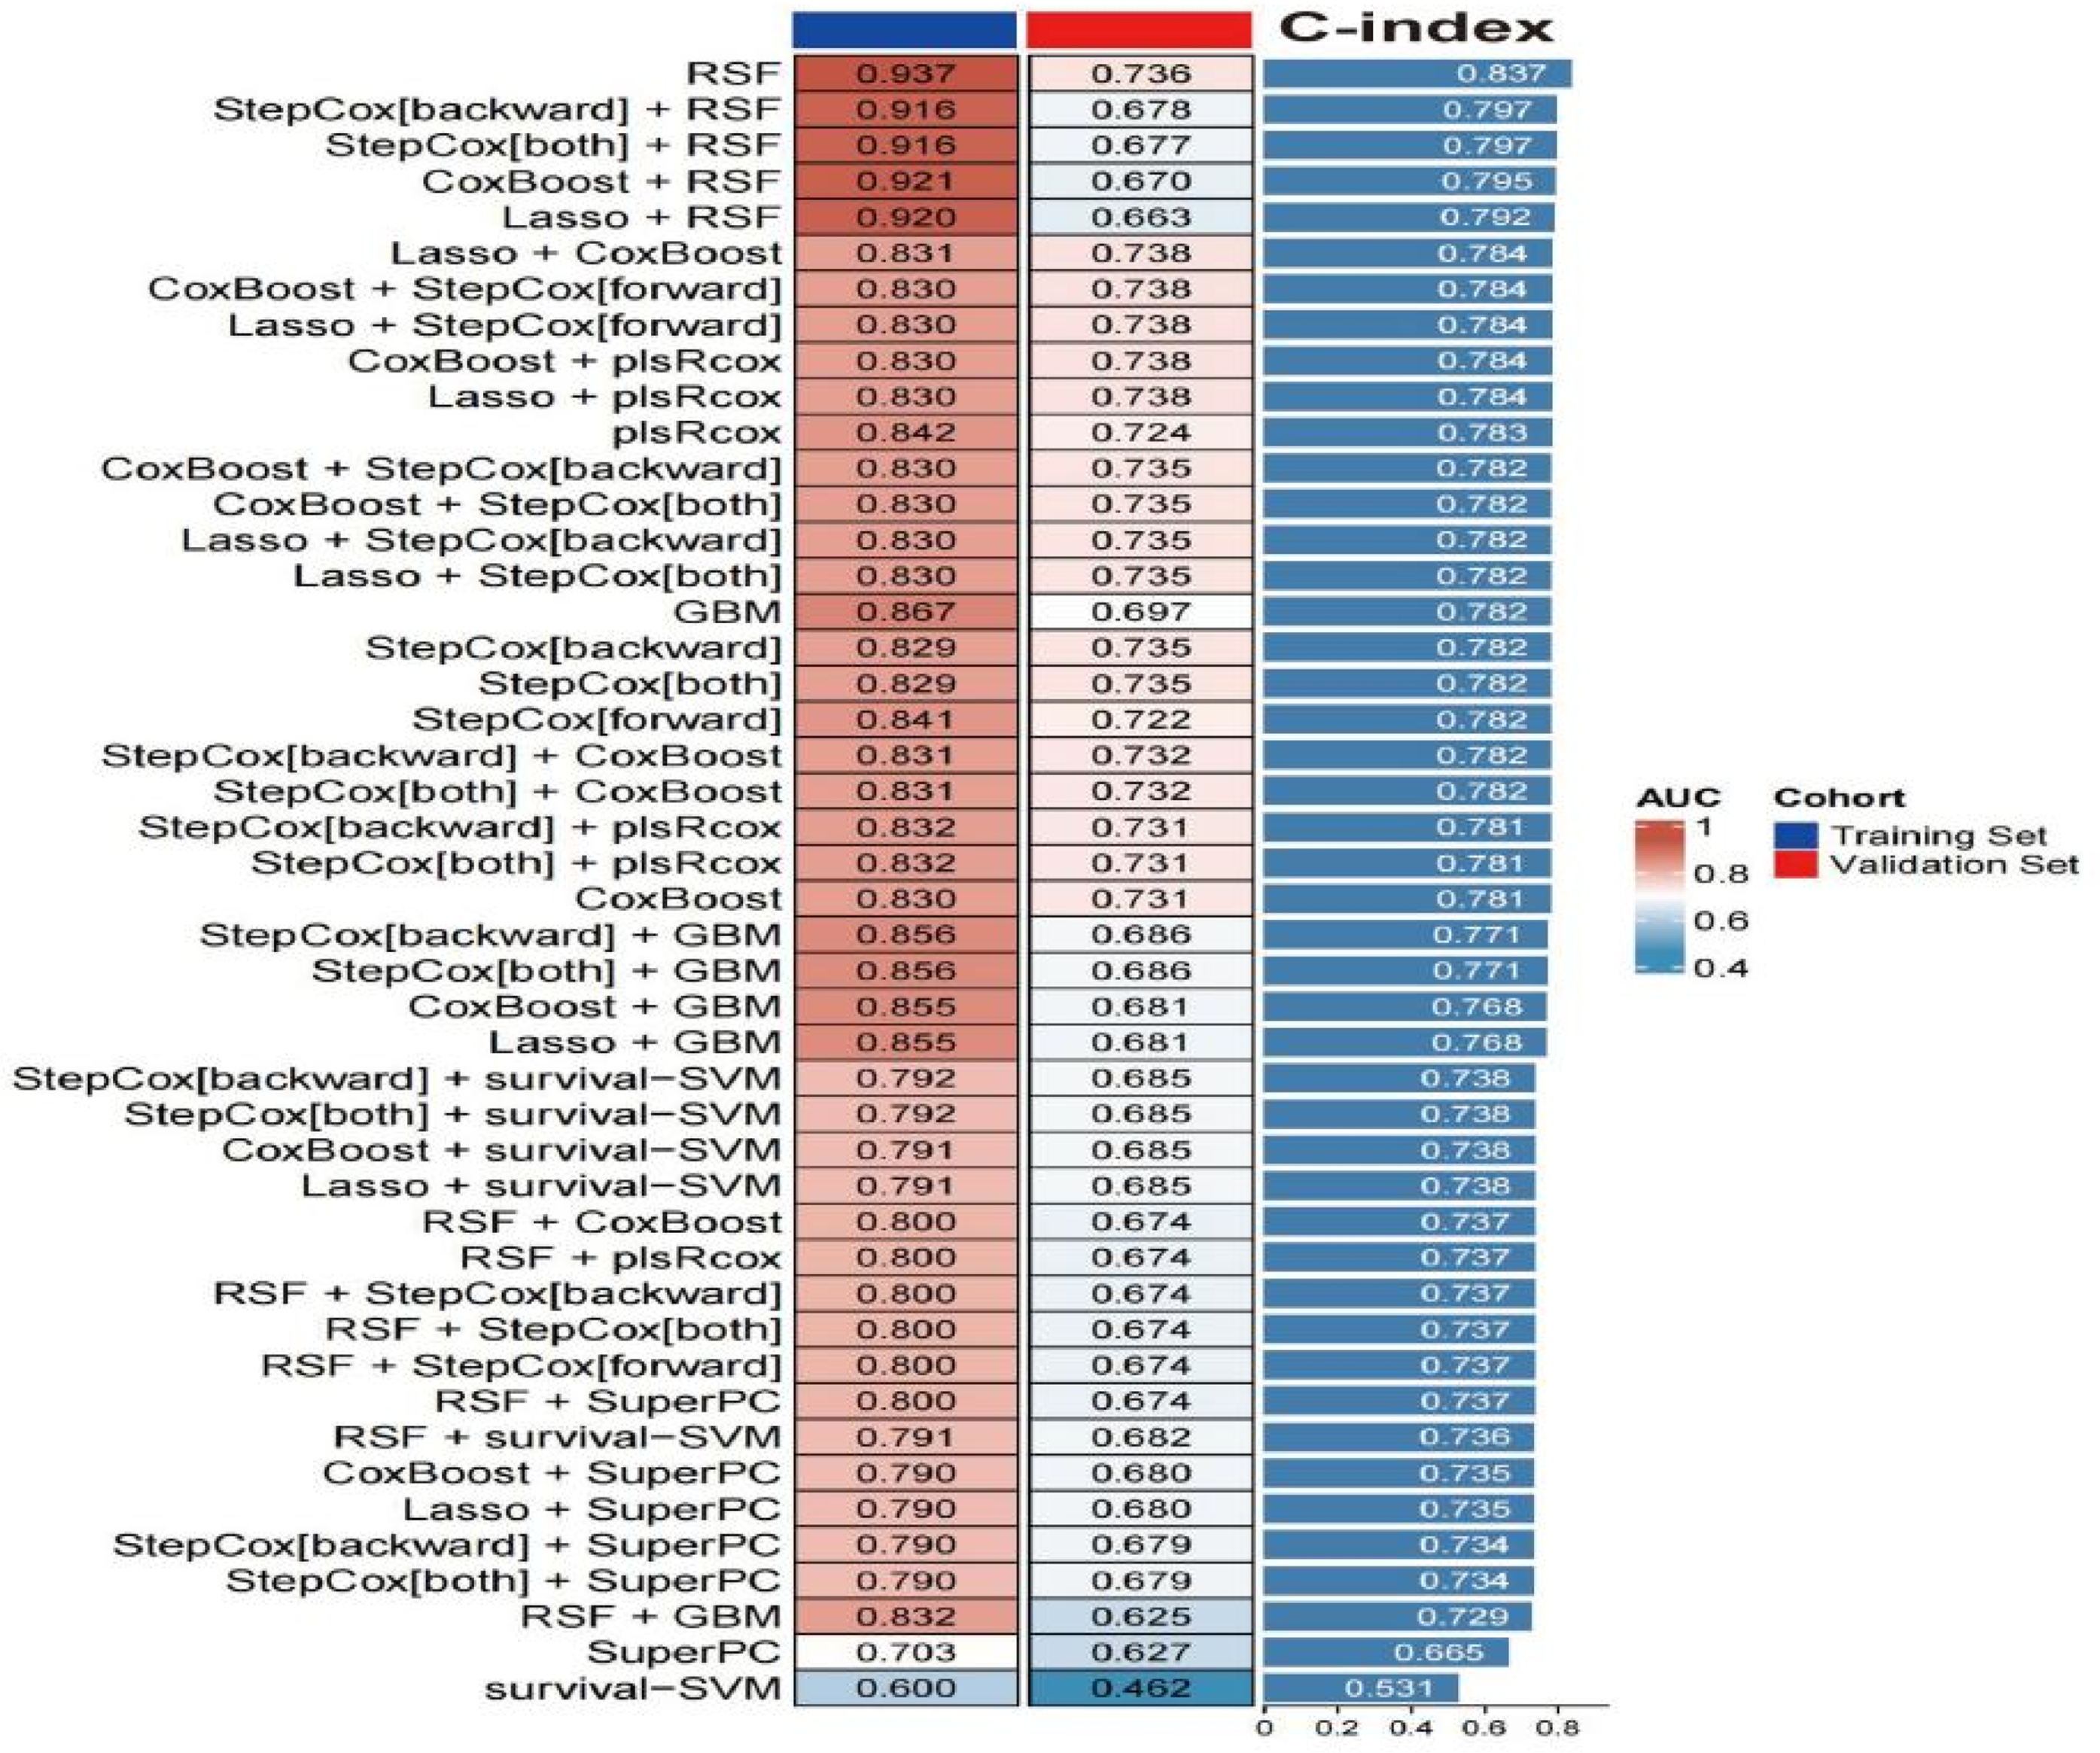
C-index and AUC performance of different ensemble models in the training and validation sets. RSF: random survival forest; GBM: gradient boosting machine; CoxBoost: Cox proportional hazards model via componentwise likelihood-based boosting; LASSO: least absolute shrinkage and selection operator; PlsRcox: partial least squares regression for Cox; SuperPC: supervised principal component; Survival-SVM: survival support vector machine; StepCox (forward): stepwise Cox regression (forward); StepCox (backward): stepwise Cox regression (backward); StepCox (both): stepwise Cox regression (both); C-index: concordance index; AUC: area under the curve.
Risk factors for ALCL-ALK positive
By constructing a multi-algorithm ensemble learning framework, the combination of LASSO and CoxBoost was ultimately identified as the optimal model. Since LASSO was an integral component of the optimal model, we further applied it to visualize the variable selection process. This visualization serves to clarify the contribution of each predictor and to enhance the interpretability of the model. The subsequent feature selection was performed on the training set using LASSO regression. LASSO achieves automatic variable selection by shrinking some regression coefficients to zero (Figure 5(a)). A ten-fold cross-validation was employed to determine the optimal value of the regularization parameter lambda, aiming to balance model complexity and predictive performance, and to ensure that only the most relevant and robust variables were retained during model development. All candidate variables were subjected to LASSO regression for feature selection. Based on 10-fold cross-validation (Figure 5(b)), the model corresponding to lambda min retained six nonzero coefficient variables, whereas the more conservative lambda.1se model retained only three. Considering both model interpretability and the risk of overfitting, the model at lambda.min was selected, resulting in six key predictors with nonzero coefficients (Table 2), including age, marital status, receipt of radiotherapy, Ann Arbor stage, lung metastasis, and primary tumor site. The bootstrap variable selection frequency plot revealed that variables such as age, Ann Arbor stage, marital status, radiotherapy, lung metastasis, and primary site were retained in the majority of the bootstrap samples (most of them almost >75%), indicating high selection stability. In contrast, factors such as brain metastasis, summary stage, and chemotherapy exhibited low selection frequencies (<50%), suggesting limited stability. These findings highlight that the core predictors identified by the model are robust and not driven by random sample fluctuations (Figure 5(c)).

LASSO regression for feature selection and bootstrap variable selection frequency. LASSO: least absolute shrinkage and selection operator.
Variables and corresponding coefficients selected by LASSO.

LASSO: least absolute shrinkage and selection operator.
Optimal model validation
In the performance evaluation of the LASSO + CoxBoost model, time-dependent ROC analyses at 1, 3, and 5 year demonstrated good discriminative ability in both the training and validation cohorts. The AUCs for the training cohort were 0.894 (95% confidence interval (CI): 0.846–0.941), 0.829 (95% CI: 0.757–0.902), and 0.862 (95% CI: 0.787–0.937), respectively. For the validation cohort, the corresponding AUCs were 0.733 (95% CI: 0.622–0.844), 0.773 (95% CI: 0.663–0.883), and 0.881 (95% CI: 0.786–0.975) (Figure 6(a) and (b)). All AUC values exceeded 0.7, indicating good discriminatory performance of the model. In addition, the calibration curves showed a high degree of agreement between the predicted probabilities and actual outcomes in both cohorts, with the curves closely aligning with the ideal 45° reference line. The AUCs for the training cohort were 0.894 (95% CI: 0.846–0.941), 0.829 (95% CI: 0.757–0.902), and 0.862 (95% CI: 0.787–0.937), respectively. For the validation cohort, the corresponding AUCs were 0.733 (95% CI: 0.622–0.844), 0.773 (95% CI: 0.663–0.883), and 0.881 (95% CI: 0.786–0.975) (Figure 6(a) and (b)). Calibration analysis showed a good agreement between the predicted and observed survival probabilities in both the cohorts. In the training set, the calibration intercepts and slopes for 1, 3, and 5-year survival were −0.08/1.09, −0.07/1.09, and −0.13/1.15. In the validation set, the calibration intercepts and slopes were −0.05/1.04, −0.13/1.14, and −0.31/1.39. These findings suggest that the model is well-calibrated and capable of providing reliable survival predictions (Figure 6(c) and (d)). DCA showed that the model provided greater net benefit than the “treat-all” and “treat-none” strategies at 1, 3, and 5 years in both the training and validation cohorts, supporting its clinical applicability (Figure 6(e) and (f)).
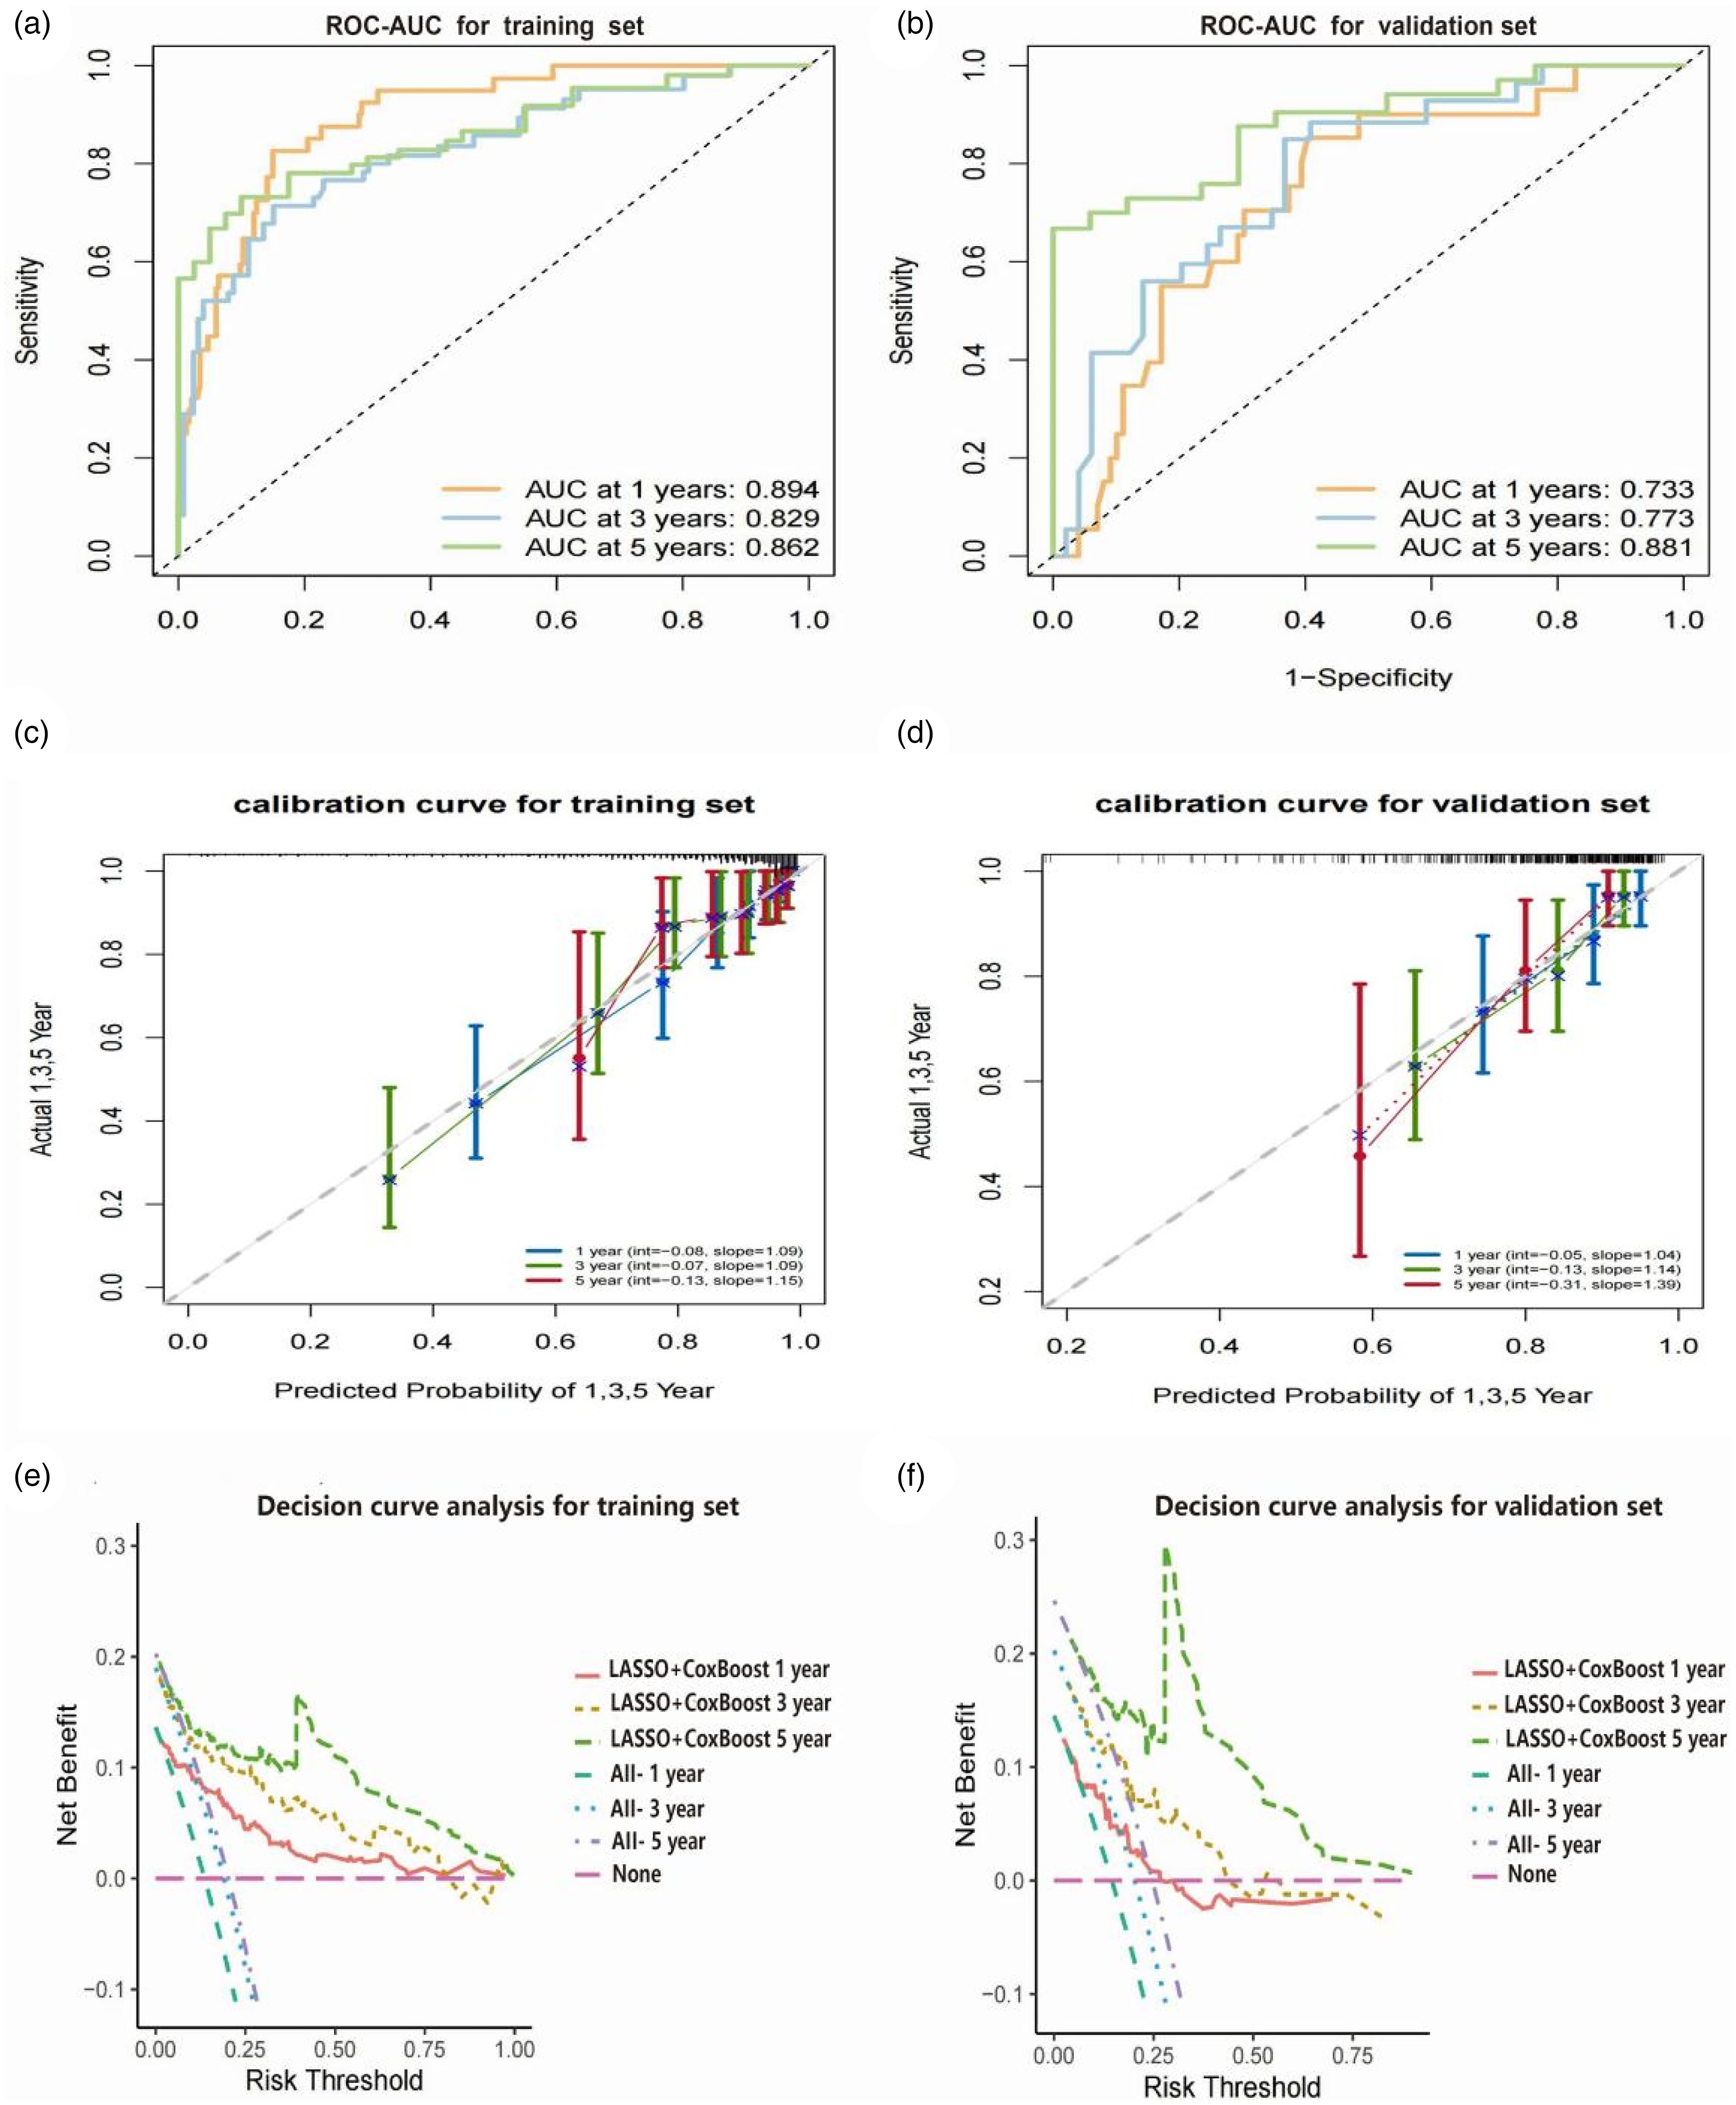
The 1, 3, and 5-year ROC-AUC curves in the training set (a) and validation set (b). The 1, 3, and 5-year calibration curves in the training set (c) and validation set (d). The 1, 3, and 5-year DCA in the training set (e) and validation set (f). ROC: receiver operating characteristic; AUC: area under the curve; DCA: decision curve analysis.
Sensitivity analysis
The sensitivity analysis with MI yielded results highly consistent with the CCA. The pooled C-index of the LASSO + CoxBoost model across imputed datasets was 0.781 (95% CI: 0.742–0.820), compared to 0.784 in the primary analysis. Similarly, the 1-, 3-, and 5-year AUC remained above 0.70 in both the training and validation cohorts, confirming the robustness of our findings against potential bias introduced by case exclusion (Supplemental Tables S2 and S3).
Risk stratification
To further elucidate the survival differences associated with the six key variables, using the training set, K–M survival curves were generated for each variable, stratified by different levels. This approach provided an intuitive visualization of survival stratification across various risk factors (Figure 7(a) and (f)). Interestingly, although radiotherapy and lung metastasis were identified as important prognostic variables in the LASSO-based ensemble modeling framework, they did not show statistically significant differences in the K–M survival curves subgroup analysis (P > 0.05). Similar observations have been reported in previous studies. 3 This apparent inconsistency reflects a fundamental distinction between regularized multi-variable regression and traditional univariable statistical testing. LASSO selects variables based on their overall contribution to model predictive performance, allowing for the inclusion of variables with modest effect sizes that may still carry clinical relevance when considered alongside other covariates. In contrast, the log-rank test used in K–M analysis does not adjust for potential confounders and may have limited statistical power, particularly in subgroups with small sample sizes or imbalanced distributions, such as patients with lung metastasis. 6 Furthermore, the effects of radiotherapy and metastatic lesions on survival may be time-dependent or follow complex pathways that are not adequately captured in univariable analyses. Importantly, our model demonstrated strong internal validation performance across multiple metrics, including AUC, C-index, and calibration curves, which further supports the prognostic value of variables selected by LASSO, even when they do not reach statistical significance in isolation. Based on the individual risk scores, patients were stratified into low-risk and high-risk groups. K–M survival curves (Figure 8) showed that patients in the low-risk group had significantly better OS than those in the high-risk group in both the training and validation set (P < 0.05).

Performance of K–M curve in different subgroups: radiotherapy (a), Ann Arbor stage (b), lung metastasis (c), primary site (d), marital status (e), and age (f). Abdomen includes retroperitoneum, liver, gastrointestinal, and genitourinary. K–M: Kaplan–Meier.

Kaplan–Meier survival curve of training set (a) and validation set (b).
Discussion
Although ALCL-ALK positive has better prognoses compared to other subtypes of PTCL, the application of novel therapeutic strategies in recent years has further improved survival outcomes. However, a subset of patients still experiences disease progression or relapse shortly after diagnosis, highlighting the pronounced clinical heterogeneity of ALCL-ALK positive. 7 This heterogeneity poses significant challenges to individualized prognostic assessment. Therefore, there is an urgent need to develop accurate and quantifiable prognostic tools to facilitate early identification of high-risk patients and support optimization of clinical decision-making.
Currently, survival prediction studies specific to ALCL-ALK positive remain limited. Existing prognostic systems largely rely on traditional staging criteria or isolated clinical indicators, which fail to comprehensively capture the complex biological characteristics of the disease and their integrated impact on patient outcomes. Previous studies have demonstrated that, in oncology, prognostic models integrating multiple variables outperform conventional stratification systems in predicting OS, offering significantly improved accuracy and reliability. The SEER database, which covers approximately 30% of the US population, provides multi-dimensional data encompassing tumor anatomical and pathological features, demographic characteristics, and treatment-related information, making it an ideal resource for prognostic studies in rare malignancies. 8 Building upon this, the present study innovatively incorporated a multi-algorithm ensemble strategy based on machine learning. By leveraging the powerful capabilities of machine learning in handling high-dimensional data and modeling nonlinear relationships, we developed a precise and clinically applicable survival prediction model. This model aims to provide a scientific and systematic basis for risk assessment in ALCL-ALK positive patients, thereby supporting the development and optimization of individualized treatment strategies.
Traditional single-model approaches, such as using Cox regression alone for feature selection and model construction, may be effective in certain scenarios. However, these methods are inevitably influenced by the modeler's subjective preferences, the inherent characteristics of the model, and the sensitivity to data structure, which can result in biased outcomes and limited stability. 3 On the one hand, different algorithms inherently adopt distinct criteria for variable selection and weight assignment. A single model may overly rely on a specific class of features while neglecting other potentially important variables. 9 On the other hand, conventional methods often suffer from overfitting or unstable feature selection when applied to high-dimensional, nonlinear, or highly correlated data, thereby compromising the model's generalizability and clinical utility. 10 To overcome these limitations, we adopted an ensemble framework that integrates multiple machine-learning algorithms. We first systematically explored the predictive performance of various models and their combinations across the entire dataset to objectively identify the optimal ensemble model. Feature selection and model training were then conducted based on the selected optimal model. This strategy minimizes subjective interference in model development and avoids the feature bias associated with single-algorithm approaches. By leveraging the complementary strengths of different algorithms, the framework maximally captures informative signals within the data. 11 The integration of diverse algorithmic types within the ensemble framework enhances the stability, predictive accuracy, and clinical applicability of the resulting features and model. It is worth emphasizing that, rather than relying on preliminary subjective feature selection followed by model construction, we adopted a reverse strategy in which key features were identified through comprehensive exploration across multiple algorithms. This ensemble-based, performance-driven feature selection approach ensures that the final variables included in the model demonstrate consistent prognostic value during validation, thereby enhancing the model's generalizability to unseen data and improving the objectivity and scientific rigor of the study. Compared with traditional modeling strategies that heavily depend on expert experience or individual preference, our multi-algorithm ensemble learning framework demonstrated greater reliability and practical potential for risk prediction in ALCL-ALK positive, a rare lymphoma subtype.
This study is the first to introduce an integrated framework comprising multiple machine-learning models for survival prediction in ALCL-ALK positive patients, employing a “dimension reduction first, modeling second” strategy for model selection. Dimensionality reduction algorithms effectively identify features highly associated with outcomes from a large set of clinical variables, thereby reducing information redundancy and preventing model overfitting. Modeling algorithms then further capture the nonlinear relationships between features and survival outcomes, enhancing the predictive accuracy of the model. 12 Compared with traditional single-model approaches, the ensemble model leverages the complementary strengths of various algorithms, striking a balance between interpretability and stability while significantly improving generalizability. Among the evaluated combinations, the LASSO + CoxBoost model demonstrated superior discriminative ability and predictive consistency in both the training and validation cohorts, and was ultimately selected as the optimal model for subsequent risk assessment. This combination not only exhibited stable performance in terms of ROC-AUC and C-index but also showed excellent calibration, further supporting its clinical applicability and reliability in survival prediction. DCA also further confirmed the clinical utility of the model. Sensitivity analyses comparing CCA and MI produced consistent results, confirming the robustness of our findings. The MI approach yielded slightly higher C-index values and narrower CIs, suggesting improved statistical efficiency without altering the overall conclusions.
The six key variables identified by the model: age, marital status, Ann Arbor stage, radiotherapy, lung metastasis, and primary site, are all of clinical and biological relevance. Advanced age has consistently been associated with poorer OS in cancer patients. An international retrospective study by Mead et al. involving 891 elderly patients with PTCL showed that the majority died within 1 year of diagnosis, and each 5-year increase in age was identified as a significant adverse prognostic factor. 13 The poor prognosis in elderly lymphoma patients may be attributed to physiological aging, a higher burden of comorbidities, reduced treatment tolerance, and unfavorable tumor biology. Similarly, a more advanced Ann Arbor stage often reflects increased tumor aggressiveness and burden, leading to reduced survival. Multiple studies have reported that patients diagnosed at advanced stages exhibit significantly worse outcomes and shorter OS compared to those diagnosed at earlier stages.14,15 These findings are consistent with our results, in which Ann Arbor stage emerged as a key predictor of OS. K–M survival curves further demonstrated that patients with advanced-stage disease had markedly shorter OS than those with early-stage disease.
Unfavorable marital status (including separation, divorce, or widowhood) has also been found to be significantly associated with poor prognosis in patients with ALCL-ALK positive. Several studies have suggested that marital status has a substantial impact on survival outcomes in lymphoma patients.16,17 Patients with adverse marital circumstances may experience higher levels of psychological stress, reduced social support, and greater emotional trauma, all of which can negatively influence treatment adherence and psychological resilience. Lymphoma is a malignancy closely linked to the immune system, and chronic psychological stress has been shown to impair immune function, potentially facilitating tumor progression. Consequently, marital, social, and emotional support may serve as protective factors in the disease trajectory of cancer patients. These findings highlight the need for clinicians to pay particular attention to patients with low levels of marital or social support and to consider additional interventions aimed at improving OS in this vulnerable subgroup.
Similarly, we found that the primary tumor site had a significant impact on the prognosis of patients with ALCL-ALK positive. Specifically, patients with primary lesions located in the head and neck, bone marrow, and abdominal regions exhibited relatively shorter OS. Notably, this finding differs from the results reported by Guru Murthy et al., who analyzed SEER data from 2001 to 2013 and focused on ALCL-ALK positive patients aged 20 years and older. Their study indicated that patients with extranodal involvement in the chest and abdomen had poorer survival outcomes. 18 This discrepancy may be attributed to differences in the time periods covered by the two studies. Our study included cases diagnosed between 2016 and 2021, during which diagnostic approaches and therapeutic strategies—particularly the introduction of novel agents—may have evolved and impacted survival differently across primary sites. Moreover, our study included patients of all ages, whereas Guru Murthy et al. restricted their analysis to individuals aged ≥20 years. Differences in age distribution may also contribute to variations in survival outcomes. Given the limited number of studies available on this topic, further multi-center investigations with large-scale cohorts are warranted to validate the prognostic significance of primary tumor site in ALCL-ALK positive patients and to elucidate the underlying mechanisms.
In this study, although radiotherapy and lung metastasis did not reach statistical significance in univariate survival analysis based on K–M curves, this may be attributed to limitations in sample size, imbalanced subgroup distribution, or the lack of adjustment for potential confounding factors (events of radiotherapy and lung metastasis by each category are given in Supplemental Table S4). Nonetheless, both variables were retained in the multi-variable model constructed using regularization methods such as LASSO regression. This finding suggests that radiotherapy and lung metastasis may still contribute meaningfully to OS prediction when considered within the context of multi-variable interactions. Unlike traditional univariate analyses, regularized regression is capable of evaluating the marginal contribution of each variable to the overall predictive performance of the model in the presence of multiple covariates. As such, it can identify key factors that may exert relatively weak individual effects but remain critical for comprehensive risk assessment.
However, we also acknowledge the limitations of the radiotherapy variable within the SEER database, as it lacks detailed information on treatment dose, timing, and intent (curative vs. palliative), and is known to be under-reported. 19 Furthermore, since patients must survive long enough to receive radiotherapy, modeling radiotherapy (RT) as a baseline binary variable may introduce bias. Therefore, RT should not be interpreted as a causal factor for poorer prognosis, but rather as a marker of more advanced or aggressive disease. Its inclusion in the LASSO-based model reflects its statistical contribution to predictive accuracy, rather than a direct causal relationship. These considerations underscore the importance of adopting multi-variable modeling strategies that account for complex interactions and data limitations, while also reminding us to exercise caution when interpreting predictors prone to clinical or methodological confounding.
Despite the favorable performance of the multi-algorithm ensemble model developed in this study across multiple evaluation metrics, several limitations should be acknowledged. First, although the SEER database offers broad coverage and strong population representativeness, it lacks certain critical variables, such as molecular biological characteristics, detailed chemotherapy regimens, and treatment response data. The absence of molecular indicators, such as ALK expression levels, gene rearrangements, or other genomic alterations may limit the model's ability to fully capture the underlying biological heterogeneity of ALCL-ALK positive patients. Nonetheless, given the rarity of this lymphoma subtype and the scarcity of large-scale, molecularly annotated datasets, our study fills an important gap by leveraging a nationally representative cohort to identify demographic, clinical, and treatment-related prognostic factors. This may provide useful guidance in settings where molecular testing is not readily available or feasible. Second, this study was designed as a retrospective analysis, which inherently carries the risk of potential selection and information biases, thereby affecting the generalizability of the results. In addition, the model's performance was assessed only through internal validation, without external validation in independent cohorts. Thus, its generalizability remains to be further confirmed. It is also noteworthy that although the SEER database covers approximately 30% of the US population and includes a wide range of geographic regions, White patients accounted for 77.59% of the study population. While this proportion partially reflects the overall demographic structure in the United States, it may also be influenced by differences in disease incidence, healthcare access, and data completeness across racial groups. The resulting racial imbalance may limit the applicability and generalizability of the findings to other populations. To further optimize and validate the proposed survival prediction model, future studies should involve large-scale, multi-center prospective cohorts and integrate multi-dimensional data, including molecular biology and biomarker information, to enhance both clinical utility and predictive accuracy.
Conclusion
In this study, we developed, to our knowledge, the first multi-algorithm ensemble survival prediction model for patients with ALCL-ALK positive based on the SEER database. By systematically evaluating the performance of various algorithmic combinations, the LASSO + CoxBoost model was identified as the optimal approach. This model provides robust support for accurate risk stratification in clinical practice, facilitates individualized treatment decision-making, and enhances the scientific rigor and precision of patient management in ALCL-ALK positive.
Supplemental Material
sj-xlsx-1-dhj-10.1177_20552076251396977 - Supplemental material for Survival prediction of anaplastic large cell lymphoma-anaplastic lymphoma kinase positive: Based on an ensemble machine learning model
Supplemental material, sj-xlsx-1-dhj-10.1177_20552076251396977 for Survival prediction of anaplastic large cell lymphoma-anaplastic lymphoma kinase positive: Based on an ensemble machine learning model by Ruilan Zhong, Changjiu Liang and Limei Li in DIGITAL HEALTH
Supplemental Material
sj-csv-2-dhj-10.1177_20552076251396977 - Supplemental material for Survival prediction of anaplastic large cell lymphoma-anaplastic lymphoma kinase positive: Based on an ensemble machine learning model
Supplemental material, sj-csv-2-dhj-10.1177_20552076251396977 for Survival prediction of anaplastic large cell lymphoma-anaplastic lymphoma kinase positive: Based on an ensemble machine learning model by Ruilan Zhong, Changjiu Liang and Limei Li in DIGITAL HEALTH
Supplemental Material
sj-csv-3-dhj-10.1177_20552076251396977 - Supplemental material for Survival prediction of anaplastic large cell lymphoma-anaplastic lymphoma kinase positive: Based on an ensemble machine learning model
Supplemental material, sj-csv-3-dhj-10.1177_20552076251396977 for Survival prediction of anaplastic large cell lymphoma-anaplastic lymphoma kinase positive: Based on an ensemble machine learning model by Ruilan Zhong, Changjiu Liang and Limei Li in DIGITAL HEALTH
Supplemental Material
sj-xlsx-4-dhj-10.1177_20552076251396977 - Supplemental material for Survival prediction of anaplastic large cell lymphoma-anaplastic lymphoma kinase positive: Based on an ensemble machine learning model
Supplemental material, sj-xlsx-4-dhj-10.1177_20552076251396977 for Survival prediction of anaplastic large cell lymphoma-anaplastic lymphoma kinase positive: Based on an ensemble machine learning model by Ruilan Zhong, Changjiu Liang and Limei Li in DIGITAL HEALTH
Supplemental Material
sj-pdf-5-dhj-10.1177_20552076251396977 - Supplemental material for Survival prediction of anaplastic large cell lymphoma-anaplastic lymphoma kinase positive: Based on an ensemble machine learning model
Supplemental material, sj-pdf-5-dhj-10.1177_20552076251396977 for Survival prediction of anaplastic large cell lymphoma-anaplastic lymphoma kinase positive: Based on an ensemble machine learning model by Ruilan Zhong, Changjiu Liang and Limei Li in DIGITAL HEALTH
Supplemental Material
sj-rar-6-dhj-10.1177_20552076251396977 - Supplemental material for Survival prediction of anaplastic large cell lymphoma-anaplastic lymphoma kinase positive: Based on an ensemble machine learning model
Supplemental material, sj-rar-6-dhj-10.1177_20552076251396977 for Survival prediction of anaplastic large cell lymphoma-anaplastic lymphoma kinase positive: Based on an ensemble machine learning model by Ruilan Zhong, Changjiu Liang and Limei Li in DIGITAL HEALTH
Footnotes
Acknowledgments
We are very grateful to the SEER program for approving the registration and the SEER database.
Ethical considerations
This study was conducted in accordance with the Declaration of Helsinki. The Institutional Ethics Committee of the Second Affiliated Hospital of Hainan Medical University formally reviewed and waived the requirement for ethical approval and informed consent, as the research exclusively used de-identified and publicly available data from the Surveillance, Epidemiology, and End Results (SEER) database. In accordance with institutional policy, the Committee does not assign or issue waiver identification numbers for such exemptions.
Author contributions
RZ performed the data extraction, statistical analysis, literature investigation, and drafted the manuscript. CL performed the statistical analysis and revised the manuscript. LL supervised the literature investigation, statistical analysis, and reviewed the manuscript. All authors read and approved the final manuscript.
Funding
The authors disclosed receipt of the following financial support for the research, authorship, and/or publication of this article: This work was supported by the Hainan Provincial Natural Science Foundation of China (grant number 825RC885).
Declaration of conflicting interests
The authors declared no potential conflicts of interest with respect to the research, authorship, and/or publication of this article.
Data availability statement
The datasets analyzed in this study are publicly available from the Surveillance, Epidemiology, and End Results (SEER) database of the National Cancer Institute (![]() ). Access to the SEER data requires user registration and a data-use agreement. All data are fully de-identified and can be obtained from the SEER database upon request and completion of the registration process.
). Access to the SEER data requires user registration and a data-use agreement. All data are fully de-identified and can be obtained from the SEER database upon request and completion of the registration process.
Supplemental material
Supplemental material for this article is available online.
References
Supplementary Material
Please find the following supplemental material available below.
For Open Access articles published under a Creative Commons License, all supplemental material carries the same license as the article it is associated with.
For non-Open Access articles published, all supplemental material carries a non-exclusive license, and permission requests for re-use of supplemental material or any part of supplemental material shall be sent directly to the copyright owner as specified in the copyright notice associated with the article.