
Abstract
Background
Dihydrouridine (D) is one of the most significant uridine modifications that have a prominent occurrence in eukaryotes. The folding and conformational flexibility of transfer RNA (tRNA) can be attained through this modification.
Objective
The modification also triggers lung cancer in humans. The identification of D sites was carried out through conventional laboratory methods; however, those were costly and time-consuming. The readiness of RNA sequences helps in the identification of D sites through computationally intelligent models. However, the most challenging part is turning these biological sequences into distinct vectors.
Methods
The current research proposed novel feature extraction mechanisms and the identification of D sites in tRNA sequences using ensemble models. The ensemble models were then subjected to evaluation using k-fold cross-validation and independent testing.
Results
The results revealed that the stacking ensemble model outperformed all the ensemble models by revealing 0.98 accuracy, 0.98 specificity, 0.97 sensitivity, and 0.92 Matthews Correlation Coefficient. The proposed model, iDHU-Ensem, was also compared with pre-existing predictors using an independent test. The accuracy scores have shown that the proposed model in this research study performed better than the available predictors.
Conclusion
The current research contributed towards the enhancement of D site identification capabilities through computationally intelligent methods. A web-based server, iDHU-Ensem, was also made available for the researchers at https://taseersuleman-idhu-ensem-idhu-ensem.streamlit.app/.
Introduction
A bio-chemical process in which a primordial RNA is modified to develop functionally mature RNA is known as post-transcriptional modification (PTM). It is known that over 170 different RNA PTMs exist across all kingdoms of life. These modifications play critical roles in gene expression, metabolic responses, RNA folding, RNA localization, and many other diverse biological processes.1,2 These modifications are also implicated in a wide variety of human diseases, including anemia, prostate cancer, tumorigenesis, respiratory chain defects, and intellectual disability.3–7 The uridine modification in transfer RNA (tRNA) is the most prevalent of these PTMs, and it may undergo two of the most important alterations, known as the dihydrouridine (D) modification and the pseudouridine (ψ) modification. Dihydrouridine synthase (Dus), a member of the flavin enzyme family, catalyzes the production of D. The D-loop of tRNA is rich in the modified nucleoside dihydrouridine. D modifications have been linked to an increased risk of developing lung cancer in humans. Moreover, D alterations have been observed in several neurodegenerative diseases, such as Alzheimer's and Huntington's chorea.8,9 D has been found to be involved in the regulation of gene expression in the heart, and its alterations have been linked to cardiovascular diseases. 10 D has been implicated in regulating gene expression during inflammation and its alterations have been linked to various inflammatory diseases. Consequently, the identification of D sites is crucial due to their importance in several biological processes. Traditional lab methods are used to find such modified locations, but these are time-consuming, expensive, and require a great deal of effort. 11 The sequence data helped to enhance the identification of D sites through in silico methods.
The most recent work on the identification of D sites was reported by Zhu et al.
12
In this work, the researcher derived significant features from the tRNA sequences using various feature extraction methods and developed five different machine learning models. The nucleotide chemical property along with the random forest model attained the highest accuracy

3D structure of dihydrouridine.
Xu et al.
14
also built a predictor, iRNAD, to predict D modification from RNA samples. Nucleotide chemical property and nucleotide density were used to encode the samples. A classification model based on the support vector machine (SVM) was utilized, and its efficacy was evaluated using the jackknife test. The suggested model was found to have 96.18%
The present study aimed to identify D sites in tRNA sequences using ensemble methods. Several models were created, and they may be grouped into ensembles through the methods of stacking, bagging, and boosting. Models were trained, tested, and cross-validated using the benchmark dataset acquired from RMBase, which contained tRNA sequences of Homosapiens, Mus musculus, and Saccharomyces cerevisiae. By taking nucleotide location and formation into account, informative features from the sequences were derived. The dimensionality reduction of features was aided by using statistical moments.
17
Independent set testing and k-fold cross-validation were used to evaluate the efficacy of each ensemble model. The

Complete flow diagram of current research methodology.
Materials and methods
Typically, the samples in the benchmark dataset have been verified by experimentation and are thus free of uncertainty. These samples are then used for training prediction models and performance evaluation of those models. The goal is to compile a single, comprehensive, and useful benchmark dataset. Extensive experimental validation studies, such as independent sets and validation tests (K-fold cross-validation and jackknife test), further corroborate the results of the experimentation. Since the conclusion is the result of a synthesis of several separate, unbiased dataset tests, it is crucial that the data are coherent and relevant. The dataset accumulation, model development, and results acquisition span almost 6 months. Directly, no humans or animals were involved in the study. However, experimentally verified tRNA sequences from three different species were used, including Homosapiens, Mus musculus, and Saccharomyces cerevisiae. This section includes the collection of benchmark datasets, feature vector generation, and the development of ensemble models.
Data samples
The data samples for the current study were obtained from RMBase. The acquired samples of tRNA belong to Homosapiens, Mus musculus, and Saccharomyces cerevisiae. It is important to mention here that similar data samples were used by Xu et al., 14 Feng et al., 15 and Duo et al. 18
Positive and negative samples
The tRNA sample length was fixed to 41. This sample size was selected due to the optimal accuracy scores revealed during in-silico experiments. In each of the 41 nucleotide samples that made up the data sets, the “U” was in the middle, at position 21. A typical tRNA sample considered in this research study can be expressed as mentioned in equation (1):
Feature generation and representation from RNA samples
Because computer models cannot directly accept and analyze biological sequences, one of the most common procedures is to encode RNA sequences into fixed-length feature vectors.19,20 These feature vectors are made up of numeric values that hold information about the RNA sequences’ attributes. The present work focused on the method for generating features based on the nucleotide's formation and position within a tRNA sequence. It was first suggested by Chou in their proposition of pseudo amino acid composition (PseAAC). That proposed technique was quickly being recognized as one of the most widely used and productive solutions to the issue of sequence pattern loss.
21
In the present work, pseudo-K-tuple nucleotide composition for feature vector generation was accomplished in a manner like PseAAC.22,23 The nucleotide position and composition were used to create feature vectors for this study. Using the nucleotide formulation,


Statistical moments computation
Moments are a statistical tool that statisticians and data analysts use to analyze a wide variety of data distributions.24,25 The raw, Hahn and central moments were determined and then incorporated into features for dimensionality reduction. The reason for the selection of these moments was the unique properties associated with each moment class. The scale and location class were associated with the Hahn moment. However, central moments depend on the scale and vicinity.
26
The mean, variance, and asymmetry of the dataset were computed by employing raw and central moments. On the other hand, Hahn moments were determined using Hahn polynomials as a reference to preserve sequence order. According to equation (4), a matrix,


Position Relative Incidence Matrix (PRIM) determination
The purpose of this research was to improve the model's prognostic accuracy. This meant that a complete model for feature extraction was required to achieve the goal. Nucleotide base indexing within an RNA sequence can be easily formulated mathematically which helps in extracting statistical information. Keeping in view of this property, position relative incidence matrix (PRIM) was designed to obtain the count of each nucleotide's position with respect to others, that is, What would be the relative position of “A,” “G,” “U,” and “C” with “A” which occurred at position 2? The matrix,

Besides single nucleotide position, relativity paired (dual or tripartite) nucleotide combinations were also considered. A matrix,


Reverse Position Relative Indices Matrix (RPRIM) formation
The primary objective of determining feature vectors is to collect as much valuable information as possible for the development of a robust prediction model. The availability of biological sequences has opened infinite possibilities for applying various mathematical and statistical techniques, which have helped in getting discrete information. The extracted information is fed into the artificial intelligence models, which help in the quick analysis and prediction of critical sites within sequences. It was observed that reversing the sequence can help obtain more obscured information from the sequences.30,31 Three reverse position relative incidence matrices (RPRIM) were created on a similar pattern of PRIM. A general form of these matrices is shown in equation (12) in which, R
N→j
, represents any nucleotide,

Accumulative Absolute Position Incidence Vector (AAPIV)
The accumulative absolute position incidence vector (AAPIV)
32
was formulated to deliver the accumulated information that is related to the location in which each individual nucleotide base is found. These vectors returned the total count of each nucleotide (either single or in combination) within each sequence. Three AAPIV are named as


Frequency Vector (FV) determination
Attribute generation relies heavily on being able to extract positional and compositional information from the sequence. The frequency count of each nucleotide inside a sequence may be used to infer information about the sequence's pattern.33,34 To keep track of how many times each nucleotide or nucleotide pair appears in the sequence, we computed a frequency vector, denoted by, Ғ, in which each frequency count of the nth nucleotide is stored in

Formulation of feature vector
Feature vectors for the AAPIV, FV,
Ensemble models development
For the current research study, D sites and non-D sites were classified using ensemble methods. Increased accuracy in predictions led to the adoption of ensemble approaches over more traditional machine learning models.35,36 The ensemble procedures were divided into two major categories, that is, parallel and sequential. Classifiers that employ bagging, like random forest, use bootstrap aggregation to minimize variance by repeating the same procedure with random subsamples of the dataset. On the other hand, sequential ensemble methods like boosting allow the model to be improved upon by using large weights in comparison to earlier models. For predicting D sites, the current research made use of stacking, bagging, and boosting ensemble techniques. The ensemble models deployed in the research study were flexible and worked perfectly for identification purposes. Moreover, the model has been fine-tuned to alleviate aleatoric uncertainties as the meticulously collected dataset only contains verified biological sequences with tolerable homology. The overfitting and underfitting uncertainties were also removed through hyperparameter optimization of the models. Experiment and design specifics for these ensemble approaches were provided in the following sections.
Bagging ensemble
Bagging is a technique wherein the trained samples are split into smaller subsamples that are then used to update the base models. Subsampling was carried out by using a model based on row sampling with replacement. Test data were checked using the trained models, and a consensus was reached on a prediction method. The four bagging models that were developed and trained for this investigation were: bagging classifier, random forest, extra tree classifier, and decision tree classifier. Figure 3 is a schematic of a typical bagging ensemble model. The model's hyperparameter optimization was considered for bagging ensemble models’ development. The random forest was tuned by considering the number of estimators (n_estimators = 100), tree depth (max_depth = 80), max_features as “Auto,” the minimum split of data samples (min_samples_split = 50), and min_samples_leaf to “10.” Similarly, several parameters were considered for tuning the extra tree classifier, such as the number of estimators and tree depth. The number of estimators (n_estimators) for the extra tree classifier was set to 100. Similarly, the max_depth was set to “40.” Features selection was made “Auto” in this classifier. Similarly, the bootstrap value was set to “Bool.” For parameter optimization of the decision tree classifier, the splitter, max_depth, min_samples_leaf, min_weight_fraction_leaf, was set to “50,” “10,” “None,” and “0.2,” respectively. The bagging classifier was hyper tuned by setting the base_estimator as “Decision tree classifier” and the number of estimators (n_estimators) was set to “100.” The oob_score was set to “True,” and the random state was set as “0.”

Bagging ensemble model.
Boosting ensemble methods development
The boosting ensemble technique uses an optimization strategy that considers the results of previously run models. It does the differentiable loss in a sequential fashion. Several boosting ensemble techniques, including gradient boosting, histogram-based gradient boosting (HGB), Adaboost, and XGB, were employed for training in the present investigation. An example of the boosting ensemble model used in this research is shown in Figure 4. The XGB model was hyper-tuned by considering parameters such as maximum iteration (max_iter), depth of this boosting algorithm (max_depth), and the random_state, which was set to “0.” Similarly, the Adaboost was tuned by considering n_estimators, random_state, and min_weight_fraction_leaf, which were set as “100,” “None,” and “0.2,” respectively. The “Gradient Boost Classifier” was selected as a base estimator. Moreover, max_iter, max_depth, and warm_start were set to “300,” “50,” and “True” for tuning the HGB classifier, respectively. For optimizing the gradient boost algorithm, the learning rate, number of estimators, and criterion were selected. The learning rate was set to “0.2,” while the number of estimators (n_estimators) and criterion was set to “150” and “mse,” respectively.

Boosting ensemble model.
Stacking ensemble model
Stacking typically considers several diverse weak classifiers known as base models. The whole dataset is divided into sub-samples and then base models are being trained in parallel. The meta-learner is then trained to provide a prediction based on the individual weak learners’ predictions. 37 As can be seen in Figure 5, the current research made use of a variety of different classification methods, including a grading boost classifier as a meta classifier on top of artificial neural network, k-nearest neighbor, SVM, and multi-layer perceptron that were used as base classifiers. Each of the basic models was trained using the training data and then used to provide a prediction probability, P. Predictions were made on the test data using the output from the meta classifier, which had been trained using the outputs of the individual base models. Table 1 lists all classifiers along with their hyperparameter settings for optimal performance.

Stacking ensemble model deployed for this study.
Hyper-parameters tuning of the stacking model's classifiers.

ANN: artificial neural network; KNN: k-nearest neighbor; SVM: support vector machine.
Evaluation metrics
In this research, four metrics, 
Test methods
The ensemble models were assessed through well-known testing methods, that is, independent testing and 10-fold cross-validation.42,43 It is worth mentioning that separate test samples were used from training samples in the independent set test. While cross-validation involved splitting the data into subsets, also called folds. Only a single fold was reserved for validation purposes, while the others were utilized in model training. To ensure that each fold had its chance to serve as a validation fold exactly once, the fold rotation was performed.
Results
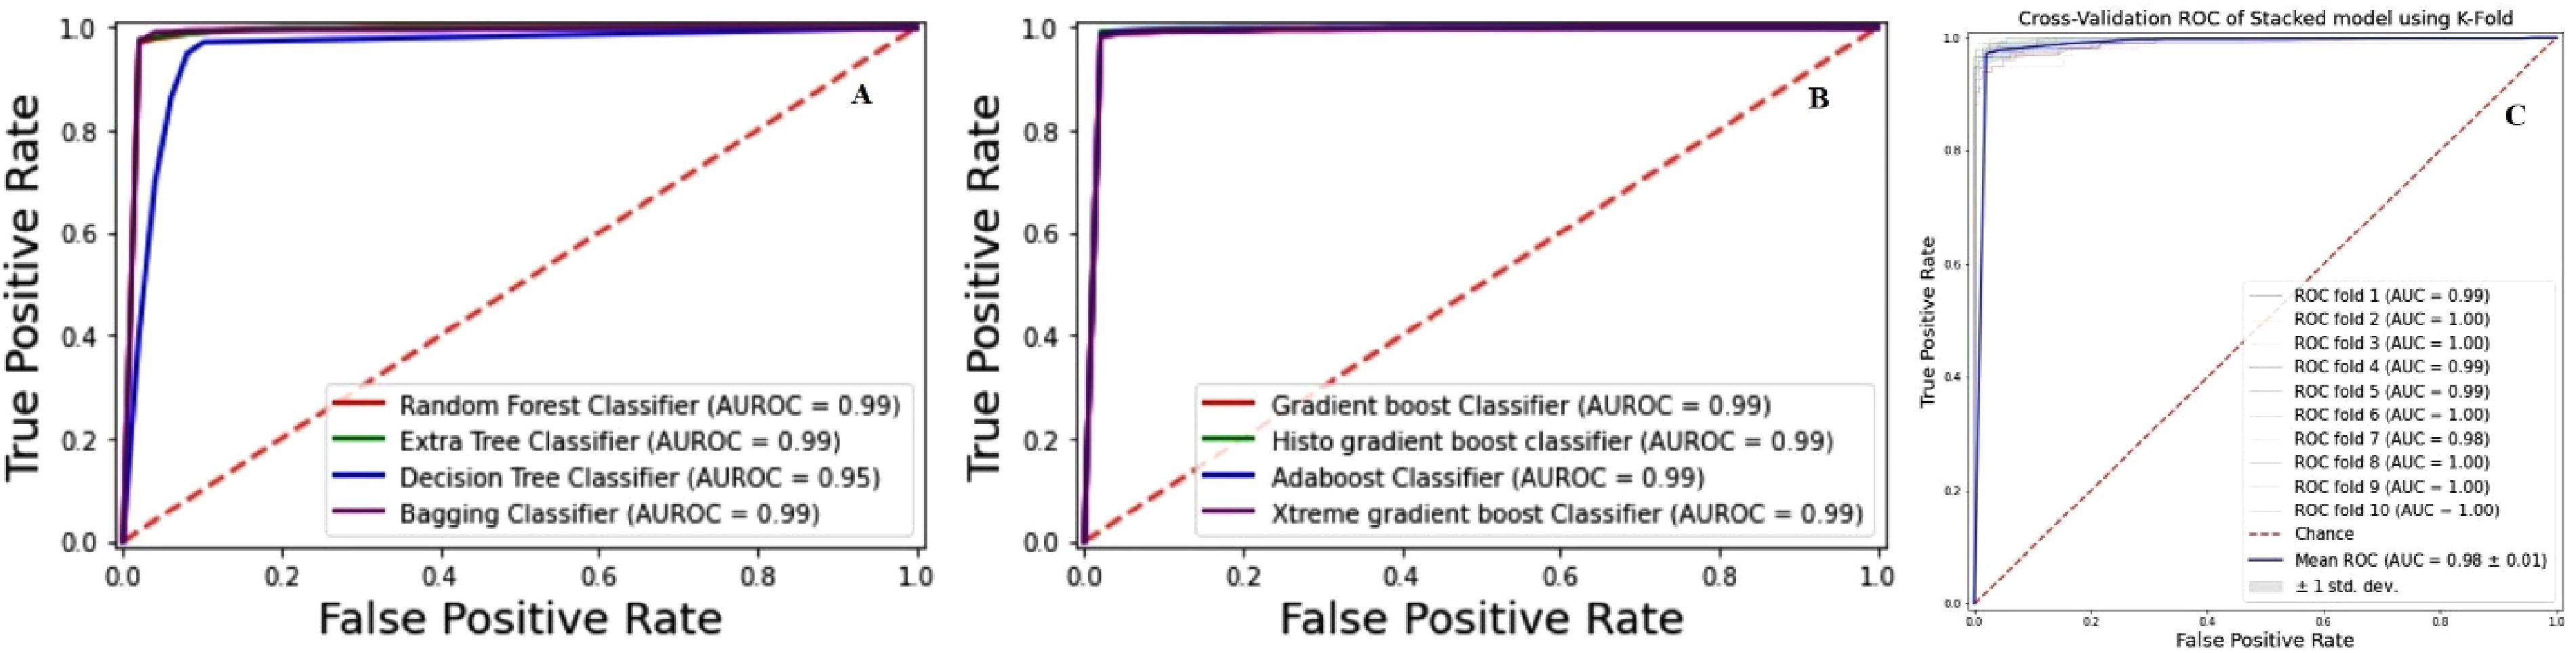
The independent testing result is mentioned in Table 2. It can be observed from the Table 2 that the stacking ensemble model revealed the highest score in

Independent testing receiver operating characteristics (ROC) curves (A). Bagging ensemble models ROC (B). Boosting ensemble models ROC (C). Stacking model ROC.
A 10-fold cross-validation receiver operating characteristics (ROC) curves (A). Bagging ensemble models (B). Boosting ensemble models ROC (C). Stacking model ROC.
Independent testing result of bagging, boosting, and stacking ensemble models.

K-fold cross-validation scores of

ANN: artificial neural network; KNN: k-nearest neighbor; SVM: support vector machine.
Critical values (p values) exhibiting the significance of ensemble models in Z-test, resampled paired t-test, and McNemar's test.

Discussion
The rapid and precise prediction of PTM sites has been made feasible by the availability of sequencing data and sophisticated computer methods. The accurate identification of such modified sites helps in the diagnosis of various PTM-linked diseases such as breast cancer, 46 acute infantile liver failure, 47 asthma, 48 diabetes, 49 and leukemia. 50 For the current research, independent testing and cross-validation were used to assess the performance of the model in making predictions. It is worth noting that the reliability and validity of the tests were independently evaluated using a data set that was kept completely distinct from the rest. But the whole dataset was utilized for the cross-validation. The model's effectiveness was evaluated using a variety of accuracy metrics. A violin plot 51 uses density curves to visually illustrate how numerical data is distributed over one or more groups. White dots may be used to indicate the median, black bars can show the interquartile range, and dark lines can show the ranges of the lowest and highest values around the bar. Figure 8 is a violin plot that shows the accuracy values found in each fold for the best stacking, bagging, and boosting ensemble models. The output of computationally intelligent models can be observed in detail through powerful visualization. Methods of boundary visualization have been used to show how well each ensemble model can predict and analyze.
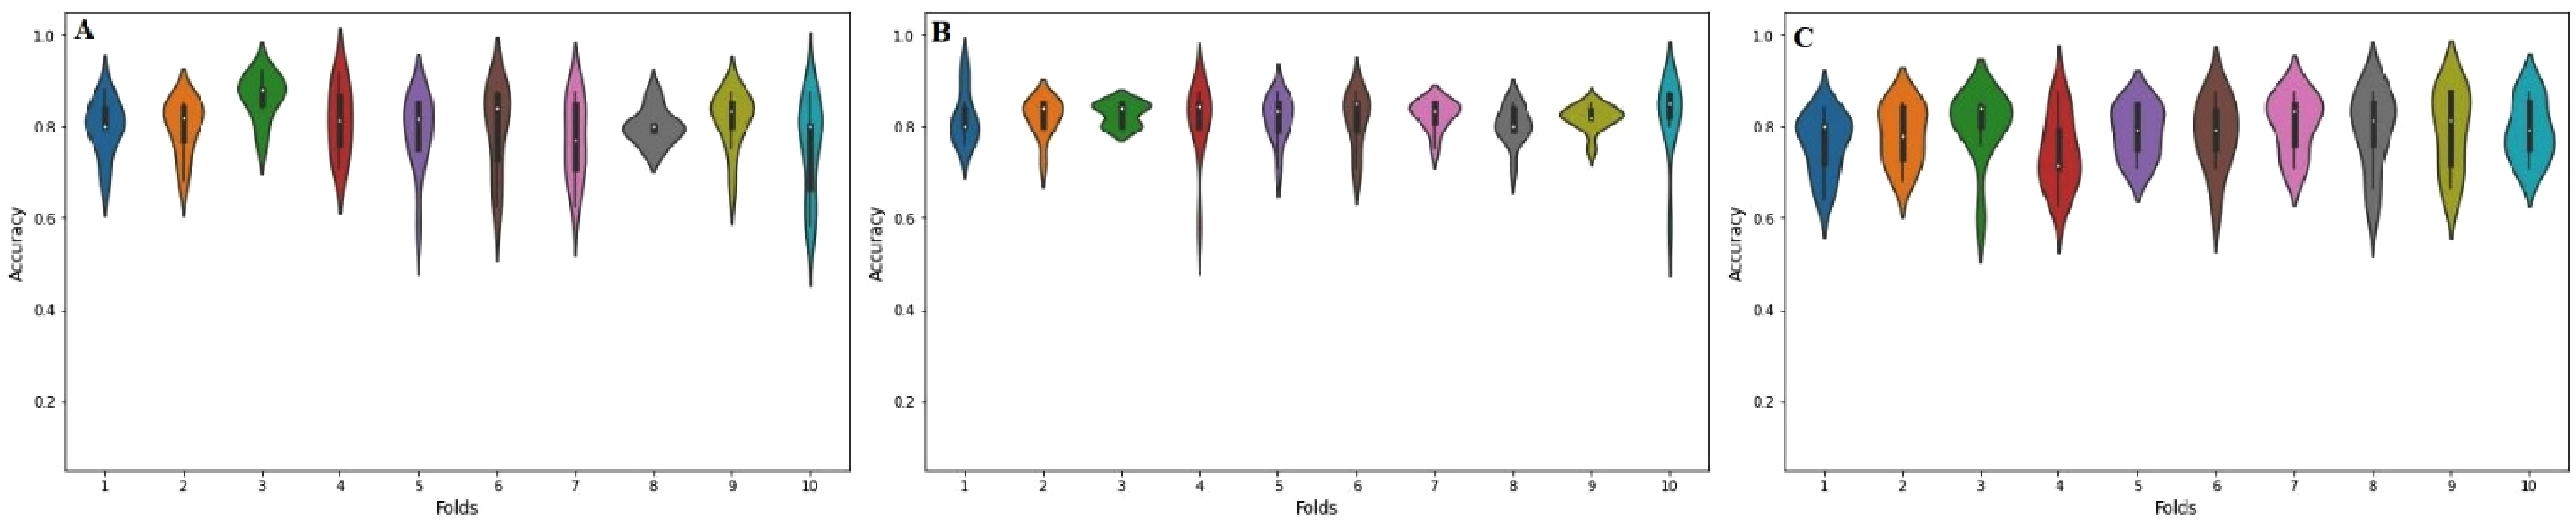
Violin plots of 10-fold cross-validation accuracy (Acc) metric results for (A) bagging ensemble (B) boosting ensemble and (C) stacking ensemble.
Figure 9 displays the decision surface plots of the classification algorithms used in this study. The decision surface plots helped in visualizing the prediction performance of an ensemble model across the input feature space. When a specific classifier has been trained using a dataset, it defines a set of hyperplanes that are used to separate data points of one class from other. These can be also called as decision boundaries as it helps in depicting data points to be separately placed across boundaries of different classes. The first step includes the training of data being used to fine-tune the model. The trained model was then used to make predictions for a grid of values over the input domain. It can be observed that extra-tree classifier outperformed in exhibiting true classification boundaries.

Boundary visualization of ensemble models used in this study as follows: (A) Input data,
Comparison with pre-existing models
The proposed model, iDHU-Ensem, was built on the best performing stacking ensemble model and compared with pre-existing predictors to assess the model's efficacy on the independent datasets. iDHU-Ensem was compared with the available predictors such as D-pred,
15
iRNAD,
14
and the RF-based model developed by Zhu et al.
12
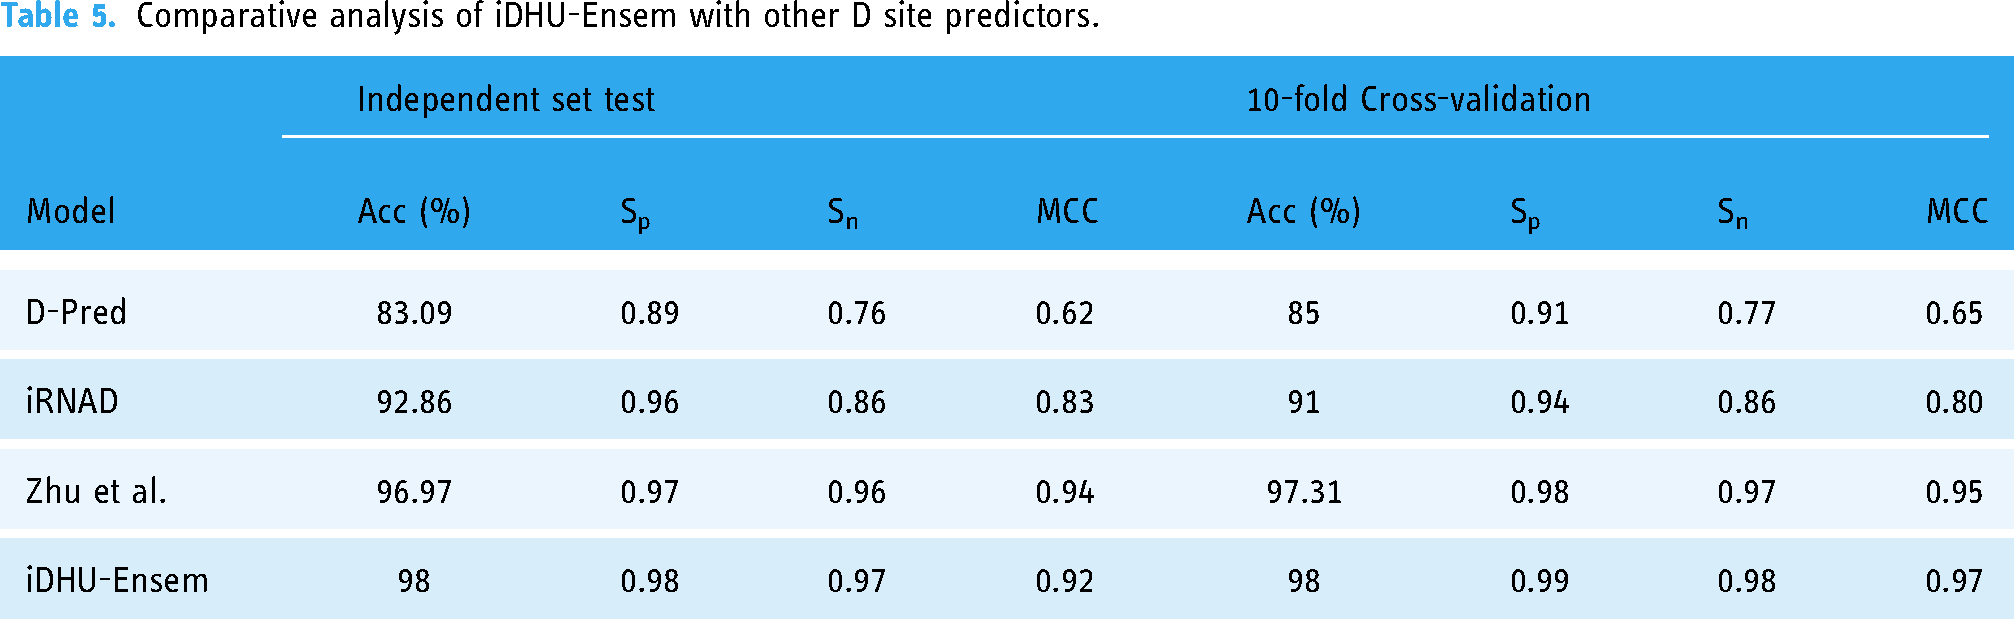
The D-pred performs prediction and analysis of RNA sequences derived from Saccharomyces cerevisiae through an SVM-based ensemble model. Moreover, iRNAD also utilized SVM for classification of D sites and non-D sites using data samples of Homosapiens, Mus musculus, Escherichia coli, Saccharomyces cerevisiae, and Drosophila melanogaster. Similarly, Zhu et al. employed RF and SVM for classifying D sites. The independent testing results revealed that the proposed model outperformed the existing predictors in accuracy. Separate 207 positive and 280 negative samples were used for independent testing. Table 5 presents the result of independent testing and 10-fold cross validation which shows that iDHU-Ensem outperformed the other available predictors. The iRNAD and D-Pred and revealed 92.86% and 83.09% accuracy, respectively, while the Zu et al. model revealed a 96.97% accuracy score. However, the proposed model outperformed in accuracy metrics, revealing an accuracy score of 98%. The proposed model also achieved optimal scores in Sp and Sn revealing 0.98 and 0.97 scores, respectively. Similarly, the iDHU-Ensem revealed a 98% accuracy score followed by D-pred, IRNAD and Zhu et al. predictor in 10-fold cross-validation. Similarly, the MCC value exhibited by D-pred was very low as compared to all predicting models. However, the predictor proposed by Zhu et al. exhibits better MCC. The reason can be the selection of samples in the independent set. However, with the most rigorous test, 10-fold cross-validation, the results revealed that iDHU-Ensem achieved optimal scores in

Visualization of comparative analysis of iDHU-Ensem with D-Pred, iRNAD, and Predictor by Zhu et al. in terms of
Comparative analysis of iDHU-Ensem with other D site predictors.
Limitations of current research
The limitation of the current research study is the limited availability of experimentally proven tRNA sequences. Since no hypothetical samples were created, the available concrete samples were used in the processes of feature extraction, computational model development, training, and testing of models. Moreover, the tRNA sequences belonging to three species, such as Homosapiens, Mus musculus, and Saccharomyces cerevisiae, were only available from the verified databases. Therefore, only these species were considered for the identification of D sites in tRNA sequences.
Webserver availability
The predictor was made available by deploying a web-based server, iDHU-Ensem. The webserver is available at https://taseersuleman-idhu-ensem-idhu-ensem.streamlit.app/. The free availability of the predictor facilitates rapid and straightforward computational analysis for the identification of dihydrouridine sites.
Conclusion
This work employed an ensemble approach to identify dihydrouridine (D) sites, one of the most common PTMs, in RNA sequences. The D modification plays a pivotal part in the stability of RNA. The researchers also discovered its abundance in cancerous cells. The current research employed an innovative method for extracting features from RNA sequences that make use of the positional and compositional characteristics of individual nucleotides. The dimensionality reduction of the obtained features was carried out using statistical moments. Multiple ensemble models using stacking, bagging, and boosting were trained using the final feature set. Independent testing and cross-validation were then used to assess the efficacy of the trained models. Accuracy, specificity, sensitivity, and Matthew's correlation coefficient were used to assess the models. The best-performing ensemble model was then used to construct the final proposed model, iDHU-Ensem. The proposed model's performance in classifying D sites with non-D sites was also compared with the pre-existing models. However, iDHU-Ensem was found to have the greatest score across the board for accuracy measures. Therefore, it can be stated that iDHU-Ensem optimized the identification of D sites.
Supplemental Material
sj-fasta-2-dhj-10.1177_20552076231165963 - Supplemental material for iDHU-Ensem: Identification of dihydrouridine sites through ensemble learning models
Supplemental material, sj-fasta-2-dhj-10.1177_20552076231165963 for iDHU-Ensem: Identification of dihydrouridine sites through ensemble learning models by Muhammad Taseer Suleman, Fahad Alturise and Tamim Alkhalifah, Yaser Daanial Khan in Digital Health
Supplemental Material
sj-fasta-3-dhj-10.1177_20552076231165963 - Supplemental material for iDHU-Ensem: Identification of dihydrouridine sites through ensemble learning models
Supplemental material, sj-fasta-3-dhj-10.1177_20552076231165963 for iDHU-Ensem: Identification of dihydrouridine sites through ensemble learning models by Muhammad Taseer Suleman, Fahad Alturise and Tamim Alkhalifah, Yaser Daanial Khan in Digital Health
Footnotes
Contributorship
The manuscript was prepared by Muhammad Taseer Suleman and Fahad Alturise. The implementation of this study is done by Muhammad Taseer Suleman and Yaser Daanial Khan. The manuscript was reviewed and supervised by Yaser Daanial Khan and Tamim Alkhalifah. All authors contributed to the text in the manuscript and reviewed and approved the final version of the manuscript.
Declaration of Conflicting Interests
The authors declared no potential conflicts of interest with respect to the research, authorship, and/or publication of this article.
Funding
The authors received no financial support for the research, authorship, and/or publication of this article.
Guarantor
MTS
Supplemental material
Supplemental material for this article is available online.
References
Supplementary Material
Please find the following supplemental material available below.
For Open Access articles published under a Creative Commons License, all supplemental material carries the same license as the article it is associated with.
For non-Open Access articles published, all supplemental material carries a non-exclusive license, and permission requests for re-use of supplemental material or any part of supplemental material shall be sent directly to the copyright owner as specified in the copyright notice associated with the article.