
Abstract
Background
In the clinical assessment of chronic insomnia, modern medicine encounters challenges in the widespread adoption of objective assessment methods, such as polysomnography, due to their high costs and complex operational requirements. Therefore, it was crucial to implement objective and varied methods to accurately assess chronic insomnia.
Methods
Clinical information was collected from 594 patients diagnosed with chronic insomnia. Their facial and tongue features, as observed through traditional Chinese medicine, were recorded using the tongue face diagnosis analysis-1 instrument and analyzed with the tongue/face diagnosis analysis system. Stepwise-regression analysis, principal component analysis, and zero-inflated negative binomial (ZINB) regression were employed for variable screening. Ultimately, the classification model for assessing the severity of chronic insomnia was constructed using six supervised machine learning methods: decision trees, neural networks, random forests, support vector machines, logistic regression, and naive Bayes. The model was evaluated using sensitivity, specificity, F1 score, precision, and accuracy. Visualization was conducted with the Shapley Additive exPlanations (SHAP) explainer and decision curve analysis (DCA), and it was finally calibrated using Platt scaling.
Results
A comprehensive evaluation revealed that model 4 exhibited superior performance. This model integrated baseline data, sleep symptoms, and facial features, achieving its highest receiver operating characteristic curve value of 0.822. Furthermore, DCA demonstrated that model 4 exhibited significant clinical utility. The SHAP illustrated that among the variables exerting the greatest influence on insomnia, the effects of Ch-Y and CH-G were notably prominent, compared to the conventional PSQI and SAS, followed by Ch-R. Finally, the results of Platt scaling calibration indicated that model 4 exhibited significant improvement post-calibration, with the predicted probabilities closely aligning with the actual probabilities of occurrence.
Conclusions
This study emphasized convenient and non-invasive diagnostic methods for investigating specific facial and tongue features associated with chronic insomnia. A classification model for chronic insomnia has been developed through the integration of multiple features, enabling a more accurate assessment of insomnia severity and facilitating advancements in therapeutic interventions.
Introduction
Socio-economic factors, modern lifestyles, work-related pressures, and living environments have led to numerous adverse effects on human sleep. Consequently, insomnia must be recognized as a significant public health issue, 1 as it has been closely linked to cardiovascular and metabolic diseases.2,3 Chronic insomnia was characterized by insomnia symptoms occurring at least three times per week for a minimum of three months. 4 However, the widespread adoption of objective assessment methods, such as polysomnography, was hindered by their high costs and complexities. 5 As a result, self-reported symptoms—including difficulties in falling asleep or maintaining sleep, daytime fatigue, and related scales—remain the predominant means of evaluating chronic insomnia. In light of this, it was imperative to implement accurate assessments of chronic insomnia utilizing both objective and diverse methodologies.6,7
Traditional Chinese medicine (TCM) has been studying insomnia for thousands of years.8–11 However, much of the existing research on chronic insomnia has predominantly focused on behavioral factors and somatic symptom presentations. Therefore, by identifying the specific features of chronic insomnia from the perspective of simple, convenient, and cost-effective TCM diagnostics, and by assessing insomnia in a precise and prospective manner, this approach could provide an opportunity for timely clinical interventions. The origins of TCM observation diagnosis can be traced back to the Spring and Autumn Period and the Warring States Period, with color diagnosis emerging as the most widely practiced method and serving as a crucial indicator of diagnosis in TCM. With the advancement of modern interdisciplinary research and informatics, precision diagnostic equipment has facilitated the establishment of visual assessment data derived from visual assessment experiments, demonstrating its objectivity and reliability in the fields of color science and color engineering.12,13 Quantitative analyses of tongue and facial coloration have been ongoing for an extended period.14–16 Variations in diseases and health status, along with changes in blood circulation and emotional states, could induce subtle color alterations in the tongue and facial images that were often imperceptible to the naked eye.17,18 This phenomenon was encapsulated in the “Pathological complexion” theory, which posited that abnormal tongue or skin color could indicate internal disorders in TCM.
Supervised machine learning has established applications in healthcare. 19 Common methods included decision trees, neural networks, random forests, SVM, logistic regression, and naive Bayes; these offered significant advantages in processing quantitative features of the tongue and facial, classifying insomnia severity, and enhancing models' interpretability. Consequently, this study constructed classification models to assess the severity of chronic insomnia using the aforementioned supervised machine learning methods. This approach provided a novel perspective for exploring the relationship between modernized observation of digital information, grounded in TCM theories, and chronic insomnia, thereby inspiring new solutions to public health challenges.
Material and methods
Study population
The participants in this study comprised 1524 chronic insomnia patients who attended the Department of Psychiatry at Shanghai Municipal Hospital of TCM and the Department of Rehabilitation at Xiangshan TCM Hospital from January 2021 to December 2022 in Shanghai, China. Their basic information and clinical consultation records were collected, and the participants’ insomnia, as well as their psychological and emotional states, were assessed using a self-assessment scale system. The study was conducted in accordance with the guidelines of the Declaration of Helsinki and received approval from the Ethics Committees of Shanghai Municipal Hospital of TCM (batch number: 2021SHL-KY-11-01) and Xiangshan TCM Hospital (batch number: XSEC2021001). All participants provided written informed consent, which was also approved by the Ethics Committee.
Insomnia severity assessment
The insomnia severity index (ISI) is a validated screening instrument designed to assess the severity of insomnia symptoms. It comprises seven items, with a higher total score (ranging from 0 to 28) indicating more severe insomnia. 20 The items assess the following aspects separately: (1) the severity of sleep onset, sleep maintenance, and early morning awakenings; (2) the satisfaction level with the current sleep pattern; (3) the degree to which sleep difficulties interfere with daytime functioning; (4) the noticeability of sleep problems by others; (5) the distress caused by these sleep difficulties. Higher scores correlate with greater insomnia severity.21,22 The scoring system is categorized as follows: <15 indicates mild insomnia; 15–21 denotes moderate insomnia; and 22–28 signifies severe insomnia. 23 Moderate and severe insomnia were analyzed as one group (moderate/severe) in this study. Additionally, the PSQI was administered to all participants to evaluate their sleep quality. The total PSQI score ranges from 0 to 21, with a higher score indicating poorer sleep quality. 24 The Self-Rating Depression Scale (SDS) and the Self-Rating Anxiety Scale (SAS) were also utilized to assess the participants’ mental and emotional states. Higher scores on the SDS or SAS suggest that the individual experiences greater levels of depression or anxiety.25,26
Selection criteria
The inclusion criteria for this study were patients who presented to the clinic with insomnia symptoms occurring at least three times per week and persisting for a minimum of three months. The exclusion criteria included: (1) pregnant or breastfeeding women; (2) individuals with serious primary diseases affecting the circulatory, respiratory, digestive, urinary and endocrine systems; (3) individuals with breathing-related sleep disorders, restless legs syndrome, periodic limb movement disorder, environmental sleep difficulties, or sleep deprivation syndrome; (4) individuals with severe mental disorders, alcoholism, or drug abuse. Additionally, to mitigate the potential influence of braces or dentures on tongue characteristics, individuals wearing these appliances were excluded from the study. Similarly, participants who wore facial makeup were also excluded. Following the enrollment process (Figure 1), a total of 594 patients with chronic insomnia were included in the study. The subjects were categorized into two groups based on the ISI: mild insomnia group (n = 240), moderate-to-severe insomnia group (n = 354).

Flow chart for enrollment of study participants.
TCM observation information collection and analysis
The facial regions selected for this study were based on the principles outlined in the Huangdi Neijing (the Yellow Emperor's Canon of Internal Medicine), which was first published over 2000 years ago.27–29 The representative facial areas chosen for collection included the forehead, the center of the eyebrows, the tip of the nose, the zygomas, the cheeks, and the jaw. 30 Specifically, the forehead was located near the intersection of the frontal hairline and the bisector of the line connecting the eyebrows to the anterior midline. The center of the eyebrows was positioned at the intersection of the line connecting the medial sides of the eyebrows with the anterior midline. The tip of the nose was situated at the point where the anterior midline intersects the nose. The left zygoma was found at the intersection of the vertical line extending from the left lateral canthus of the eye and the convexity of the left cheekbone, whereas the right zygoma corresponded to the vertical line from the right lateral canthus of the eye that intersects the convexity of the right cheekbone. The left cheek was located at the midpoint of the line connecting the inner and outer canthus of the left eye with the tip of the nose, whereas the right cheek was found at the midpoint of the line connecting the inner and outer canthus of the right eye with the tip of the nose. Finally, the jaw was positioned at the intersection of the anterior midline with the lower jaw. Additionally, images of the tongue were collected from both the sublingual veins (SV) and the surfaces of the tongue.
Researchers, following professional acquisition training from the Intelligent Processing Laboratory of TCM Diagnostic Information at Shanghai University of TCM, employed the self-developed Tongue Face Diagnosis Analysis-1 Instrument (TFDA-1) tongue and face diagnosis instrument (Equipment number ER17005-201810-41/50) to acquire tongue and facial images between 8:00 and 11:00 a.m. The TFDA-1, a registered medical device, was based on the National Key Research and Development Program for the Modernization of Chinese Medicine Research Special Project (No. 2017YFC1703301) and had been widely utilized for clinical collection of tongue and face images to assess organism status.31–33 Its D50 light source provided high stability and excellent color reproduction. Notably, the TFDA-1 was equipped with a lower jaw rest designed to hold the lower jaw in place, ensuring a standardized distance between the tongue or face and the lens, thereby minimizing distortion of the digital image in earlier studies. 34 Prior to image acquisition, the instrument was disinfected using alcohol-soaked cotton balls, and the researchers ensured that participants maintained neutral facial expressions, arrived with empty stomachs, and had clean mouths and tongues free of foreign objects or discoloration. Participants were instructed to sit comfortably, resting their lower jaw on the mandibular support. Initially, they closed their eyes slightly to align their faces for image capture. They then opened their mouths and extended their tongues to fully expose the tongue surface for imaging. Finally, participants were asked to gently place the tip of their tongues against the maxillary and incisal boundaries, thereby completely exposing the SV for collection.
This study employs the tongue/face diagnosis analysis system (TDAS/FDAS), developed by the Smart Diagnosis Technology Research Team at Shanghai University of TCM, to extract color features from both the tongue and face.31–33 For facial analysis, the system consistently captures the color domain of facial points, facilitating the acquisition of color values from six distinct regions of the face. Specifically, the color values for the zygomas and cheeks were derived from the averages of their respective left and right sides. The forehead was denoted as “Fh,” the center of the eyebrows as “Eb,” the tip of the nose as “Ns,” the zygomas as “Zg,” the cheeks as “Ch,” and the jaw as “Ja.” In terms of tongue analysis, the system automatically extracts relevant tongue components—separating the tongue body and tongue coating on the surface, as well as distinguishing between the SV and other structures on the ventral surface—and calculates their corresponding color values. The face and tongue color indexes were derived from RGB color space, Lab color space, and YCrCb color space, with the prefix “SV-” indicating sublingual veins, “TB-” indicating tongue body, and “TC-” indicating tongue coating (Figure 2).

Process of collecting and analyzing the information of TCM observation.
Statistical analysis
This study employed IBM SPSS version 25.0 statistical software for data analysis. Non-continuous data were reported as frequencies and percentages. Continuous data with a normal distribution were presented as means and standard deviations (SD), while non-normally distributed continuous data were described using medians and interquartile ranges (IQR). Group comparisons were conducted using the chi-square test for categorical variables and the Mann–Whitney U test for continuous variables, with adjustments made using the Bonferroni correction to account for multiple testing. A p-value of less than 0.05 (two-tailed) was deemed statistically significant for the comparisons.
Stepwise-regression analysis
Stepwise regression, a method for variable selection, falls under the category of multiple linear regression models. Its general form can be represented as follows:

where Y denotes the dependent variable,
Stepwise methods begin with the null model or with certain variables to enhance the model's performance, by selecting or eliminating a single variable at each step.
35
The dynamic evolution of stepwise regression can be formulated as

Where S is the set of independent variables that are updated at each step based on the results of the tests conducted. In this study, we utilized stepwise regression analysis to automatically identify tongue sign characteristics that significantly influence insomnia severity, and employed F-tests to validate the effectiveness of this stepwise regression model.
Principal component analysis
To filter the core indicators from the extensive color information, this study employed principal component analysis (PCA) for feature dimensionality reduction.
36
An orthogonal transformation was utilized to convert d-dimensional data into d′-dimensional data (where d′ < d), aiming to retain as much information as possible. It is important to note that there exists a certain linear dependence among the d-dimensional data, whereas the d′-dimensional data is characterized by a lack of such linear dependence.
37
PCA decomposes the total variance of the m original indicators into the sum of the variances of m uncorrelated composite indicators, thereby maximizing the variance of the first principal component, denoted as

The larger this ratio, the greater the ability of this indicator to synthesize the original indicators.
The contribution rate of the i-th principal component
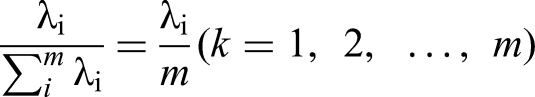
The cumulative contribution rate of the first k principal components is expressed as

The retention of principal components is guided by the following principles: (1) The number of principal components is determined using the scree plot. If the inflection point of the scree plot occurs at the K-th principal component, the first k principal components are retained; (2) The first k principal components are retained when the cumulative contribution rate exceeds 60%.
The factor loading, which represents the correlation coefficient between the i-th principal component

By extracting the rotated component matrix, we obtain the absolute value of the loading coefficient between the common factor (principal component) and the original face color indicator. A larger absolute value indicates that the corresponding face color indicator is more representative of the original data features.
Zero-inflated negative binomial (ZINB) regression model
This study utilized a ZINB regression model to explore the correlation between patients’ nighttime sleep patterns and ISI scores, aiming to identify key clinical indicators of sleep conditions. Zero-inflated models integrate a model for excess zeros with a regression model for count data, accounting for potential zero values38,39 (ISI scores ranging from 0 to 28). The ZINB regression is particularly suitable for analyzing count variables with a high number of zero counts, where the excess zeros were assumed to arise from a different process than the count values and are modeled separately. 40
Classification by supervised machine learning approach
This study utilized several common supervised machine learning algorithms, including decision trees, neural networks, random forests, SVM, logistic regression, and naive Bayes, to develop classification models for insomnia severity. Mild insomnia, defined as an ISI score of less than 15, served as the reference category for categorizing the results, whereas an ISI score greater than 15 was designated as the positive category for classification purposes. Decision trees are traditional algorithms used for classification and regression tasks; they divide data based on training data and feature attributes for effective classification or prediction.41,42 Neural networks emulate human brain networks and can tackle various machine learning challenges, including classification and regression.43,44 Random forests, which are ensemble learning algorithms based on decision trees, construct multiple trees and merge their results, with randomness helping to prevent overfitting.45,46 Support vector machines (SVMs), used for both classification and regression, project data into a high-dimensional space to identify optimal segmentation planes for classification or regression.47,48 Logistic regression analysis estimates the probability of a specific output class based on input variables, 49 whereas naive Bayes classification, grounded in Bayes’ theorem, classifies samples by calculating the probability of a sample belonging to a particular class. 50
This study represents AI-driven digital TCM research focused on clinical prediction modeling. The R programming language was employed for modeling purposes. To address missing values and outliers, features with more than 20% missing values were excluded, along with 16 samples exhibiting extreme bias. The continuous variables in the remaining samples underwent Z-score normalization, and the final dataset was randomly divided into training and test sets in a 7:3 ratio. For each model, a set of hyperparameters that maximized the area under the receiver operating characteristic (ROC) curve (AUC) for the training set was selected using a Bayesian optimizer, ensuring optimal performance and effective prediction on the test set. All models were evaluated using 10-fold cross-validation to enhance robustness and reliability. The performance of the model was demonstrated using a confusion matrix. It was evaluated through various metrics, including accuracy, sensitivity (recall), specificity, F1 score, precision, AUC, and was presented in the radar plot format. The formulas for sensitivity, specificity, F1 score, precision, and accuracy were as follows:


Visualization of supervised machine learning
To enhance the interpretability of the machine learning models, this study employed the Shapley Additive exPlanations (SHAP) interpreter to visualize the classification results. The importance and potential directionality of various factors influencing the severity of chronic insomnia were analyzed using the SHAP value as a standardized measure of feature importance. Furthermore, DCA were conducted to evaluate the clinical utility of the models.51–53
Calibration of supervised machine learning models
Calibration ensures that the predicted probabilities accurately reflect the true likelihood of the outcome, thereby enhancing models reliability and credibility.
54
In this study, the Platt Scaling probability calibration method was employed to map these scores to calibrated probabilities within the 0–1 interval by introducing a sigmoid function, which aligned them more closely with the actual proportion of positive class samples. By setting the original output scores of the model as f(x), the calibrated probabilities are calculated as follows:

Here, A and B are the parameters to be optimized, obtained by maximizing the log-likelihood function. Great likelihood estimation is subsequently utilized to optimize the parameters A and B. The objective is to minimize the following loss function:
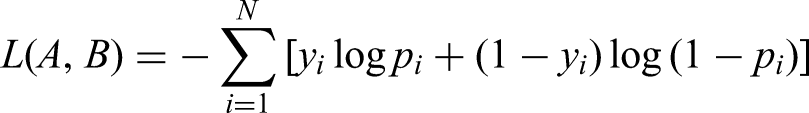
where
After calibration, the effectiveness is evaluated using the observed/expected ratio (O/E), slope, integrated calibration index (ICI), and expected calibration error (ECE). The ideal calibration results are as follows: O/E ≈ 1, Slope ≈ 1, and both ECE and ICI close to 0. When O/E is close to 1, it indicates that the predicted probability aligns closely with the actual incidence; when the slope approaches 1, it suggests that the raw scores are near the true probability distribution; a decrease in ICI signifies an improvement in global calibration effect; and a reduction in ECE indicates that calibration has lessened local error.
Ethics approval and consent to participate
The study was conducted according to the guidelines of the Declaration of Helsinki and was approved by the Ethics Committees of Xiangshan TCM Hospital (batch number: XSEC2021001) and Shanghai Municipal Hospital of TCM (batch number: 2021SHL-KY-11-01). All participants signed a written informed consent form that was approved by the Ethics Committee.
Results
Basic information of the insomniacs
The study involving 594 patients with varying degrees of insomnia revealed significant differences related to age, marital status, and living situation (p < 0.05) (Table 1). Notably, moderate-to-severe insomniacs had a mean age of 49 years, indicating a younger demographic compared to those experiencing mild insomnia. Among the insomniac population, a higher percentage were married (80.13%), and a greater proportion of those living together (86.70%) developed chronic insomnia compared to those living alone. Furthermore, a higher percentage of patients with moderate-to-severe insomnia were on medication (50.85%) compared to those with mild insomnia. Lastly, the assessment of insomnia symptoms indicated significant differences across multiple dimensions, including sleep quality and mood (p < 0.001).
General characteristics of insomniacs (n = 594).

Note: a Used Mann–Whitney U test, b used the chi-square test.
Tongue and facial features
This study identified significant differences in the color of the SV among patients with varying degrees of insomnia (Table 2). The median differences were particularly pronounced for the first four indicators: SV-R, SV-Y, SV-G, and SV-B. Specifically, compared to patients with mild insomnia, those with moderate-to-severe insomnia exhibited a gradient increase in both the SV-R and SV-Y, with statistically significant differences (p < 0.05). This finding suggested that the intensity of red coloration in the SV of insomnia patients intensified as the severity of insomnia increases. Additionally, the SV-G and SV-B in patients with moderate-to-severe insomnia were significantly higher than those in patients with mild insomnia (p < 0.05), indicating that the SV of patients with moderate-to-severe insomnia exhibited a more pronounced blue-green hue compared to those with mild insomnia. The connection between blood stasis and tongue color is well-established in TCM theory,55,56 where blue-green discoloration is regarded as an objective indicator of blood stasis. 47 In summary, the color of the SV in patients with insomnia demonstrated a deepening red hue and an increase in blood stasis as the severity of insomnia escalates (Figure 3).

Comparison of SV features in patients with different degrees of insomnia.
Statistical analysis of tongue index [median (P25, P75)].

Note: Used Mann–Whitney U test vs. mild insomnia.
*p < 0.05.
In terms of facial features, this study identified significant differences in the facial characteristics of patients with varying degrees of insomnia, particularly in the center of eyebrows, the tip of the nose, the zygomatic, the cheek, and the jaw regions (Table 3, Figure 4). Specifically, the measurements for Eb-G, Eb-L, Ns-R, Ns-G, Ns-L, Ns-Y, Zg-R, Zg-G, Zg-L, Zg-Y, Ch-R, Ch-G, Ch-B, Ch-L, Ch-Y, Ja-G, Ja-L, and Ja-Y were significantly higher in patients with moderate-to-severe insomnia compared to those with mild insomnia (p < 0.05). These findings suggested that, patients with moderate-to-severe insomnia exhibited brighter tones in the tip of the nose, cheeks, and jaw regions (Eb-L, Ns-L, Ns-Y, Zg-L, Zg-Y, Ch-L, Ch-Y, Ja-L, and Ja-Y). Furthermore, patients with moderate-to-severe insomnia displayed a blue-greenish hue in the center of eyebrows (Eb-G), the tip of nose (Ns-G), the zygomatic (Zg-G), the jaw areas (Ja-G) and the cheeks (Ch-G, Ch-B), along with increased redness in the cheeks (Ch-R). Additionally, patients with severe insomnia presented a more pronounced red coloration in the tip of the nose and zygomatic areas (Ns-R, Zg-R). This phenomenon may be attributed to the high density of capillaries in the cheeks, tip of the nose, and zygomatic regions, 16 which are less likely to be interfered with by external factors such as hair and beard, leading to a greater reflection of red hues.

Comparison of facial features in patients with different degrees of insomnia. (A) Differences in the center of eyebrow color values among insomniacs. (B) Differences in the tip of the nose color values among insomniacs. (C) Differences in zygomatic color values among insomniacs. (D) Differences in cheek color values among insomniacs. (E) Differences in jaw color values among insomniacs.
Statistical analysis of facial index [median (P25, P75)].

Note: Used Mann–Whitney U test vs. mild insomnia.
*p < 0.05.
The results of stepwise regression analysis
All tongue features requiring variable screening were incorporated as independent variables into a stepwise regression model. The model successfully passed the F-test, yielding an F-value of 7.528 and a p-value of 0.006, which indicates the model's validity. Through automatic identification, SV-R was ultimately selected as the sole variable (Table 4).
Stepwise-regression iteration process and outcomes.

Note: The iteration method is the stepwise approach.
The results of PCA
According to the aforementioned principle of principal component retention, PC1 and PC2 in this study (i.e.,

Scree plot of PCA. Note: The X-axis and Y-axis represent the components and eigenvalues, respectively. Steepness indicates that the eigenvalues are large and contain more information.

Factor loading plots. Note: The X-axis and Y-axis correspond to Principal component 1 (Dim1) and Principal component 2 (Dim2), respectively.
Variance contribution rate of PCA.

Rotated component matrix

Note: Blue indicates that the absolute value of the load factor is greater than 0.9, and bold indicates that the absolute value of the variable load factor is ranked in the top 6. Rotation method: Varimax.
The results of ZINB regression
The ZINB regression model indicated that the two items, frequency of weekly insomnia and sleeplessness throughout the night, had a significant positive effect on the degree of insomnia in this study (Figure 7). Specifically, the regression coefficient for insomnia frequency was 0.050, demonstrating significance at the 0.05 level (z = 1.979, p = 0.048), with an odds ratio (OR) of 1.051. This implies that for each unit increase in the number of insomnia episodes per week, the severity of insomnia, as measured by the ISI, increased by a factor of 1.051. Additionally, the regression coefficient for sleeplessness throughout night was 0.242, also significant at the 0.05 level (z = 2.090, p = 0.037), with an OR of 1.273. This indicated that for each increase in instances of all-night sleeplessness, the ISI value increased by a factor of 1.273.

Results from the negative binomial portion of the ZINB regression model for estimating the effect of nighttime behaviors on insomnia.
The results using supervised machine learning
This study primarily analyzed the contribution of TCM observational features to the classification of insomnia severity levels. Additionally, by integrating the results from previous variable analyses and screenings, the corresponding baseline information, sleep symptoms, SV features, and facial features were combined to construct various models as input variables for modeling and evaluation (Table 7). Models 1, 2, 3, 4, and 5 were developed and assessed based on the following combinations: baseline (sex, age, SAS, SDS); baseline plus sleep symptoms (sex, age, SAS, SDS, PSQI, frequency of weekly insomnia, sleeplessness throughout the night); baseline plus sleep symptoms plus SV features (sex, age, SAS, SDS, PSQI, frequency of weekly insomnia, sleeplessness throughout the night, SV-R); baseline plus sleep symptoms plus facial features (sex, age, SAS, SDS, PSQI, frequency of weekly insomnia, sleeplessness throughout the night, Ch-L, Ch-Y, Ch-R, Ns-L, Ns-Y, Ch-G); and baseline plus sleep symptoms plus SV features plus facial features (sex, age, SAS, SDS, PSQI, frequency of weekly insomnia, sleeplessness throughout the night, SV-R, Ch-L, Ch-Y, Ch-R, Ns-L, Ns-Y, Ch-G).
Classification results of each model based on different data sets.

Note: Model 1, “baseline,” Model 2, “baseline plus sleep symptoms,” Model 3, “baseline plus sleep symptoms plus SV features,” Model 4, “baseline plus sleep symptoms plus facial features,” Model 5, “baseline plus sleep symptoms plus SV features plus facial features.”
The results indicated that all supervised machine learning methods demonstrated improved performance when utilizing composite data compared to baseline data alone. In model 2, which incorporated baseline information and sleep symptoms, the SVM classification achieved the highest performance, with an accuracy of 0.737 and an AUC of 0.808. Additionally, the logistic regression also exhibited strong performance, achieving an accuracy of 0.737 and an AUC of 0.805. In model 3, which combined baseline data, sleep symptoms, and SV features, the SVM again performed the best, with an accuracy of 0.749 and an AUC of 0.813. In model 4, which included baseline data, sleep symptoms, and facial features, yielded commendable results from both logistic regression and SVM classifications, with accuracies of 0.749 and 0.737, respectively, and AUCs of 0.820 and 0.822. In model 5, which integrated baseline data, sleep symptoms, SV features and facial features, the logistic regression and SVM perform well with accuracies of 0.743 and 0.749, respectively, while the AUCs for both were 0.807.
Furthermore, radar plots comparing the performance of five models under different classifiers (Figures 8–12) assessed six performance dimensions: Sensitivity, specificity, F1 score, precision, accuracy, and AUC. These assessments revealed that model 4 exhibited superior overall performance, underscoring the significant value of incorporating baseline data, sleep symptoms, and facial features in evaluating the severity of insomnia in patients. The inclusion of patients’ sleep performance, along with their objectified and digitized facial TCM observational features in the baseline information, markedly enhanced the effectiveness of the insomnia classification models.

Comparison for performance evaluation of different classifiers in model 1 based on the baseline. Note: (A) displays the six ROC curves for model 1. The proximity of each curve to the upper left corner signifies the superior performance of the machine learning method. (B) illustrates the performance of model 1 across various metrics: Sensitivity, specificity, F1 score, precision, accuracy, and recall. Each metric is represented along an axis radiating outward from the center, with a larger area of radiation indicating better overall performance of model 1.
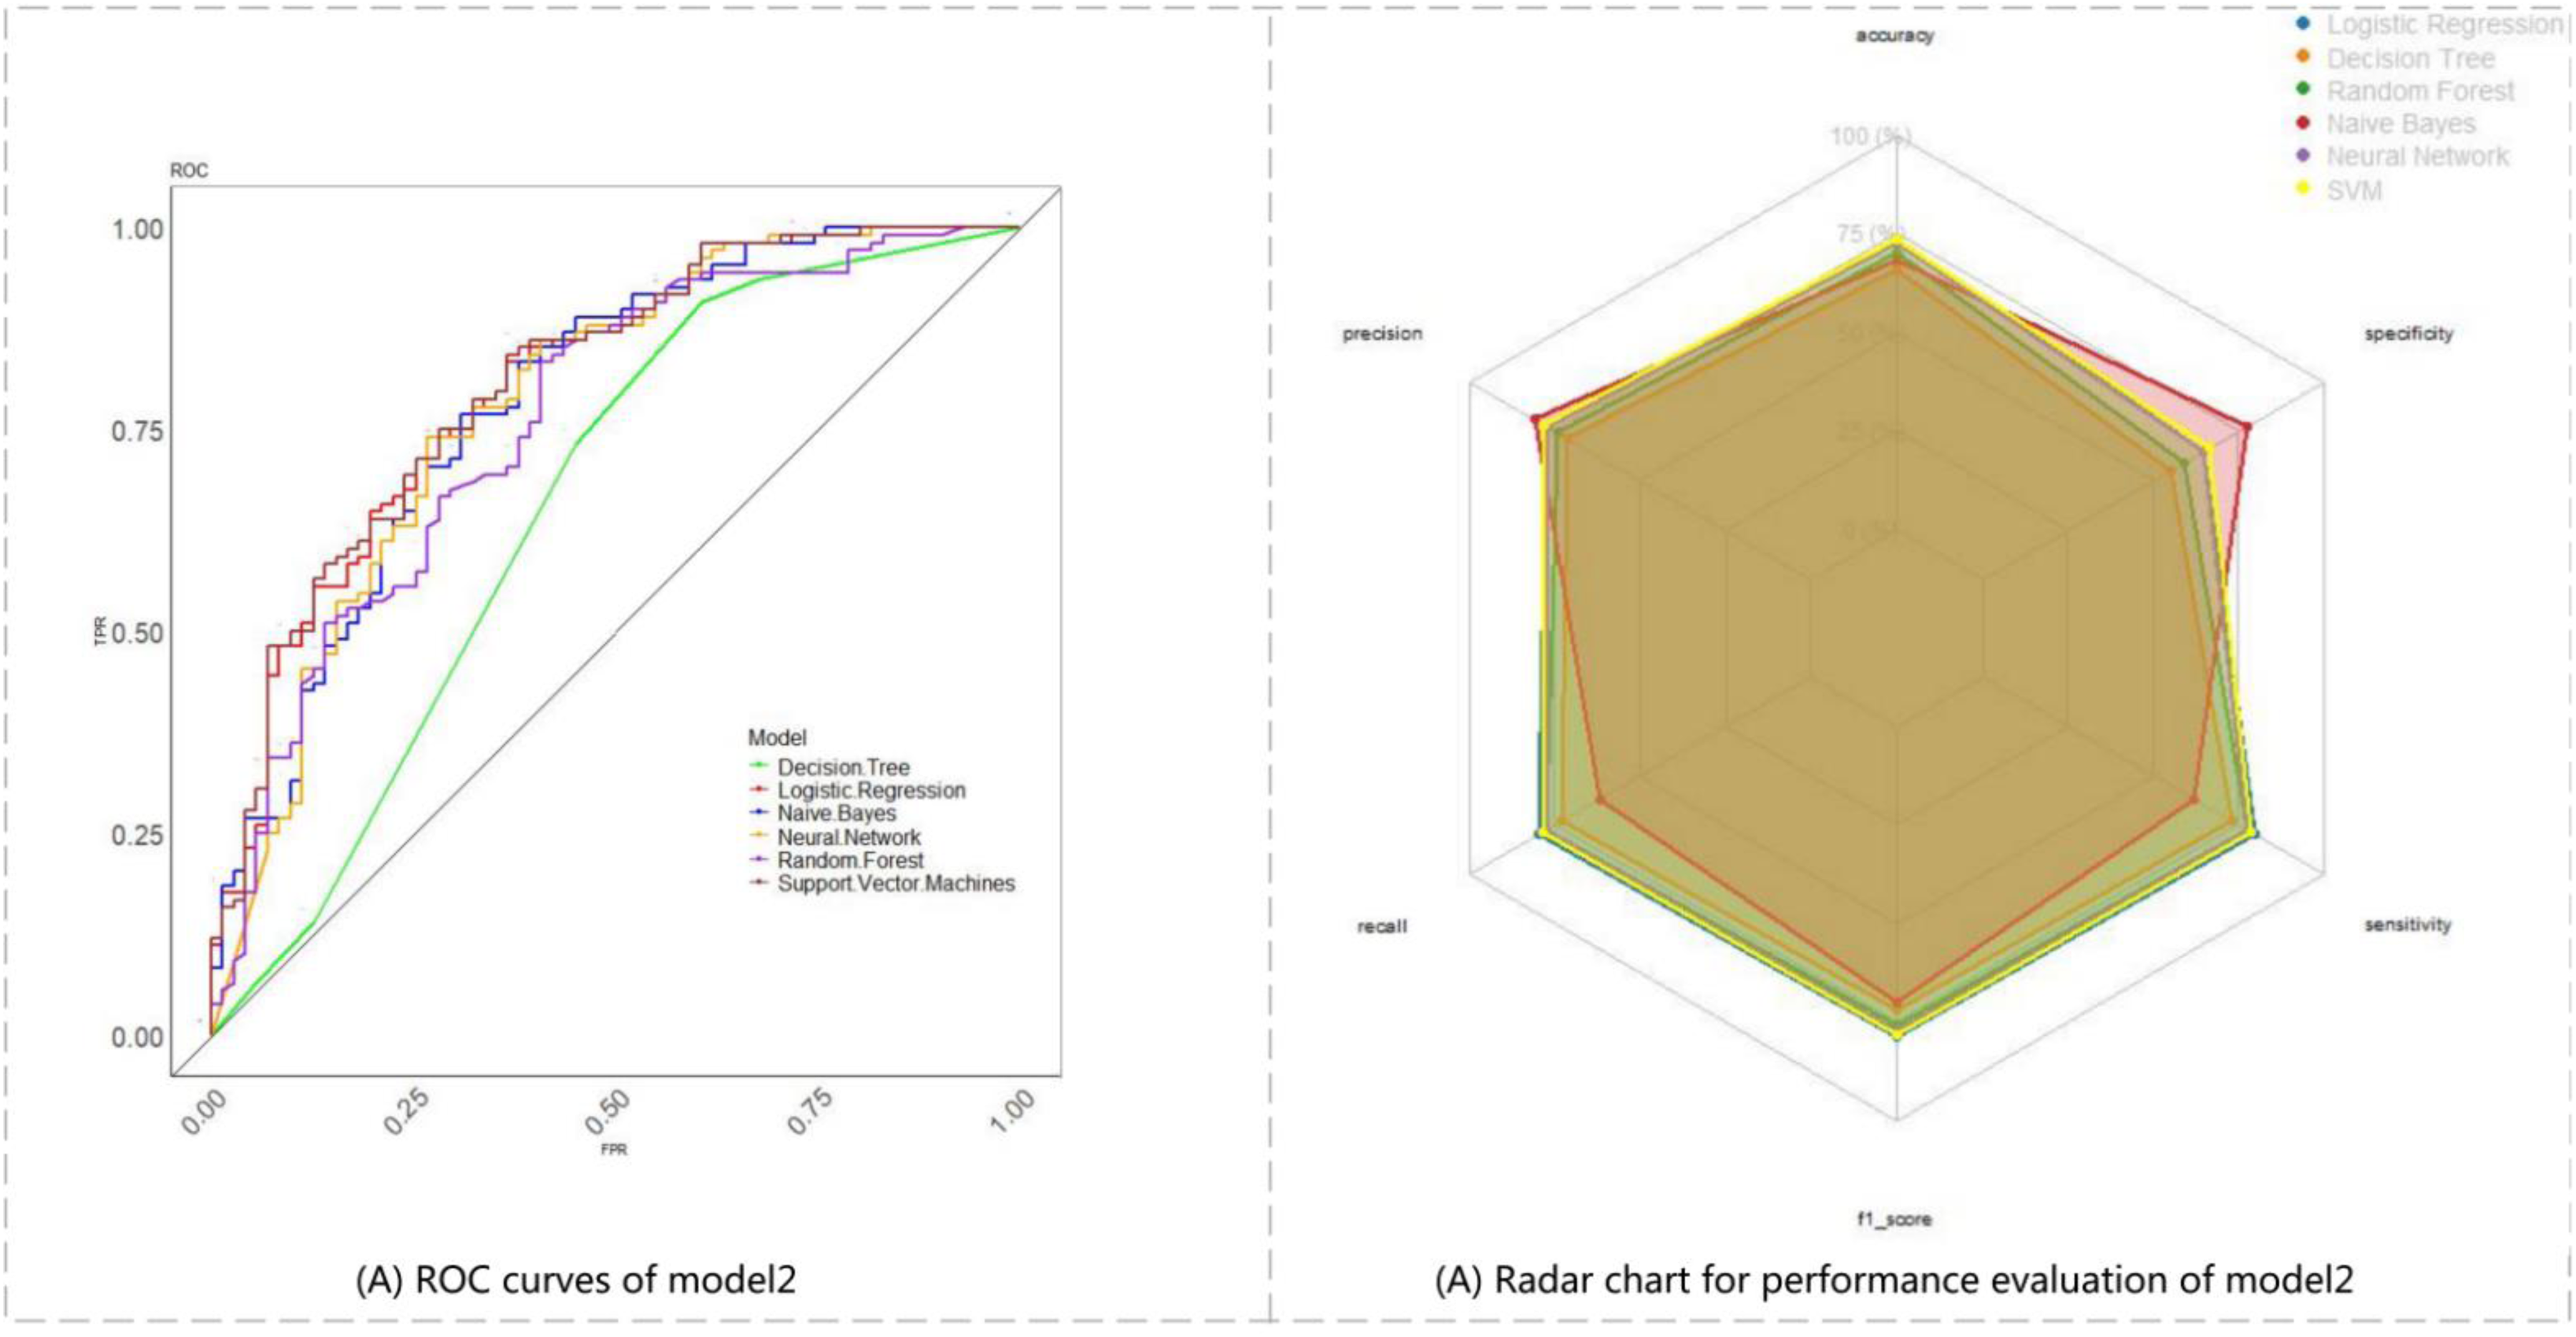
Comparison for performance evaluation of different classifiers in model 2 based on baseline plus sleep symptoms. Note: (A) displays the six ROC curves for model 2. The proximity of each curve to the upper left corner signifies the superior performance of the machine learning method. (B) illustrates the performance of model 2 across various metrics: Sensitivity, specificity, F1 score, precision, accuracy, and recall. Each metric is represented along an axis radiating outward from the center, with a larger area of radiation indicating better overall performance of model 2.

Comparison for performance evaluation of different classifiers in model 3 based on baseline plus sleep symptoms plus SV features. Note: (A) displays the six ROC curves for model 3. The proximity of each curve to the upper left corner signifies the superior performance of the machine learning method. (B) illustrates the performance of model 3 across various metrics: Sensitivity, specificity, F1 score, precision, accuracy, and recall. Each metric is represented along an axis radiating outward from the center, with a larger area of radiation indicating better overall performance of model 3.

Comparison for performance evaluation of different classifiers in model 4 based on baseline plus sleep symptoms plus facial features. Note: (A) displays the six ROC curves for model 4. The proximity of each curve to the upper left corner signifies the superior performance of the machine learning method. (B) illustrates the performance of model 4 across various metrics: Sensitivity, specificity, F1 score, precision, accuracy, and recall. Each metric is represented along an axis radiating outward from the center, with a larger area of radiation indicating better overall performance of model 4.

Comparison for performance evaluation of different classifiers in model 5 based on baseline plus sleep symptoms plus SV features plus facial features. Note: (A) displays the six ROC curves for model 5. The proximity of each curve to the upper left corner signifies the superior performance of the machine learning method. (B) illustrates the performance of model 5 across various metrics: Sensitivity, specificity, F1 score, precision, accuracy, and recall. Each metric is represented along an axis radiating outward from the center, with a larger area of radiation indicating better overall performance of model 5.
Visualization of model 4
Visualization for model 4 was conducted using the DCA and SHAP explainers. The DCA indicated that model 4 exhibited significant clinical utility (Figure 13). By comparing the net benefit values of the classifiers in model 4 at critical threshold points (Table 8), it was observed that the random forest classifier consistently maintained the highest net benefit across the entire threshold interval, showcasing excellent generalization capability. Specifically, its net benefit value at the clinically significant threshold of 0.1 was 0.531, indicating that for every 100 patients, 8.1 unnecessary treatments could be avoided compared to all other treatment strategies. Consequently, the random forest is recommended as a core method for clinical decision support systems. Furthermore, the confusion matrix (Supplementary Material 1) visually illustrates the performance of the classification models.

DCA curves of model 4.
Net benefit values at key threshold points across classifiers (treatment strategies) for model 4.

With the increase in the number of variables in model 4, we utilized the SHAP to visually present the selected variables and illustrated the positive and negative impacts of each feature on a given sample. Figure 14 displayed the absolute values of the average SHAP values for various features (Figure 14). Among the variables exerted the greatest influence on the severity of insomnia, the effects of Ch-Y and CH-G were notably prominent, compared to the conventional PSQI and SAS, followed by Ch-R, as illustrated in Figure 14(B) and (D).
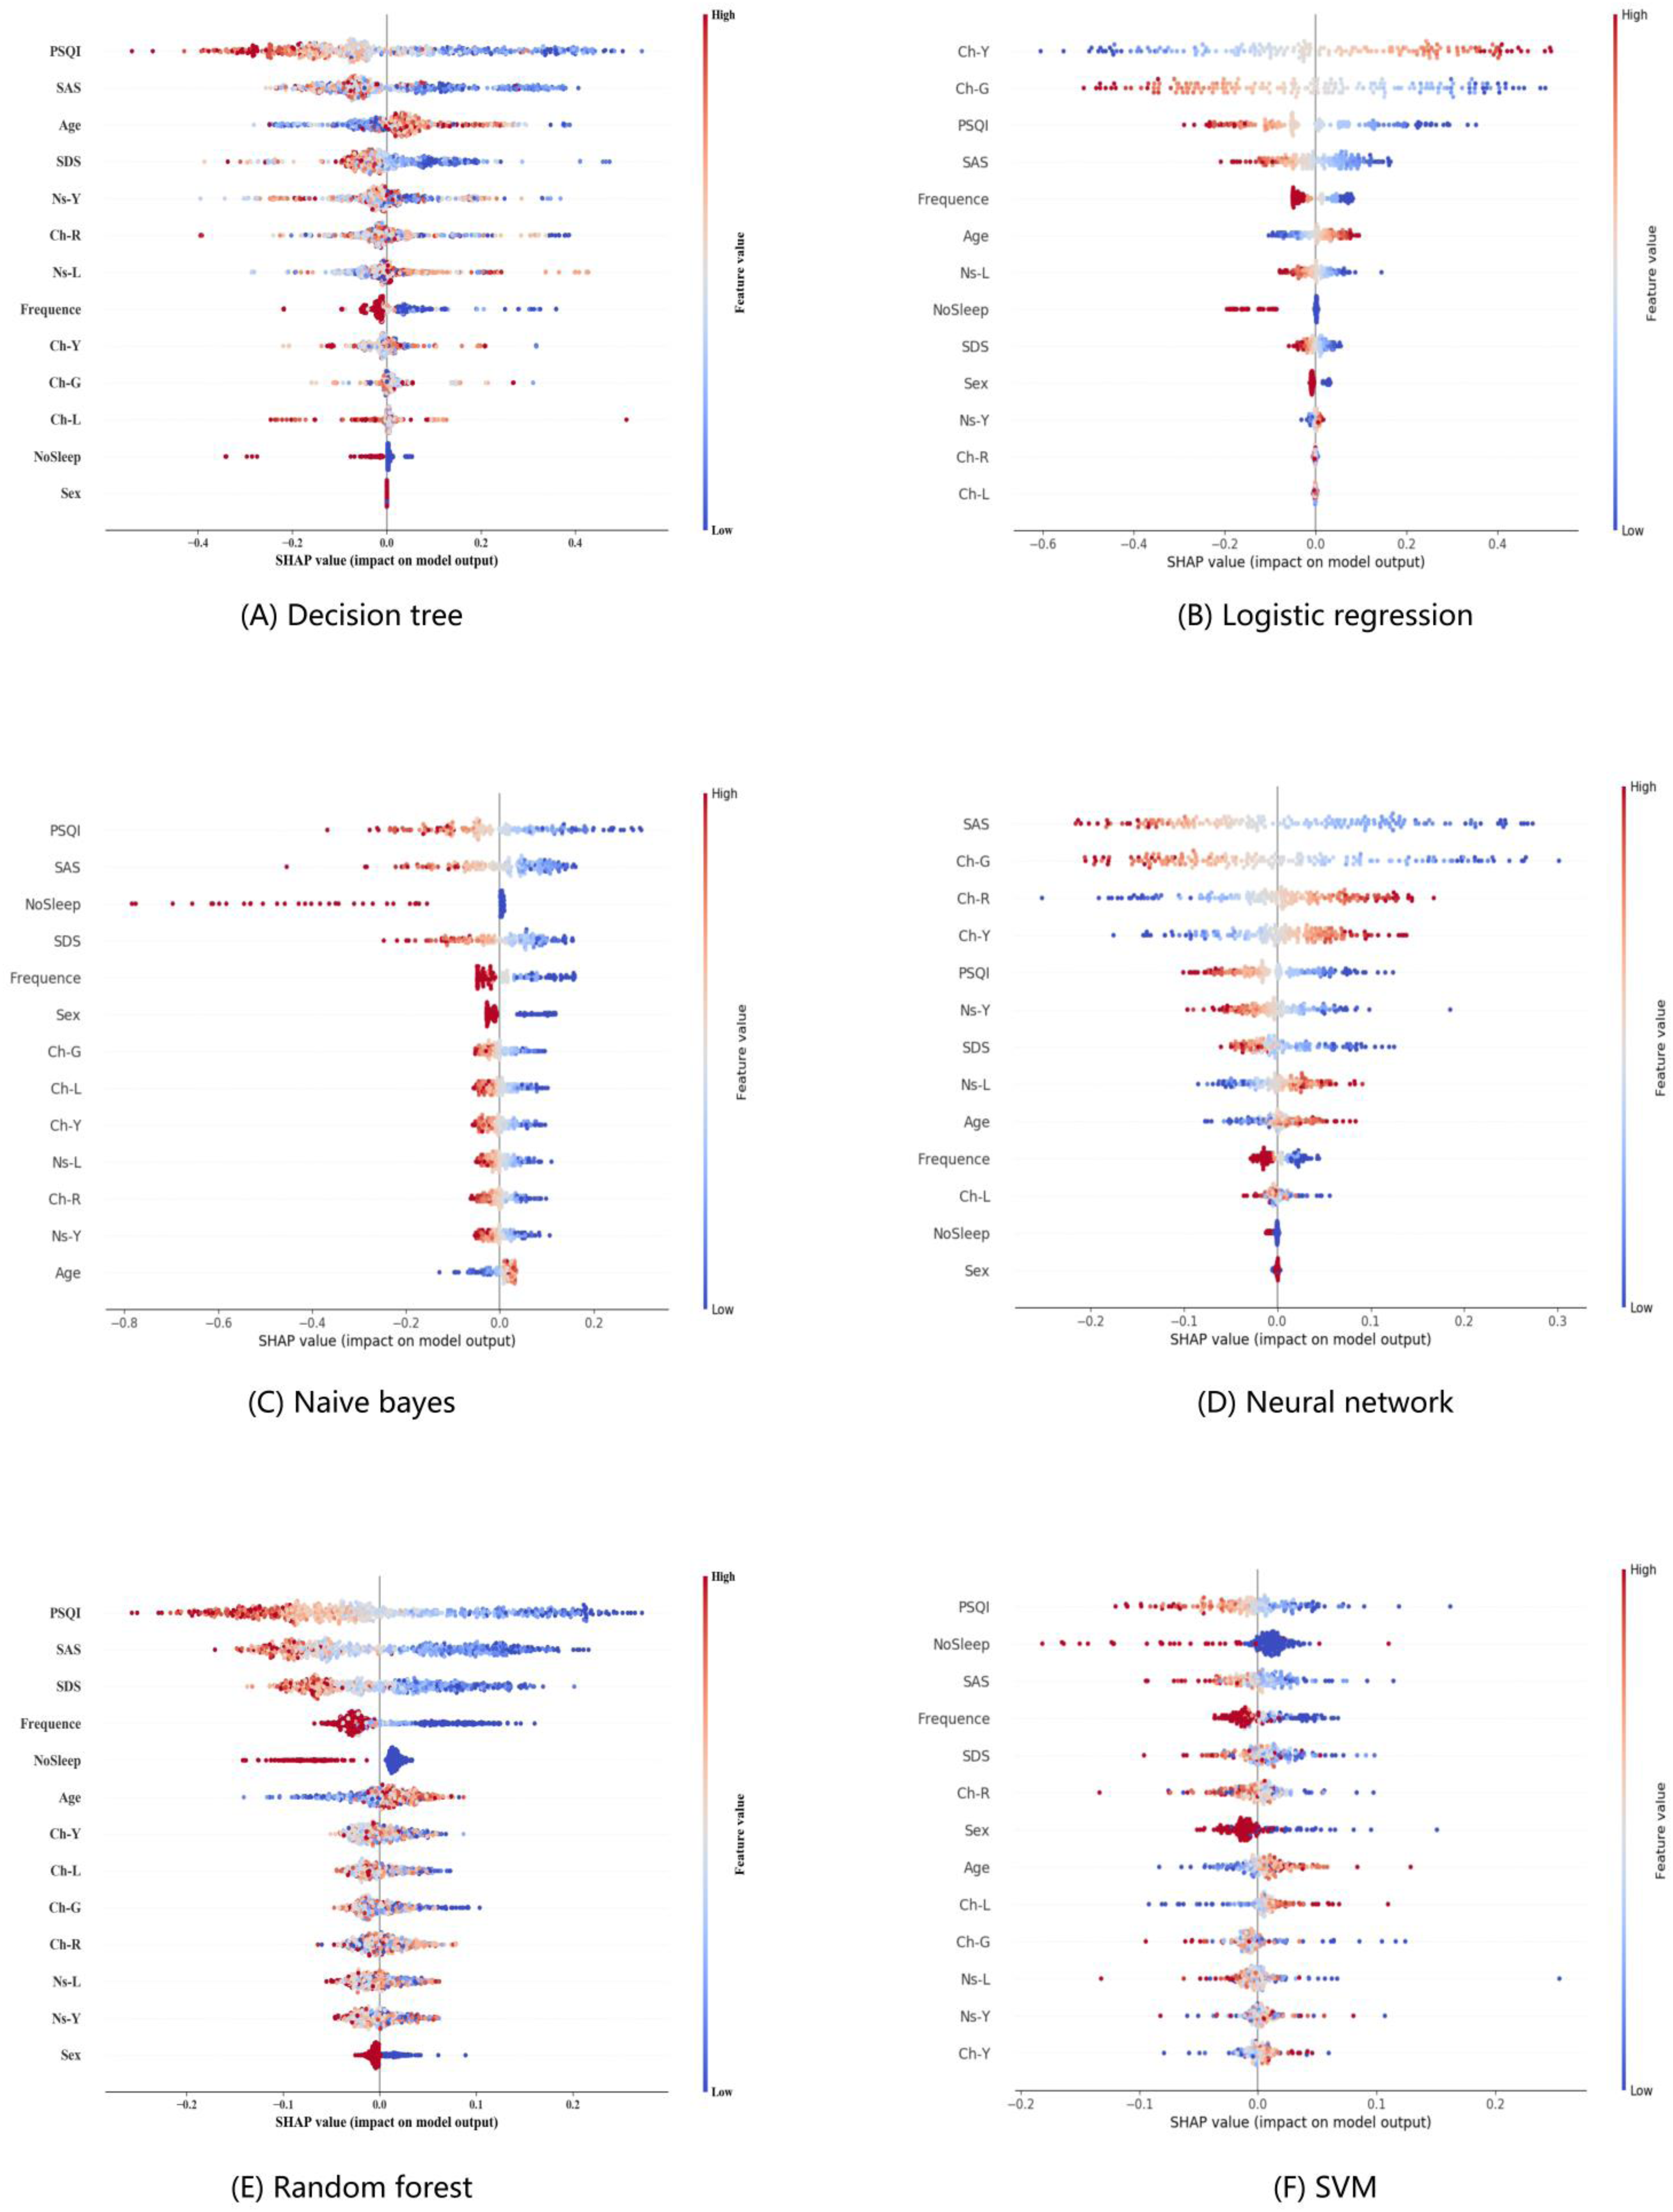
SHAP explanations of model 4 with different classifiers. Note: SHAP explanations, red color representing higher values of the covariate, while blue representing lower values of the covariate. Covariates ordered according to the Gain statistic. The X-axis represents the contribution of the feature to the prediction of a single sample, and the Y-axis represents the feature name.
The results of Platt scaling calibration
The results of Platt scaling calibration indicated that model 4 exhibited significant improvement post-calibration (Figure 15). The O/E was 1.038, and the slope was 1.026, suggested that the predicted probabilities from model 4 closely aligned with the actual probabilities of occurrence. Furthermore, the raw scores approached the true probability distribution. Both the ICI and the ECE were reduced following calibration, demonstrating a marked enhancement in global calibration effects and a significant reduction in local errors.

Results of Platt scaling calibration. Note: The X-axis represents different models, while the Y-axis denotes the values of the evaluation index for the calibration effect. The values displayed on the nested histograms correspond to the evaluated calibration effect for the calibrated models.
Discussion
In the diagnosis and assessment of chronic insomnia, modern medicine faces challenges in popularizing objective assessment methods such as polysomnography due to their high costs and operational complexity. 5 Consequently, the field was predominantly guided by patients’ self-reported symptoms, including difficulties in falling or maintaining sleep, daytime fatigue, and evaluations using related scales. This reliance on subjective information could compromise accuracy. Notably, the misalignment between subjective experiences and objective symptoms was a common issue among insomnia patients. This gap may be addressed through the application of modern TCM diagnostic methods. With advancements in image processing technology, artificial intelligence, and other computer sciences, the diagnostic information collection process—encompassing factors such as light source illumination, color temperature, color rendering index, and color reproduction—has matured. Digital image analysis techniques could now meet the data requirements of TCM, thereby overcoming the limitations of subjective evaluation and addressing the challenges associated with visual reproduction in TCM diagnosis.57,58
Chinese medicine posited that the pathology of chronic insomnia primarily resides in the heart. 59 The tongue, regarded as a reflectiton of heart function—often described as “the seedling of the heart”—provided significant insights for the diagnosis and treatment of chronic insomnia. Facial diagnosis, a method that involved observing alterations in the color and luster of facial skin, served as a valuable diagnostic tool. 60 This approach provided intuitive and comprehensive information that assists practitioners in making assessments. It may integrate TCM smart diagnostic technology with mobile and home healthcare, aiming to achieve low-cost, full-cycle, non-invasive management of chronic insomnia in the future.
This study examined the tongue and facial features of individuals with insomnia, revealing that as the severity of insomnia increased, the redness and blue-green hues of the SV also intensified. This consistent change indicated that the tongue may serve as a reflective surface, providing real-time feedback on the progression of insomnia and offering an objective basis for the auxiliary diagnosis of chronic insomnia. Patients with moderate-to-severe insomnia exhibited a blue-greenish hue in the Eb-G, Ns-G, Zg-G, Ja-G, Ch-G, and Ch-B, whereas the redness of the Ch-R increased. These observations aligned with TCM theory regarding “Damp-heat” associated with insomnia, 6 which posits that individuals suffering from insomnia may display a greenish or reddish hue on their faces. 61 Furthermore, the color of the SV in patients with moderate-to-severe insomnia aligns with the typical TCM Zheng, which is a combination of signs and symptoms summarizing the disease process at a certain stage.62,63 In this stage, the tongue and face may appear greenish-purple, indicating blood stasis, while the reddish hue of the cheeks and zygomatic areas suggests yin deficiency.
In addition, this study employed three feature selection methods. For tongue characteristics, we utilized stepwise-regression analysis to automatically identify the tongue characteristics—SV-R—that significantly influence insomnia severity. For facial complexion features, TCM categorizes the face into specific regions for observational purposes; however, this approach has the disadvantage of a complicated number of facial diagnostic indices. To address this issue, we employed PCA to identify the core indices—Ch-L, Ch-Y, Ch-R, Ns-L, Ns-Y, and Ch-G—that most effectively represent the original features of facial color. Additionally, for nighttime behaviors in insomnia patients, we utilized a ZINB regression model to identify key clinical indicators of sleep conditions, including the frequency of weekly insomnia and sleeplessness throughout the night.
Studies of nighttime behaviors of chronic insomnia had yielded intriguing results. Utilizing ZINB regression, we found that the frequency of weekly insomnia and sleeplessness throughout the night significantly positively affected insomnia, even more so than difficulties in falling asleep and dreamy. Most previous epidemiological studies had focused on the association between sleep duration and health, in fact, irregular sleep was often linked to an increased risk of various diseases, 64 and the importance of sleep regularity as a health indicator was growing. 9 The present results suggested that public health campaigns should emphasize and communicate the significance of sleep regularity, rather than solely concentrating on nighttime sleep quality.
The application of machine learning methods for disease prediction and health state classification using data derived from the four diagnoses of TCM has been extensively documented. In facial diagnosis applications, Lin Ang et al. 13 employed multivariate selection methods, including stepwise Akaike information criterion (AIC) and least absolute shrinkage and selection operator (LASSO), to construct a hypertension prediction model based on facial CIELAB color-space features. In tongue diagnosis applications, binary logistic regression and neural networks were utilized to develop a hypertension prediction model using digital characteristics of the SV, identifying thickened SV width as an independent hypertension risk factor. 65 Additionally, stacking ensemble learning and ResNet50 were applied to build a diabetes risk prediction model that incorporated TCM tongue features. 66 In integrated tongue-pulse diagnosis applications, Shi et al. 67 implemented four machine learning methods—logistic regression, support vector machine, random forest, and neural network—to establish a fatigue state classification model using combined tongue and pulse data, achieving early differential diagnosis between disease-related and non-disease-related fatigue. In this study, we analyzed the tongue, facial features, and nocturnal performance of insomnia patients to construct the chronic insomnia classification models utilizing several feature fusion through supervised machine learning. Our findings indicated that all machine learning approaches demonstrated superior performance when utilizing composite data compared to those based solely on baseline data. Notably, model 4, which incorporated baseline along with sleep symptoms and facial features, exhibited the most comprehensive performance. This suggested that integrating patients’ sleep performance and their digitized and objectified facial features into the baseline information could significantly enhance the insomnia classification models.
In conclusion, this study employed modern TCM diagnostic equipment and intelligent analysis techniques to investigate the specific facial and tongue features associated with chronic insomnia, focusing on convenient and non-invasive diagnostic methods. Subsequently, a classification model for chronic insomnia was developed through the integration of multiple features, enabling a more accurate assessment of insomnia severity. This model held promise for the early detection of insomnia patients, thereby facilitating advancements in therapeutic interventions.
Limitations
This study had several limitations. First, the impact of coronavirus disease 2019 (COVID-19) on individuals’ sleep cannot be overlooked,68,69 and the progression of COVID-19 among the subjects in this study has not been thoroughly examined. Second, all patients were first-time attendees at the Department of Psychiatry and Rehabilitation and had not previously received systematic treatment for insomnia. It cannot be excluded that some individuals may have been taking medication, which could potentially influence the study's results. Third, the parameter estimates for all models may have been underpowered. Finally, this was a single-center retrospective cohort study based in Shanghai, which affected the quality and diversity of the data, pending external validation and optimization. Future research will incorporate power analysis to ensure three criteria: (1) a global shrinkage factor of ≥0.9, (2) a small absolute difference of ≤0.05 in adjusted Nagelkerke's R², and (3) precise estimation of the overall risk in the population. 70 Additionally, it will focus on broadening the sample range, conducting multicenter studies, and integrating new technological approaches, such as 3D pulse data 71 and spectral information. 72 Furthermore, the application of multi-task supervised machine learning 73 techniques could enhance data utilization, capture the similarities and differences among varying degrees of chronic insomnia, and improve the accuracy of classification models. In conclusion, the development of the chronic insomnia assessment and early warning models tailored for practical clinical applications will be a primary focus of future research.
Conclusion
In conclusion, this study employed modern technology in TCM diagnosis by utilizing the standardized diagnostic equipment, the TFDA-1 tongue and face diagnosis instrument, to collect clinical information from 594 chronic insomnia patients. This data included baseline conditions, sleep performance, mood scales, and digital images of the tongue and face. Tongue- and face-related color features were intelligently analyzed by the TDAS/FDAS. The study applied stepwise regression analysis, PCA and ZINB regression for variable screening, ultimately employing various machine learning methods to construct the chronic insomnia assessment models based on the integration of TCM observation diagnostic features. This approach offered a novel perspective for the clinical diagnosis and treatment of chronic insomnia.
Supplemental Material
sj-docx-1-dhj-10.1177_20552076251393331 - Supplemental material for A new method for assessing chronic insomnia: Machine learning-based fusion of TCM observation digital features
Supplemental material, sj-docx-1-dhj-10.1177_20552076251393331 for A new method for assessing chronic insomnia: Machine learning-based fusion of TCM observation digital features by Yu Wang, Jie Chen, Qincheng Chen, Xudong Huang, Yulin Shi, Zhentao Li, Xuemin Wang, Liang Xu and Jiatuo Xu in DIGITAL HEALTH
Footnotes
List of abbreviations
Acknowledgments
The authors are especially thankful for the positive support received from the Xiangshan Traditional Chinese Medicine hospital and Shanghai Hospital of Integrated Traditional and Western Medicine.
Ethical approval
The study was conducted according to the guidelines of the Declaration of Helsinki and was approved by the Ethics Committees of Xiangshan TCM Hospital (batch number: XSEC2021001) and Shanghai Municipal Hospital of TCM (batch number: 2021SHL-KY-11-01).
Consent to participate
All participants signed a written informed consent form that was approved by the Ethics Committee.
Consent for publication
Not applicable.
Contributorship
The work was carried out in collaboration between all authors. WY was involved in the conception of the idea, analyzed the data, and drafted the manuscript with CJ. XJT and XL were responsible for overall guidance. CQC, HXD, and SYL were responsible for data analysis. LZT contributed to the model optimization during the revision process, particularly in the implementation of Platt Scaling for probability calibration. WXM monitored the quality of the clinical samples. All authors read and approved the final manuscript.
Funding
The authors disclosed receipt of the following financial support for the research, authorship, and/or publication of this article: This research was funded by the National Key Research and Development Program of China (2017YFC1703301), the National Natural Science Foundation of China (81873235), Construct Program of the Key Discipline of State Administration of Traditional Chinese Medicine of China (ZYYZDXK-2023069), Shanghai Science and Technology Committee Rising-Star Program (24YF2746000), Research Project of Shanghai Municipal Health Commission (2024QN018), Shanghai University of Traditional Chinese Medicine Science and Technology Development Programme (23KFL005). The funder has not influenced the research in any way, and the research has been carried out independently.
Declaration of conflicting interests
The authors declared no potential conflicts of interest with respect to the research, authorship, and/or publication of this article.
Data availability
The datasets generated and analyzed during the current study were not publicly available due to the confidentiality of the data, which was an important component of the National Key Technology Research and Development Program of the 13th Five-Year Plan (No. 2017YFC1703301) in China, but they were available from the corresponding author on reasonable request.
Supplemental material
Supplemental material for this article is available online.
References
Supplementary Material
Please find the following supplemental material available below.
For Open Access articles published under a Creative Commons License, all supplemental material carries the same license as the article it is associated with.
For non-Open Access articles published, all supplemental material carries a non-exclusive license, and permission requests for re-use of supplemental material or any part of supplemental material shall be sent directly to the copyright owner as specified in the copyright notice associated with the article.