
Abstract
Background
Glucolipid metabolic disorders is a disorder characterized by derangement of glucose and lipid metabolism, which is involved in multiple factors. Since the emergence of accelerated technological evolution, it has progressively evolved into a significant concern in contemporary medicine. Therefore, early screening and diagnosis are crucial. This study aims to explore the possibility of early noninvasive diagnosis of
Method
In this study, we constructed a tongue-face segmentation model based on Deeplabv3 + for extracting tongue and facial indicators. The study collected information of 614 participants, including 296 patients with GLMD and 318 healthy controls. After baseline comparison, we respectively conducted intergroup comparison of laboratory biochemical indicators and correlation analysis of facial indicators and tongue image indicators for two groups. We also attempted to build machine learning diagnostic models for glycolipid metabolic diseases based on SVM, Random Forest, KNN, Naive Bayes, XGBoost, and AdaBoost by separately applying facial images and tongue images, and used Shapley to evaluate the contribution of each indicator in the model.
Result
The results show that there is a statistically significant difference in the facial and lip color indicators and tongue color indicators. The facial, lip and tongue brightness indicators have a higher correlation coefficient with LDL-C, TG, and CHO, among which F-L is most correlated with LDL-C. Then, six classical machine learning models for predicting GLMD were constructed based on facial and tongue image indicators, and XGBoost performed the best with an AUC of 0.946, accuracy of 0.861, among which the color indicators TB-Y, TB-S, and TB-G are the top three indicators in terms of contribution.
Conclusion
The GLMD diagnostic model combined with tongue-facial indicators can achieve disease classification, and through modern information-based TCM diagnosis technology, the accuracy of noninvasive diagnosis of glucose-lipid metabolism diseases can be further improved.
Keywords
Background
Metabolic problems, which impose billions of dollars in medical costs each year, have become a major global threat to human health. 1 Lipids and glucose, the key substrates of life activities, 2 are involved in most metabolic processes in the human body. Under physiological conditions, these two components are tightly coordinate and jointly regulate human metabolic activities. 3 Glucolipid metabolic disorders represent a complex group of diseases associated with glycolipid dysregulation.4,5 Influenced by environmental and lifestyle factors, the number of diabetic patients in China resulting from abnormal glycolipid metabolism has increased from 90 million to 140 million over the past decade. Meanwhile, the number of adults with hypertension in China has reached 245 million, 81.2% of whom have at least one type of dyslipidemia. Currently, atherosclerotic cardiovascular disease (ASCVD) driven by dyslipidemia has become the leading cause of death among urban and rural residents in China.6,7 Therefore, early intervention, timely diagnosis and treatment, and long-term health management are crucial for patients with glucose and lipid metabolism diseases as well as high-risk populations.8,9
Traditional Chinese medicine (TCM) is widely recognized as a practical and effective approach for disease diagnosis and treatment worldwide.10–12 Inspection, as a representative noninvasive diagnostic method, plays an essential role in TCM diagnosis. This approach provides pathological information from multiple aspects, including the face, tongue coating, and tongue texture. With the integration of modern information technology, computer vision and image processing techniques have made it possible to quantitatively analyze tongue image features. 13 Recent studies have demonstrated the diagnostic potential of this approach. For example, researchers 14 combined tongue image observation and biological information to build a deep learning model for the diagnosis of gastrointestinal cancer. Similarly, tongue image features can provide more objective reference for the diagnosis of diabetes.15,16 Doctors can also assess patients’ health status by observing their facial features. 17 Besides, our team previously developed a tongue image classification system based on deep learning, which has achieved classifications for diabetes and NAFLD. 18 Our preliminary researches further demonstrated that incorporating TCM visual diagnostic images into disease assessment can enhance diagnostic accuracy.19,20 An increasing body of evidence suggests that TCM-based visual diagnostic methods provide promising new directions for the noninvasive diagnosis of glucolipid metabolic disorders. 21
With the application of artificial intelligence technologies, particularly machine learning,22,23 in the medical field, the precise segmentation of medical images has significantly enhanced the accuracy of disease diagnosis. Consequently, diagnostic techniques based on tongue image segmentation have also undergone substantial development.24–26 However, comprehensive studies on the application of TCM inspection diagnosis to glycolipid metabolism are still lacking. This study utilizes digitalized TCM visual diagnosis technology to investigate the pathogenesis and characteristic patterns of tongue and facial manifestations, aiming to explore noninvasive diagnostic approaches for glucolipid metabolic disorders.
Materials and method
Patients
This was a single-center retrospective case-control study conducted among individuals undergoing routine health examinations at the Physical Examination Center of the Shanghai University of Traditional Chinese Medicine Affiliated Baoshan Hospital of Integrated Traditional Chinese and Western Medicine from 3 January 2020 to 28 December 2021. A total of 615 patients were included in this experiment, with 318 in the control group and 297 in the disease group. The case process can be shown as Figure 1. All participants are required to fill out an informed consent form approved by the Ethics Committee of Shuguang Hospital Affiliated to Shanghai University of Traditional Chinese Medicine and all research was performed in accordance with relevant regulations. Besides, this research is performed in accordance with the Declaration of Helsinki.Health status is defined as the absence of acute or chronic diseases, and the diagnostic criteria for glucose and lipid metabolism diseases are based on “The International Clinical Practice Guidelines for Traditional Chinese Medicine.” 27 It mainly includes: (1) Type 2 diabetes: fasting blood glucose ≥ 7.0 mmol/L, or blood glucose ≥ 11.0 mmol/L 2 h after meal, or glycosylated hemoglobin ≥ 65%; (2) Dyslipidemia: Total cholesterol ≥ 6.21 mol/L, low-density lipoprotein cholesterol ≥ 4.1 mmol/L, triglycerides ≥ 2.3 mmol/L, and nonhigh density lipoprotein cholesterol ≥ 4.9 mmol/L; and (3) MASLD: Upper abdominal ultrasound suggests enhanced liver anterior echogenicity (“bright liver”), far-field echo attenuation, and unclear display of intrahepatic duct structures.

Case collection process.
Clinical data
Collect clinical data and calculate body mass index (BMI) and waist-to-hip ratio (WHR) based on the name, age, height, weight, waist circumference, and hip circumference of the research subjects. Laboratory biochemical indicators include Alanine aminotransferase (ALT), Aspartate aminotransferase (AST), Gamma-glutamyl transferase (γ-GT), Alkaline phosphatase (ALP), fasting blood glucose (FBG), Blood urea nitrogen (BUN), Creatinine (CREA), Uric acid (UA), Cholesterol (CHO), Triglyceride (TG), High-density lipoprotein (HDL), and Low-density lipoprotein (LDL).
Tongue and facial image sampling
All participants were required to fast for 30 min before filming to avoid staining their tongues with colors of food, drinks, etc. If there are food residues in the subjects’ mouths, they are required to rinse with water for 3–5 min before collection. The collection device is TFDA-1 Instrument developed by the Intelligent Diagnostic Laboratory of Shanghai University of Traditional Chinese Medicine. Set parameters such as shutter speed, aperture, sensitivity, metering, white, etc.; Instruct the subject to sit upright, closely adhere to the collection ring, look straight ahead, open their mouth and tongue, relax and flatten their tongue, and let it naturally droop. Click on the center of the screen to complete the image collection. The image is in JPG format with a size of 5568 × 3712 pixel(px).28–30 The brightness parameters can be found in the Supplementary Material. All images were collected in accordance with the collection standards and under a unified equipment and standard environment.
Tongue and face image feature extraction
Quality control of tongue and facial images is an important prerequisite for tongue surface feature analysis. In our preliminary research, we established a high-quality, standardized clinical database of tongue and facial images. Precise tongue/facial image segmentation is the fundamental work for obtaining facial and lip-tongue features. Unlike previous work based on Mask R-CNN, generative adversarial network Tongue-GAN, 31 we pay more attention to the accurate segmentation of the blurred areas at the connection of the lips and tongue as well as the accuracy of facial indicators.
Deeplabv3+ is a further extension of the DeepLab series models,32,33 aimed at improving the accuracy and efficiency of semantic segmentation by combining encoder decoder structures and dilated convolutions. 34
The specific steps are as follows: Firstly, we randomly selected 1150 tongue and facial images from the database. We annotated the fine-grained tongue and lip regions by using Labelme, with 805 tongue images used as training data and 345 tongue images used as testing data. The results showed that the segmentation model based on DeepLabv3+ achieved a mean Intersection over Union (mIoU) of 87.5% and a mean accuracy (mean_ACC) of 0.994 on the test set. An example of the segmentation output can be found in Supplementary Figure A. This indicates that the DeepLabv3+ model is capable of performing accurate segmentation of the lips and tongue with high precision. Finally, the region segmentation of the tongue body and tongue coating is completed through the “segmentation and merging algorithm” and “color threshold method.” And the color parameters of Lab color space, texture indicators, and tongue coating indicators are extracted in sequence according to the previous pattern recognition method.
The extraction of facial indicators involves two parts: skin segmentation and color texture calculation, including the use of facial keypoint detector and facial recognition model in Dlib toolbox, 35 to determine the geometric position relationship of the face and the position information of 68 facial keypoints, which can determine the position information of 8 ROIs, and automatically select skin color boxes for segmentation based on the above position information. Next, based on the elliptical skin color clustering model in YCbCr color space, skin color and background can be separated, and the average value of skin blocks can be calculated. The Gray-Level Co-occurrence Matrix (GLCM) method was used to calculate the relative frequencies of reference pixel pairs and their adjacent pixels within the skin block, in order to extract texture features. The lip features have good clustering characteristics in the YIQ color space, where the color changes of the Q component precisely cover the color range of the lips. Figure 2 shows the entire process of extracting tongue and facial indicators.

Tongue and face features extraction process.
Data analysis methods
Statistical analysis was conducted using IBM SPSS (Version 26.0). If the measured data follows a normal distribution or an approximately normal distribution, it is represented by X ± SD, minimum value, and maximum value; if the data does not follow a normal distribution, it is described by M, min, max, and quartiles (Q1 and Q3). Count data is represented by frequency, composition ratio, ratio, and relative ratio, etc. If the data follows a normal distribution or an approximately normal distribution and the variances are homogeneous, a two-independent sample t-test is used. Applying Bonferroni correction in multiple comparisons to control false positive rates.
Development of a diagnostic model for glucolipid metabolic disorders
We use Python 3.10.9 for machine learning, including Support Vector Machine (SVM), Random Forest (RF), K-nearest neighbor classifier, Gaussian Naive Bayes classifier (GaussianNB), XGBoost classifier, AdaBoost classifier. We use the skLearning (Version 1.3.1) library to compute machine learning classification results. The implementation of other deep learning networks is based on PyTorch 2.0. The specific parameter settings for these machine learning methods are summarized in Supplementary. Besides, we use an NVIDIA RTX 3090 with 24GB VRAM for model training and inference, a total of 120 training epochs incorporating cosine annealing learning rate scheduling for the last 20 epochs, the AdamW optimizer with a weight decay of 0.0001, and an initial learning rate of 0.0001 that decays by a factor of 0.9 every 20 epochs.
In machine learning, the prediction results of diseases are usually divided into true positive (TP), true negative (TN), false positive (FP), and false negative (FN). TP is the number of cases correctly identified as positive, FP is the number of cases incorrectly marked as positive, TN is the number of cases correctly identified as negative, and FN is the number of cases incorrectly marked as negative. By analyzing the above categories, metrics such as accuracy (ACC), precision (Precision), recall (Recall), and F1 score can be calculated to evaluate model performance. ACC reflects the proportion of all correct predictions in the total sample, precision represents the model's ability to correctly predict positive numbers in all positive predictions, recall represents the model's ability to correctly predict positives from actual positive samples, and F1 score is the harmonic average of precision and recall. By considering precision and recall comprehensively, a more comprehensive evaluation perspective is provided for model performance.30,36 Besides, We re-divided the data into training, validation, and testing sets using a 7:1:2 ratio, ensuring comparable distributions of gender, age, and disease categories. This approach can reduce the chance errors caused by data partitioning, making the performance evaluation more stable.
Results
Description of basic information and biochemical experimental indicators between disease group and control group
This study included 297 GLMD patients and 318 nondisease control members. All subject information is shown in Table 1. There is no statistically significant difference in gender and age between the two groups, and they are comparable. The clinical indicators of ALT, AST, γ - GT, ALP, GLU, BUN, CREA, UA, CHO, TG, HDL, LDL, etc., in the disease group were significantly higher than those in the control group (P < 0.05).
Basic information and biochemical experimental indicators between-group variation.

Note. Compared with the control group: *P < 0.05,**P < 0.01.
Analysis of face and tongue image feature differences between disease group and control group
All subjects’ facial image indicators can be shown in Table 2 and the tongue image indicators can be shown in Table 3, In terms of facial indicators, the F-L and F-Y indicators of facial brightness in the glucose and lipid metabolism disease group were significantly lower than those in the control group, F-b was significantly higher than that in the control group, and F-Cr was lower than that in the control group. The brightness indicators L-L and L-Y in the disease group were significantly lower than those in the control group, and L-a and L-b, L-Cr was higher. In terms of tongue image indicators, the glucose and lipid metabolism disease group had lower levels of TB-L, TB-Y, and TC-L, TC-Y, which represent the brightness of tongue texture, compared to the control group. The disease group had significantly higher levels of TB-a, TC-a, TB-b, and TC-a compared to the control group. The perAll in the disease group was significantly reduced compared to the control group.
Facial indicators between-group variation.
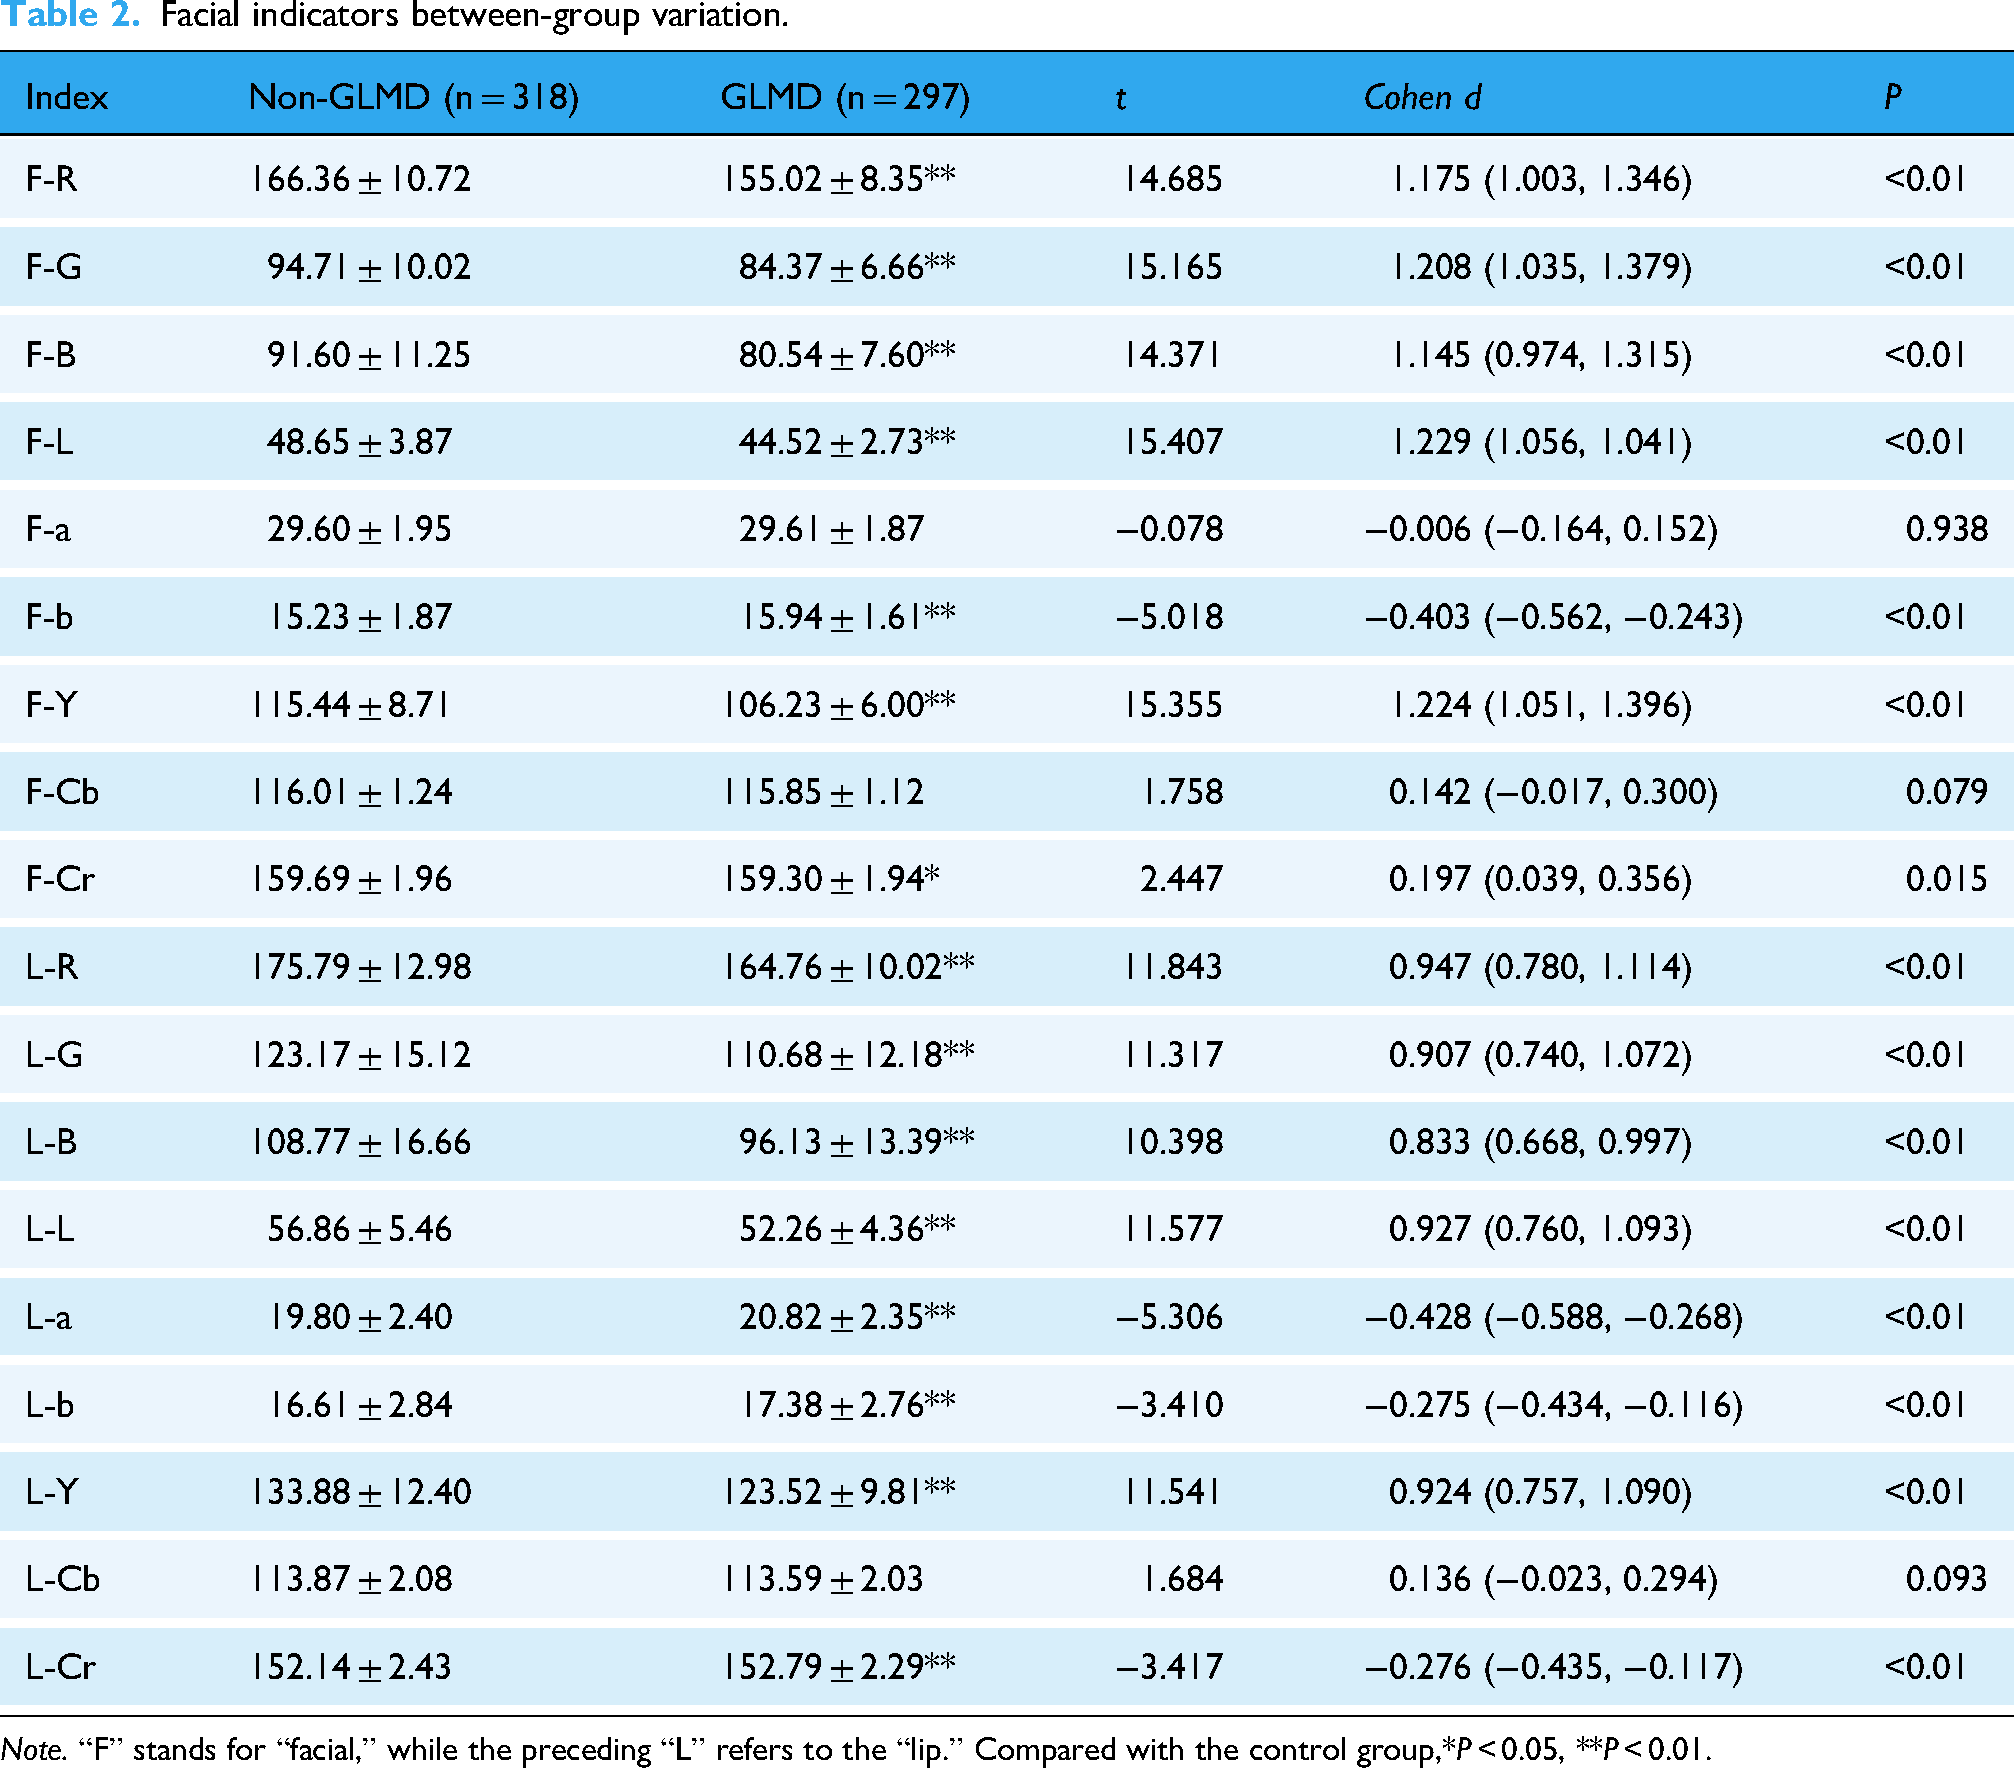
Note. “F” stands for “facial,” while the preceding “L” refers to the “lip.” Compared with the control group,*P < 0.05, **P < 0.01.
Tongue indicators between-group variation.

Note. “TB” refers to the tongue body, and “TC” refers to the tongue coating. Compared with the control group: *P < 0.05, **P < 0.01.
Analysis of the correlation between tongue surface indicators and laboratory examination of diseases
This study analyzed tongue and facial indicators of 297 GLMD patients and 318 nondisease control group members (Figures 3–5). The results indicate that facial indicators are correlated to varying degrees with various biochemical indicators, which can be seen in Figure 6. LDL is most correlated with F-L and F-Y, with correlation coefficients of −0.30 (P < 0.05) and the correlation coefficients between LDL with L-L and L-Y is −0.24. That means with the increase of LDL, the gloss of face and lips will decrease the correlation coefficient between CHO and F-L, F-Y is −0.27, and the correlation coefficient with L-L, L-Y is −0.21. The correlation coefficient between TG and F-Y is −0.25, and the correlation coefficient with L-L, L-Y is −0.22. So, the gloss of face and lips is negatively correlated with TG, CHO.
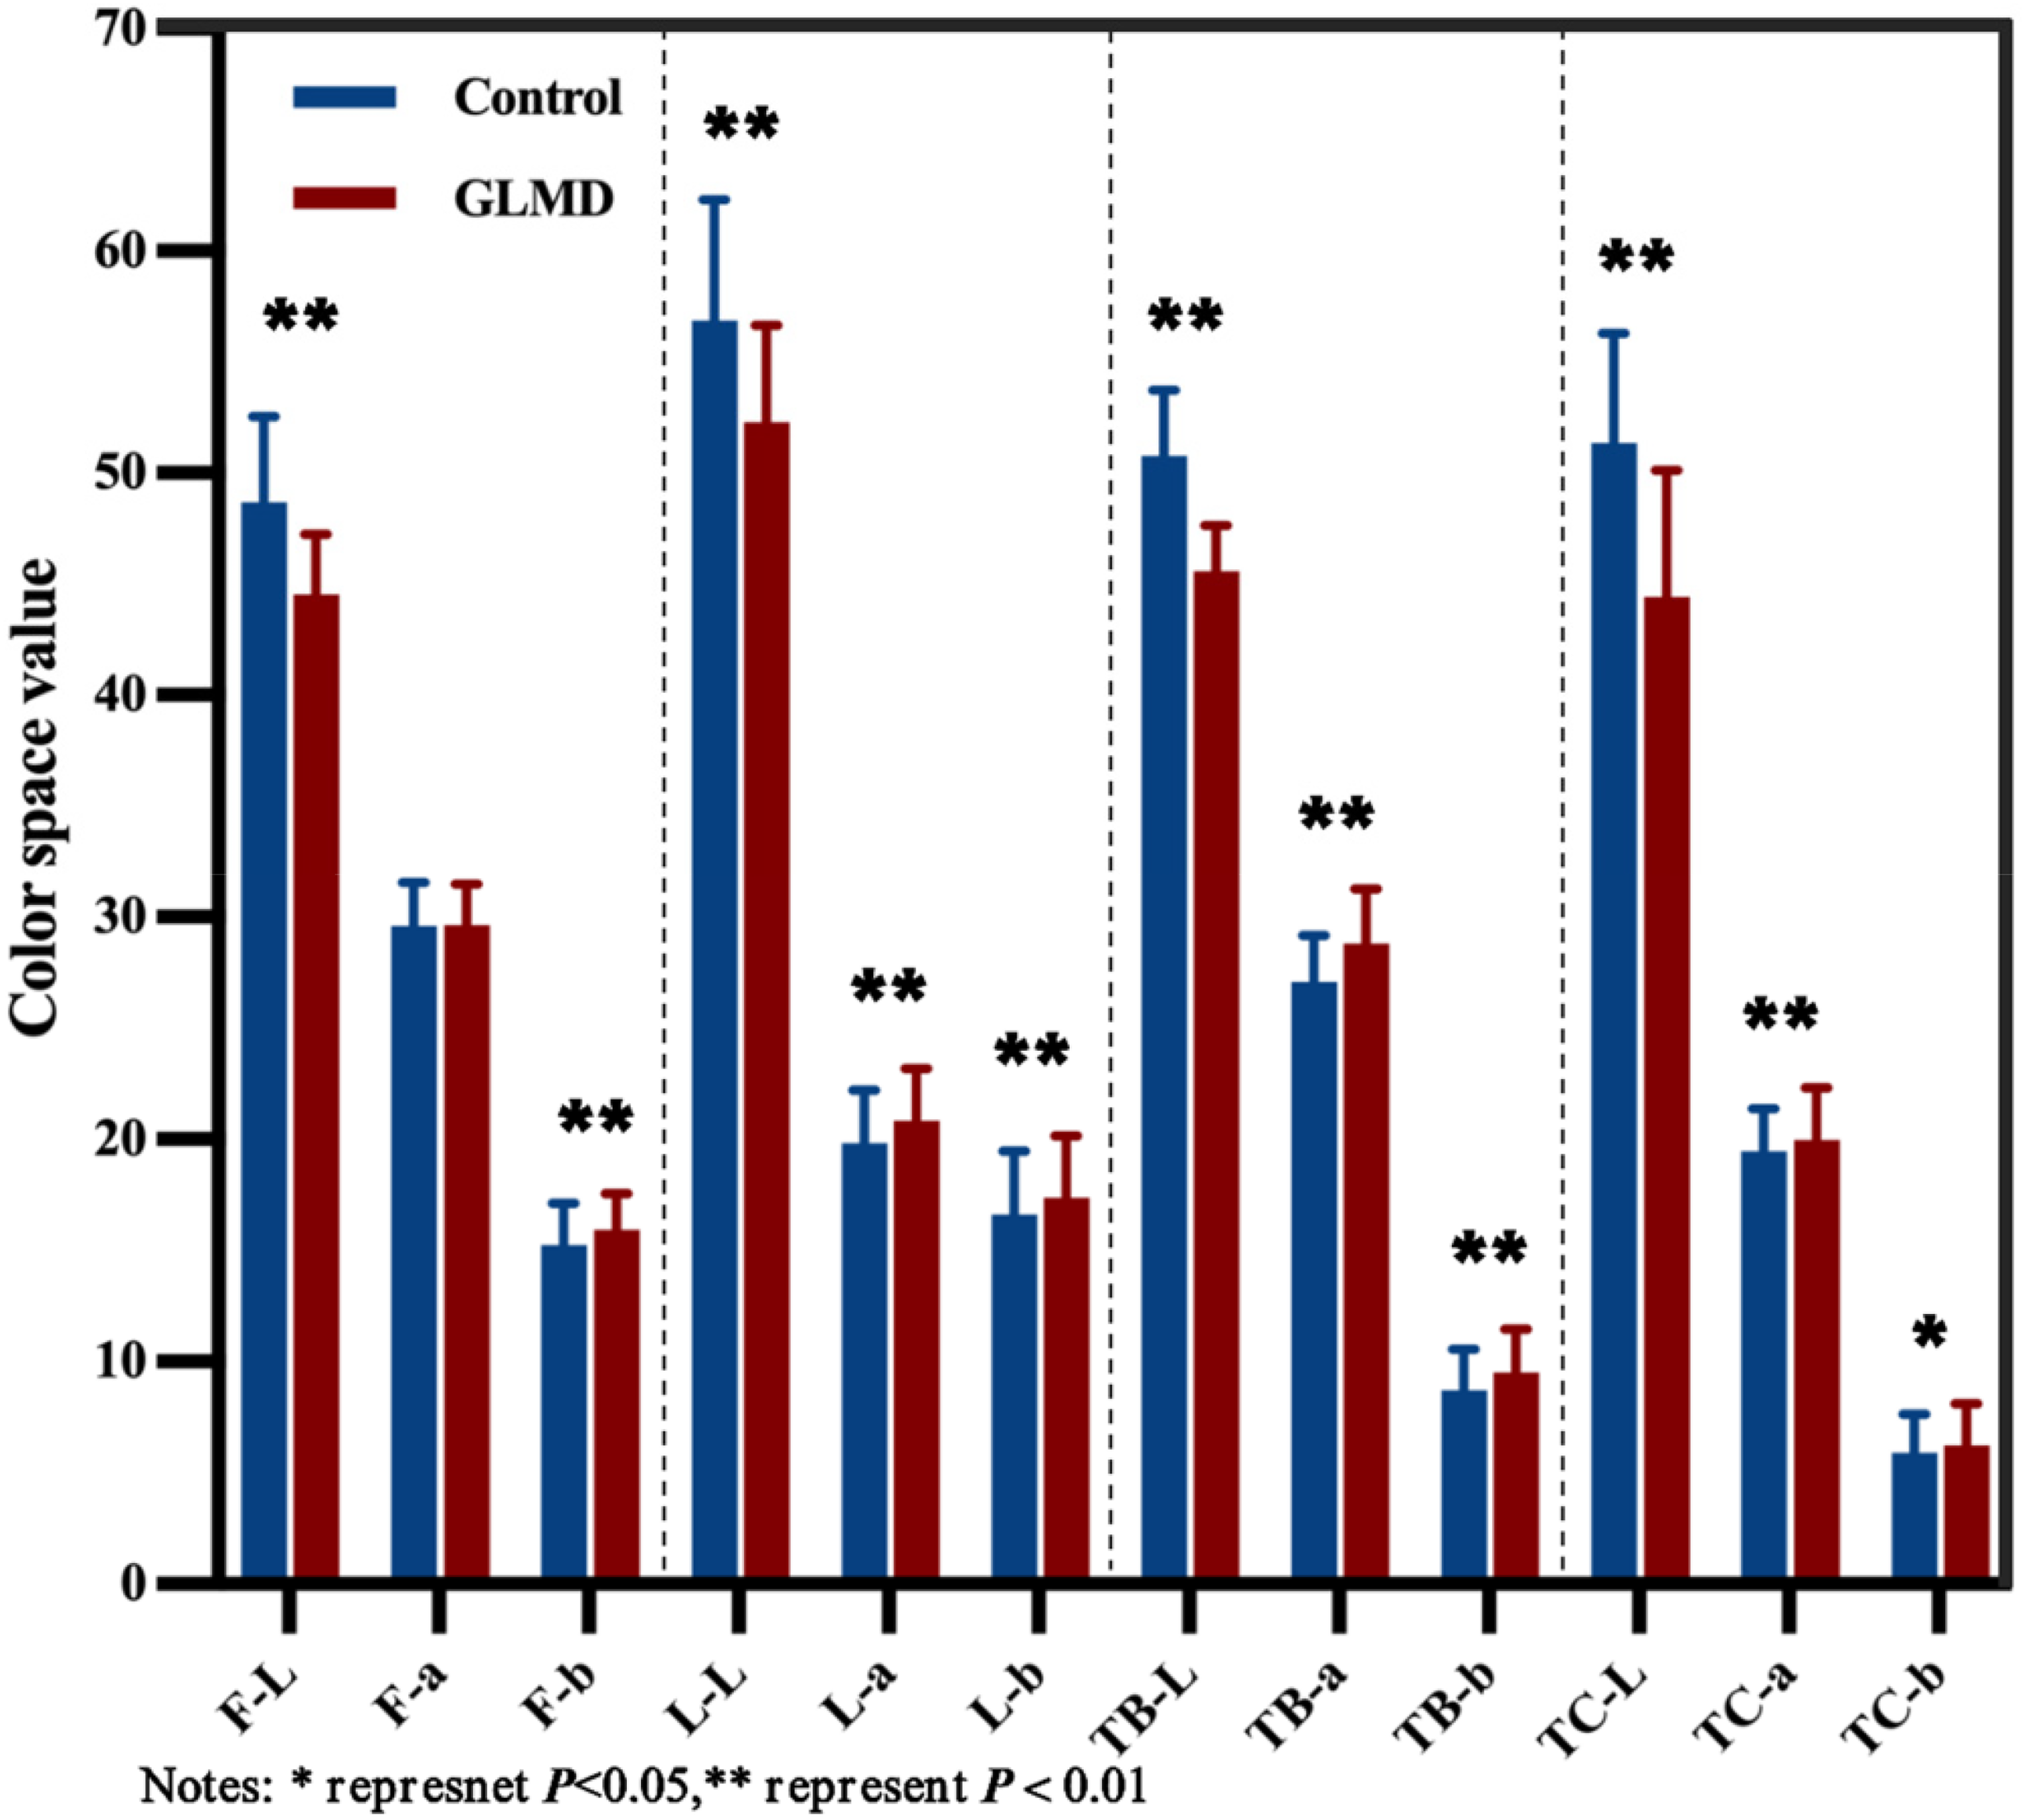
Performance of face and tongue indicators in lab color space.
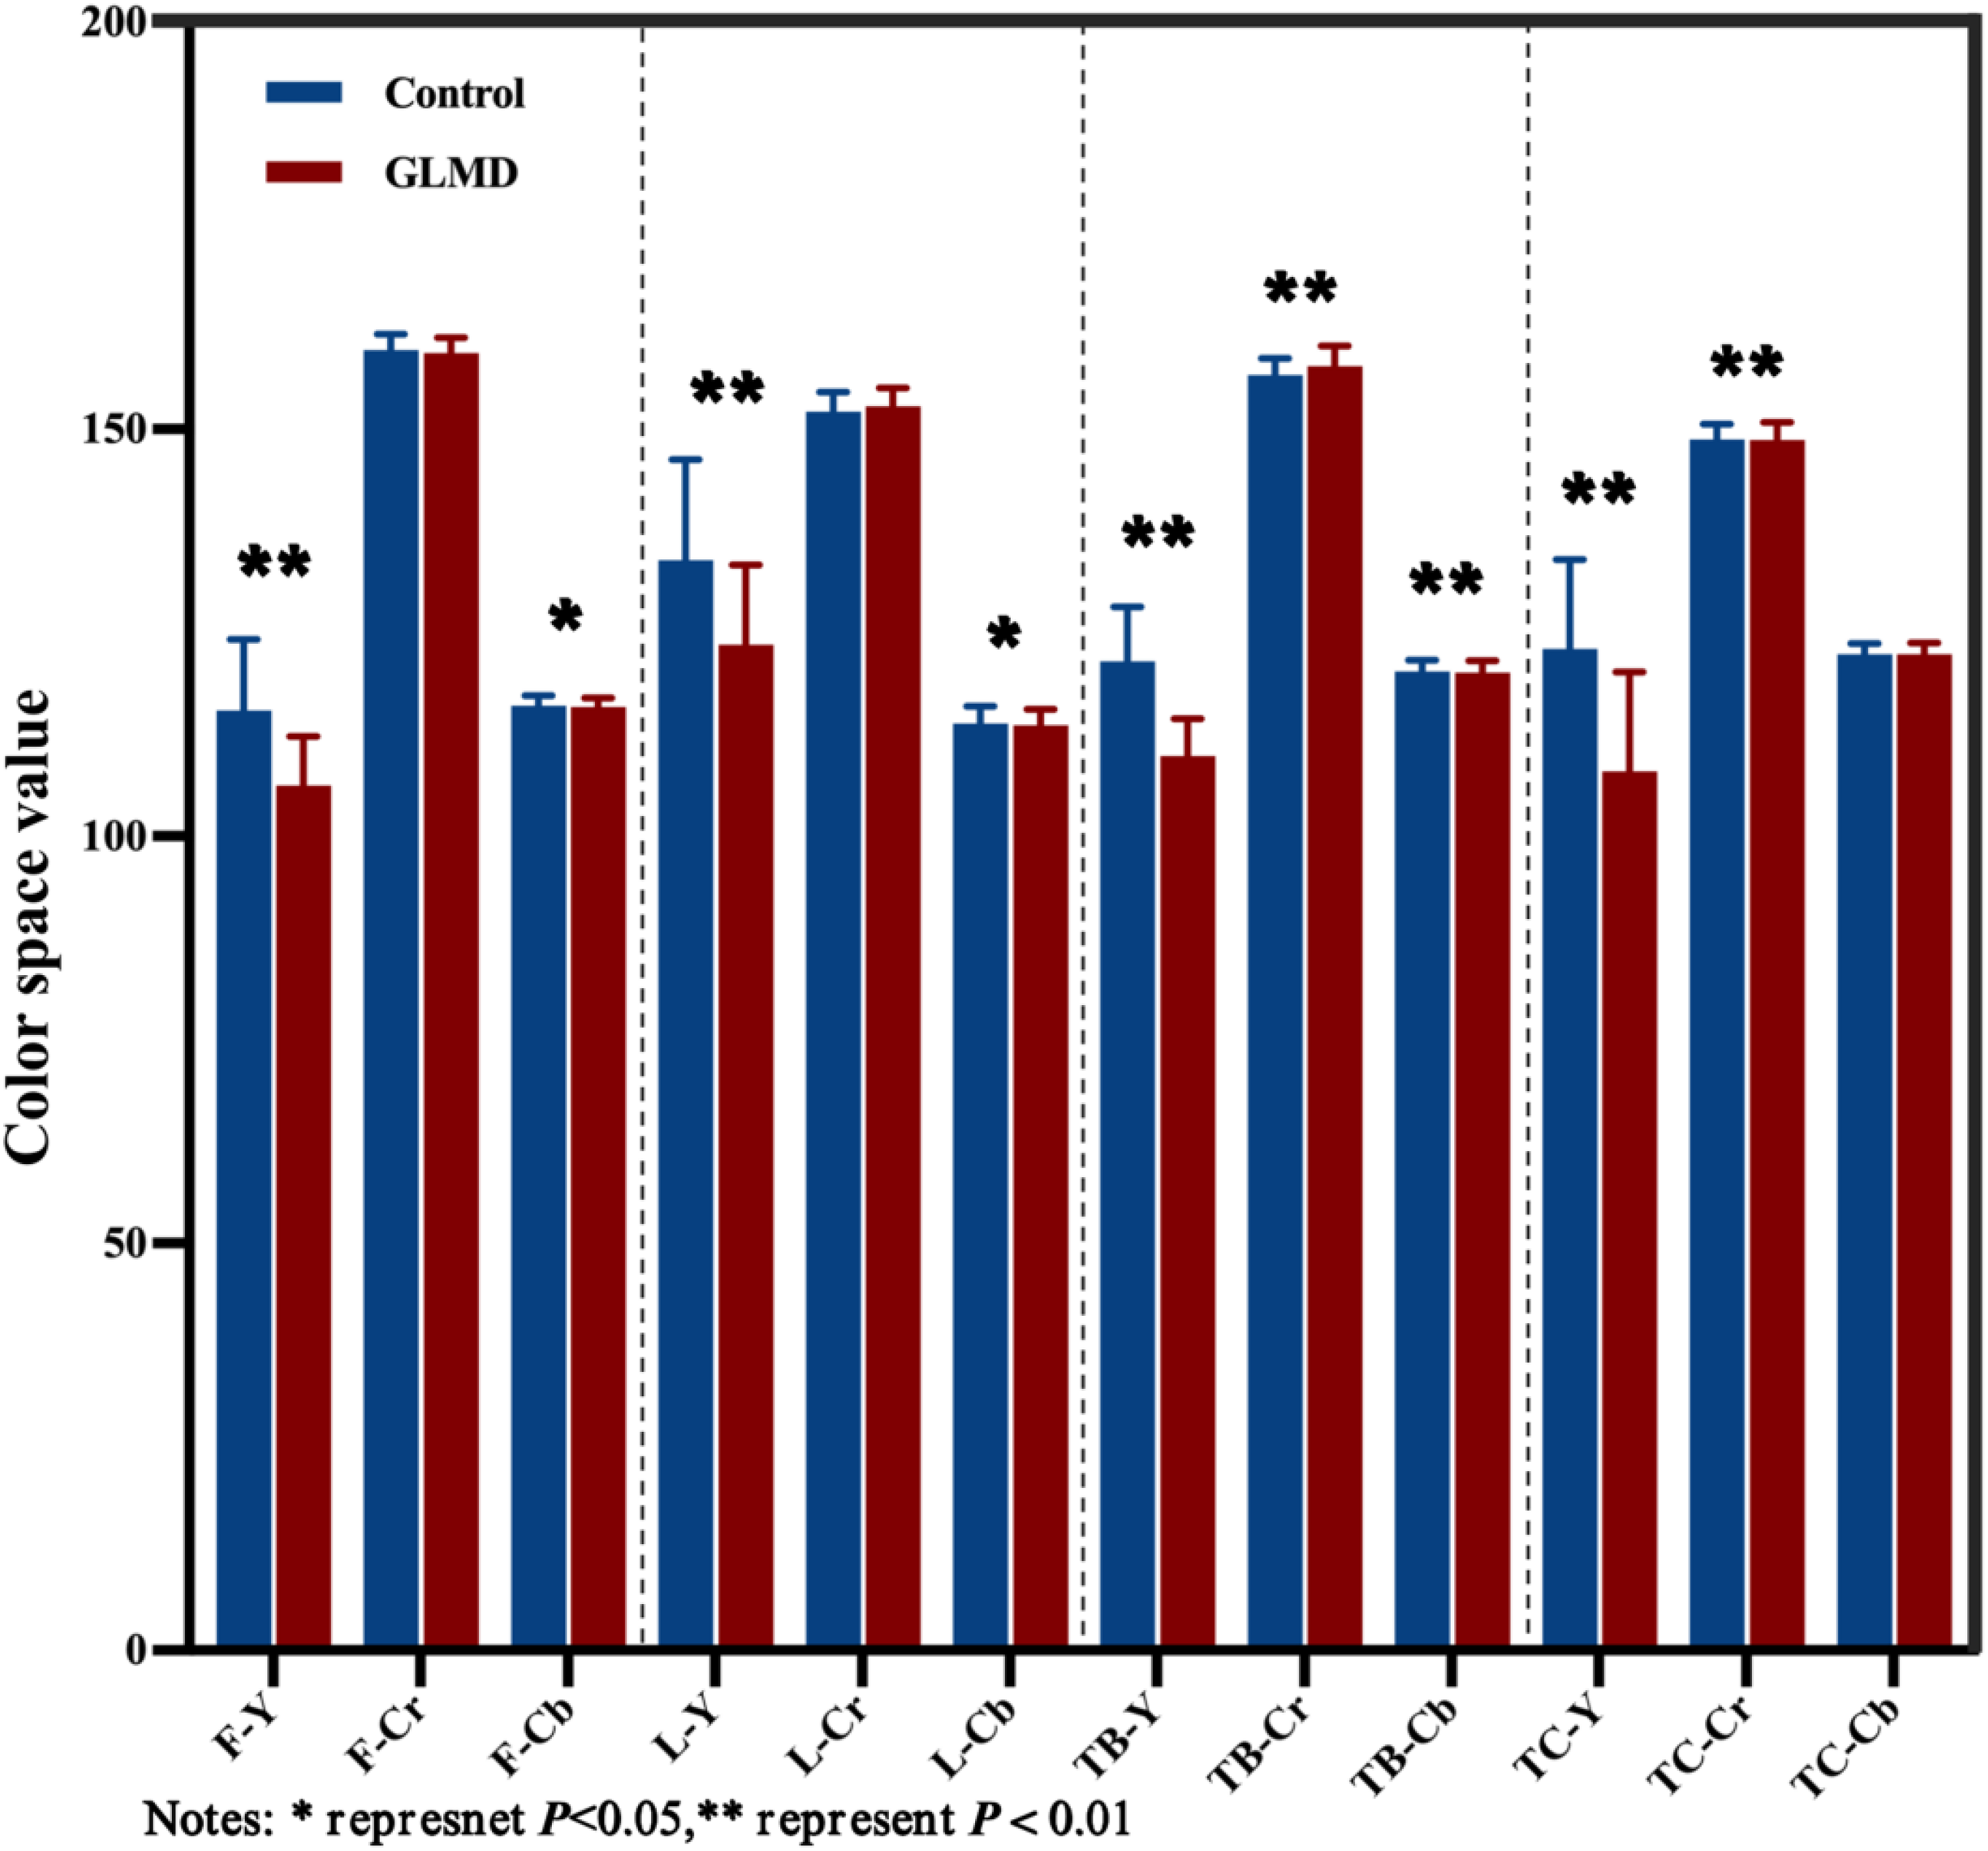
Performance of face and tongue indicators in YCrCb color space.

Tongue image texture expression.

Heat map of correlation between facial indicators and laboratory parameters.
As shown in Figure 7, tongue image indicators are correlated with most biochemical indicators. LDL has the highest correlation with TB-L and TB-Y, with correlation coefficients of −0.44 (P < 0.05), followed by TC-L (−0.36) and TC-Y (−0.36); CHO is highly correlated with TB-L (−0.40) and TB-Y (−0.40), followed by TC-L (−0.33) and TC-Y (−0.33). TG is negatively correlated with TB-L (−0.31), TB-Y (−0.31), and TC-L (−0.24). In summary, as the increase of LDL, CHO, TG, the luster of tongue darkens. Besides, we conducted logistic regression analyses accounting for the indicators, as shown in Supplementary Table B.

Heat map of correlation between tongue indicators and laboratory parameters.
We separately incorporated facial and tongue indicators to construct a machine learning diagnostic model for glucose and lipid metabolism diseases based on tongue indicators. By comparing the performance of each model and the contribution of each indicator included in the model, we further explored the deep connection between tongue indicators and glucose and lipid metabolism diseases. Model 1 incorporates facial indicators based on all color space, while Model 2 incorporates facial and tongue indicators based on all color space.
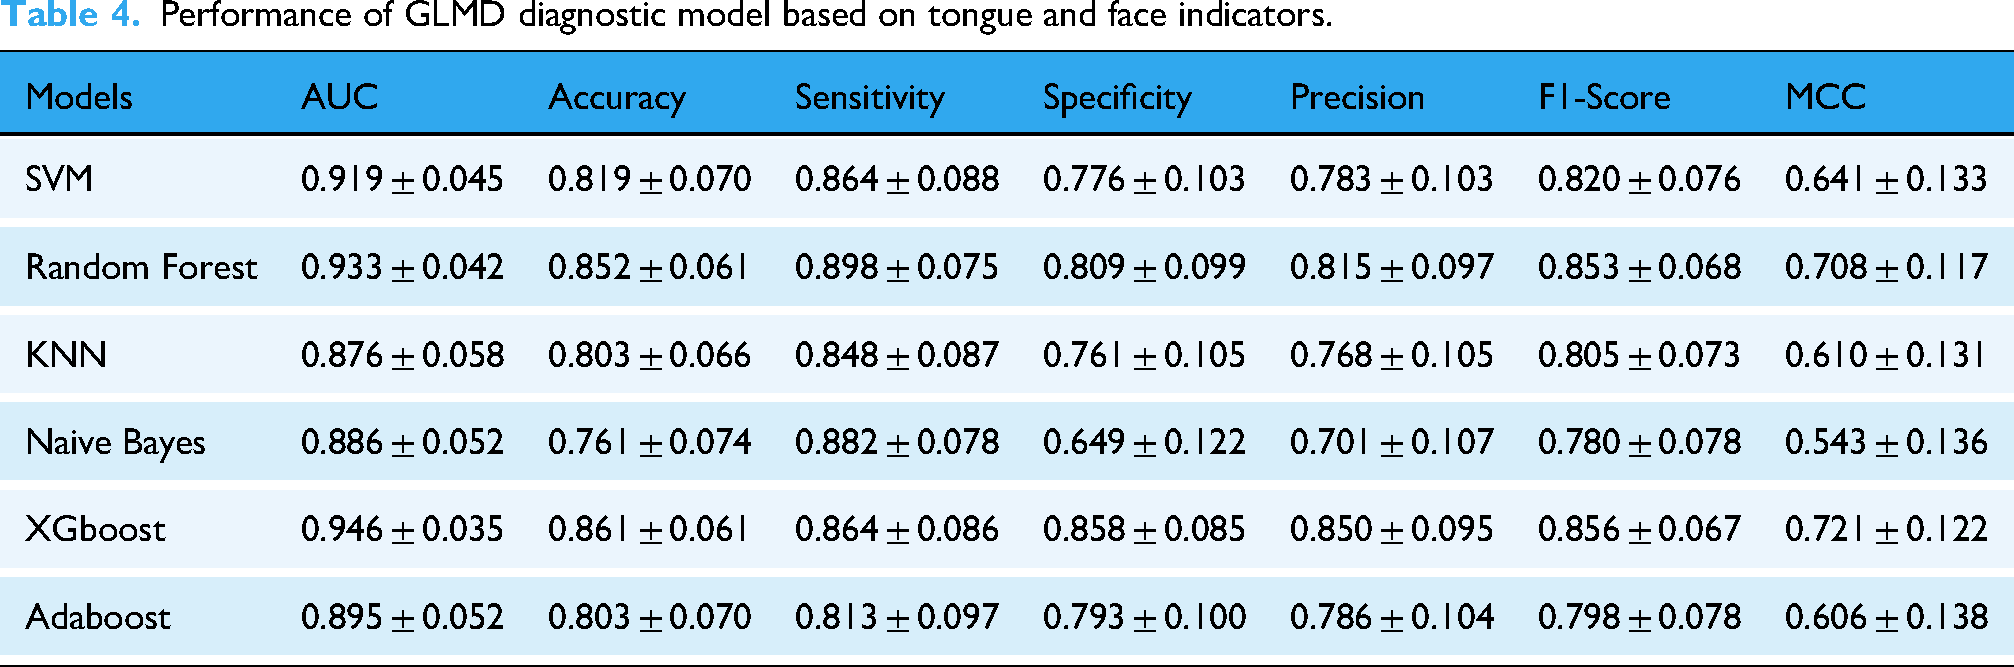
In Model 2, XGBoost performed the best with an AUC of 0.946, accuracy of 0.861, and sensitivity of 0.864, followed by Random Forest with an AUC of 0.933, ACC of 0.852, and sensitivity of 0.898. SVM had an AUC of 0.919, accuracy of 0.819, and sensitivity of 0.864; Adaboost had an AUC of 0.895, accuracy of 0.803, and sensitivity of 0.813; NaiveBayes had an AUC of 0.886, accuracy of 0.761, and sensitivity of 0.882; KNN had an AUC of 0.876, accuracy of 0.803, and sensitivity of 0.848. The ROC curves of all models and the confusion matrices based on tongue surface index parameters are shown in Figure 8 and Table 4.

GLMD classification model based on face and tongue image indicators. (a) Diagnosis model of GLMD based on facial parameters and (b) diagnosis model of GLMD based on facial and tongue parameters.
Performance of GLMD diagnostic model based on tongue and face indicators.
Besides, given the sample size constraints, we additionally report the counts and model performance for two major subtypes, dyslipidemia-only (subtype 1) and MASLD-only (subtype 2). The results can be found in Supplementary Tables C and D.
In the subsequent diagnostic model, the addition of tongue image indicators greatly improved the diagnostic accuracy of the model. In the SHAP model interpreter (Table 5 and Figure 9), 37 TB-Y showed the largest mean absolute SHAP value, indicating that tongue brightness was the most influential feature for the model's predictions. In our study, TB-Y was associated with lipid-related biochemical indicators (LDL, CHO, and TG), suggesting that the model may capture metabolic-risk signals reflected in these measures. TB-S and TB-G also made meaningful contributions to the prediction.
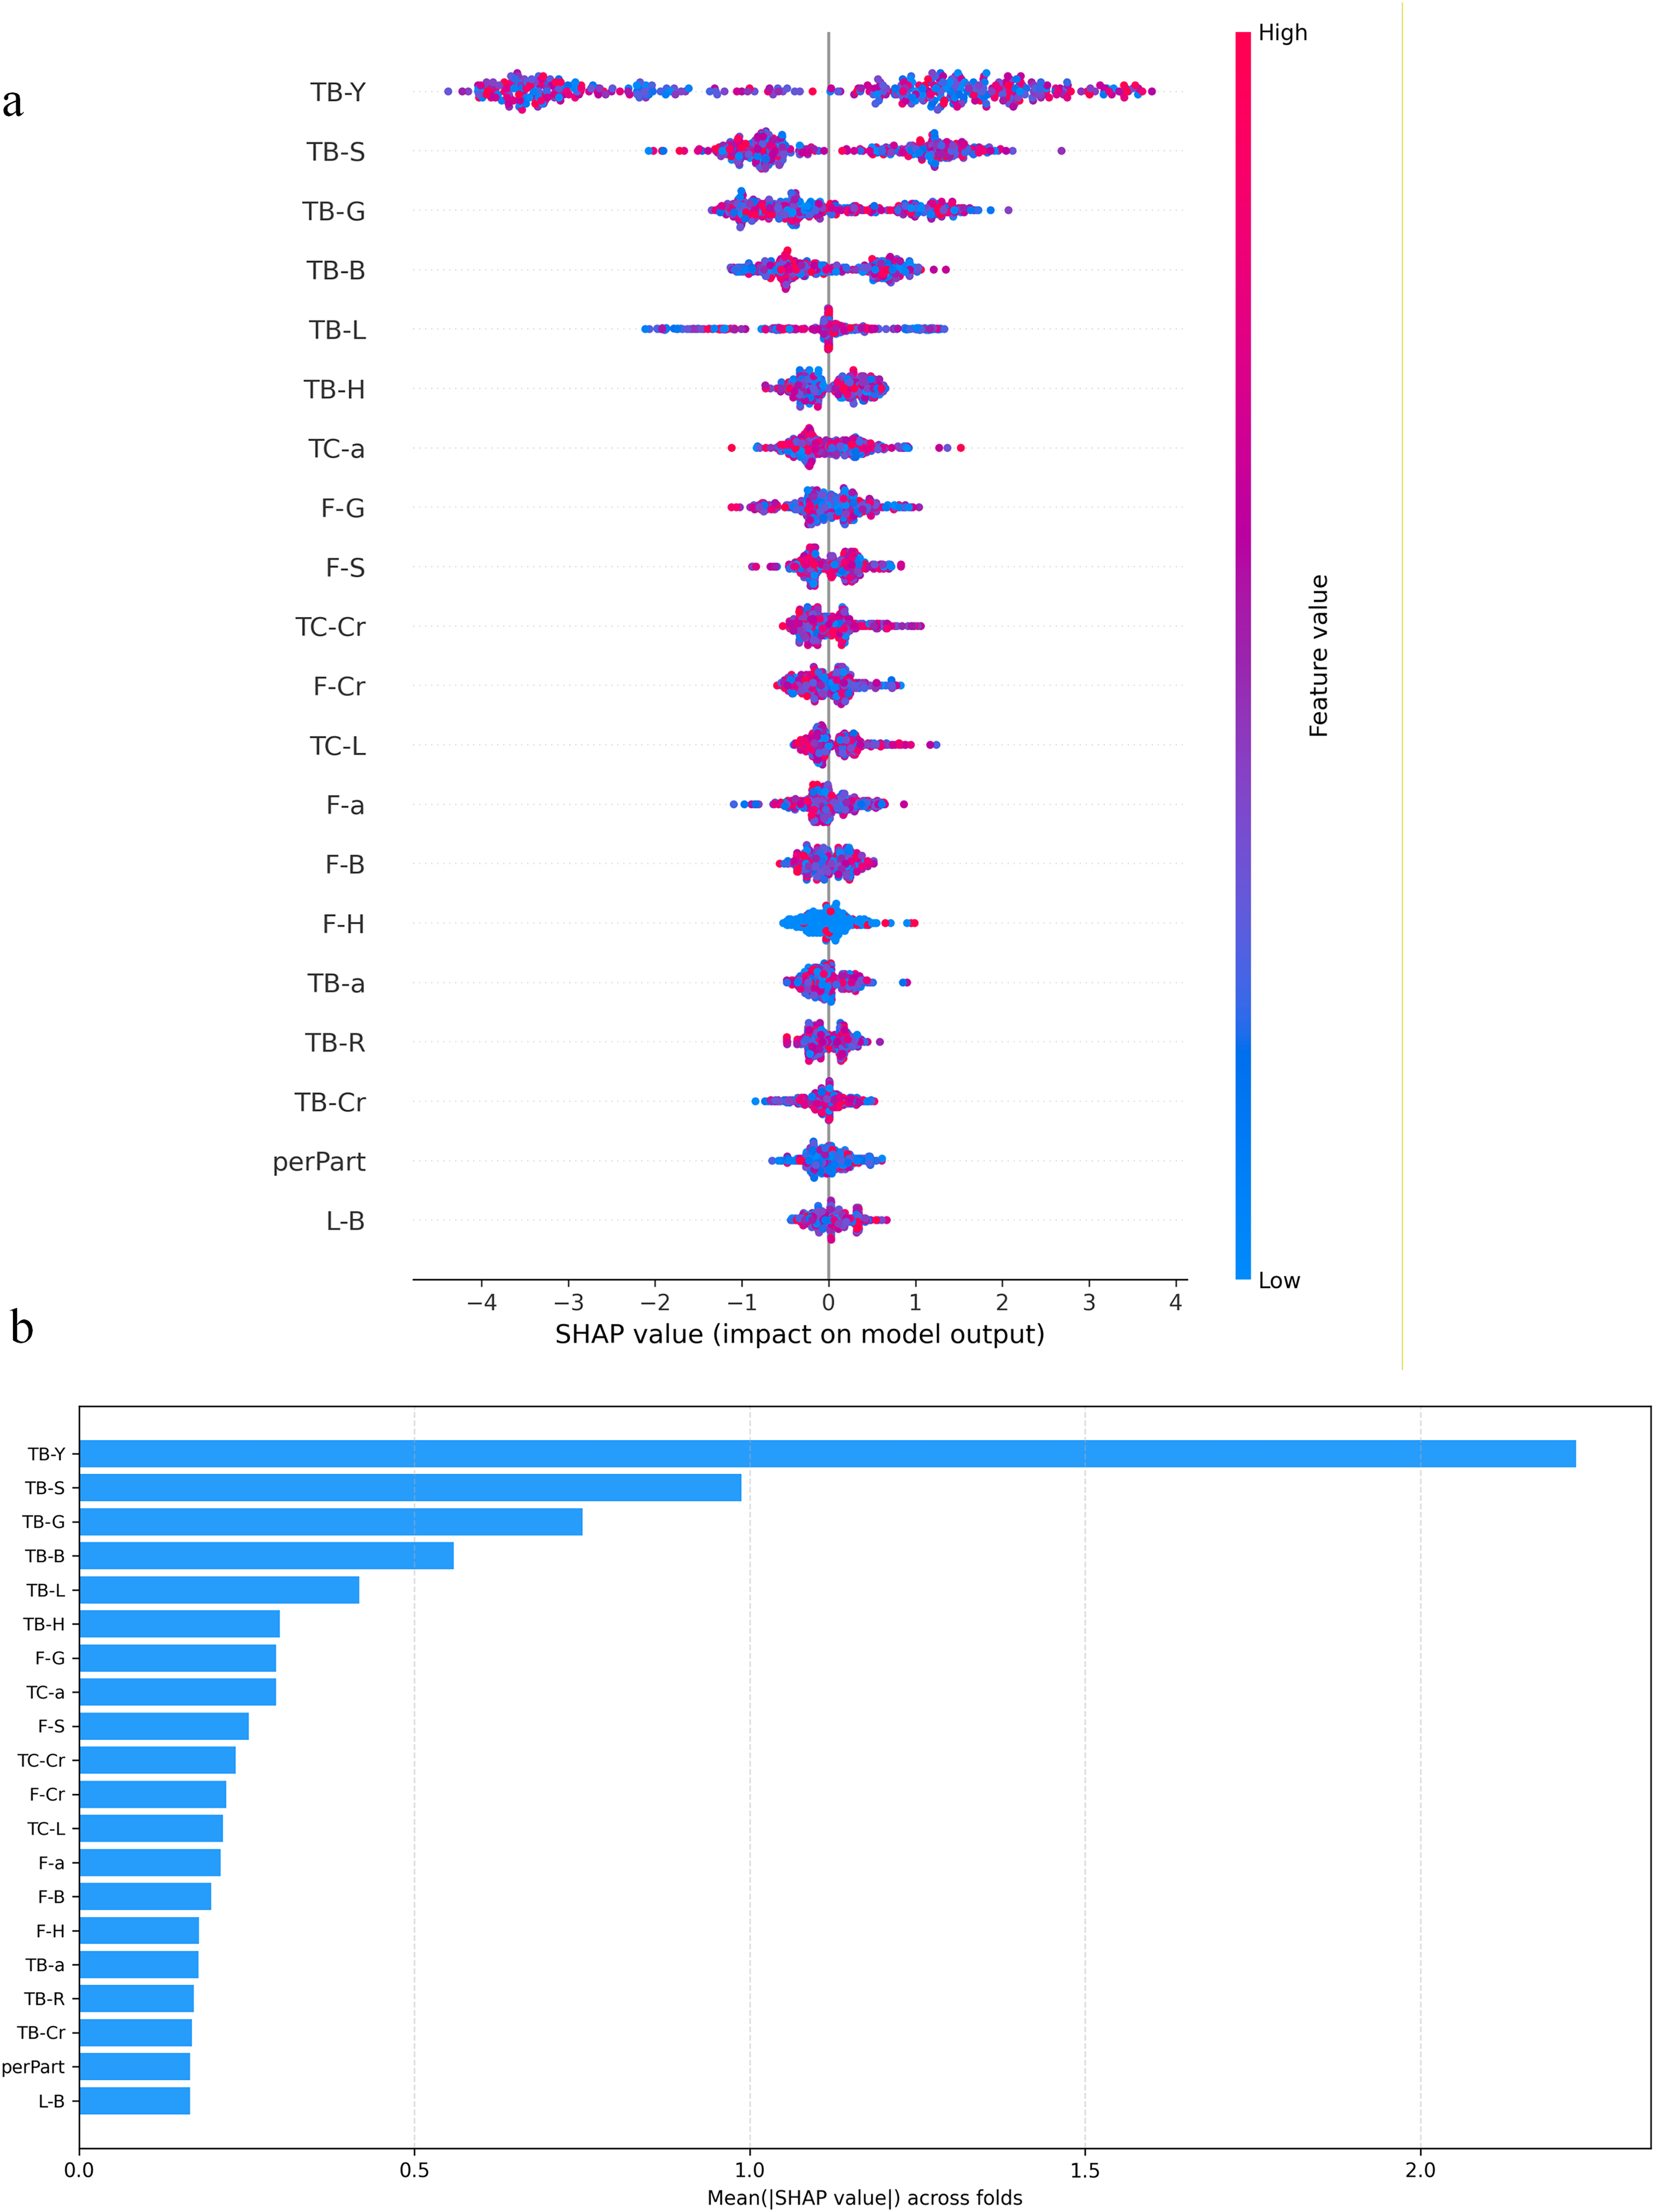
SHAP chart of model contribution. (a) Visualization of model indicator contribution and (b) distribution of SHAP values for model indicators.
Top10 SHAP variance of main features.

Discussion
The development and prosperity of human society have been accompanied by an increasing prevalence of metabolic disorders. In recent years, the incidence of glucolipid metabolic diseases has risen sharply, gradually becoming a major public health problem concern that threatens human health. Modern lifestyle characterized by high sugar and fat intake, coupled with physical inactivity, have led to a doubling of obesity rates. 9 Consequently, glucolipid metabolic diseases and their associated complications have emerged as serious health challenges for society. The diagnosis of glucolipid metabolic diseases 38 typically relies on laboratory biochemical tests, imaging examinations, pathological examinations, and other procedures. However, the rapidly increasing incidence of such diseases has imposed a substantial burden on healthcare systems, while invasive diagnostic methods also carry a risk of infection. Therefore, there is an urgent need to develop convenient, effective, and noninvasive diagnostic approaches. 39
In medical image processing, the advantage of DeepLabv3+ demonstrates strong adaptability and robustness to complex medical images, effectively handling challenges such as noise, low contrast, and irregular shapes in images. 40 Its depth wise separable convolution design significantly reduces computational complexity, allowing the model to achieve efficient inference speeds without compromising accuracy, which makes it particularly suitable for clinical deployment. 41 Furthermore, with its unique encoder-decoder structure and the Atrous Spatial Pyramid Pooling (ASPP) module, DeepLabv3+ can effectively capture multiscale contextual information in medical images while preserving fine spatial details, enabling high-precision segmentation of target areas. By integrating a powerful backbone network with other backbone networks and flexible model structures, DeepLabv3+ provides an efficient and reliable solution for medical image segmentation.
This study developed a new method based on DeepLabV3+ to extract facial and tongue image parameters and conducted a correlation analysis between tongue surface involvement and clinical examination. We found that the F-L, F-Y, and F-Cr in the disease group were lower than those in the control group, whereas the F-b was significantly higher. These results indicate that the proportion of yellow color in the facial color of the disease group was higher, while the proportion of red color was lower. For the lip image indicators, the brightness parameters L-L and L-Y in the disease group were significantly lower than those in the control group, whereas the color indicators L-a, L-Cr, and L-b was higher. This suggests that the lip brightness in the disease group was reduced, accompanied by increased red and yellow color components. Regarding tongue image indicators, the disease group showed lower values than the control group for parameters representing tongue texture brightness such as TB-L and TB-Y, as well as tongue coating brightness such as TC-L and TC-Y. In contrast, the TB-a, TC-a, TB-b, and TC-a were significantly higher in the disease group, indicating that the tongue texture and coating were brighter and richer in red and yellow tones compared with the control group. These findings are consistent with the results reported by Li et al. 16 In addition, we found that the brightness parameters of the face and tongue were closely correlated with blood components such as LDL, CHO, and TG, which is consistent with the research showing that increased adipose tissue significantly affect plasma and blood viscosity. 42 Our study also demonstrated that metabolic status in GLMD was associated with facial and tongue features, consistent with the findings of Wen et al. 43 who reported that these features were related to metabolic status, renal and hepatic, cardiac, and thyroid function, as well as to blood cell proportions and Hb levels in patients with T2DM.
In the diagnosis model of GLMD based on facial and tongue parameters, the XGBoost model hat incorporated both sets of indicators achieved a classification accuracy of 86.13%. Among all features, the brightness indicators TB-Y, TB-S, and TB-G ranked among the top three in terms of model contribution, indicating that tongue surface parameters can serve as effective indicators for noninvasive diagnosis of diseases. As a traditional diagnostic basis in traditional Chinese medicine, tongue images can express various pathological information and are less susceptible to external environmental influences compared to facial expressions. Therefore, the inclusion of tongue image parameters significantly improves the diagnostic accuracy of the model. In modern medicine, machine learning has been widely applied to disease diagnosis and prediction. Its ability to detect subtle variations in human facial expressions enables it to support the diagnosis and clinical evaluation of a wide range of neurological disorders. 44 Among various algorithms, XGBoost stands out for its capacity to model complex nonlinear relationships and handle high-dimensional data, making it a preferred choice for prediction tasks. Combining strong accuracy with good interpretability, it serves as a valuable decision-support tool for clinicians. In disease diagnosis, XGBoost can build risk prediction models from clinical and laboratory data, offering efficiency and robustness in managing missing values and noise common in medical datasets. Furthermore, its interpretability provides transparent decision support for doctors and the algorithm has been successfully applied in various fields such as disease prediction, 45 cancer classification, 46 heart disease risk assessment, 47 and disease prognosis analysis. 48 Notably, Nguyen Hai Minh et al. 49 found that XGBoost was the most suitable model for assisting in the diagnosis of colorectal cancer.
This study still has certain limitations. Glucolipid metabolic diseases are involving multiple factors. Therefore, regional, environmental, dietary, and individual differences should be taken into account. Future studies should include a broader sample collection from both northern and southern regions to enhance the representativeness of the data. 23 Since the current dataset was obtained from physical examination units, there was a significant difference in the male-to-female ratio. Hence, future research should aim to achieve a more balanced gender distribution. Moreover, because the model is trained and validated using single-center data, its generalizability remains limited. Therefore, the current findings should be interpreted as an internal proof-of-concept, and real-world clinical utility will require prospective evaluation in routine workflows and independent external validation across different centers, populations, and devices. Besides, a limitation is that GLMD was defined as a composite outcome and pooling these clinically distinct conditions may mask disease-specific patterns and reduce interpretability. Nevertheless, we have done our best to include variables and to evaluate performance using a rigorous internal validation strategy to minimize the risk of overfitting. Future studies will conduct multicenter, multidevice testing and prospective validation across diverse populations and real-world acquisition settings to confirm robustness and generalizability. In addition, epigenetic mechanisms 36 have been proven to play a role in the occurrence of glucolipid metabolic diseases. As suggested by a previous study, 50 tongue characteristics are related to microbial metabolism. Therefore, future research on multimodal diagnostic models for glycolipid metabolic diseases can consider incorporating analyses at the micro genetic level and integrating multiomics data.51,52 Future studies may integrate tongue and facial indicators with oral and gut microbiome profiles to jointly train a more accurate and multidimensional model for assisting in the diagnosis of glucolipid metabolic diseases.
Conclusions
This study shows that the new method of extracting facial and tongue image parameters based on deeplabv3+ can help to establish the diagnosis model of glucolipid metabolic disorders. The diagnosis model of glucolipid metabolic disorders based on XGBoost, which includes the tongue indicators, can effectively classify the disease. In addition, we can further improve the accuracy of noninvasive diagnosis of glucose and lipid metabolism diseases by combining the traditional Chinese medicine diagnosis technology of modern informatics.
Supplemental Material
sj-docx-1-dhj-10.1177_20552076261435866 - Supplemental material for Intelligent tongue and facial image analysis for noninvasive prediction of glucolipid metabolic disorders
Supplemental material, sj-docx-1-dhj-10.1177_20552076261435866 for Intelligent tongue and facial image analysis for noninvasive prediction of glucolipid metabolic disorders by Shi Liu, Zhanhong Chen, Yang Gao, Jialin Deng, Ruomeng Hu, Xin Tan, Tao Jiang and Jiatuo Xu in DIGITAL HEALTH
Footnotes
Acknowledgments
Not applicable.
Ethical considerations
This study has been approved by the ethics committee of Shuguang Hospital Affiliated to Shanghai University of TCM. The ethics committee number is 2018-599-28-01.
Consent to participate
All participants signed a written informed consent form that was approved by the Ethics Committee of Shuguang Hospital Affiliated to Shanghai University of Traditional Chinese Medicine. All subjects agree for publication of identifying information and images in an online open-access publication.
Consent for publication
Not applicable.
Author contributions statement
Tao Jiang and Jiatuo Xu designed the experiments and reviewed and edited the manuscript. Zhanhong Chen participated in the experiments, provided visualization, and reviewed and edited the manuscript. Shi Liu participated in the experiments, analyzed the data, and wrote original manuscript. Jialin Deng was responsible for data management. Ruomeng Hu and Yang Gao assisted in collecting clinical samples. Xin Tan provided the technical support and advices for the study. Zhanhong Chen and Shi Liu contributed equally to this work. All authors read and approved the final manuscript.
Guarantor
Tao Jiang and Jiatuo Xu are the guarantors.
Funding
The authors disclosed receipt of the following financial support for the research, authorship, and/or publication of this article: The research, authorship, and publication of this article were financially supported by National Science and Technology Major Project(2025ZD0545001),the National Natural Science Foundation of China (82104738), the General Project of China Postdoctoral Science Foundation (2023M732337), the High-level Key Discipline Construction Project of Traditional Chinese Medicine by the National Administration of Traditional Chinese Medicine (ZYYZDXK-2023069), Shanghai Municipal Health Commission (20244Y0129), and the “Youth Talent Support Project” by the China Association of Chinese Medicine (2025-QNRC2-B15).
Declaration of conflicting interests
The authors declared no potential conflicts of interest with respect to the research, authorship, and/or publication of this article.
Data availability statement
The publicly available research data generated by this study are included in this article. The rest of the data are from the national key R&D projects funded by science and technology of the China and are temporarily closed to the public according to the project regulations. The data can be obtained with reasonable requests by contacting the corresponding author.
Supplemental material
Supplemental material for this article is available online.