
Abstract
Background and objective
Polycystic ovary syndrome is one of the most common types of endocrine and metabolic diseases in women of reproductive age that needs to be screened early and assessed non-invasively. The objective of the current study was to develop prediction models for polycystic ovary syndrome based on data of tongue and pulse using machine learning techniques.
Methods
A dataset of 285 polycystic ovary syndrome patients and 201 healthy women were investigated to identify the significant tongue and pulse parameters for predicting polycystic ovary syndrome. In this study, feature selection was performed using least absolute shrinkage and selection operator regression. Several machine learning algorithms (multilayer perceptron classifier, eXtreme gradient boosting classifier, and support vector machine) were used to construct the classification models to predict the presence of polycystic ovary syndrome.
Results
TB-L, TB-a, TB-b, TC-L, TC-a, h3, and h4/h1 in tongue and pulse parameters were statistically associated with polycystic ovary syndrome presence. Among the several machine learning techniques, the support vector machine model was optimal for the comprehensive evaluation of this dataset and deduced the area under the receiver operating characteristic curve, DeLong test, calibration curve, and decision curve analysis.
Conclusion
The machine learning model with tongue and pulse factors can predict the existence of polycystic ovary syndrome precisely.
Introduction
Polycystic ovary syndrome (PCOS) is the most common endocrine disease in women of childbearing age, affecting 6%–13% of females worldwide.1–4 It has diverse clinical manifestations as it is a heterogeneous syndrome of systemic neuro-endocrine-metabolic network disorders. 5 The main symptoms are ovulatory and menstrual with high androgen levels, depression, and other mood disturbances.6,7 Some studies have shown that PCOS is a lifelong metabolic disorder with evidence of the increased prevalence of insulin resistance, metabolic syndrome, cardiometabolic disease, and endometrial cancer.8–10 Therefore, early screening of PCOS is essential to treat the disease and prevent its long-term complications. Currently, the diagnosis of the syndrome relies on ultrasonography and serology. Since the results of these methods are related to the women's menstrual cycle, and there are strict requirements on the detection time, the degree of patient cooperation is low. Tongue and pulse diagnoses in Traditional Chinese Medicine (TCM) are convenient and noninvasive detection methods that provide objective reference indicators for the diagnosis and treatment of the disease. Therefore, it is necessary to establish a PCOS risk prediction model based on tongue and pulse diagnosis data.
Tongue diagnosis and pulse diagnosis are essential components of TCM diagnosis. Doctors infer the occurrence and development of the disease by observing the tongue, tongue coating, and pulse. With the development of computer technology, many studies have been carried out on the acquisition and simulation of TCM pulse and tongue diagnoses. Current research determined that tongue and pulse are closely related to digestive, endocrine, and circulatory diseases.11–13 There is also progress in female tongue and pulse research. Hsieh et al. 14 found differences in tongue color during the menstrual cycle in women. Another study suggested that there was a close relationship between the performance of the tongue and pulse in women and the incidence of coronary heart disease. 15 Thus, tongue and pulse conditions could be used to assess the physical condition of women.
Machine learning, a broad branch of artificial intelligence, is a multifield interdisciplinary subject involving probability theory, statistics, and computer science, and is widely used in various fields. The application of machine learning in clinical medicine simplifies the decision-making for doctors. Rubio et al. 16 used the logic model as a decision support system in the clinic, where the algorithm provided a decision analysis of the care trajectories of patients. Artificial intelligence and statistical analysis can be applied to identify and predict medical patterns from the extensive data of patients, and machine learning algorithms can be used to predict certain diseases based on tongue and pulse data. Li et al. 17 used the Stacking and ResNet50 models to predict type 2 diabetes based on tongue images. Shi et al. 18 used the neural network to establish a model for fatigue classification based on tongue and pulse data. Zhang et al. 19 proposed a Bayesian network-based classification system to diagnose cor pulmonale, appendicitis, gastritis, pancreatitis, and bronchitis.
The present study aimed to establish a noninvasive and convenient PCOS prediction model and evaluate the ability of tongue and pulse parameters combined to predict PCOS risk. This study used different machine learning to determine the accurate estimated scores for PCOS predictions by the proposed independent risk factors.
Material and methods
Study subjects
This retrospective study used a dataset of 285 patients diagnosed with PCOS. Data were collected from The Shuguang Hospital Affiliated with the Shanghai University of TCM, China. All patients were evaluated according to the 2003 Rotterdam diagnostic criteria. 20 We also enrolled 201 healthy female volunteers who comprised the control group in the Physical Examination Center of the hospital. The study followed the ethical principles of the Helsinki Declaration of Good Clinical Practice Guidelines. All participants signed informed consent, and the study was approved by the Medical Ethics Committee of Shuguang Hospital Affiliated with Shanghai University of TCM (authorization no. 2018-626-55-01).
Inclusion criteria and exclusion criteria
Inclusion criteria were as follows (2/3 should be fulfilled): The 2003 Rotterdam diagnostic criteria
20
were as follows:
Oligo- and/or anovulation; Clinical and/or biochemical signs of hyperandrogenism; Polycystic ovaries. Cases that did not meet the inclusion criteria of this project; Hyperandrogenism is caused by other causes, such as congenital adrenal hyperplasia, Cushing's syndrome, and androgen-secreting tumors; Other causes of ovulation disorders, such as hyperprolactinemia, premature ovarian failure, pituitary or hypothalamic amenorrhea, and abnormal thyroid function; Patients had taken hormonal medications (such as contraceptives, ovulation stimulants, and glucocorticoids) within the past month; Patients with underlying severe diseases in internal medicine and surgery; Patients who were unable to cooperate with completing the study plan, including those with a history of infectious diseases, mental disorders, and other medical records.
Exclusion criteria were as follows:
Clinical tongue and pulse data collection and analysis method
Tongue and pulse data collection
Tongue and pulse diagnosis data were collected using the TDA-1 tongue diagnosis instrument and PDA-1 pulse diagnosis instrument developed by the Shanghai University of TCM Intelligent Diagnosis Technology Research Team. The collection process was operated by Professional researchers from Shuguang Hospital Affiliated with Shanghai University of TCM. Before tongue data collection, the staff used alcohol cotton balls to wipe the instrument for disinfection and confirmed that the examinee had an empty stomach, a clean mouth, and no foreign matter or stained coating on the tongue. The subjects took the sitting position, put the mandible on the mandible rest, opened the mouth, and stretched the tongue to fully expose the tongue surface. The tongue body was relaxed, and the tongue surface was flat and stretched.
Before pulse data collection, the subjects were required to ensure that they did not stay up late, and did not drink strong tea or coffee. The subjects were breathing calmly, sitting upright, with the upper arms relaxed, and the elbows bent about 120°. The forearms were naturally flat, the wrists were placed on the pulse pillow, and the palms were facing up. The PDA-1 single-segment pulse detector was placed in the sampler where the subject's pulse was most obvious, and it could automatically collect a single-part pulse diagram with a stable waveform of 30 s.
Tongue and pulse data analysis method
Tongue data were analyzed using the Tongue Diagnosis Analysis System (TDAS) developed by the same team. The data of tongue images were selected from the indexes of the CIE-Lab color space. Tongue body L value (TB-L) and tongue coating L value (TC-L) represented the lightness of 0–100, indicating the range from pure black to pure white. Tongue body a value (TB-a) and tongue coating a value (TC-a) represented the green-red axis, while the positive a represented red, and the negative a represented green. Tongue body b value (TB-b) and tongue coating b value (TC-b) represented the blue-yellow axis, while the positive b represented yellow, and the negative b represented blue. 18 Pulse data were analyzed by the pulse classification standard in “Modern TCM Pulse Diagnosis.” 21 The specific parameters are defined in Supplemental Table 1.
Variable selection
Variable selection plays a critical role in machine learning and hence is used in model-building for simplifying, facilitating interpretation, and eliminating redundant variables. 22 The present study used Propensity Score Matching (PSM) 23 to accurately match the experimental and control groups’ age variables and eliminate selection bias. The minor absolute shrinkage and selection operator Least Absolute Shrinkage and Selection Operator (LASSO) regression 24 was used for variable screening in this study; nonetheless, the sample size was small.
Statistical analysis
SPSS 26.0 software was used for statistical analysis. Continuous data with normal distribution were presented as mean ± standard deviation (SD), and those with abnormal distribution were represented as the median and interquartile range (IQR). IQR was equal to the third quartile minus the first quartile. The comparisons between groups were conducted using a t-test or Mann–Whitney U-test for continuous variables. In this study, the accuracy of the proposed prediction models was calculated using the area under the receiver operating characteristic curve (AUROC). Then, the accuracy, sensitivity, and specificity were calculated. The DeLong test was performed to examine the differences between the ROC curves of various machine learning classifiers. The area under the curve (AUC) was directly compared in a pairwise approach using paired DeLong test. 25 P < 0.05 (two-tailed) indicated a statistically significant difference in the comparisons when the inspection level was α = 0.05. A calibration curve was used to evaluate the model performance. In addition, decision curve analysis (DCA) was used to assess the clinical benefit of the models. It was a suitable method for evaluating alternative diagnostic and prognostic strategies that exhibited advantages over other commonly used measures and techniques. 26
Machine learning approach
In this study, three machine learning classification algorithms were used to establish a PCOS risk prediction model: Multilayer Perceptron (MLP) classifier, eXtreme Gradient Boosting (XGBoost) classifier, and Support Vector Machine (SVM). Each algorithm incorporates tongue and pulse parameters to build models and make two-class predictions, respectively. MLP is a feedforward artificial neural network consisting of three layers: an input layer, one or more hidden layers, and an output layer. 27 XGBoost is an implementation of gradient boosting decision trees focused on computational speed and model performance. It achieves the best results by adding multiple decision trees. 28 SVM is a supervised machine learning algorithm which proves simpler in structure and offers global optimality and good generalization; hence, it has been widely applied in classification.29–31 The selection of patients’ tongue and pulse feature parameters and model classification are shown in Figure 1. All machine learning processes were carried out using Python 3.7.

Overall flowchart.
Results
Baseline statistics
The dataset included 486 subjects (285 PCOS patients and 201 healthy women) aged 20–44 years. The height, weight, BMI, and age of women in the healthy group and the PCOS group do not conform to the normal distribution, so the relevant data are represented by median (IQR). The height of the subjects in the healthy group was 1.640 m (0.080), the height of the subjects in the PCOS group was 1.620 (0.030) m; the weight of the subjects in the healthy group was 61.000 (9.200) kg, the weight of the subjects in the PCOS group was 62.100 (8.800) kg; the BMI of the subjects in the healthy group was 22 .684 (2.534) kg/m2, PCOS group subjects BMI was 24.221 (2.384) kg/m2. There were differences in height, weight, and BMI between the two groups of subjects (P < 0.05). In addition, the age of subjects in the healthy group was 28.000 (5.000) years old, and the age of subjects in the PCOS group was 31.000 (6.000) years old. There was a statistical difference in age between the two groups (P < 0.05). The baseline characteristics of the included subjects are listed in Table 1.
Original baseline characteristics in the dataset.

PCOS: polycystic ovary syndrome; IQR: interquartile range; BMI: body mass index.
In order to exclude the interference of age differences in this study, we used PSM to take the occurrence of PCOS as the outcome, together with the age of the two groups of subjects as the scoring item in a ratio of 1:1. The corrected baseline data was obtained after accurate matching. After PSM matching, the age of the subjects in the healthy group was 28.000 (5.000) years old, and the age of the subjects in the PCOS group was 28.000 (5.000) years old. There was no statistical difference in the ages of the two groups of subjects (P > 0.05), which met the research requirements. After matching, the height of the subjects in the healthy group was 1.640 (0.080) m, the height of the subjects in the PCOS group was 1.620 (0.030) m; the weight of the subjects in the healthy group was 61.000 (9.200) kg, and the weight of the subjects in the PCOS group was 62.400 (7.900) kg; The BMI of the subjects in the PCOS group was 22.684 (2.534) kg/m2, and the BMI of the subjects in the PCOS group was 24.221 (2.360) kg/m2. There were still differences in height, weight, and BMI between the two groups (P < 0.05). The baseline data of the two groups after matching are shown in Table 2.
Baseline characteristics after correction in the dataset.

PCOS: polycystic ovary syndrome; IQR: interquartile range; BMI: body mass index.
Data analysis of tongue and pulse
The tongue and pulse data of women in the healthy group and the PCOS group do not conform to the normal distribution, so the relevant data are represented by the median (IQR). The clinical tongue and pulse data of the subjects are shown in Table 3. It can be seen from Table 3 that in terms of tongue coating in the PCOS group: the TC-L value and TC-a value were significantly lower than those of the healthy group. PCOS group's TC-b value was significantly higher than that of the healthy group. In terms of tongue quality in the PCOS group: the TB-L value and The TB-a value were significantly lower than those of the healthy group. The TB-b value of the PCOS group was significantly higher than that of the healthy group. The differences in the above tongue data were statistically significant (P < 0.05). In addition, in terms of pulse data, t1/t, h4/h1 in the PCOS group were significantly higher than those in the healthy group, and h1/t1, h3/h1, t, t4, t5, h1, h3, h4, and h5 were significantly lower than those in the healthy group. Also, significant differences were detected in the above pulse data (P < 0.05).
Statistical analysis of tongue and pulse indexes.
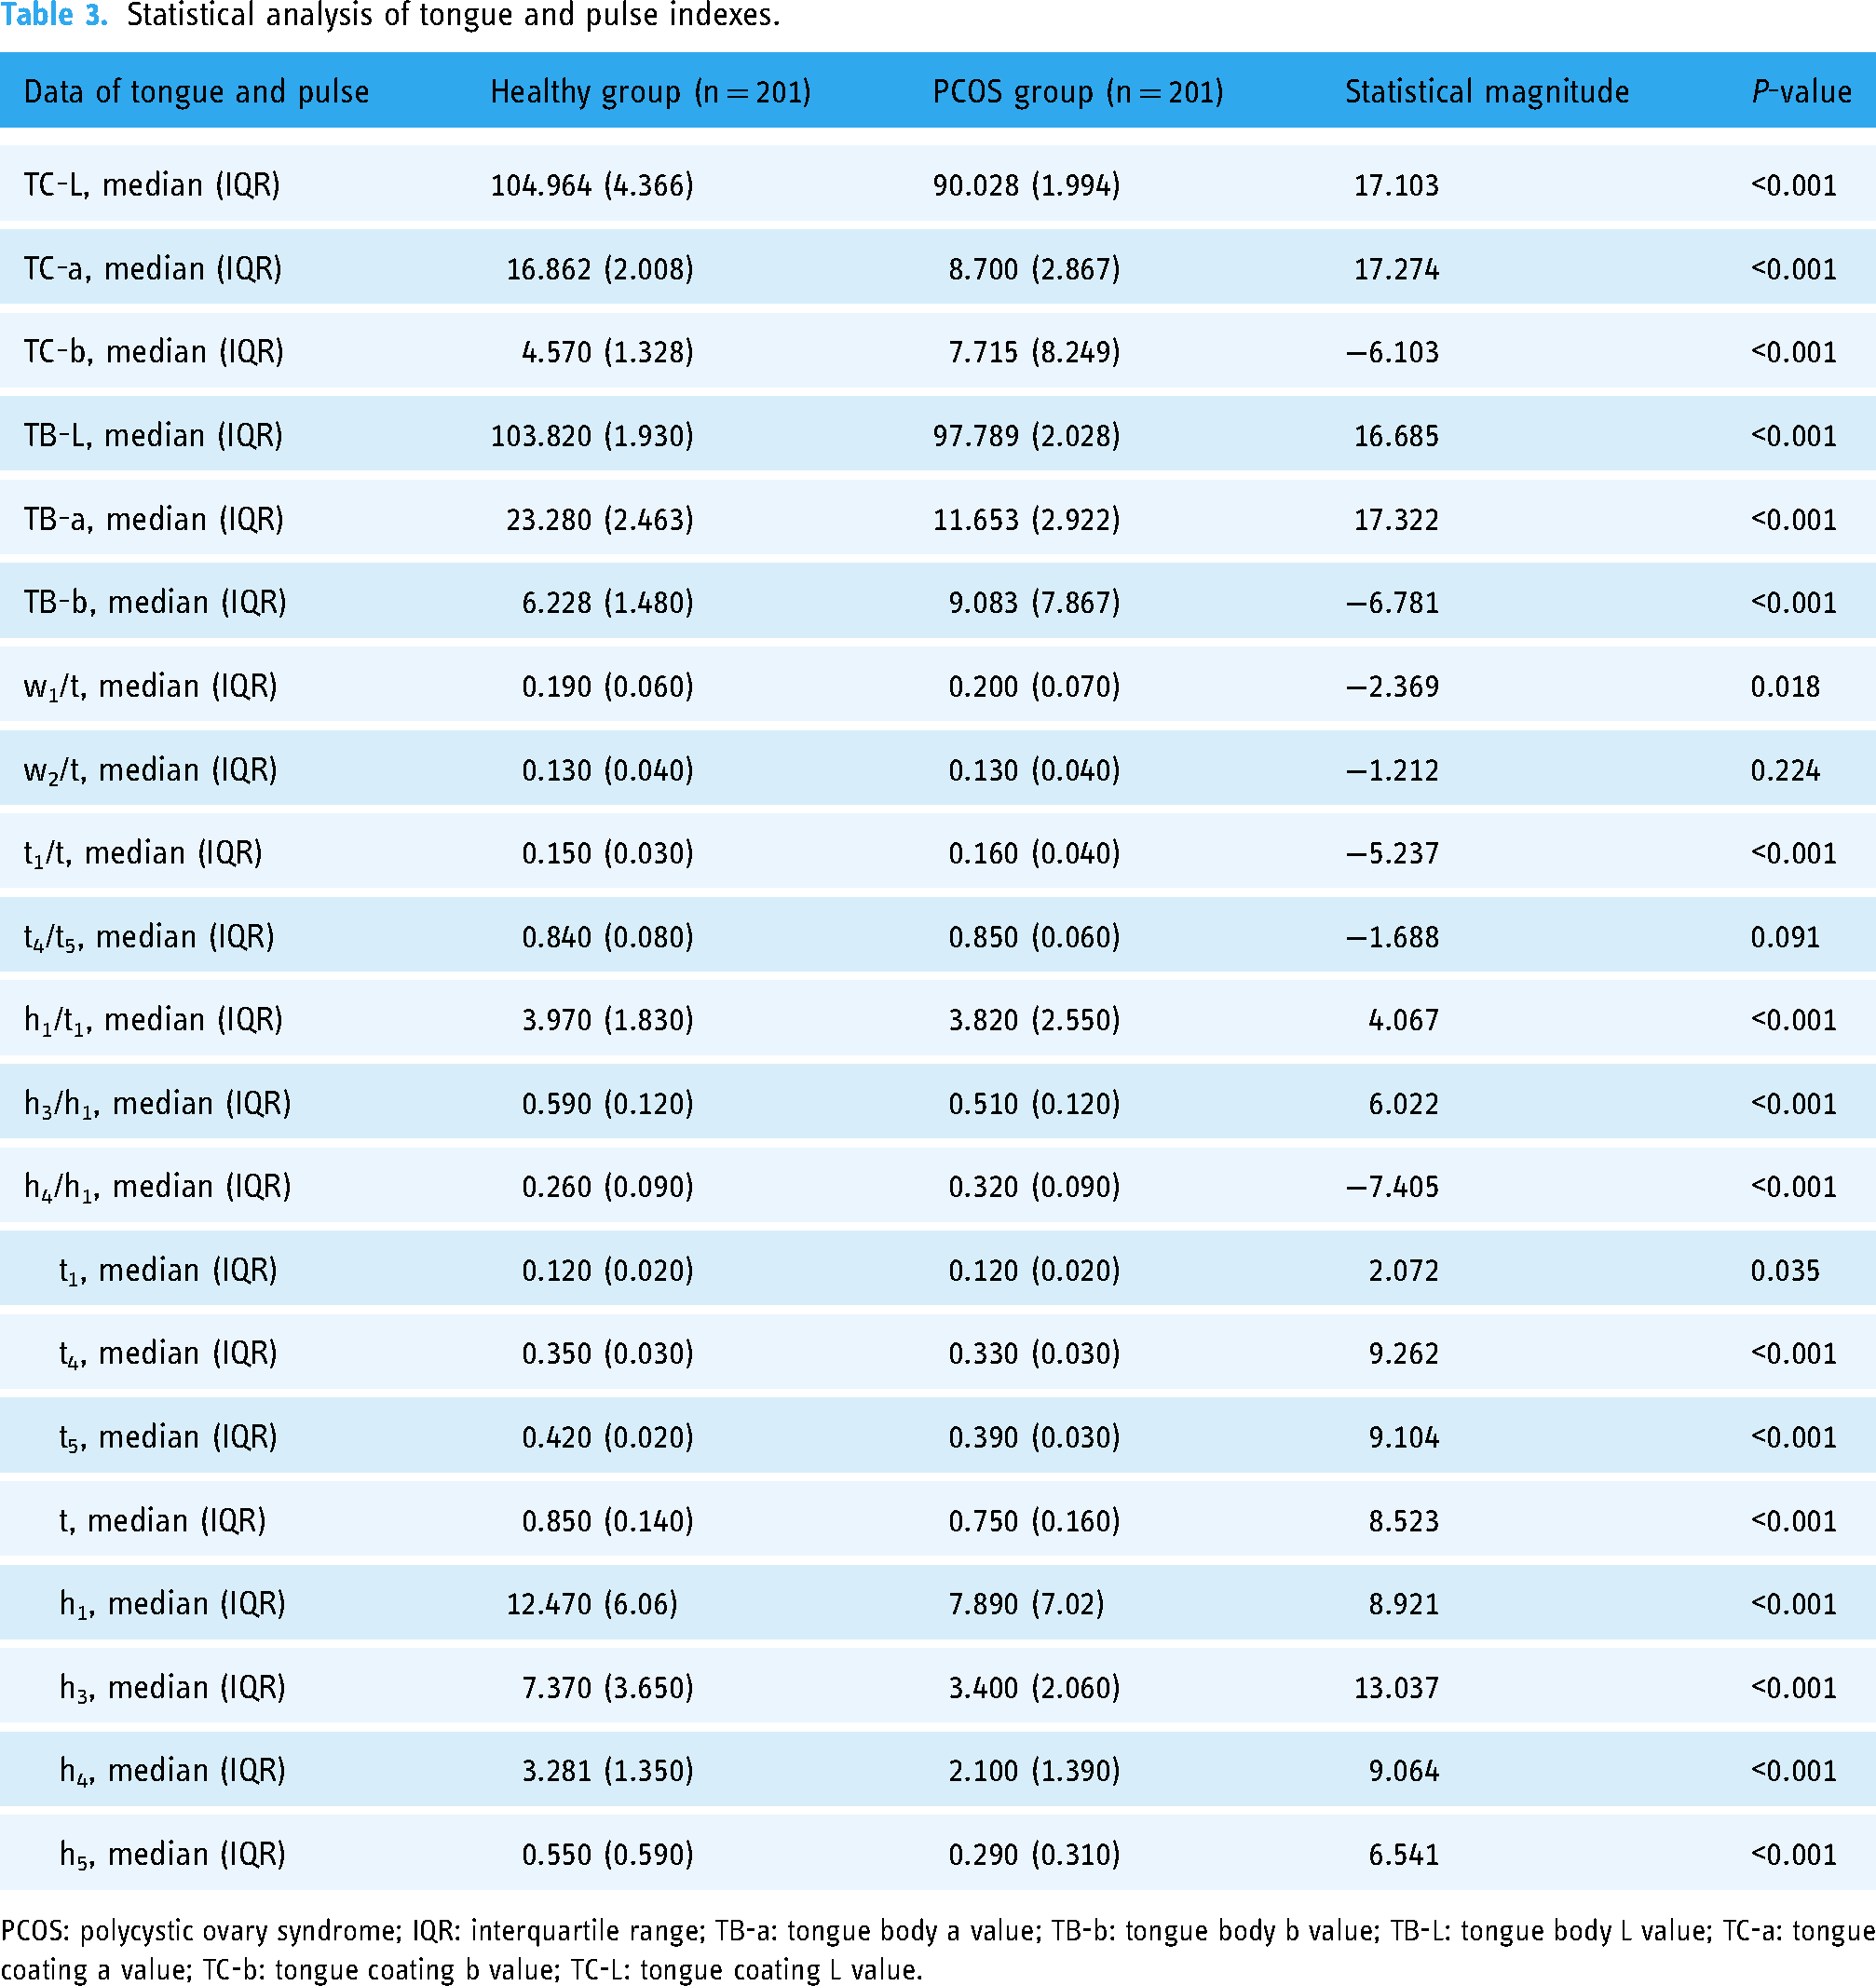
PCOS: polycystic ovary syndrome; IQR: interquartile range; TB-a: tongue body a value; TB-b: tongue body b value; TB-L: tongue body L value; TC-a: tongue coating a value; TC-b: tongue coating b value; TC-L: tongue coating L value.
Variable filter
The “Glmnet” package (version 4.1.2) was applied to fit the logistic LASSO regression. Feature selection was performed using Lasso, and the Lasso model's tuning parameter (λ) was selected by a minimum criterion using 10-fold cross-validation. BMI, tongue data, and pulse data were included in the variable selection dataset. AUROC versus log(λ) was plotted. Vertical dashed lines were drawn at the optimal values with the logarithm λ of the minimum mean squared error and the logarithm λ of the standard error of the minimum distance (Figure 2A and B). According to 10-fold cross-validation, the λ of the minimum mean squared error was 0.006, and the variable selection of the corresponding model was TB-L + TB-a + TB-b + TC-L + TC-a + h3 + h4/h1. Thus, a PCOS risk prediction model was established using these seven variables as independent factors.

Tongue and pulse features selection using the LASSO binary logistic regression model. (A) The LASSO model's tuning parameter (λ) was chosen to satisfy the minimum criteria using ten-fold cross-validation. The AUC curve versus log(λ) was plotted. The two vertical dashed lines in the graph represent the logarithm λ of the minimum mean squared error (left dashed line, λ = 0.006) and the logarithm λ of the standard error of the minimum distance (right dashed line, λ = 0.02). (B) LASSO coefficient profiles of the 21 tongue and pulse features and BMI baseline characteristics. A coefficient profile plot was produced against the log(λ) sequence. A vertical line was drawn at the value selected using the minimum mean squared error, where optimal λ resulted in seven nonzero coefficients.
Machine learning model evaluation
In the PCOS and healthy female subgroups, the characteristic parameters of tongue and pulse data obtained by screening were used to establish a PCOS prediction model based on four machine learning classifiers: MLP, XGBoost, and SVM. The ROC mean and SD of each model were calculated by repeated sampling; the selection was ten times. The validation set of each resampling training accounted for 20% of the total sample, and the training set accounted for 80%, indicating that each group was selected as the test set in turn to ensure that the evaluation results were not accidental. Then, the ten evaluation results were averaged to reduce the errors due to unreasonable choices in the test set. The DeLong test was performed to examine the differences between the ROC curves of different machine learning classifiers, and its clinical application was explored by DCA.
The parameters of the MLP classifier model were as follows: activation selected relu, the hidden layer width was (12, 12), and the number of iterations was 100. The specific parameters of the XGBoost classifier model were as follows: the optimized objective function was binary logistic, the learning rate was 0.002, the max depth was 10, the minimum child weight was 10, and the regularized coefficient was 1. The SVM model parameters were as follows: the regularization factor was 0.1, the kernel type was sigmoid, and the convergence metric was set to 0.01. The training and test set results of the four model classifications are summarized in Tables 4 and 5.
Summary of the training set results of multiple model classifications.

AUC: area under the curve; SD: standard deviation; SVM: support vector machine; XGBoost: eXtreme gradient boosting; MLP: multi-layer perceptron.
Summary of the validation set results of multiple model classifications.
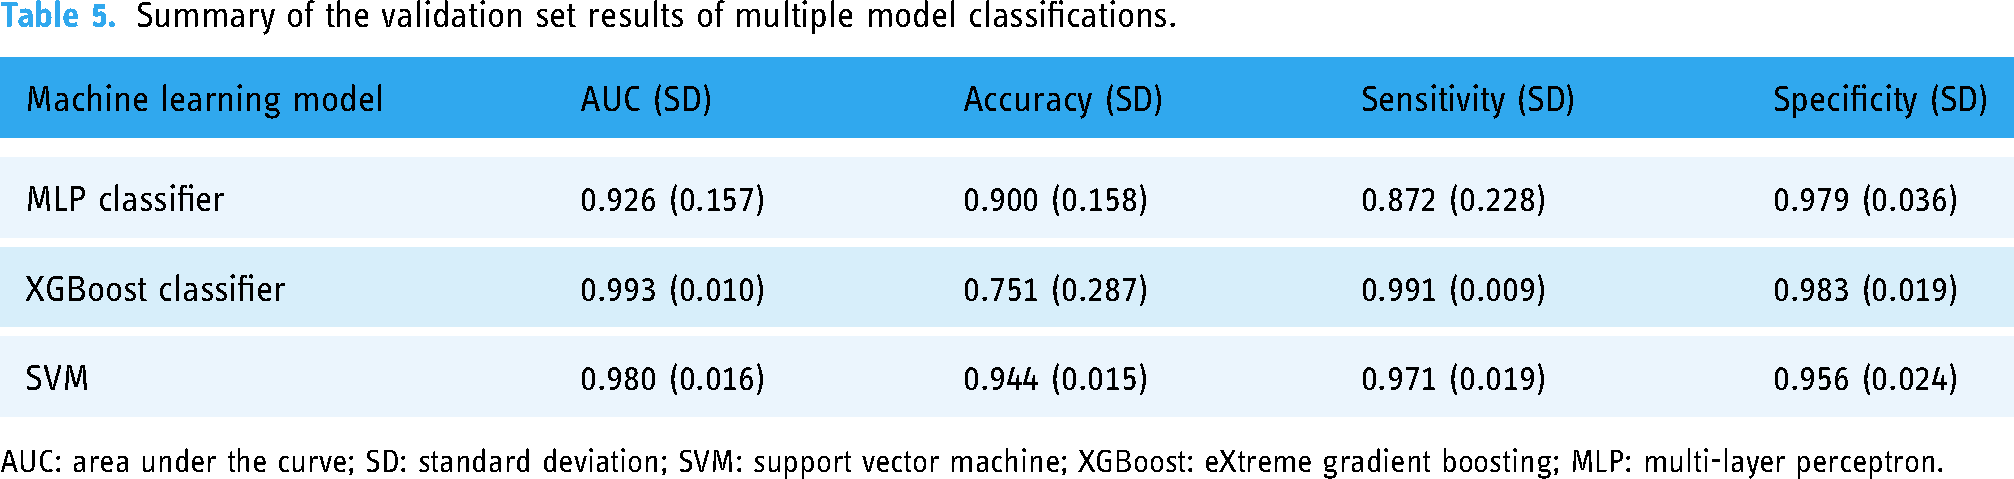
AUC: area under the curve; SD: standard deviation; SVM: support vector machine; XGBoost: eXtreme gradient boosting; MLP: multi-layer perceptron.
The machine learning ROC curve graphs are shown in Figures 3 and 4. The AUCs of the three machine learning models were > 0.9, indicating high predictive values. Then, the DeLong test was performed on the ROC curves of the three machine learning methods. The results showed no statistically significant differences between the ROC curves of the above machine learning models (P > 0.05) (Table 6). The calibration curves for the validation sets of multiple models (Figure 5) showed that, except for the XGBoost model, the predicted probabilities of the other machine classification models were close to the true probabilities. Moreover, the SVM model was closer to the reference value of the diagonal. Subsequently, we used DCA to assess whether the model could guide the net gain of the validation cohort. The DCA curve of the validation set is illustrated in Figure 6. The SVM model had significant utility in clinical decision-making in the entire validation cohort. Taken together, SVM is considered the best model choice for this dataset.

Receiver operating characteristic (ROC) curve for multiple model classifications of the training set.
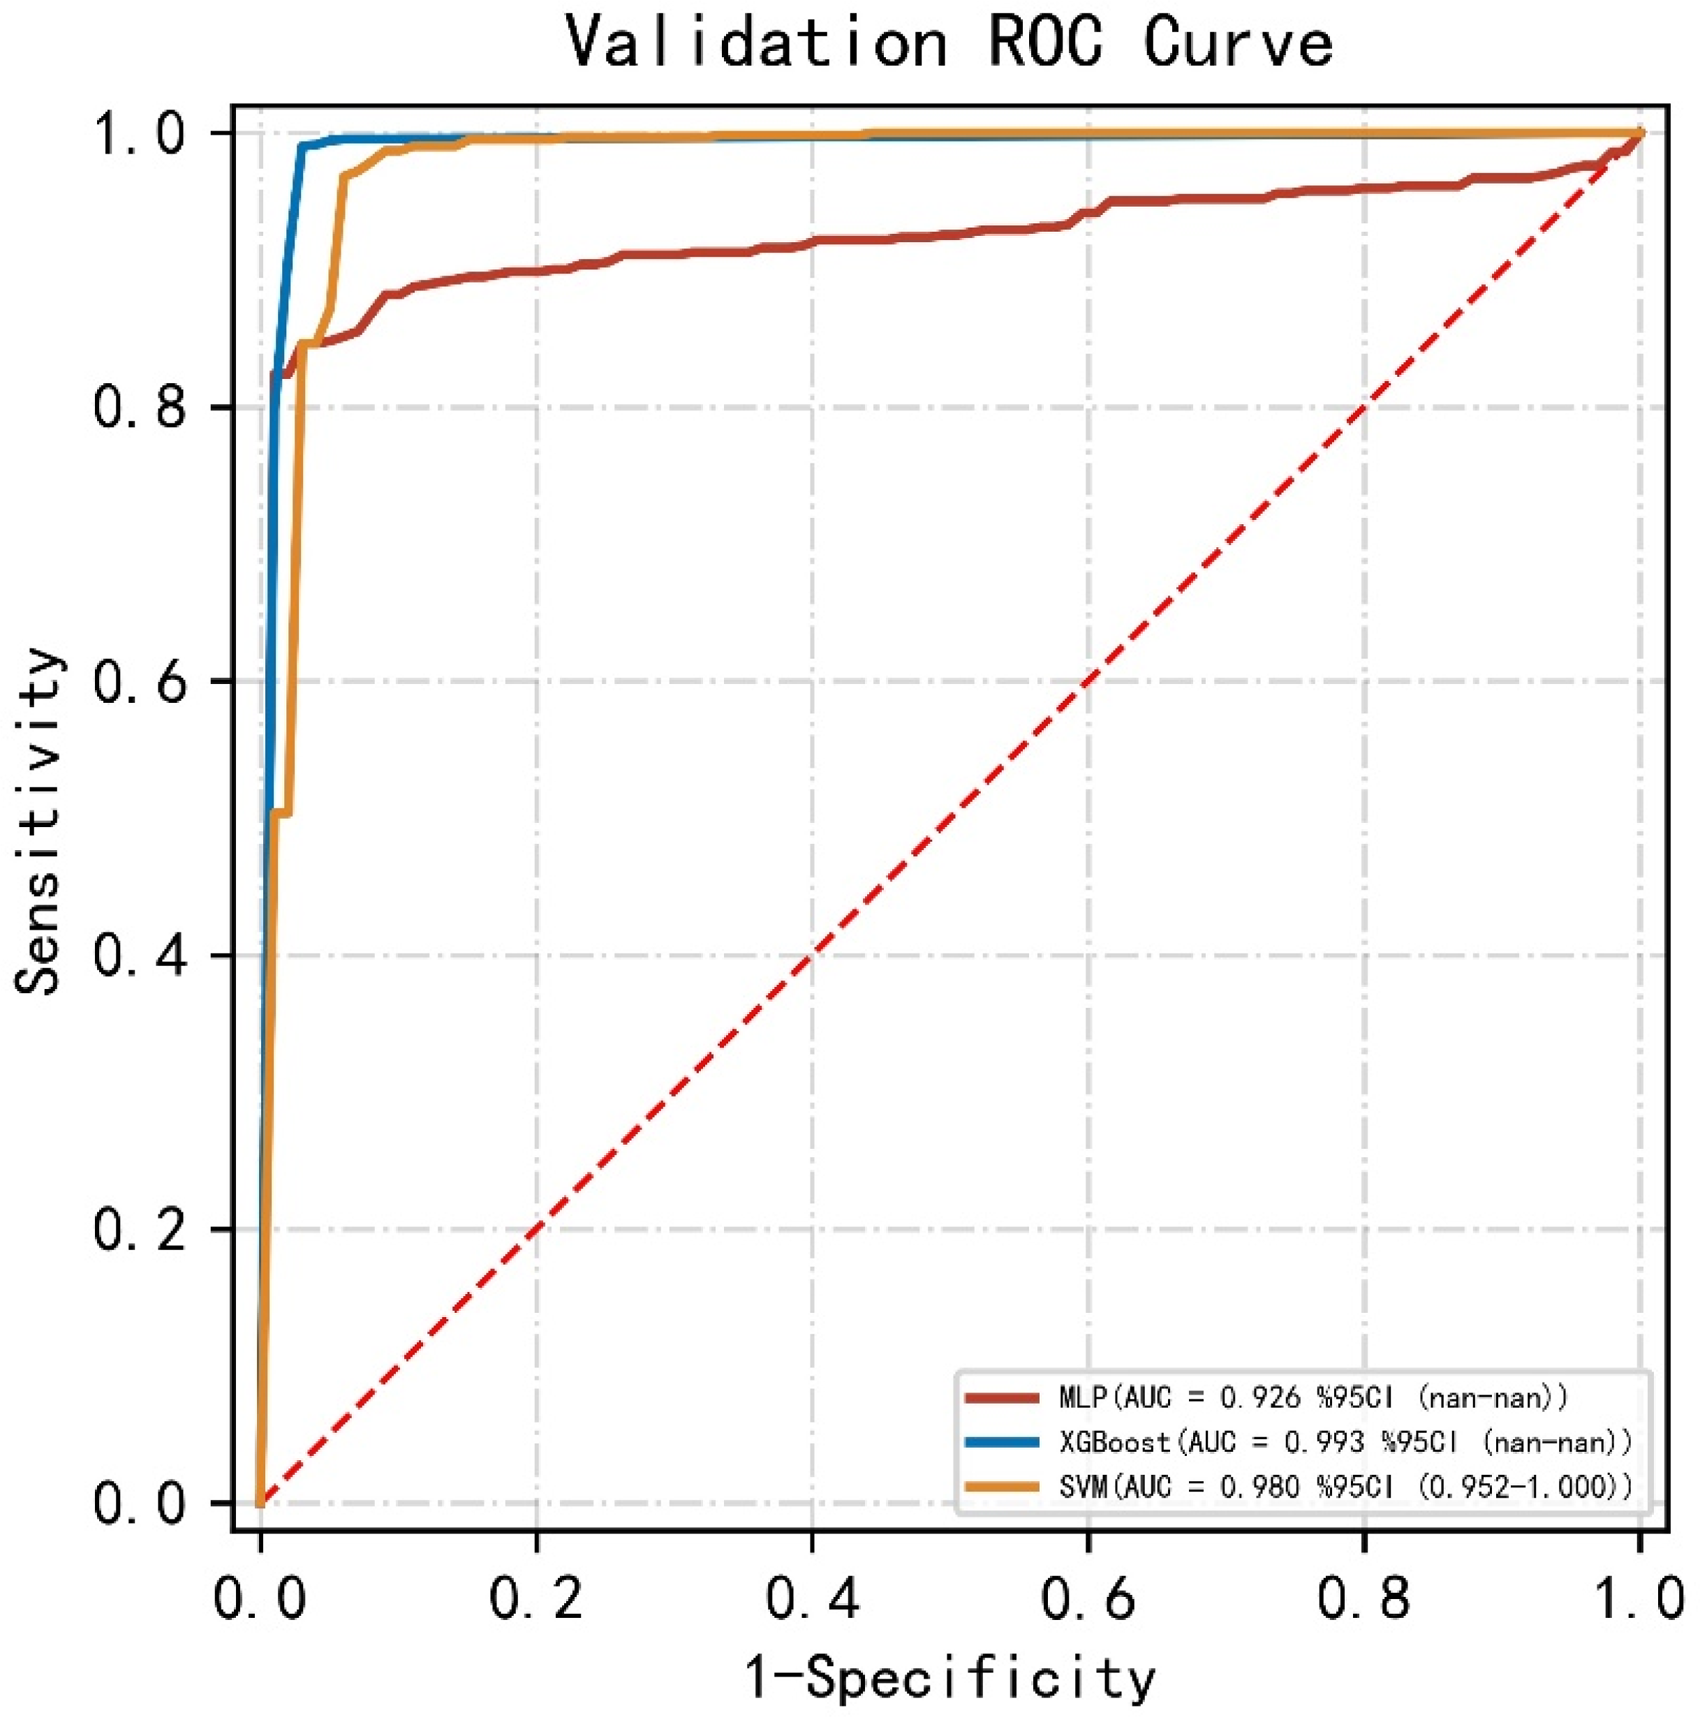
Receiver operating characteristic (ROC) curve for multiple model classifications of the validation set.
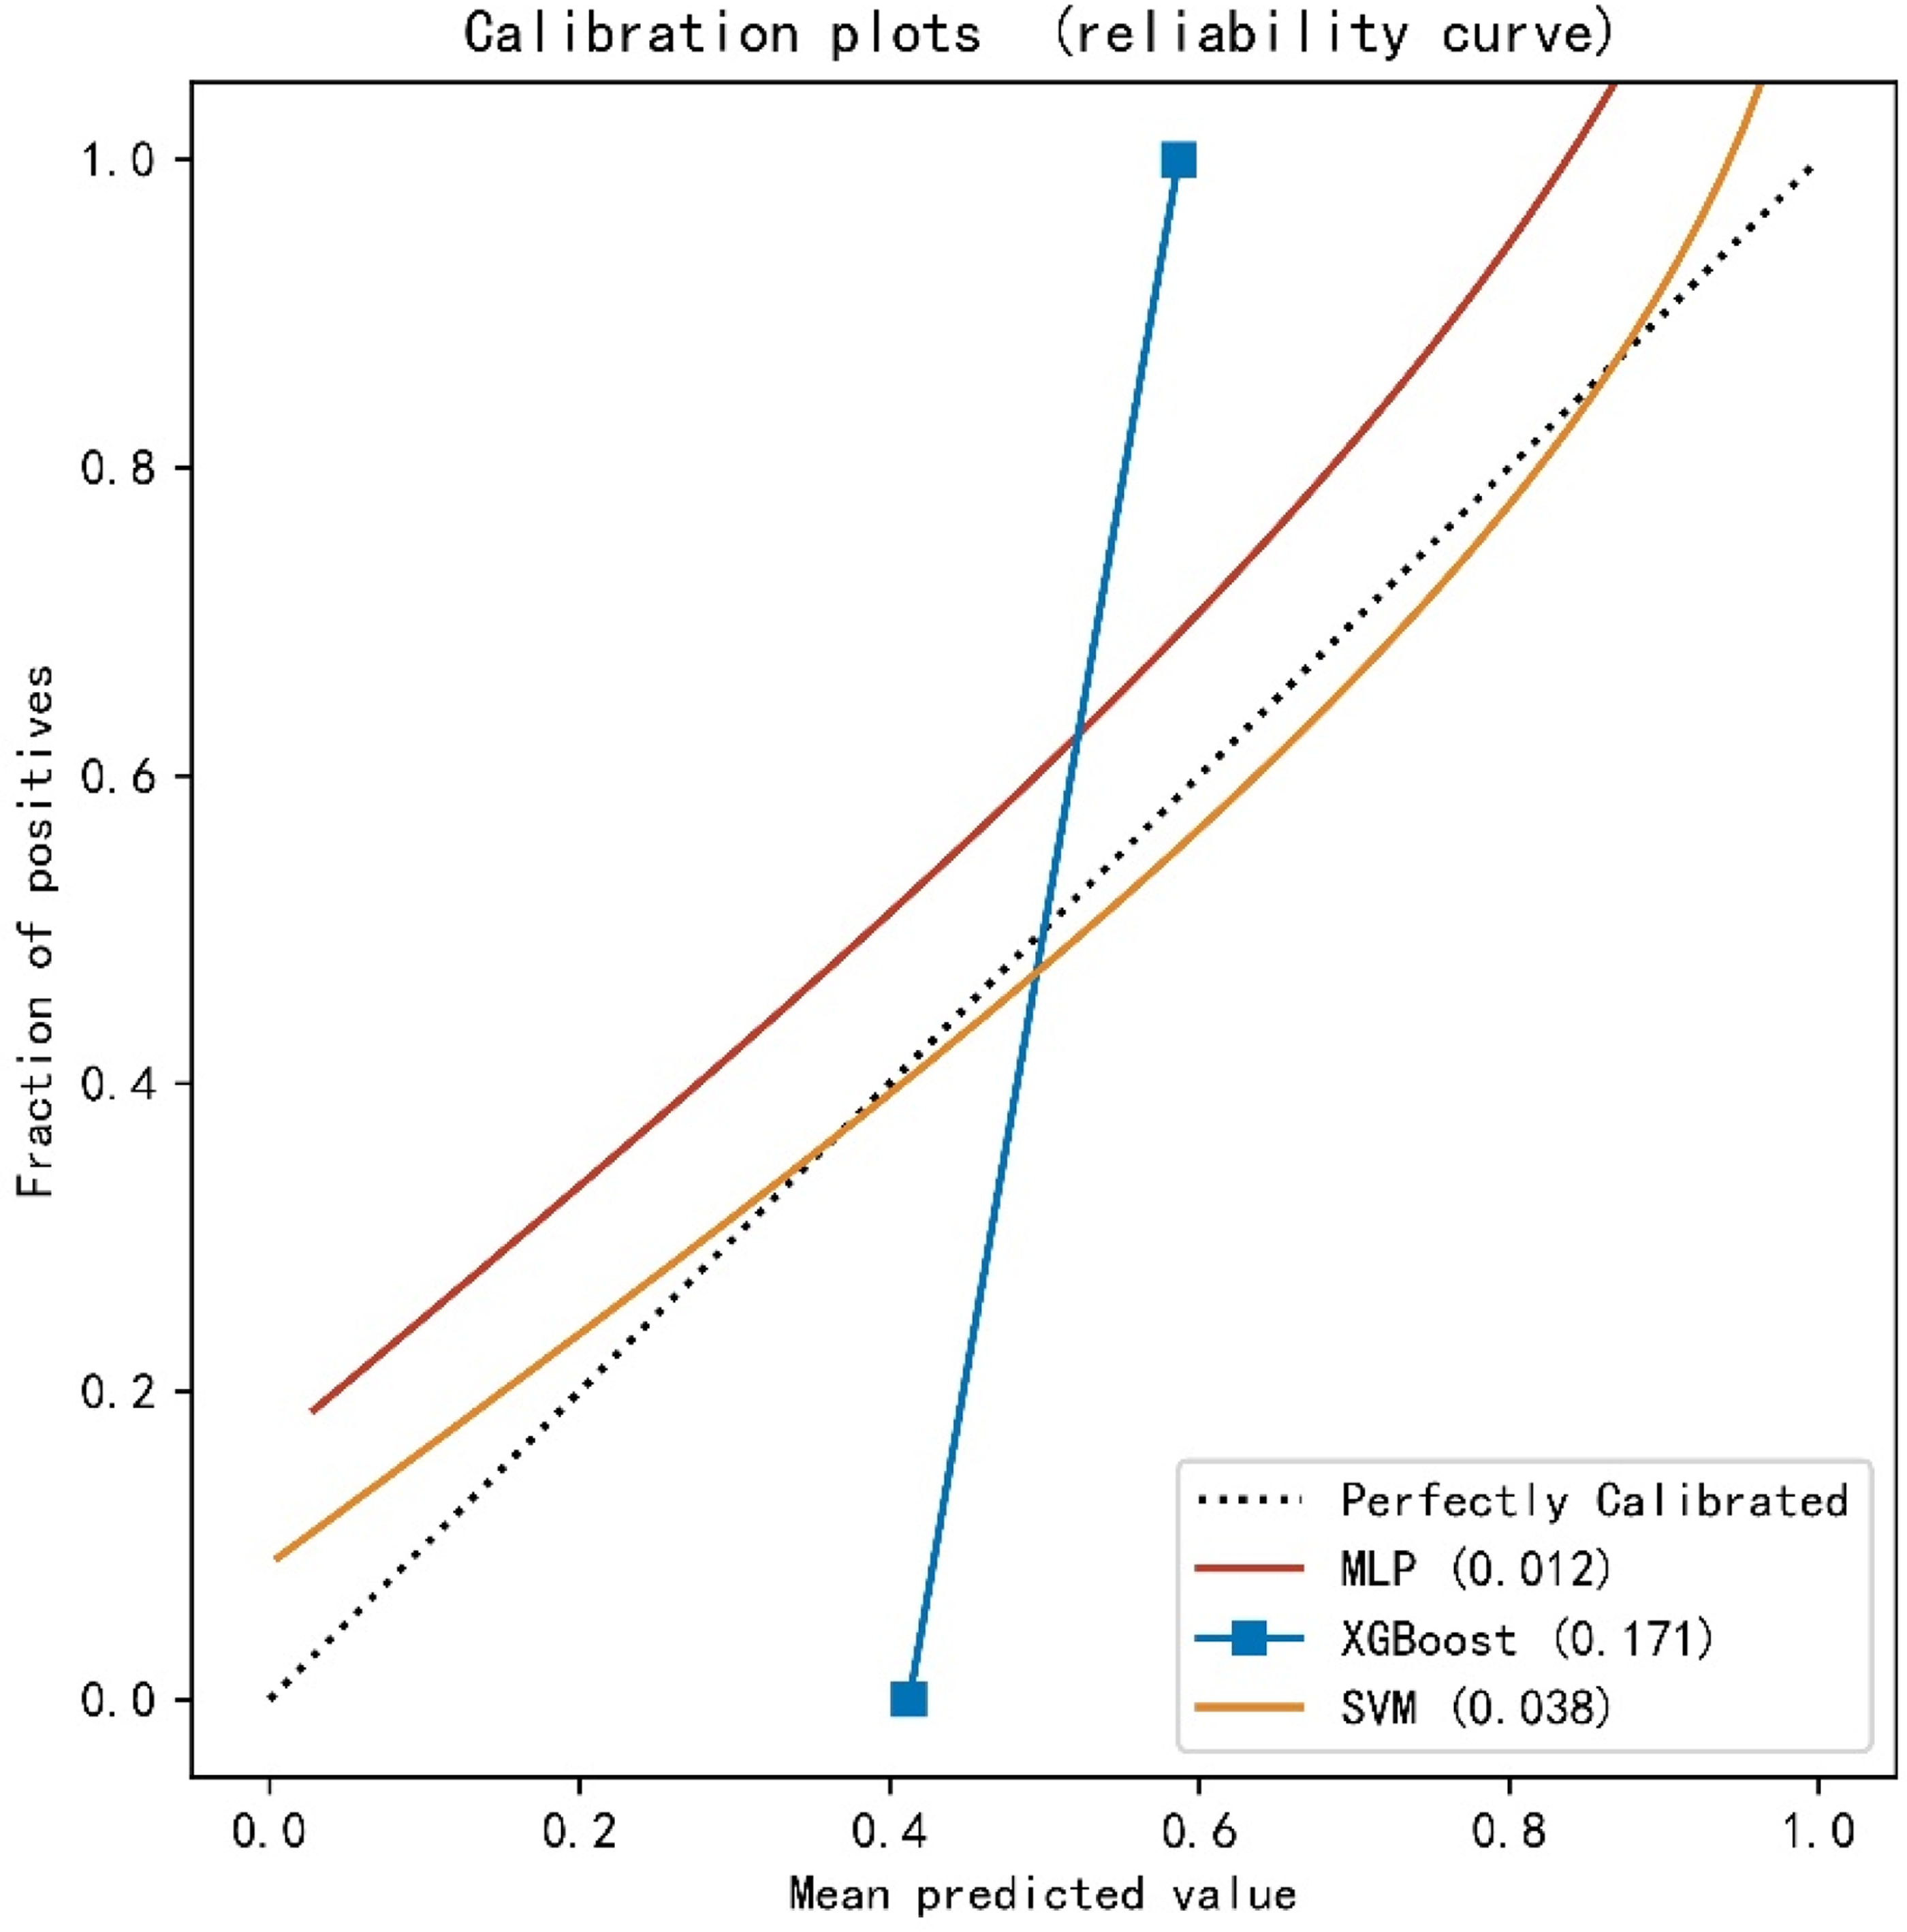
Calibration curves for the validation sets of multiple models.

Decision curve analysis (DCA) on the validation set.
Delong detection results for multiple model classification.

SVM: support vector machine; XGBoost: eXtreme gradient boosting; MLP: multi-layer perceptron.
Discussion
PCOS is a common gynecological endocrine disease that severely affects the quality of life of patients. Although ultrasound and serum biochemical tests can be used to diagnose some types of polycystic diseases according to the Rotterdam guidelines, 20 these were operator- and woman's menstrual cycle-dependent methods. Ultrasound cannot reliably detect polycystic ovary morphology in patients with type B PCOS. 32 Furthermore, it is difficult to ensure that all patients receive daytime serology in high-dose screening. Also, the asynchrony in time and cost of ultrasound and serum biochemical assays greatly diminishes their clinical application value.
Tongue and pulse diagnoses in TCM are simple and direct methods to obtain clinical diagnosis and treatment information. Also, these are noninvasive techniques to detect the disease, determine disease severity, and evaluate treatment effects. In recent years, the rapid development of computer technology has facilitated various machine-learning methods in medical research. Using machine learning models to predict and classify the objective information of TCM diagnosis is beneficial to the development of artificial intelligence for TCM diagnosis.33–35 Hence, we conducted a series of studies on this aspect. Tongue and pulse diagnoses are valuable in classifying and predicting nonalcoholic fatty liver disease, 36 type 2 diabetes,17,34 and hypertension.33,37 However, the TCM tongue-pulse diagnostic technique for diagnosing and predicting PCOS has not yet been reported. The present study aimed to establish a machine learning model based on lingual pulse characteristic parameters as a noninvasive method to predict the onset of PCOS.
We analyzed and documented the data of 285 PCOS patients and 201 healthy women. To minimize multicollinearity between tongue and pulse data and avoid overfitting, we applied LASSO regression to screen the variables. The results showed that seven characteristic parameters of tongue and pulse (TB-L, TB-a, TB-b, TC-L, TC-a, h3, and h4/h1) were closely related to PCOS occurrence. These features were added as independent factors to establish the PCOS prediction models.
CIE-Lab was selected as the color space for feature extraction from tongue imaging data. The most prominent feature of CIE-Lab is the smooth changes in color space, which defines all the colors that can be perceived by the human eye. The amount of spatial color shift in the CIE-Lab color space does not change with devices and is more valuable than the RGB color space in digital images for compensating for the lack of color space. 38
As shown in Figure 2, this study found that TB-L, TB-a, TB-b, TC-L, and TC-a were essential parameters of tongue characteristics to distinguish PCOS patients from healthy women. The tongue colors of TB-L and TC-L were lesser in the PCOS group than in the healthy group (P < 0.05), suggesting that the colors of the tongue body and tongue coating of the PCOS patients were darker. According to the TCM theory, these results indicated that the tongue of healthy women is moister and brighter than that of PCOS patients, indicating that the qi and blood circulation of PCOS patients are not as smooth as that of healthy individuals. The TB-a and TC-a values of the tongue coating in the PCOS group were lower than those in the healthy group (P < 0.05), indicating that the tongue body and tongue coating in the PCOS group were not as high as the red value in the healthy group. The tongue consists of blood vessels and nerves. The tongue of a healthy person is full of blood, and hence, the color of the front of the tongue is reddish, implying that the blood flow of the tongue of patients with PCOS is not as smooth as that of healthy people, and the tongue's color reflects the lower value of red color. These findings also suggested that the tongue coating in the PCOS group is thick, and the color exposure of the tongue is not apparent. The TB-b value of the tongue coating in the PCOS group was higher than that in the healthy group (P < 0.05), indicating that the tongue body of PCOS women was yellower than that of healthy women. The indicators of tongue yellowness in PCOS patients may be influenced by their thick tongue coating color. The tongue coating results from a mixture of bacteria and food residues with the tongue mucosa and the elongated stratum corneum of the hyperkeratinized epithelium. 39 Hsieh et al. 14 proposed that the yellow color of the tongue coating is due to the yellowish appearance of sulfur compounds, such as dimethyl disulfide, dimethyl trisulfide, and 2,4-dithiopentane. 40 Thus, it can thus be suggested that sulfide concentrations in the oral cavity of PCOS were higher than those in healthy women.
In addition, h3 and h4/h1, the characteristic indicators of pulse condition, were also included in the analysis of the machine learning model. The h3 value means heavy wavefront wave amplitude and reflects arterial elasticity. These findings indicated that PCOS has a lower h3 value than healthy women. The weakening of arterial elasticity is due to the gradual deposition of excessive lipids in the blood, forming plaques in the arterial intima. Newman et al. 41 showed that women with PCOS disease often exhibit an atherogenic lipid profile characterized by increased triglycerides, low high-density lipoprotein cholesterol, and standard or increased low-density lipoprotein cholesterol, which is consistent with our findings. The h4/h1 mainly reflects the level of peripheral resistance. The h4/h1 value of pulse in the PCOS group was higher than that in the healthy group, suggesting that resistance to peripheral vascular contraction increased in patients with PCOS. Interestingly, increased peripheral resistance restricts the aortic blood flow to the periphery. Hence, the blood remains in the arterial blood vessels, and the pressure on the blood vessel wall increases, resulting in significantly increased diastolic blood pressure. Our findings demonstrated that individuals with PCOS are more at risk of high blood pressure than healthy people. This finding is consistent with that of previous studies, wherein women with PCOS were more hypertensive and frequently used antihypertensive medication than the controls. 42
Machine learning is an implementation method of artificial intelligence and a major research direction in life sciences. In this study, three algorithms, MLP classifier, XGBoost classifier, and SVM, were used for classification modeling. Combined with AUROC, DeLong test, and DCA curve evaluation, the SVM prediction model has the best classification effect and net income. It is a novel and applicable few-shot learning method with a solid theoretical foundation. Also, it is not sensitive to outliers and can help us capture critical samples. The advantage of the method is the simple algorithm and robustness. Herein, we focused on the AUROC obtained by these predictive models and compared the DCA curves of different models. In addition to the diagnostic accuracy of the predictive model, we also considered the clinical utility of a specific model. Therefore, the obtained optimal model fulfills the clinical needs and is suitable for clinical decision-making.
Conclusion
Machine learning techniques can estimate the risk of PCOS with high accuracy. These methods provide physicians with a convenient and noninvasive method for screening and diagnosing PCOS patients. TB-L, TB-a, TB-b, TC-L, and TC-a in tongue parameters and h3, h4/h1 in pulse parameters are closely related to PCOS occurrence. This study evaluated the performance of the MLP classifier, XGBoost classifier, and SVM methods in identifying PCOS occurrence. Taken together, the SVM model shows the best performance. Therefore, we speculated that the machine learning classification model based on tongue and pulse data has glorious performance and can adequately predict PCOS risk. In the future, we will collect additional data and explore other machine learning algorithms to obtain PCOS risk prediction models with even higher prediction accuracy.
Supplemental Material
sj-pdf-1-dhj-10.1177_20552076231160323 - Supplemental material for A new model for predicting the occurrence of polycystic ovary syndrome: Based on data of tongue and pulse
Supplemental material, sj-pdf-1-dhj-10.1177_20552076231160323 for A new model for predicting the occurrence of polycystic ovary syndrome: Based on data of tongue and pulse by Weiying Wang, Weiwei Zeng, Shunli He, Yulin Shi, Xinmin Chen, Liping Tu, Bingyi Yang, Jiatuo Xu and Xiuqi Yin in Digital Health
Footnotes
Abbreviations
Acknowledgements
We would like to express our sincere thanks to the Science Committee of the National Natural Science Foundation of China for their financial support.
Author’s note
Copyright © 2023 Weiying Wang et al. This is an open-access article distributed under the Creative Commons Attribution License, which permits unrestricted use, distribution, and reproduction in any medium provided the original work is properly cited.
Contributorship
Investigation: Weiying Wang, Weiwei Zeng, Xinmin Chen. Methodology: Xiuqi Yin, Jiatuo Xu. Analysis: Liping Tu, Weiying Wang, Shunli He. Resources: Weiwei Zeng, Xiuqi Yin, Xiatuo Xu. Supervision: Liping Tu, Yulin Shi. Writing-original draft: Weiying Wang, Weiwei Zeng. Writing-review and editing: Weiying Wang, Weiwei Zeng, Yulin Shi, Xinmin Chen, Bingyi Yang. All authors have read and approved the manuscript.
Data availability
The datasets used and/or analyzed during the current study are available from the corresponding author upon reasonable request.
Declaration of conflicting interests
The author(s) declared no potential conflicts of interest with respect to the research, authorship, and/or publication of this article.
Ethics approval
This study was approved by the Medical Ethics Committee of Shuguang Hospital Affiliated to Shanghai University of TCM (authorization no. 2018-626-55-01) and was conducted in accordance with the Declaration of Helsinki.
Funding
The author(s) disclosed receipt of the following financial support for the research, authorship, and/or publication of this article: This work was supported by the National Natural Science Foundation of China (grant no. 82004398).
Guarantor
Yin Xiuqi and Xu Jiatuo.
Supplemental material
Supplemental Table 1: Indexes of pulse diagnosis and their corresponding clinical meaning (see ![]() ).
).
References
Supplementary Material
Please find the following supplemental material available below.
For Open Access articles published under a Creative Commons License, all supplemental material carries the same license as the article it is associated with.
For non-Open Access articles published, all supplemental material carries a non-exclusive license, and permission requests for re-use of supplemental material or any part of supplemental material shall be sent directly to the copyright owner as specified in the copyright notice associated with the article.